Page 1
Summary of Results for 2004 Virginia - Chesapeake
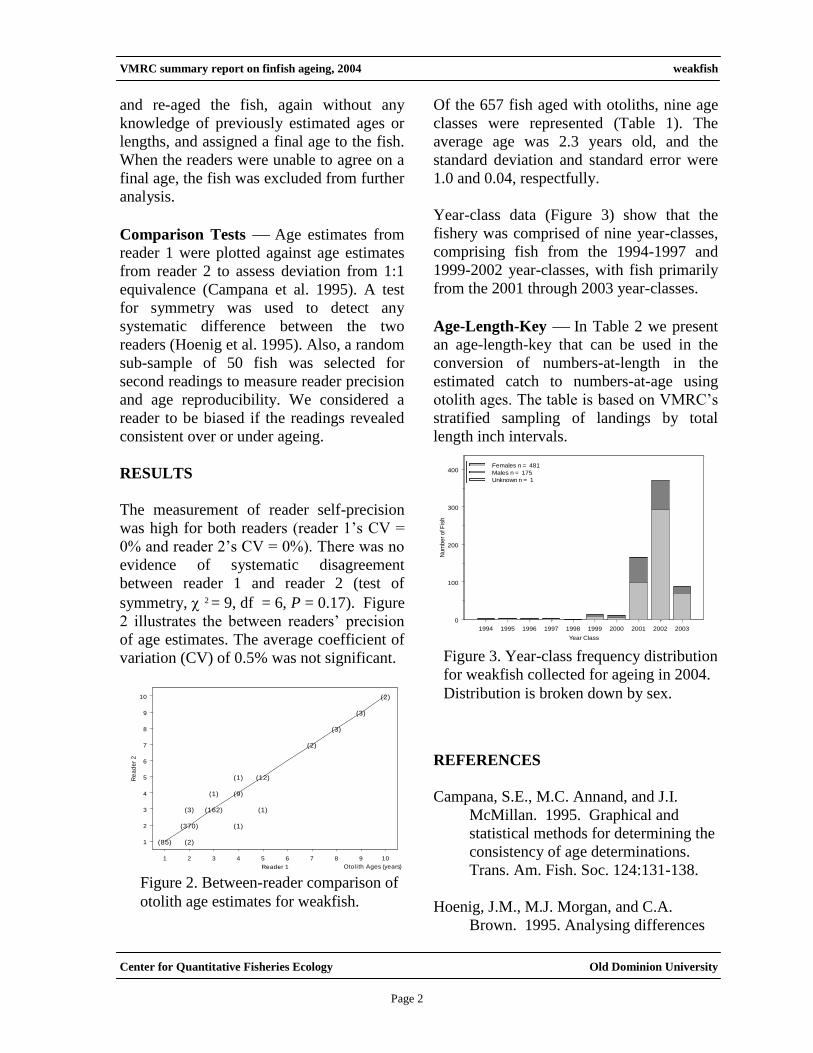
Bay Finfish Ageing
by
Eric M. Robillard, Cynthia M. Jones, and
Hongsheng Liao
VMRC/ODU Age and Growth Laboratory
Center for Quantitative Fisheries Ecology
Old Dominion University
Norfolk, VA 23529-0456
August 15, 2005
Page 2
Summary Report
Development and Support of Facilities to Provide
Finfish Ageing for Virginia Catches and
Application of Virtual Population Analysis to
Provide Management Advice
by
Eric M. Robillard, Cynthia M. Jones, and
Hongsheng Liao
VMRC/ODU Age and Growth Laboratory
Center for Quantitative Fisheries Ecology
Old Dominion University
August 15, 2005
Funded by contract No. F-126-R-2 from the Virginia Saltwater Recreational
Development Fund through the Virginia Marine Resources Commission
Page 3
VMRC summary report on finfish ageing, 2004
Center for Quantitative Fisheries Ecology Old Dominion University
Page i
Table of Contents Page
Executive Summary iii
Acknowledgements iv
Chapter 1 Atlantic Croaker Introduction 1
Methods 1
Results 2
Chapter 2 Black Drum Introduction 5
Methods 5
Results 6
Chapter 3 Bluefish Introduction 9
Methods 9
Results 10
Chapter 4 Cobia
Introduction 14
Methods 14
Results 15
Chapter 5 Red Drum Introduction 18
Methods 18
Results 19
Chapter 6 Spadefish
Introduction 22
Methods 22
Results 23
Page 4
VMRC summary report on finfish ageing, 2004
Center for Quantitative Fisheries Ecology Old Dominion University
Page ii
Table of Contents (continued) Page
Chapter 7 Spanish Mackerel Introduction 26
Methods 26
Results 28
Chapter 8 Spot Introduction 31
Methods 31
Results 32
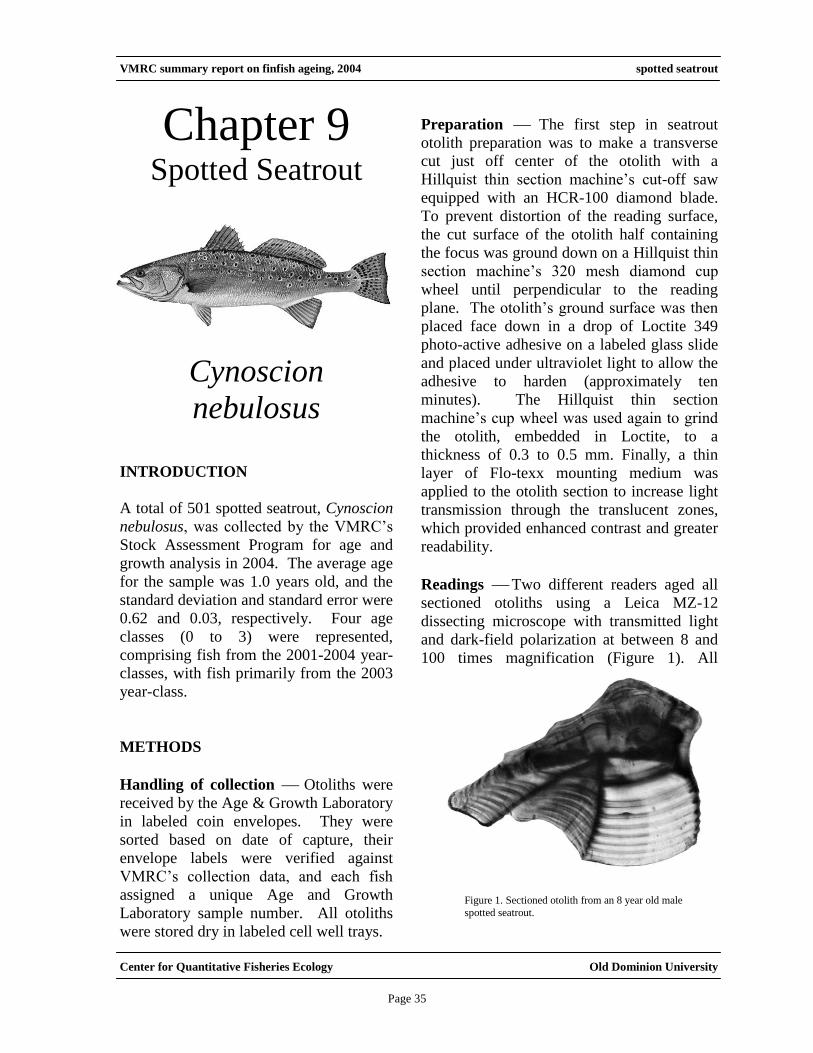
Chapter 9 Spotted Seatrout Introduction 35
Methods 35
Results 36
Chapter 10 Striped Bass Introduction 39
Methods 39
Results 42
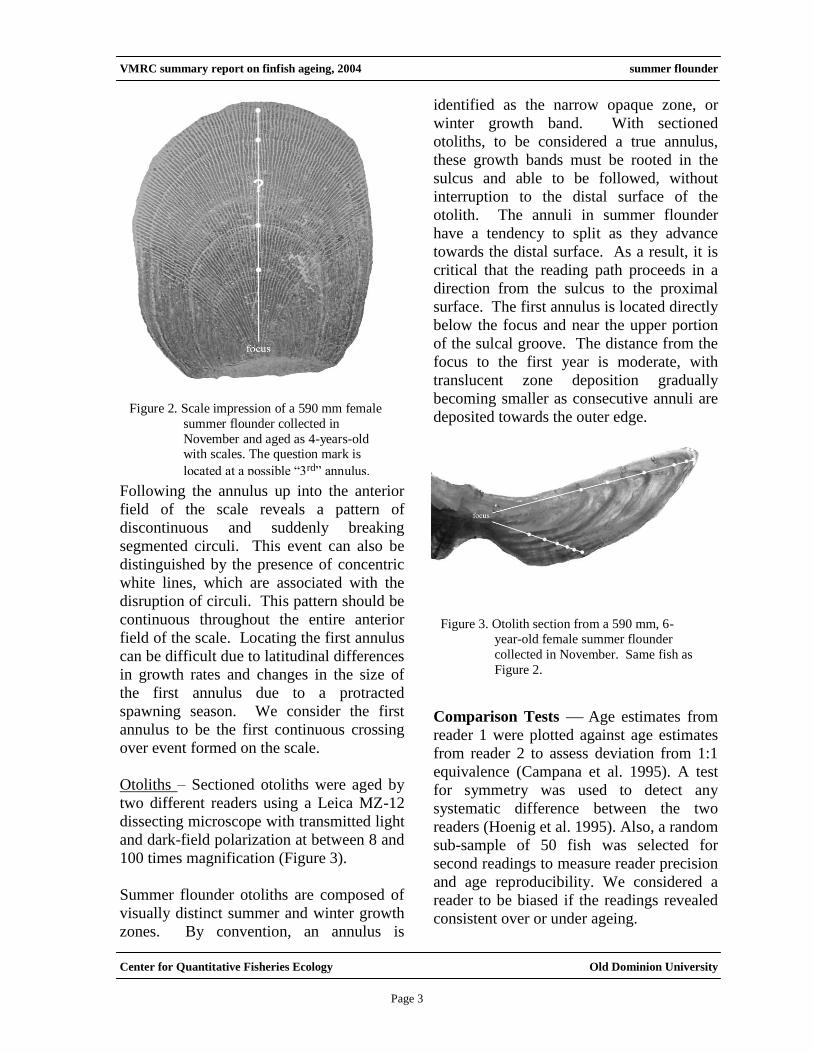
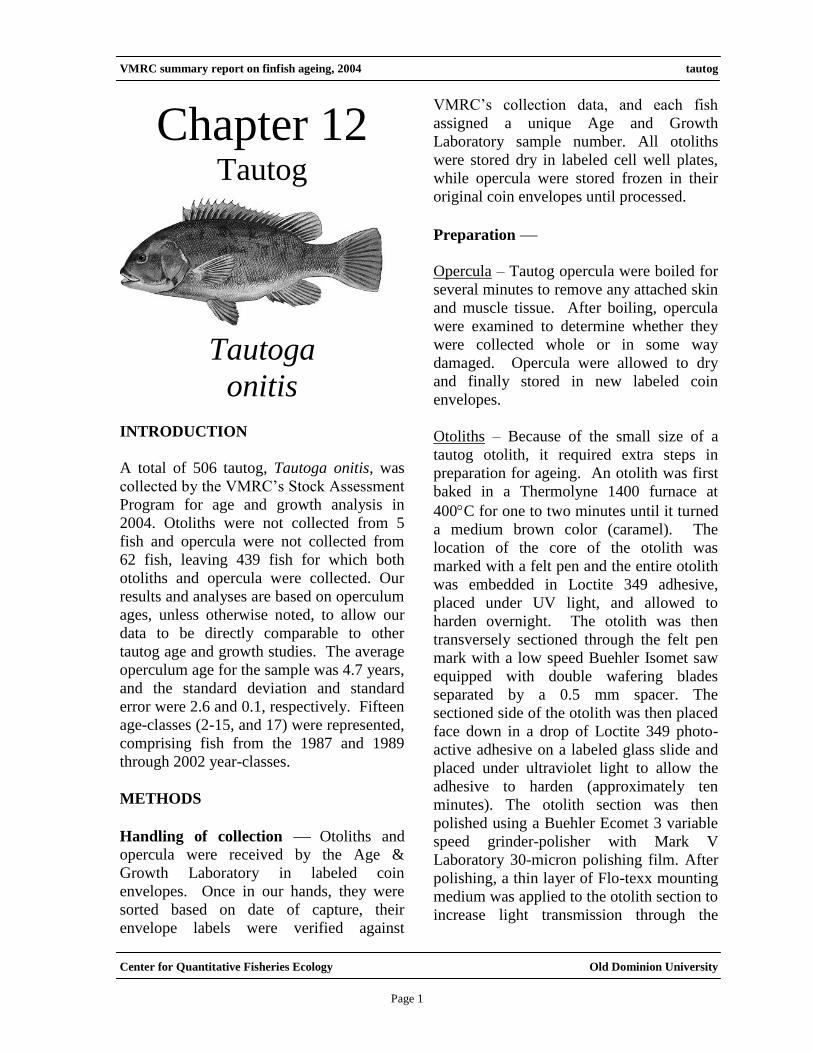
Chapter 11 Summer Flounder Introduction 47
Methods 47
Results 50
Chapter 12 Tautog Note 53
Chapter 13 Weakfish Introduction 54
Methods 54
Results 55
Page 5
VMRC summary report on finfish ageing, 2004
Center for Quantitative Fisheries Ecology Old Dominion University
Page iii
Executive Summary
In this report we present the results of ageing finfish collected from catches made in
Virginia’s marine waters in 2004. All fish were collected in 2004 by the Virginia Marine
Resources Commission’s (VMRC) Stock Assessment Program and aged in 2005 at the
Center for Quantitative Fisheries Ecology’s Age and Growth Laboratory at Old Dominion
University. This report is broken down into chapters, one for each of the 13 species we aged.
For each species, we present measures of ageing precision and bias, graphs of year-class
distributions, and age-length keys.
For three species: summer flounder, Paralichthys dentatus, (n=380); striped bass, Morone
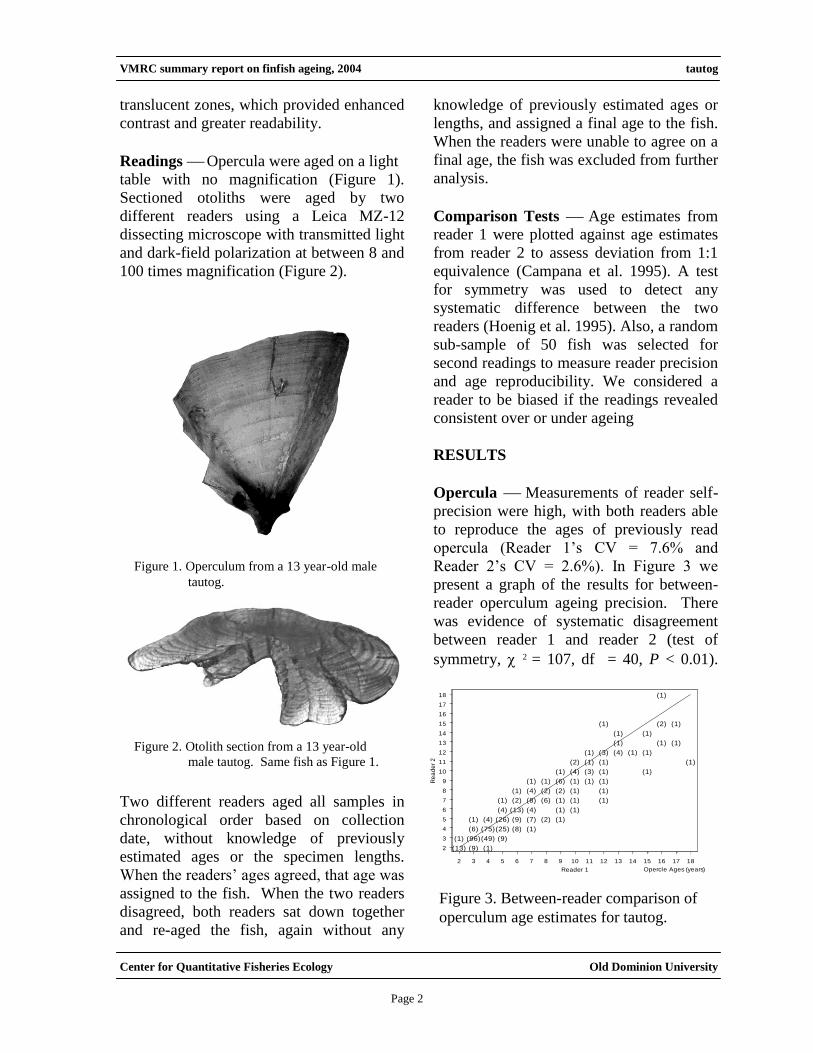
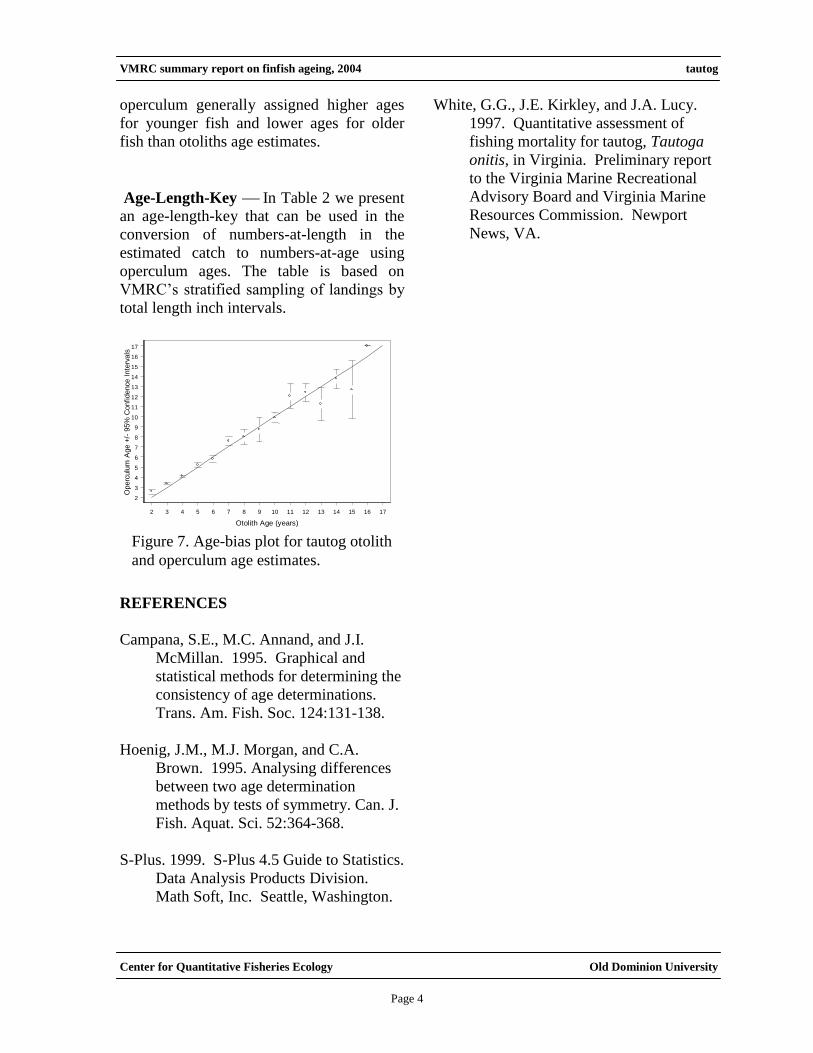
saxatilis, (n=830); and tautog, Tautoga onitis, (n=506) multiple bony structures were used for
determining fish age. Scales and otoliths were used to age summer flounder and striped bass,
and opercula and otoliths were used to age tautog. Comparing alternative hard parts allowed
us to assess their usefulness in determining fish age as well as the relative precision of each
structure. Ages were determined from otoliths for the following species collected in Virginia
waters during 2004: Atlantic croaker, Micropogonias undulatus, (n=331); black drum,
Pogonias cromis, (n=16); bluefish, Pomatomus saltatrix, (n=326); cobia, Rachycentron
canadum, (n=9); red drum, Sciaenops ocellatus, (n=6); spadefish, Chaetodipterus faber,
(n=353); Spanish mackerel, Scomberomorous maculates, (n=430); spot, Leiostomus
xanthurus, (n=459); spotted seatrout, Cynoscion nebulosus, (n=501); and weakfish,
Cynoscion regalis, (n=657).
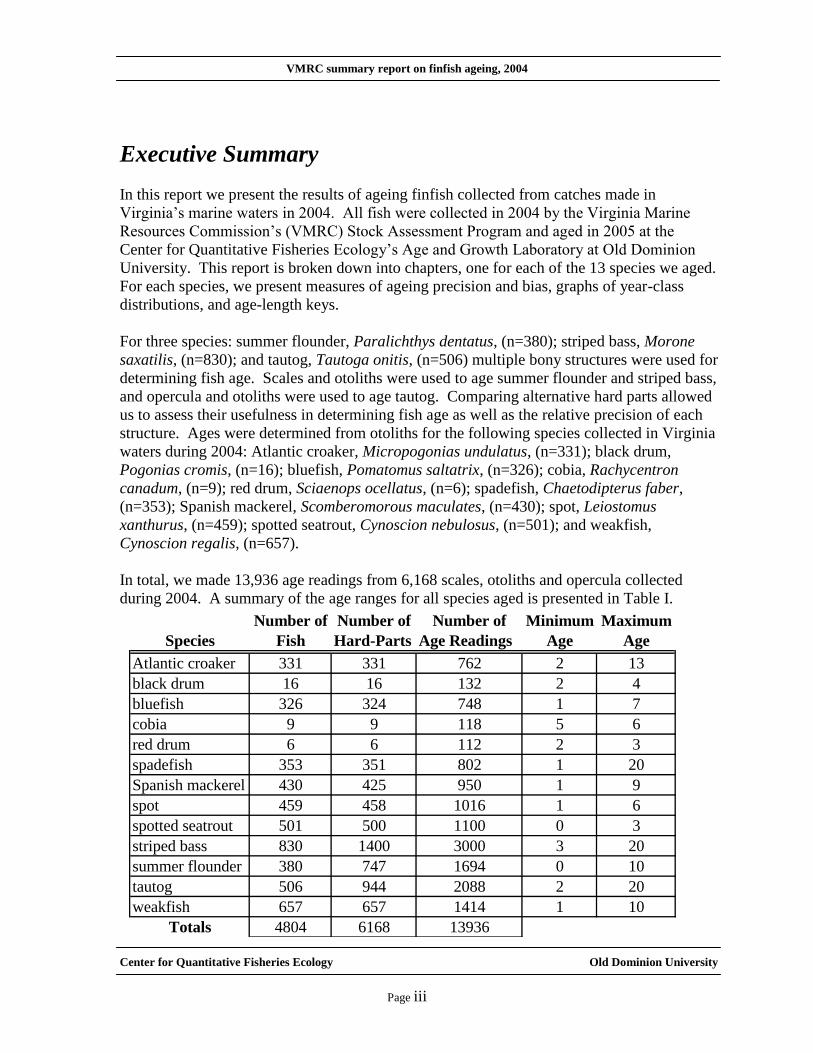
In total, we made 13,936 age readings from 6,168 scales, otoliths and opercula collected
during 2004. A summary of the age ranges for all species aged is presented in Table I.
Number of Number of Number of Minimum Maximum
Species Fish Hard-Parts Age Readings Age Age
Atlantic croaker 331 331 762 2 13
black drum 16 16 132 2 4
bluefish 326 324 748 1 7
cobia 9 9 118 5 6
red drum 6 6 112 2 3
spadefish 353 351 802 1 20
Spanish mackerel 430 425 950 1 9
spot 459 458 1016 1 6
spotted seatrout 501 500 1100 0 3
striped bass 830 1400 3000 3 20
summer flounder 380 747 1694 0 10
tautog 506 944 2088 2 20
weakfish 657 657 1414 1 10
Totals 4804 6168 13936
Page 6
VMRC summary report on finfish ageing, 2004
Center for Quantitative Fisheries Ecology Old Dominion University
Page iv
As part of our continued public outreach focused at recreational anglers, we again
participated in the CCA’s Kid’s Fishing Day at Lynnhaven Fishing Pier. This was the fifth
year our staff volunteered their time to participate in the event. We were also invited to a
television show called the smoking gun outdoors hosted by Captain Chandler Hogg. During
the show we explained our work and its importance in keeping Virginia fisheries healthy. We
are proud to announce our Technician Roxanne Torres as well as our chief technician Eric
Robillard received Portsmouth School Volunteer Service Award. Thanks to these two
technicians, more than 150 students received a day of lessons. The training included age
determination, morphology of different fish, habitat use, and importance of catch and release
and following size limits. They also received hands on experience identifying fish organs and
removing otoliths from fish donated from both commercial and recreational fisherman. We
are currently working on a Bluefish Species Update report, which will be the fifth report in
the series. Each report includes an overview of what is known about a fish species’ biology,
age and growth data and analyses generated in our lab, and interesting information on fish in
general.
In 2004/2005 we upgraded our Age & Growth Laboratory website, which can be accessed at
http://web.odu.edu/fish. The website includes electronic versions of this document along
with more detailed explanations of the methods and structures we use in age determination.
Acknowledgements
We thank Roxanne Torres, Laura McCaskill, Mignonne Twine and Susan McKeel for their
technical expertise in preparing otoliths, scales, and opercula for age determination.
Roxanne, Susan, and Serena Turner all put in long hours processing “tons” of fish in our lab.
We are also thankful for Dr. William Persons’ III hard work on our Species Updates and web
page. A special note of appreciation to Ron Owens, Joanie Beatley, and Myra Thompson for
their many efforts in this cooperative project. This work was funded by the Virginia
Saltwater Recreational Development Fund.
The image on the front cover is an otolith thin-section from a 415 mm (16.3 inch) total
length, 4 year-old male tautog. The fourth annulus is forming at the edge of the otolith.
Page 7
VMRC summary report on finfish ageing, 2004 Atlantic croaker
Center for Quantitative Fisheries Ecology Old Dominion University
Page 5
Chapter 1 Atlantic Croaker
Micropogonias
undulatus
INTRODUCTION
A total of 331 Atlantic croaker,
Micropogonias undulatus, was collected by
the VMRC’s Stock Assessment Program for
age and growth analysis in 2004. The
average age was 6.2 years, and the standard
deviation and standard error were 2.3 and
0.1, respectively. Twelve age classes (2 to
13) were represented, comprising fish from
the 1991-2002 year-classes. Fish from the
1997 through 2001 year-classes dominated
the sample
METHODS
Handling of collection Otoliths were
received by the Age & Growth Laboratory
in labeled coin envelopes. In the lab they
were sorted by date of capture, their
envelope labels were verified against
VMRC’s collection data, and each fish was
assigned a unique Age and Growth
Laboratory identification number. All
otoliths were stored dry in labeled cell well
plates.
Preparation Otoliths were processed
following the methods described in Barbieri
et al. (1994) with a few modifications.
Briefly, the left or right sagittal otolith was
randomly selected and attached to a glass
slide with Aremco's clear Crystalbond™
509 adhesive. At least two serial transverse
sections were cut through the core of each
otolith with a Buehler Isomet low-speed
saw equipped with a three inch, fine grit
Norton diamond-wafering blade. Otolith
sections were placed on labeled glass slides
and covered with a thin layer of Flo-texx
mounting medium, that not only adhered the
sections to the slide, but more importantly,
provided enhanced contrast and greater
readability by increasing light transmission
through the sections.
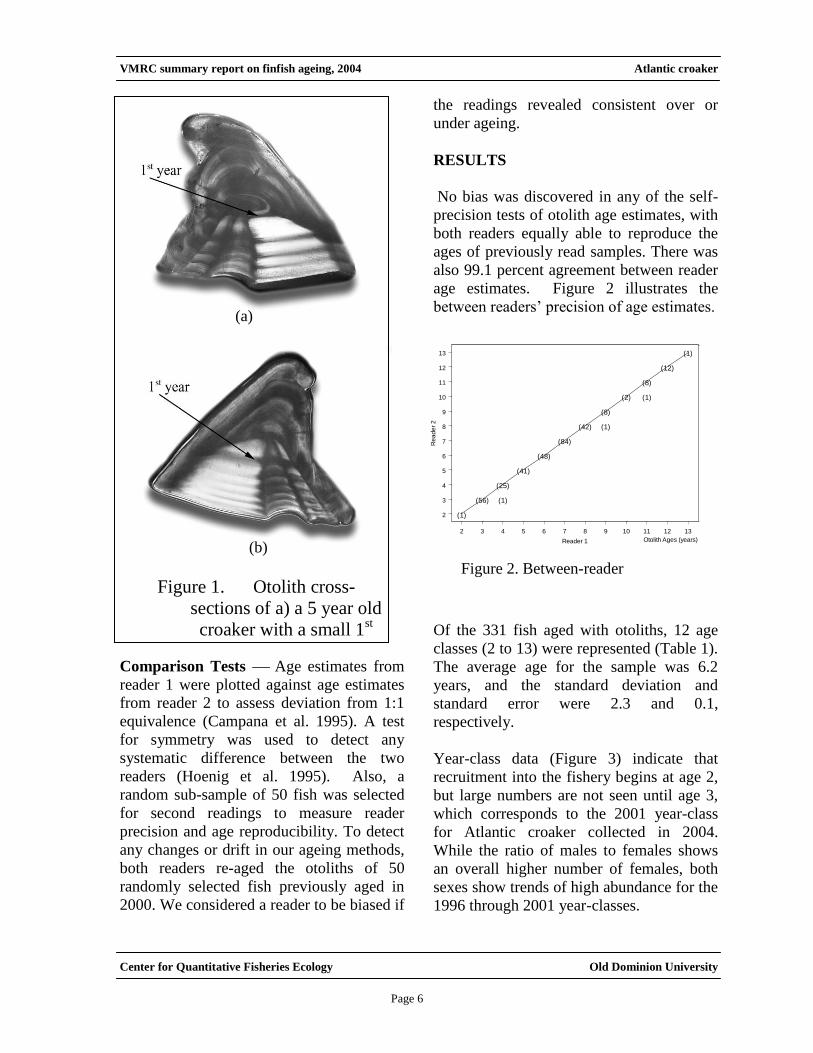
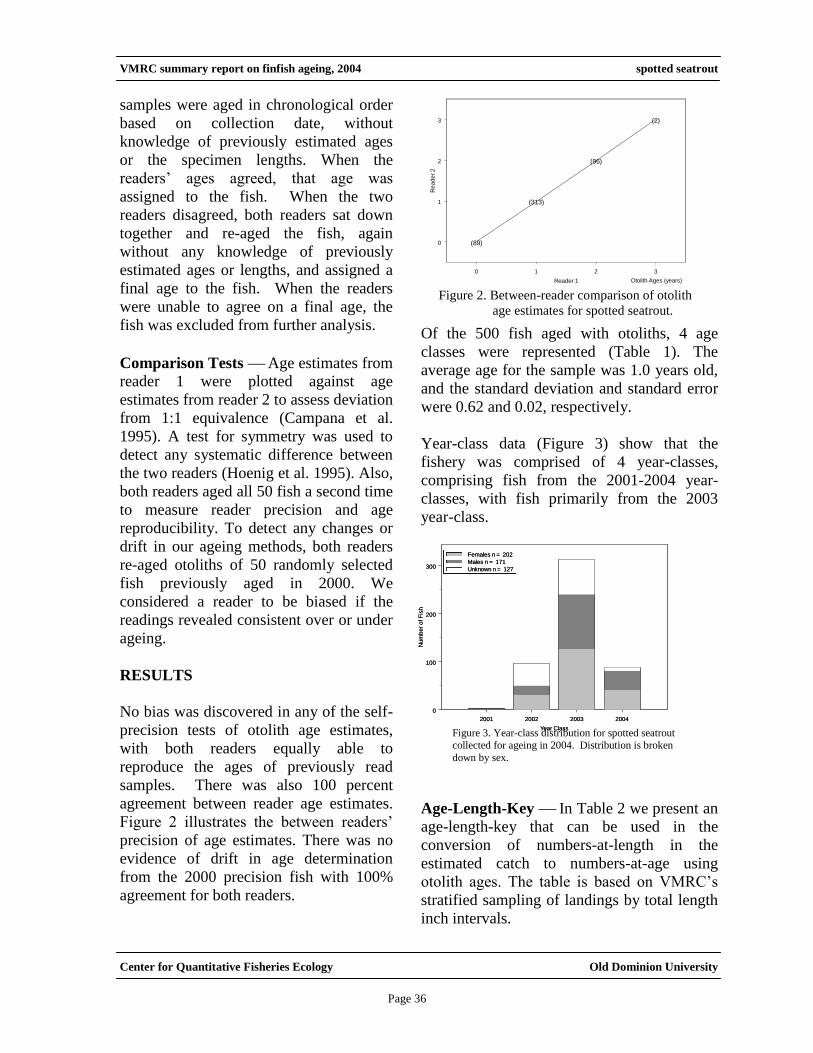
Readings Sectioned otoliths were aged
by two different readers using a Leica MZ-
12 dissecting microscope with transmitted
light and dark-field polarization at between
8 and 20 times magnification. Each reader
aged all of the otolith samples. The ageing
criteria reported in Barbieri et al. (1994)
were used in age determination, particularly
regarding the location of the first annulus
(Figure 1).
All samples were aged in chronological
order, based on collection date, without
knowledge of previously estimated ages or
the specimen lengths. When the readers’
ages agreed, that age was assigned to the
fish. When the two readers disagreed, both
readers sat down together and re-aged the
fish, again without any knowledge of
previously estimated ages or lengths, and
assigned a final age to the fish. When the
readers were unable to agree on a final age,
the fish was excluded from further analysis.
Page 8
VMRC summary report on finfish ageing, 2004 Atlantic croaker
Center for Quantitative Fisheries Ecology Old Dominion University
Page 6
Comparison Tests Age estimates from
reader 1 were plotted against age estimates
from reader 2 to assess deviation from 1:1
equivalence (Campana et al. 1995). A test
for symmetry was used to detect any
systematic difference between the two
readers (Hoenig et al. 1995). Also, a
random sub-sample of 50 fish was selected
for second readings to measure reader
precision and age reproducibility. To detect
any changes or drift in our ageing methods,
both readers re-aged the otoliths of 50
randomly selected fish previously aged in
2000. We considered a reader to be biased if
the readings revealed consistent over or
under ageing.
RESULTS
No bias was discovered in any of the self-
precision tests of otolith age estimates, with
both readers equally able to reproduce the
ages of previously read samples. There was
also 99.1 percent agreement between reader
age estimates. Figure 2 illustrates the
between readers’ precision of age estimates.
Of the 331 fish aged with otoliths, 12 age
classes (2 to 13) were represented (Table 1).
The average age for the sample was 6.2
years, and the standard deviation and
standard error were 2.3 and 0.1,
respectively.
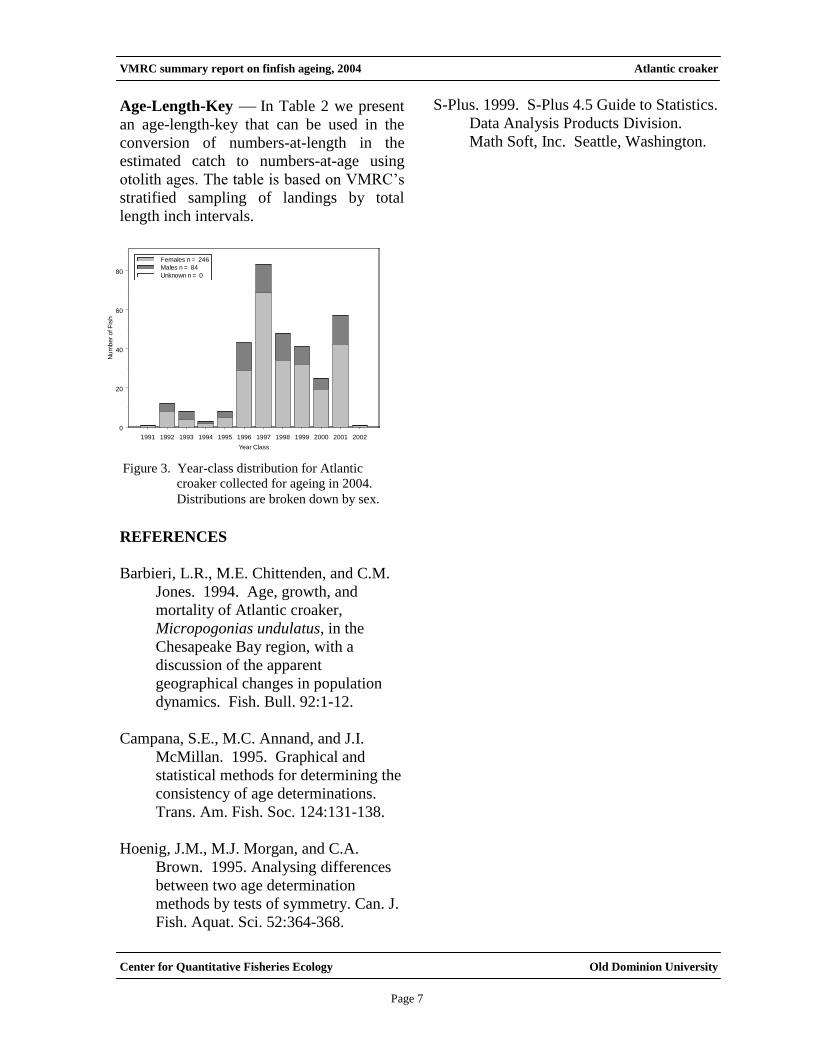
Year-class data (Figure 3) indicate that
recruitment into the fishery begins at age 2,
but large numbers are not seen until age 3,
which corresponds to the 2001 year-class
for Atlantic croaker collected in 2004.
While the ratio of males to females shows
an overall higher number of females, both
sexes show trends of high abundance for the
1996 through 2001 year-classes.
(a)
(b)
Figure 1. Otolith cross-
sections of a) a 5 year old
croaker with a small 1st
annulus, and b) a 6 year
old croaker with a large
1st annulus.
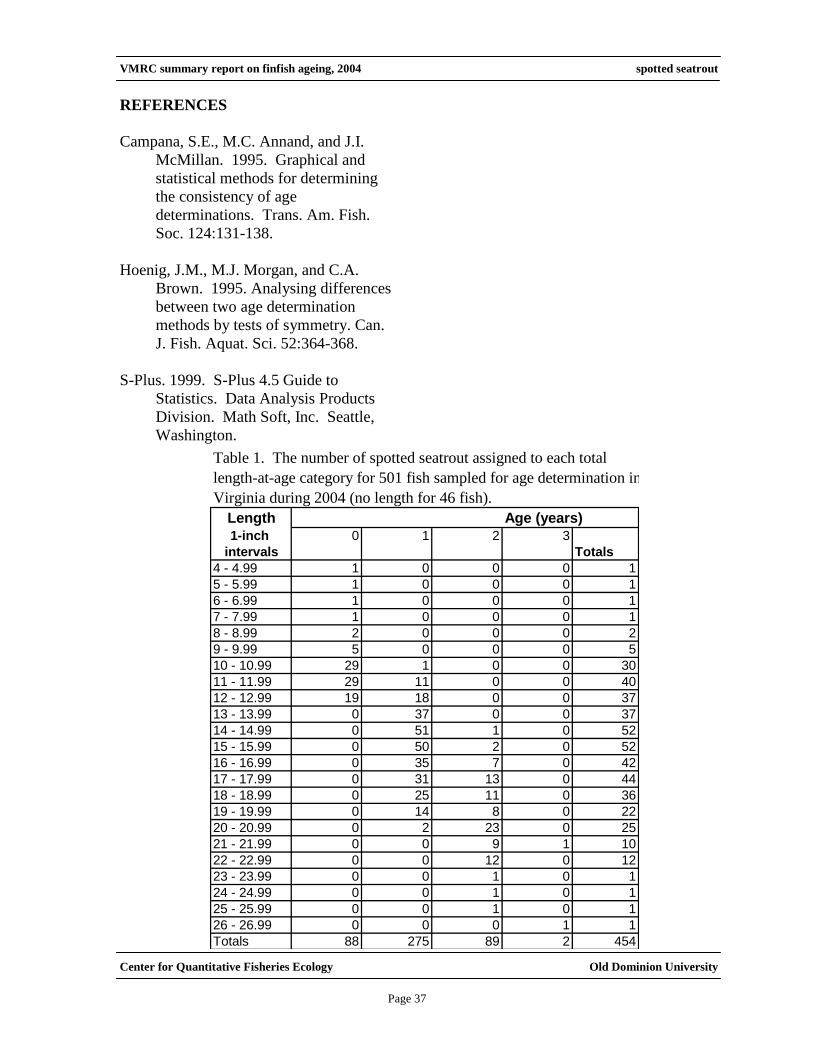
Figure 2. Between-reader
comparison of otolith age estimates
for Atlantic croaker.
2 3 4 5 6 7 8 9 10 11 12 13
Reader 1
2
3
4
5
6
7
8
9
10
11
12
13
Re
ad
er
2
(1)
(56) (1)
(25)
(41)
(48)
(84)
(42) (1)
(8)
(2) (1)
(8)
(12)
(1)
Otolith Ages (years)
Page 9
VMRC summary report on finfish ageing, 2004 Atlantic croaker
Center for Quantitative Fisheries Ecology Old Dominion University
Page 7
Age-Length-Key In Table 2 we present
an age-length-key that can be used in the
conversion of numbers-at-length in the
estimated catch to numbers-at-age using
otolith ages. The table is based on VMRC’s
stratified sampling of landings by total
length inch intervals.
REFERENCES
Barbieri, L.R., M.E. Chittenden, and C.M.
Jones. 1994. Age, growth, and
mortality of Atlantic croaker,
Micropogonias undulatus, in the
Chesapeake Bay region, with a
discussion of the apparent
geographical changes in population
dynamics. Fish. Bull. 92:1-12.
Campana, S.E., M.C. Annand, and J.I.
McMillan. 1995. Graphical and
statistical methods for determining the
consistency of age determinations.
Trans. Am. Fish. Soc. 124:131-138.
Hoenig, J.M., M.J. Morgan, and C.A.
Brown. 1995. Analysing differences
between two age determination
methods by tests of symmetry. Can. J.
Fish. Aquat. Sci. 52:364-368.
S-Plus. 1999. S-Plus 4.5 Guide to Statistics.
Data Analysis Products Division.
Math Soft, Inc. Seattle, Washington.
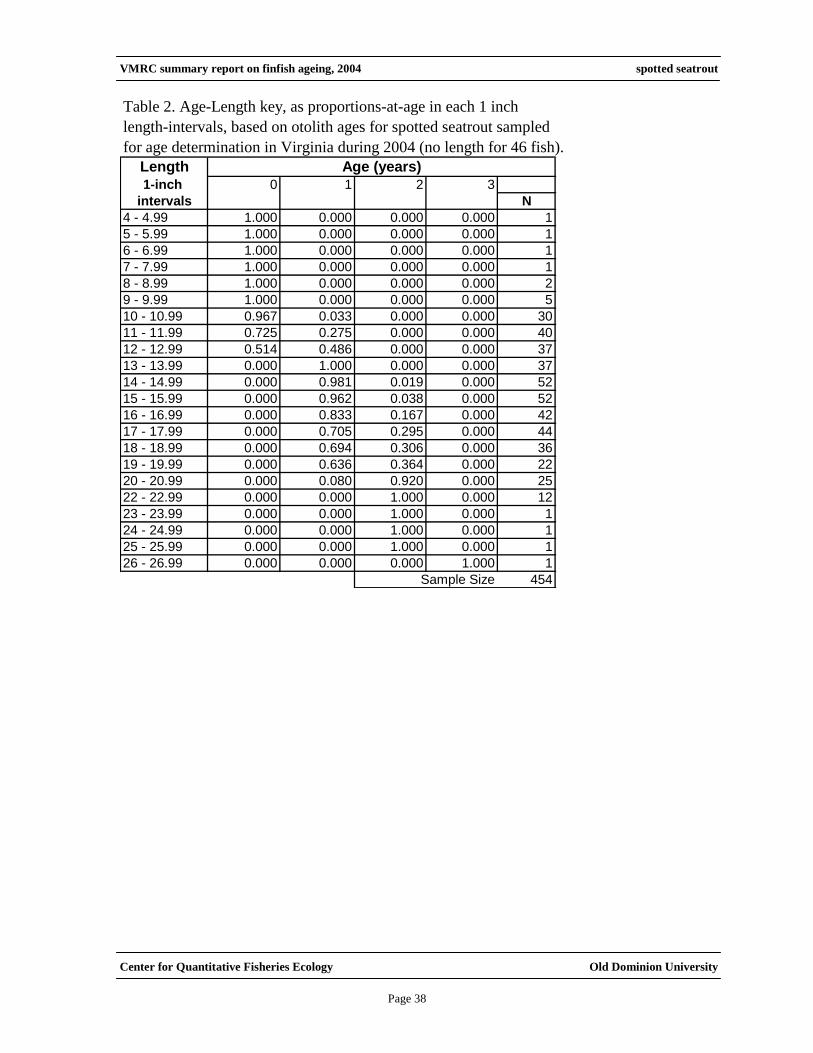
Figure 3. Year-class distribution for Atlantic
croaker collected for ageing in 2004.
Distributions are broken down by sex.
1991 1992 1993 1994 1995 1996 1997 1998 1999 2000 2001 2002
Year Class
0
20
40
60
80
Nu
mb
er
of F
ish
Females n = 246
Males n = 84
Unknown n = 0
Page 10
VMRC summary report on finfish ageing, 2004 Atlantic croaker
Center for Quantitative Fisheries Ecology Old Dominion University
Page 8
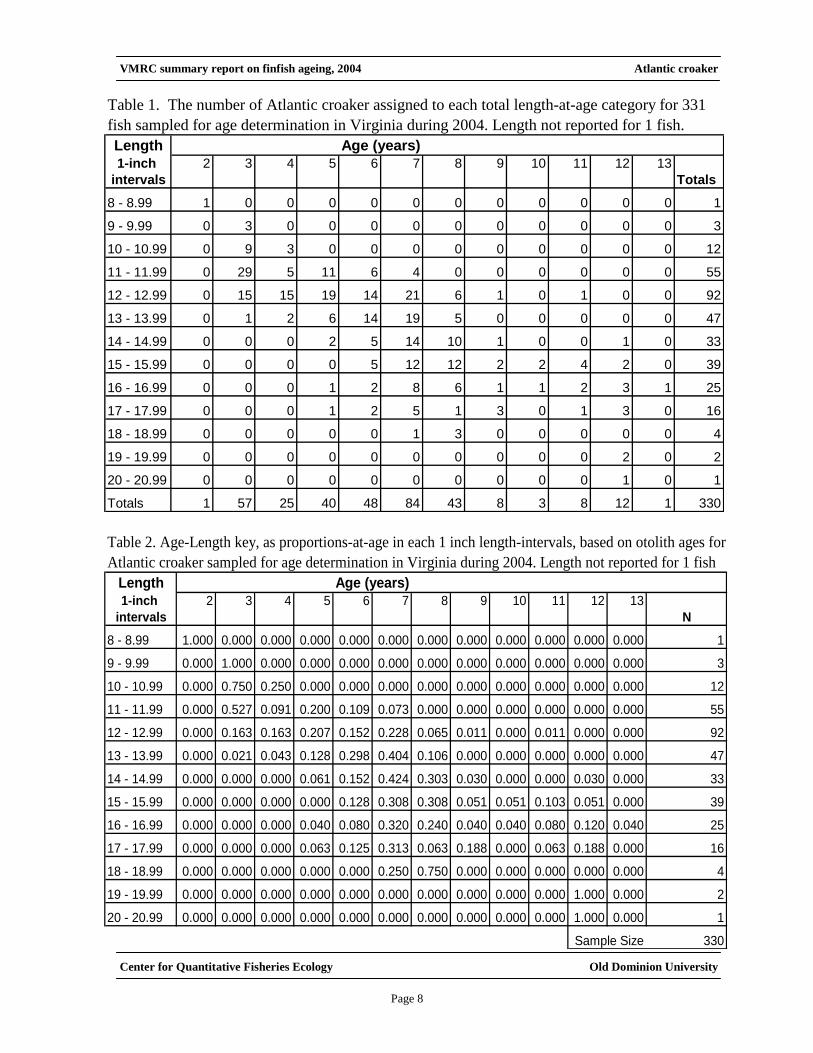
Table 1. The number of Atlantic croaker assigned to each total length-at-age category for 331
fish sampled for age determination in Virginia during 2004. Length not reported for 1 fish.
Length Age (years)
1-inch 2 3 4 5 6 7 8 9 10 11 12 13
intervals Totals
8 - 8.99 1 0 0 0 0 0 0 0 0 0 0 0 1
9 - 9.99 0 3 0 0 0 0 0 0 0 0 0 0 3
10 - 10.99 0 9 3 0 0 0 0 0 0 0 0 0 12
11 - 11.99 0 29 5 11 6 4 0 0 0 0 0 0 55
12 - 12.99 0 15 15 19 14 21 6 1 0 1 0 0 92
13 - 13.99 0 1 2 6 14 19 5 0 0 0 0 0 47
14 - 14.99 0 0 0 2 5 14 10 1 0 0 1 0 33
15 - 15.99 0 0 0 0 5 12 12 2 2 4 2 0 39
16 - 16.99 0 0 0 1 2 8 6 1 1 2 3 1 25
17 - 17.99 0 0 0 1 2 5 1 3 0 1 3 0 16
18 - 18.99 0 0 0 0 0 1 3 0 0 0 0 0 4
19 - 19.99 0 0 0 0 0 0 0 0 0 0 2 0 2
20 - 20.99 0 0 0 0 0 0 0 0 0 0 1 0 1
Totals 1 57 25 40 48 84 43 8 3 8 12 1 330
Table 2. Age-Length key, as proportions-at-age in each 1 inch length-intervals, based on otolith ages for
Atlantic croaker sampled for age determination in Virginia during 2004. Length not reported for 1 fish
Length Age (years)
1-inch 2 3 4 5 6 7 8 9 10 11 12 13
intervals N
8 - 8.99 1.000 0.000 0.000 0.000 0.000 0.000 0.000 0.000 0.000 0.000 0.000 0.000 1
9 - 9.99 0.000 1.000 0.000 0.000 0.000 0.000 0.000 0.000 0.000 0.000 0.000 0.000 3
10 - 10.99 0.000 0.750 0.250 0.000 0.000 0.000 0.000 0.000 0.000 0.000 0.000 0.000 12
11 - 11.99 0.000 0.527 0.091 0.200 0.109 0.073 0.000 0.000 0.000 0.000 0.000 0.000 55
12 - 12.99 0.000 0.163 0.163 0.207 0.152 0.228 0.065 0.011 0.000 0.011 0.000 0.000 92
13 - 13.99 0.000 0.021 0.043 0.128 0.298 0.404 0.106 0.000 0.000 0.000 0.000 0.000 47
14 - 14.99 0.000 0.000 0.000 0.061 0.152 0.424 0.303 0.030 0.000 0.000 0.030 0.000 33
15 - 15.99 0.000 0.000 0.000 0.000 0.128 0.308 0.308 0.051 0.051 0.103 0.051 0.000 39
16 - 16.99 0.000 0.000 0.000 0.040 0.080 0.320 0.240 0.040 0.040 0.080 0.120 0.040 25
17 - 17.99 0.000 0.000 0.000 0.063 0.125 0.313 0.063 0.188 0.000 0.063 0.188 0.000 16
18 - 18.99 0.000 0.000 0.000 0.000 0.000 0.250 0.750 0.000 0.000 0.000 0.000 0.000 4
19 - 19.99 0.000 0.000 0.000 0.000 0.000 0.000 0.000 0.000 0.000 0.000 1.000 0.000 2
20 - 20.99 0.000 0.000 0.000 0.000 0.000 0.000 0.000 0.000 0.000 0.000 1.000 0.000 1
Sample Size 330
Page 11
VMRC summary report on finfish ageing, 2004 black drum
Center for Quantitative Fisheries Ecology Old Dominion University
Page 5
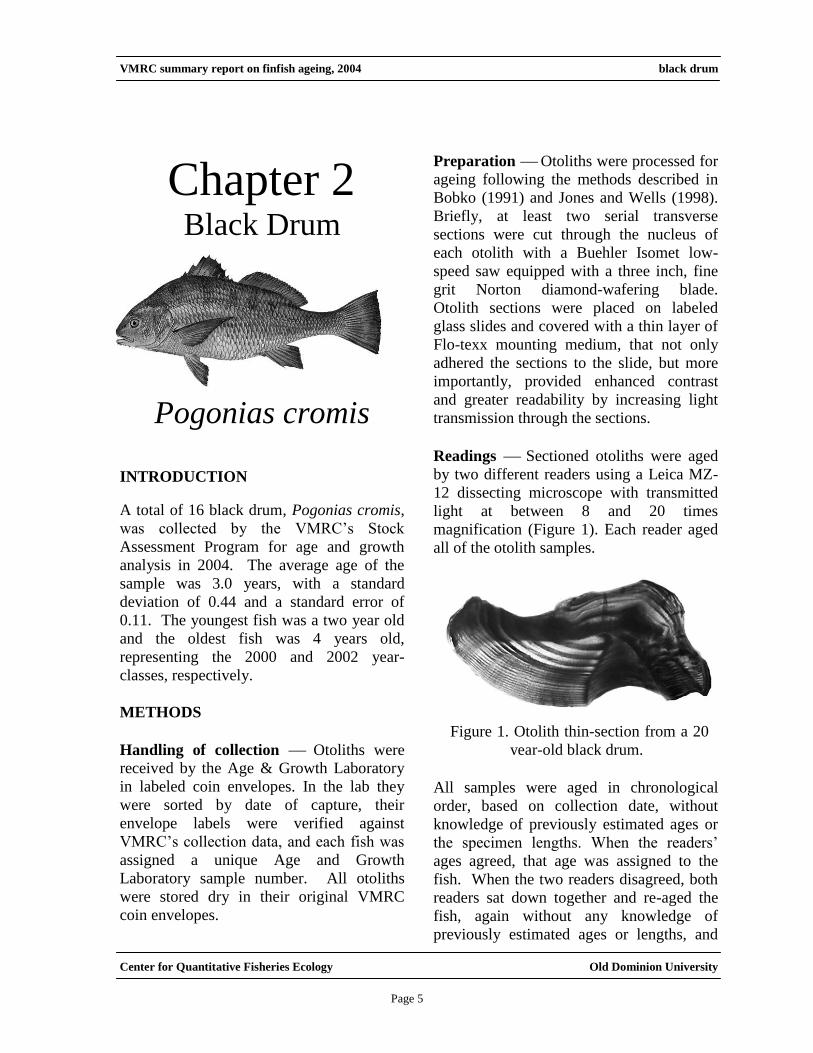
Chapter 2 Black Drum
Pogonias cromis
INTRODUCTION
A total of 16 black drum, Pogonias cromis,
was collected by the VMRC’s Stock
Assessment Program for age and growth
analysis in 2004. The average age of the
sample was 3.0 years, with a standard
deviation of 0.44 and a standard error of
0.11. The youngest fish was a two year old
and the oldest fish was 4 years old,
representing the 2000 and 2002 year-
classes, respectively.
METHODS
Handling of collection Otoliths were
received by the Age & Growth Laboratory
in labeled coin envelopes. In the lab they
were sorted by date of capture, their
envelope labels were verified against
VMRC’s collection data, and each fish was
assigned a unique Age and Growth
Laboratory sample number. All otoliths
were stored dry in their original VMRC
coin envelopes.
Preparation Otoliths were processed for
ageing following the methods described in
Bobko (1991) and Jones and Wells (1998).
Briefly, at least two serial transverse
sections were cut through the nucleus of
each otolith with a Buehler Isomet low-
speed saw equipped with a three inch, fine
grit Norton diamond-wafering blade.
Otolith sections were placed on labeled
glass slides and covered with a thin layer of
Flo-texx mounting medium, that not only
adhered the sections to the slide, but more
importantly, provided enhanced contrast
and greater readability by increasing light
transmission through the sections.
Readings Sectioned otoliths were aged
by two different readers using a Leica MZ-
12 dissecting microscope with transmitted
light at between 8 and 20 times
magnification (Figure 1). Each reader aged
all of the otolith samples.
All samples were aged in chronological
order, based on collection date, without
knowledge of previously estimated ages or
the specimen lengths. When the readers’
ages agreed, that age was assigned to the
fish. When the two readers disagreed, both
readers sat down together and re-aged the
fish, again without any knowledge of
previously estimated ages or lengths, and
Figure 1. Otolith thin-section from a 20
year-old black drum.
Page 12
VMRC summary report on finfish ageing, 2004 black drum
Center for Quantitative Fisheries Ecology Old Dominion University
Page 6
assigned a final age to the fish. When the
readers were unable to agree on a final age,
the fish was excluded from further analysis.
Comparison Tests Age estimates from
reader 1 were plotted against age estimates
from reader 2 to assess deviation from 1:1
equivalence (Campana et al. 1995). A test
for symmetry was used to detect any
systematic difference between the two
readers (Hoenig et al. 1995). Also, both
readers aged all fish a second time to
measure reader precision and age
reproducibility. To detect any changes or
drift in our ageing methods, both readers re-
aged the otoliths of 50 randomly selected
fish previously aged in 2000. We
considered a reader to be biased if the
readings revealed consistent over or under
ageing. We considered a reader to be biased
if the readings revealed consistent over or
under ageing.
RESULTS
No bias was discovered in any of the self-
precision tests of otolith age estimates, with
both readers equally able to reproduce the
ages of previously read samples. There was
also 88 percent agreement between reader
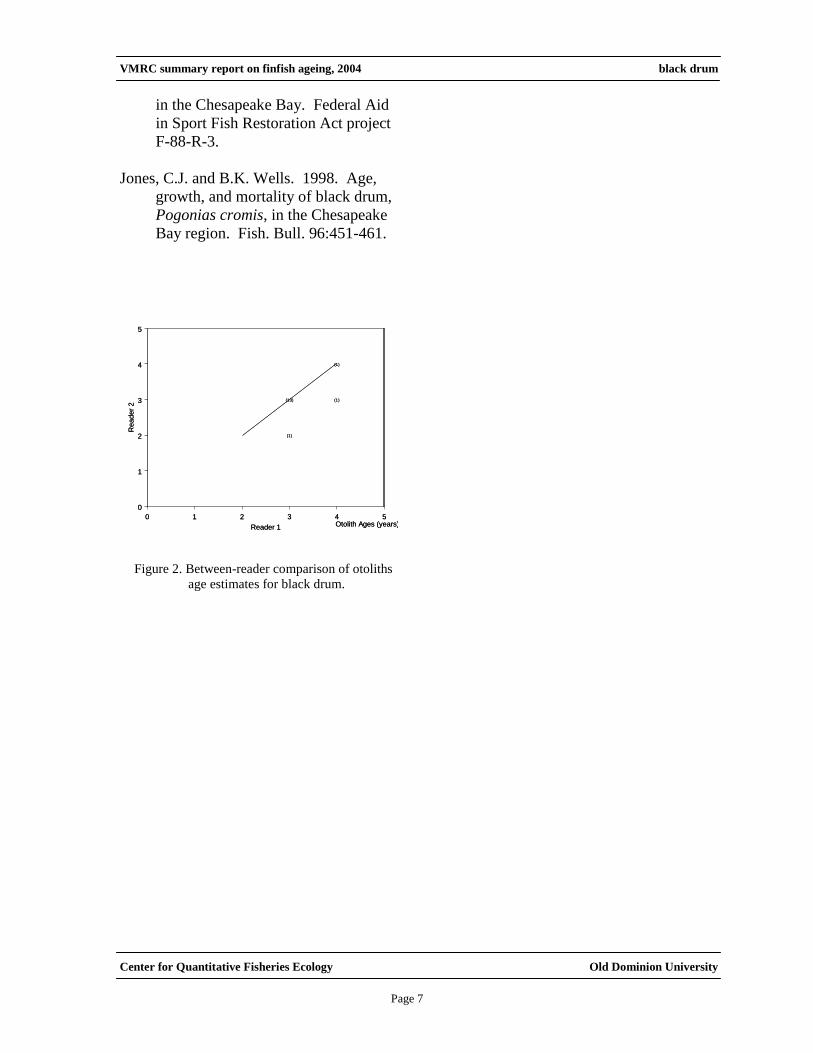
age estimates. Figure 2 illustrates the
between readers’ precision of age estimates.
Of the 16 fish aged with otoliths, 3 age
classes were represented (Table 1). The
average age of the sample was 3.0 years,
with a standard deviation of 0.44 and a
standard error of 0.11. The youngest fish
was a two year old and the oldest fish was
4 years old, representing the 2002 and 2000
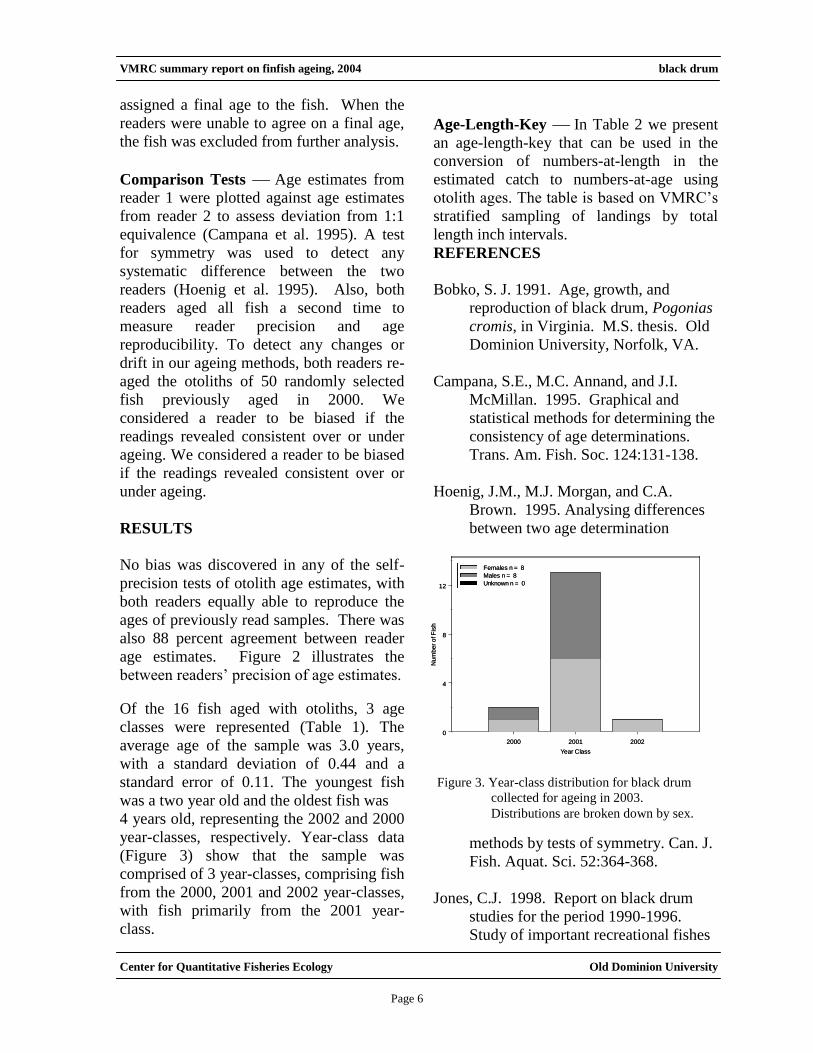
year-classes, respectively. Year-class data
(Figure 3) show that the sample was
comprised of 3 year-classes, comprising fish
from the 2000, 2001 and 2002 year-classes,
with fish primarily from the 2001 year-
class.
Age-Length-Key In Table 2 we present
an age-length-key that can be used in the
conversion of numbers-at-length in the
estimated catch to numbers-at-age using
otolith ages. The table is based on VMRC’s
stratified sampling of landings by total
length inch intervals.
REFERENCES
Bobko, S. J. 1991. Age, growth, and
reproduction of black drum, Pogonias
cromis, in Virginia. M.S. thesis. Old
Dominion University, Norfolk, VA.
Campana, S.E., M.C. Annand, and J.I.
McMillan. 1995. Graphical and
statistical methods for determining the
consistency of age determinations.
Trans. Am. Fish. Soc. 124:131-138.
Hoenig, J.M., M.J. Morgan, and C.A.
Brown. 1995. Analysing differences
between two age determination
methods by tests of symmetry. Can. J.
Fish. Aquat. Sci. 52:364-368.
Jones, C.J. 1998. Report on black drum
studies for the period 1990-1996.
Study of important recreational fishes
Figure 3. Year-class distribution for black drum
collected for ageing in 2003.
Distributions are broken down by sex.
2000 2001 2002
Year Class
0
4
8
12
Nu
mb
er
of F
ish
Females n = 8
Males n = 8
Unknown n = 0
2000 2001 2002
Year Class
0
4
8
12
Nu
mb
er
of F
ish
Females n = 8
Males n = 8
Unknown n = 0
Page 13
VMRC summary report on finfish ageing, 2004 black drum
Center for Quantitative Fisheries Ecology Old Dominion University
Page 7
in the Chesapeake Bay. Federal Aid
in Sport Fish Restoration Act project
F-88-R-3.
Jones, C.J. and B.K. Wells. 1998. Age,
growth, and mortality of black drum,
Pogonias cromis, in the Chesapeake
Bay region. Fish. Bull. 96:451-461.
Figure 2. Between-reader comparison of otoliths
age estimates for black drum.
0 1 2 3 4 5
Reader 1
0
1
2
3
4
5
Re
ad
er
2
(1)
(13) (1)
(1)
Otolith Ages (years)0 1 2 3 4 5
Reader 1
0
1
2
3
4
5
Re
ad
er
2
(1)
(13) (1)
(1)
Otolith Ages (years)
Page 14
VMRC summary report on finfish ageing, 2004 black drum
Center for Quantitative Fisheries Ecology Old Dominion University
Page 8
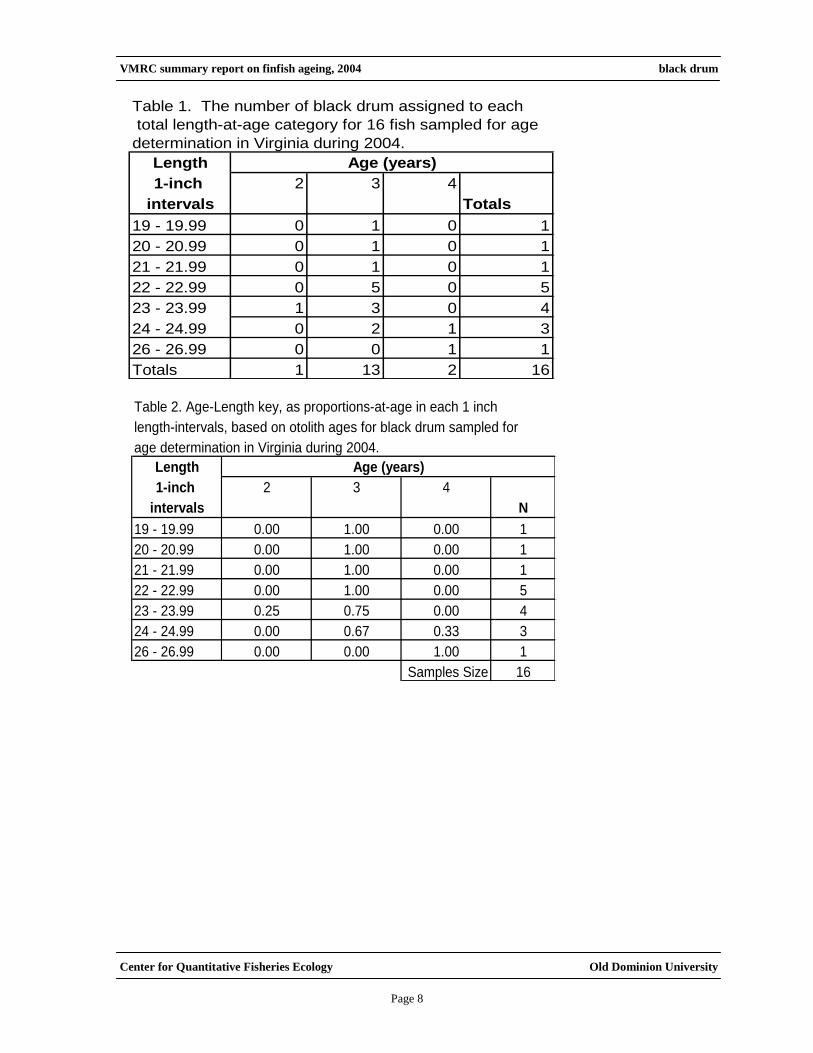
Table 1. The number of black drum assigned to each
total length-at-age category for 16 fish sampled for age
determination in Virginia during 2004.
Length
1-inch 2 3 4
intervals Totals
19 - 19.99 0 1 0 1
20 - 20.99 0 1 0 1
21 - 21.99 0 1 0 1
22 - 22.99 0 5 0 5
23 - 23.99 1 3 0 4
24 - 24.99 0 2 1 3
26 - 26.99 0 0 1 1
Totals 1 13 2 16
Age (years)
Table 2. Age-Length key, as proportions-at-age in each 1 inch
length-intervals, based on otolith ages for black drum sampled for
age determination in Virginia during 2004.
Length
1-inch 2 3 4
intervals N
19 - 19.99 0.00 1.00 0.00 1
20 - 20.99 0.00 1.00 0.00 1
21 - 21.99 0.00 1.00 0.00 1
22 - 22.99 0.00 1.00 0.00 5
23 - 23.99 0.25 0.75 0.00 4
24 - 24.99 0.00 0.67 0.33 3
26 - 26.99 0.00 0.00 1.00 1
Samples Size 16
Age (years)
Page 15
VMRC summary report on finfish ageing, 2004 bluefish
Center for Quantitative Fisheries Ecology Old Dominion University
Page 1
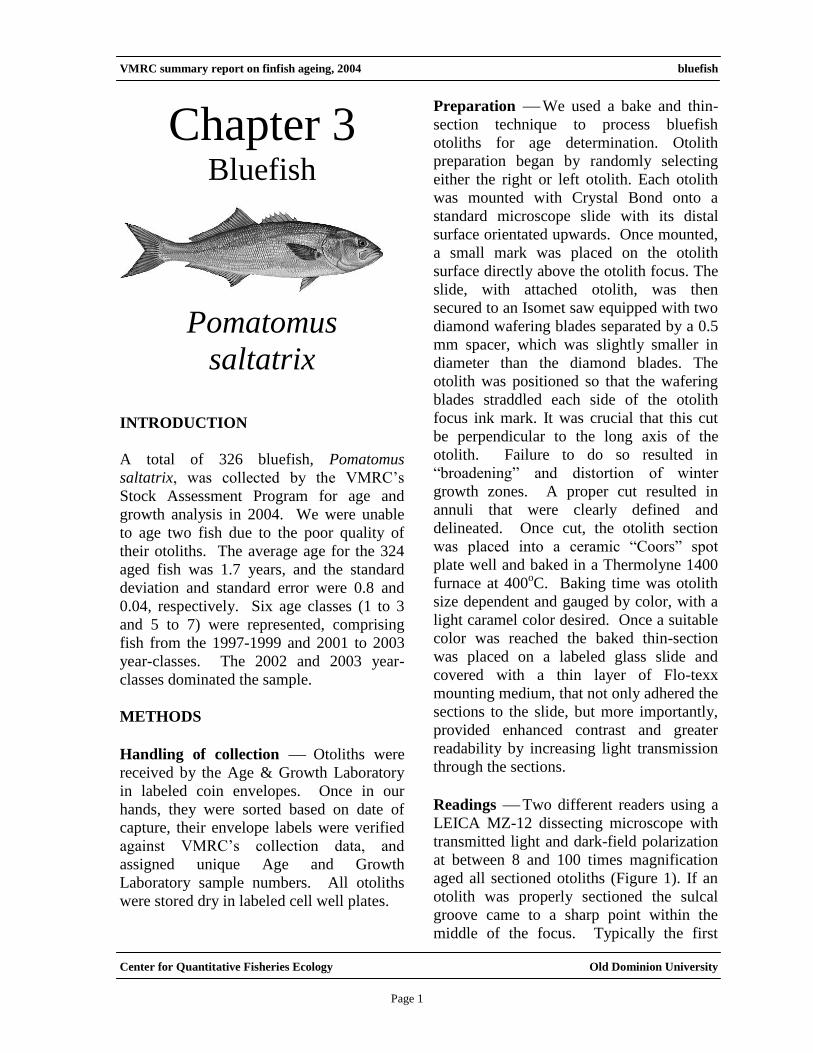
Chapter 3 Bluefish
Pomatomus
saltatrix
INTRODUCTION
A total of 326 bluefish, Pomatomus
saltatrix, was collected by the VMRC’s
Stock Assessment Program for age and
growth analysis in 2004. We were unable
to age two fish due to the poor quality of
their otoliths. The average age for the 324
aged fish was 1.7 years, and the standard
deviation and standard error were 0.8 and
0.04, respectively. Six age classes (1 to 3
and 5 to 7) were represented, comprising
fish from the 1997-1999 and 2001 to 2003
year-classes. The 2002 and 2003 year-
classes dominated the sample.
METHODS
Handling of collection Otoliths were
received by the Age & Growth Laboratory
in labeled coin envelopes. Once in our
hands, they were sorted based on date of
capture, their envelope labels were verified
against VMRC’s collection data, and
assigned unique Age and Growth
Laboratory sample numbers. All otoliths
were stored dry in labeled cell well plates.
Preparation We used a bake and thin-
section technique to process bluefish
otoliths for age determination. Otolith
preparation began by randomly selecting
either the right or left otolith. Each otolith
was mounted with Crystal Bond onto a
standard microscope slide with its distal
surface orientated upwards. Once mounted,
a small mark was placed on the otolith
surface directly above the otolith focus. The
slide, with attached otolith, was then
secured to an Isomet saw equipped with two
diamond wafering blades separated by a 0.5
mm spacer, which was slightly smaller in
diameter than the diamond blades. The
otolith was positioned so that the wafering
blades straddled each side of the otolith
focus ink mark. It was crucial that this cut
be perpendicular to the long axis of the
otolith. Failure to do so resulted in
“broadening” and distortion of winter
growth zones. A proper cut resulted in
annuli that were clearly defined and
delineated. Once cut, the otolith section
was placed into a ceramic “Coors” spot
plate well and baked in a Thermolyne 1400
furnace at 400oC. Baking time was otolith
size dependent and gauged by color, with a
light caramel color desired. Once a suitable
color was reached the baked thin-section
was placed on a labeled glass slide and
covered with a thin layer of Flo-texx
mounting medium, that not only adhered the
sections to the slide, but more importantly,
provided enhanced contrast and greater
readability by increasing light transmission
through the sections.
Readings Two different readers using a
LEICA MZ-12 dissecting microscope with
transmitted light and dark-field polarization
at between 8 and 100 times magnification
aged all sectioned otoliths (Figure 1). If an
otolith was properly sectioned the sulcal
groove came to a sharp point within the
middle of the focus. Typically the first
Page 16
VMRC summary report on finfish ageing, 2004 bluefish
Center for Quantitative Fisheries Ecology Old Dominion University
Page 2
year’s annulus was found by locating the
focus of the otolith, which was
characterized as a visually distinct dark
oblong region found in the center of the
otolith. The first year’s annulus had the
highest visibility proximal to the focus
along the edge of the sulcal groove. Once
located, the first year’s annulus was
followed outward from the sulcal groove
towards the dorsal perimeter of the otolith.
Often, but not always, the first year was
associated with a very distinct crenellation
on the dorsal surface and a prominent
protrusion on the ventral surface.
Unfortunately both these landmarks had a
tendency to become less prominent in older
fish.
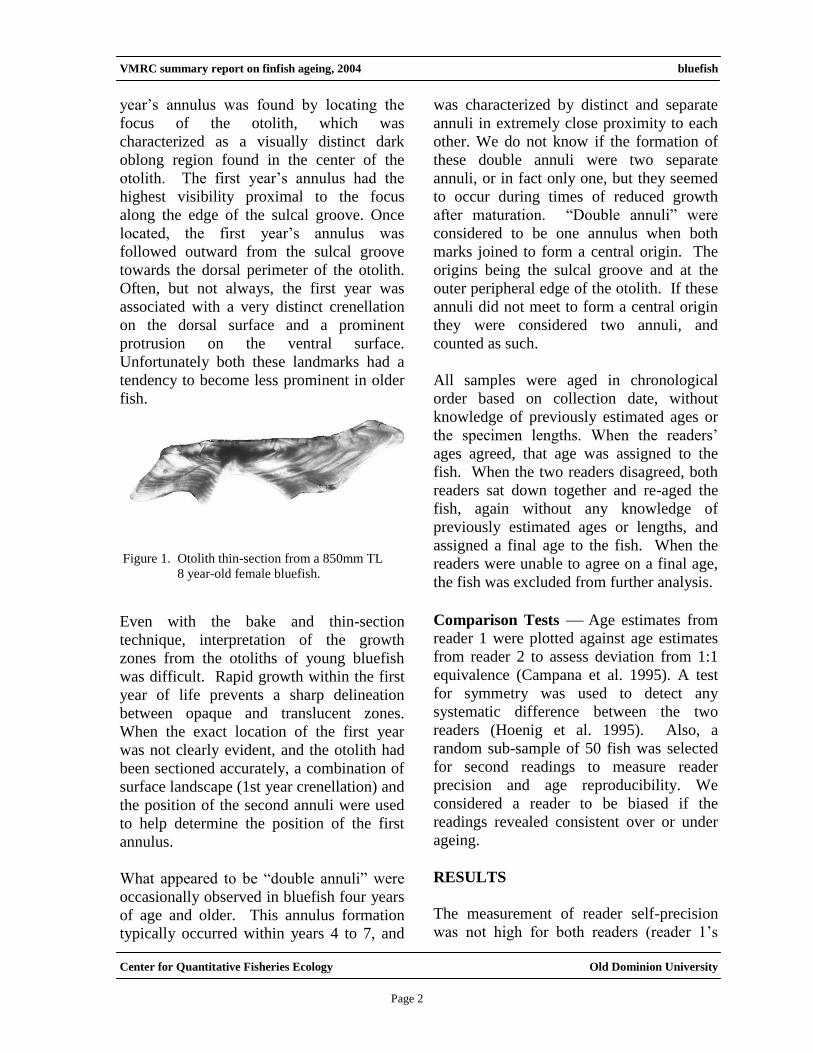
Even with the bake and thin-section
technique, interpretation of the growth
zones from the otoliths of young bluefish
was difficult. Rapid growth within the first
year of life prevents a sharp delineation
between opaque and translucent zones.
When the exact location of the first year
was not clearly evident, and the otolith had
been sectioned accurately, a combination of
surface landscape (1st year crenellation) and
the position of the second annuli were used
to help determine the position of the first
annulus.
What appeared to be “double annuli” were
occasionally observed in bluefish four years
of age and older. This annulus formation
typically occurred within years 4 to 7, and
was characterized by distinct and separate
annuli in extremely close proximity to each
other. We do not know if the formation of
these double annuli were two separate
annuli, or in fact only one, but they seemed
to occur during times of reduced growth
after maturation. “Double annuli” were
considered to be one annulus when both
marks joined to form a central origin. The
origins being the sulcal groove and at the
outer peripheral edge of the otolith. If these
annuli did not meet to form a central origin
they were considered two annuli, and
counted as such.
All samples were aged in chronological
order based on collection date, without
knowledge of previously estimated ages or
the specimen lengths. When the readers’
ages agreed, that age was assigned to the
fish. When the two readers disagreed, both
readers sat down together and re-aged the
fish, again without any knowledge of
previously estimated ages or lengths, and
assigned a final age to the fish. When the
readers were unable to agree on a final age,
the fish was excluded from further analysis.
Comparison Tests Age estimates from
reader 1 were plotted against age estimates
from reader 2 to assess deviation from 1:1
equivalence (Campana et al. 1995). A test
for symmetry was used to detect any
systematic difference between the two
readers (Hoenig et al. 1995). Also, a
random sub-sample of 50 fish was selected
for second readings to measure reader
precision and age reproducibility. We
considered a reader to be biased if the
readings revealed consistent over or under
ageing.
RESULTS
The measurement of reader self-precision
was not high for both readers (reader 1’s
Figure 1. Otolith thin-section from a 850mm TL
8 year-old female bluefish.
Page 17
VMRC summary report on finfish ageing, 2004 bluefish
Center for Quantitative Fisheries Ecology Old Dominion University
Page 3
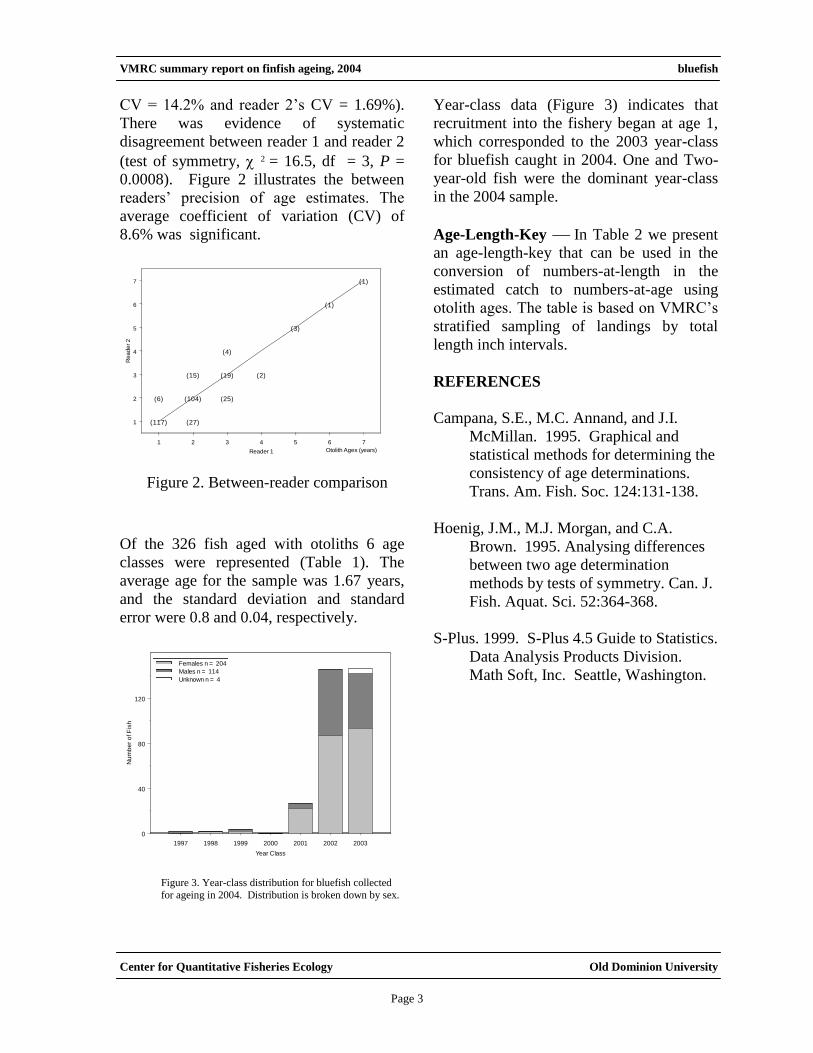
CV = 14.2% and reader 2’s CV = 1.69%).
There was evidence of systematic
disagreement between reader 1 and reader 2
(test of symmetry, 2 = 16.5, df = 3, P =
0.0008). Figure 2 illustrates the between
readers’ precision of age estimates. The
average coefficient of variation (CV) of
8.6% was significant.
Of the 326 fish aged with otoliths 6 age
classes were represented (Table 1). The
average age for the sample was 1.67 years,
and the standard deviation and standard
error were 0.8 and 0.04, respectively.
Year-class data (Figure 3) indicates that
recruitment into the fishery began at age 1,
which corresponded to the 2003 year-class
for bluefish caught in 2004. One and Two-
year-old fish were the dominant year-class
in the 2004 sample.
Age-Length-Key In Table 2 we present
an age-length-key that can be used in the
conversion of numbers-at-length in the
estimated catch to numbers-at-age using
otolith ages. The table is based on VMRC’s
stratified sampling of landings by total
length inch intervals.
REFERENCES
Campana, S.E., M.C. Annand, and J.I.
McMillan. 1995. Graphical and
statistical methods for determining the
consistency of age determinations.
Trans. Am. Fish. Soc. 124:131-138.
Hoenig, J.M., M.J. Morgan, and C.A.
Brown. 1995. Analysing differences
between two age determination
methods by tests of symmetry. Can. J.
Fish. Aquat. Sci. 52:364-368.
S-Plus. 1999. S-Plus 4.5 Guide to Statistics.
Data Analysis Products Division.
Math Soft, Inc. Seattle, Washington.
Figure 2. Between-reader comparison
of otolith age estimates for bluefish.
1 2 3 4 5 6 7
Reader 1
1
2
3
4
5
6
7
Re
ad
er 2
(117) (27)
(6) (104) (25)
(15) (19) (2)
(4)
(3)
(1)
(1)
Otolith Ages (years)
Figure 3. Year-class distribution for bluefish collected
for ageing in 2004. Distribution is broken down by sex.
1997 1998 1999 2000 2001 2002 2003
Year Class
0
40
80
120
Nu
mb
er
of F
ish
Females n = 204
Males n = 114
Unknown n = 4
Page 18
VMRC summary report on finfish ageing, 2004 bluefish
Center for Quantitative Fisheries Ecology Old Dominion University
Page 4
Table 1. The number of bluefish assigned to each total length-at-age category for 326
fish collected for age determination in Virginia in 2004 (length not reported for 3 fish).Length
1-inch 1 2 3 5 6 7
intervals Totals
7 - 7.99 2 0 0 0 0 0 2
8 - 8.99 1 0 0 0 0 0 1
9 - 9.99 12 0 0 0 0 0 12
10 - 10.99 21 0 0 0 0 0 21
11 - 11.99 23 0 0 0 0 0 23
12 - 12.99 33 0 0 0 0 0 33
13 - 13.99 24 0 0 0 0 0 24
14 - 14.99 18 3 0 0 0 0 21
15 - 15.99 9 8 0 0 0 0 17
16 - 16.99 4 22 3 0 0 0 29
17 - 17.99 1 31 7 0 0 0 39
18 - 18.99 0 51 6 0 0 0 57
19 - 19.99 0 22 5 0 0 0 27
20 - 20.99 0 7 2 0 0 0 9
21 - 21.99 0 1 0 0 0 0 1
22 - 22.99 0 0 1 0 0 0 1
23 - 23.99 0 0 1 0 0 0 1
24 - 24.99 0 0 1 0 0 0 1
27 - 27.99 0 0 0 1 0 0 1
29 - 29.99 0 0 0 1 1 0 2
31 - 31.99 0 0 0 1 0 0 1
Totals 148 145 26 3 1 0 323
Age (years)
Page 19
VMRC summary report on finfish ageing, 2004 bluefish
Center for Quantitative Fisheries Ecology Old Dominion University
Page 5
Table 2. Age-Length key, as proportions-at-age in each 1 inch length-intervals, based
on otolith ages, for bluefish collected for age determination in Virginia during 2004.Length
1-inch 1 2 3 5 6 7
intervals N
7 - 7.99 1.000 0.000 0.000 0.000 0.000 0.000 2
8 - 8.99 1.000 0.000 0.000 0.000 0.000 0.000 1
9 - 9.99 1.000 0.000 0.000 0.000 0.000 0.000 12
10 - 10.99 1.000 0.000 0.000 0.000 0.000 0.000 21
11 - 11.99 1.000 0.000 0.000 0.000 0.000 0.000 23
12 - 12.99 1.000 0.000 0.000 0.000 0.000 0.000 33
13 - 13.99 1.000 0.000 0.000 0.000 0.000 0.000 24
14 - 14.99 0.857 0.143 0.000 0.000 0.000 0.000 21
15 - 15.99 0.529 0.471 0.000 0.000 0.000 0.000 17
16 - 16.99 0.138 0.759 0.103 0.000 0.000 0.000 29
17 - 17.99 0.026 0.795 0.179 0.000 0.000 0.000 39
18 - 18.99 0.000 0.895 0.105 0.000 0.000 0.000 57
19 - 19.99 0.000 0.815 0.185 0.000 0.000 0.000 27
20 - 20.99 0.000 0.778 0.222 0.000 0.000 0.000 9
21 - 21.99 0.000 1.000 0.000 0.000 0.000 0.000 1
22 - 22.99 0.000 0.000 1.000 0.000 0.000 0.000 1
23 - 23.99 0.000 0.000 1.000 0.000 0.000 0.000 1
24 - 24.99 0.000 0.000 1.000 0.000 0.000 0.000 1
27 - 27.99 0.000 0.000 0.000 1.000 0.000 0.000 1
29 - 29.99 0.000 0.000 0.000 0.500 0.500 0.000 2
31 - 31.99 0.000 0.000 0.000 1.000 0.000 0.000 1
Sample Size 323
Age (years)
Page 20
VMRC summary report on finfish ageing, 2004 cobia
Center for Quantitative Fisheries Ecology Old Dominion University
Page 18
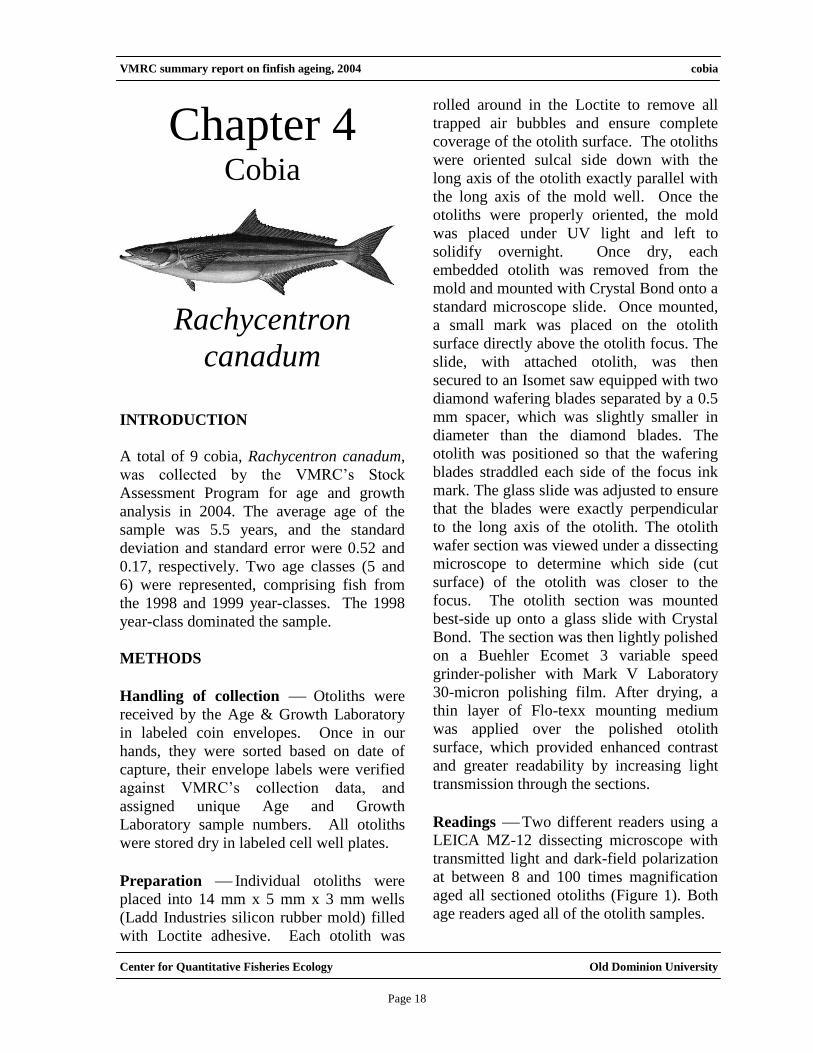
Chapter 4 Cobia
Rachycentron
canadum
INTRODUCTION
A total of 9 cobia, Rachycentron canadum,
was collected by the VMRC’s Stock
Assessment Program for age and growth
analysis in 2004. The average age of the
sample was 5.5 years, and the standard
deviation and standard error were 0.52 and
0.17, respectively. Two age classes (5 and
6) were represented, comprising fish from
the 1998 and 1999 year-classes. The 1998
year-class dominated the sample.
METHODS
Handling of collection Otoliths were
received by the Age & Growth Laboratory
in labeled coin envelopes. Once in our
hands, they were sorted based on date of
capture, their envelope labels were verified
against VMRC’s collection data, and
assigned unique Age and Growth
Laboratory sample numbers. All otoliths
were stored dry in labeled cell well plates.
Preparation Individual otoliths were
placed into 14 mm x 5 mm x 3 mm wells
(Ladd Industries silicon rubber mold) filled
with Loctite adhesive. Each otolith was
rolled around in the Loctite to remove all
trapped air bubbles and ensure complete
coverage of the otolith surface. The otoliths
were oriented sulcal side down with the
long axis of the otolith exactly parallel with
the long axis of the mold well. Once the
otoliths were properly oriented, the mold
was placed under UV light and left to
solidify overnight. Once dry, each
embedded otolith was removed from the
mold and mounted with Crystal Bond onto a
standard microscope slide. Once mounted,
a small mark was placed on the otolith
surface directly above the otolith focus. The
slide, with attached otolith, was then
secured to an Isomet saw equipped with two
diamond wafering blades separated by a 0.5
mm spacer, which was slightly smaller in
diameter than the diamond blades. The
otolith was positioned so that the wafering
blades straddled each side of the focus ink
mark. The glass slide was adjusted to ensure
that the blades were exactly perpendicular
to the long axis of the otolith. The otolith
wafer section was viewed under a dissecting
microscope to determine which side (cut
surface) of the otolith was closer to the
focus. The otolith section was mounted
best-side up onto a glass slide with Crystal
Bond. The section was then lightly polished
on a Buehler Ecomet 3 variable speed
grinder-polisher with Mark V Laboratory
30-micron polishing film. After drying, a
thin layer of Flo-texx mounting medium
was applied over the polished otolith
surface, which provided enhanced contrast
and greater readability by increasing light
transmission through the sections.
Readings Two different readers using a
LEICA MZ-12 dissecting microscope with
transmitted light and dark-field polarization
at between 8 and 100 times magnification
aged all sectioned otoliths (Figure 1). Both
age readers aged all of the otolith samples.
Page 21
VMRC summary report on finfish ageing, 2004 cobia
Center for Quantitative Fisheries Ecology Old Dominion University
Page 19
All samples were aged in chronological
order based on collection date, without
knowledge of previously estimated ages or
the specimen lengths. When the readers’
ages agreed, that age was assigned to the
fish. When the two readers disagreed, both
readers sat down together and re-aged the
fish, again without any knowledge of
previously estimated ages or lengths, and
assigned a final age to the fish. When the
readers were unable to agree on a final age,
the fish was excluded from further analysis.
Comparison Tests Age estimates from
reader 1 were plotted against age estimates
from reader 2 to assess deviation from 1:1
equivalence (Campana et al. 1995). A test
for symmetry was used to detect any
systematic difference between the two
readers (Hoenig et al. 1995). Also, both
readers aged all fish a second time to
measure reader precision and age
reproducibility. To detect any changes or
drift in our ageing methods, both readers re-
aged the otoliths of 50 randomly selected
fish previously aged in 2000. We
considered a reader to be biased if the
readings revealed consistent over or under
ageing.
RESULTS
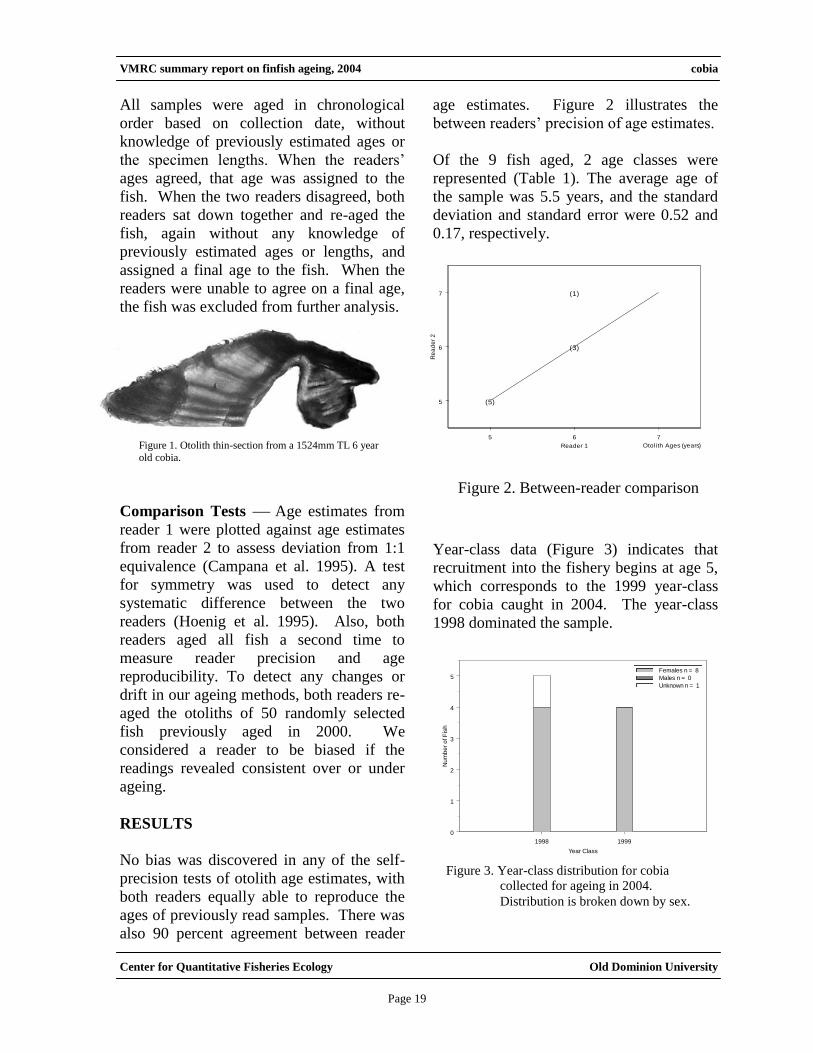
No bias was discovered in any of the self-
precision tests of otolith age estimates, with
both readers equally able to reproduce the
ages of previously read samples. There was
also 90 percent agreement between reader
age estimates. Figure 2 illustrates the
between readers’ precision of age estimates.
Of the 9 fish aged, 2 age classes were
represented (Table 1). The average age of
the sample was 5.5 years, and the standard
deviation and standard error were 0.52 and
0.17, respectively.
Year-class data (Figure 3) indicates that
recruitment into the fishery begins at age 5,
which corresponds to the 1999 year-class
for cobia caught in 2004. The year-class
1998 dominated the sample.
Figure 1. Otolith thin-section from a 1524mm TL 6 year
old cobia.
Figure 2. Between-reader comparison
of otolith age estimates for cobia.
5 6 7
Reader 1
5
6
7
Re
ad
er
2
(5)
(3)
(1)
Otolith Ages (years)
Figure 3. Year-class distribution for cobia
collected for ageing in 2004.
Distribution is broken down by sex.
1998 1999
Year Class
0
1
2
3
4
5
Nu
mb
er
of F
ish
Females n = 8
Males n = 0
Unknown n = 1
Page 22
VMRC summary report on finfish ageing, 2004 cobia
Center for Quantitative Fisheries Ecology Old Dominion University
Page 20
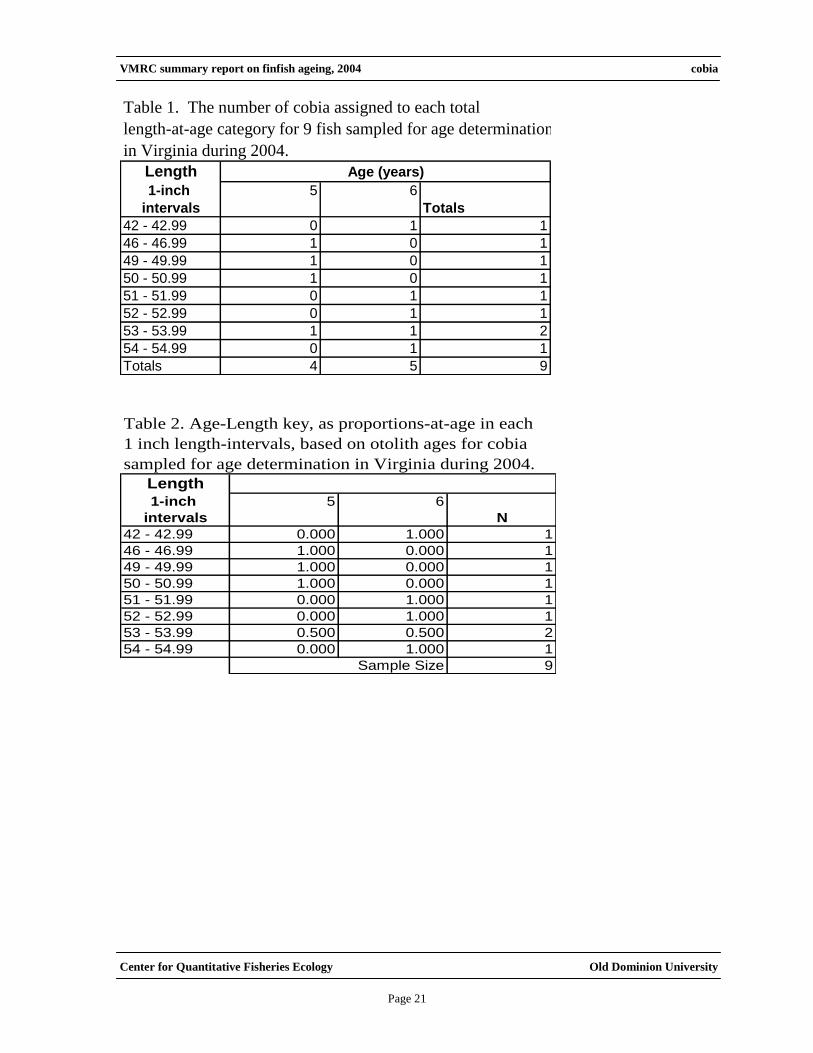
Age-Length-Key In Table 2 we present
an age-length-key that can be used in the
conversion of numbers-at-length in the
estimated catch to numbers-at-age using
otolith ages. The table is based on VMRC’s
stratified sampling of landings by total
length inch intervals.
REFERENCES
Franks, J.S., J.R. Warren, and M.V.
Buchanan. 1999. Age and growth of
cobia, Rachycentron canadum, from
the northeastern Gulf of Mexico. Fish.
Bull. 97:459-471.
Campana, S.E., M.C. Annand, and J.I.
McMillan. 1995. Graphical and
statistical methods for determining the
consistency of age determinations.
Trans. Am. Fish. Soc. 124:131-138.
Hoenig, J.M., M.J. Morgan, and C.A.
Brown. 1995. Analysing differences
between two age determination
methods by tests of symmetry. Can. J.
Fish. Aquat. Sci. 52:364-368.
S-Plus. 1999. S-Plus 4.5 Guide to Statistics.
Data Analysis Products Division.
Math Soft, Inc. Seattle, Washington.
Page 23
VMRC summary report on finfish ageing, 2004 cobia
Center for Quantitative Fisheries Ecology Old Dominion University
Page 21
Table 1. The number of cobia assigned to each total
length-at-age category for 9 fish sampled for age determination
in Virginia during 2004.
Length
1-inch 5 6
intervals Totals
42 - 42.99 0 1 1
46 - 46.99 1 0 1
49 - 49.99 1 0 1
50 - 50.99 1 0 1
51 - 51.99 0 1 1
52 - 52.99 0 1 1
53 - 53.99 1 1 2
54 - 54.99 0 1 1
Totals 4 5 9
Age (years)
Table 2. Age-Length key, as proportions-at-age in each
1 inch length-intervals, based on otolith ages for cobia
sampled for age determination in Virginia during 2004.
Length
1-inch 5 6
intervals N
42 - 42.99 0.000 1.000 1
46 - 46.99 1.000 0.000 1
49 - 49.99 1.000 0.000 1
50 - 50.99 1.000 0.000 1
51 - 51.99 0.000 1.000 1
52 - 52.99 0.000 1.000 1
53 - 53.99 0.500 0.500 2
54 - 54.99 0.000 1.000 1
Sample Size 9
Page 24
VMRC summary report on finfish ageing, 2004 red drum
Center for Quantitative Fisheries Ecology Old Dominion University
Page 18
Chapter 5 Red Drum
Sciaenops
ocellatus
INTRODUCTION
A total of 6 red drum, Sciaenops ocellatus,
was collected by the VMRC’s Stock
Assessment Program for age and growth
analysis in 2004. The average age of the
sample was 2.8 years, and the standard
deviation and standard error were 0.4 and
0.16, respectively. Two age classes (2 and
3) were represented, comprising fish from
the 2001-2002 year-classes. All of the fish
were three years-of-age or less.
METHODS
Handling of collection Otoliths were
received by the Age & Growth Laboratory
in labeled coin envelopes. Once in our
hands, they were sorted based on date of
capture, their envelope labels were verified
against VMRC’s collection data, and
assigned unique Age and Growth
Laboratory sample numbers. All otoliths
were stored dry in their original labeled coin
envelopes.
Preparation Otoliths were processed for
ageing following the methods described in
Bobko (1991) for black drum. Briefly,
otoliths were mounted on glass slides with
Crystal Bond. At least two serial transverse
sections were cut through the nucleus of
each otolith with a Buehler Isomet low-
speed saw equipped with a three inch, fine
grit Norton diamond-wafering blade. After
drying, a thin layer of Flo-texx mounting
medium was applied to the otolith section to
increase light transmission through the
translucent zones, which provided enhanced
contrast and greater readability.
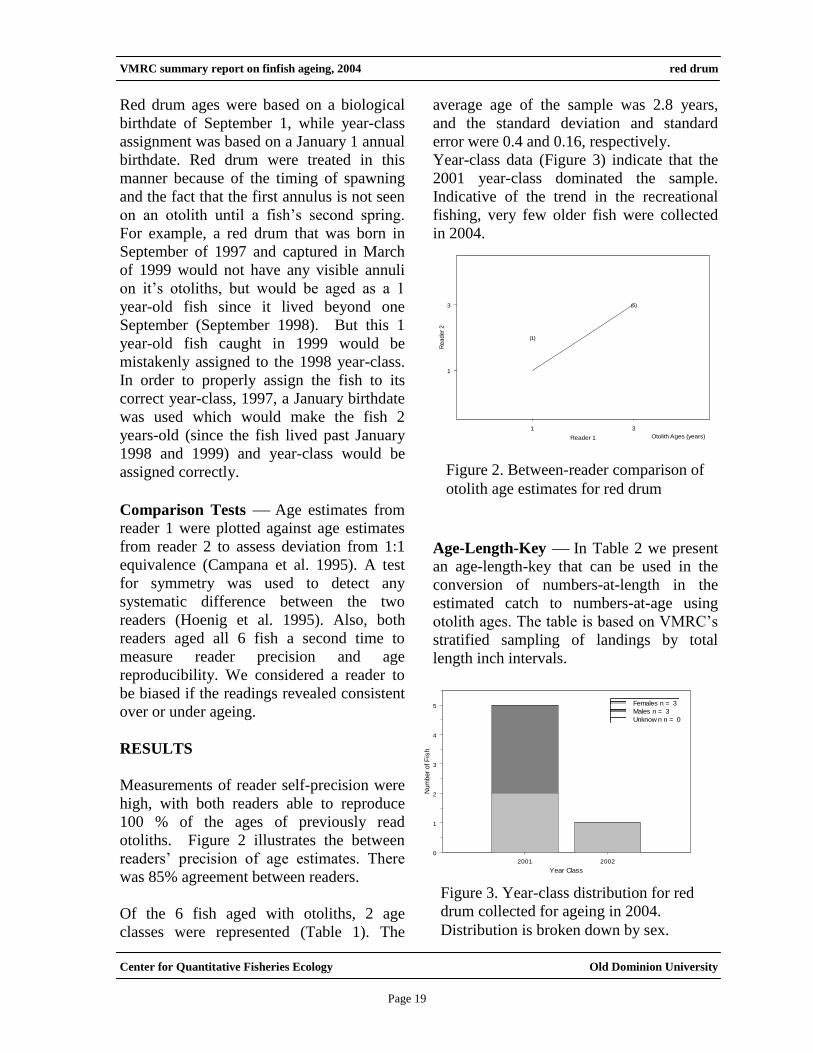
Readings Two different readers aged all
sectioned otoliths using a Leica MZ-12
dissecting microscope with transmitted light
and dark-field polarization at between 8 and
20 times magnification (Figure 1).
All samples were aged in chronological
order based on collection date, without
knowledge of previously estimated ages or
the specimen lengths. When the readers’
ages agreed, that age was assigned to the
fish. When the two readers disagreed, both
readers sat down together and re-aged the
fish, again without any knowledge of
previously estimated ages or lengths, and
assigned a final age to the fish. When the
readers were unable to agree on a final age,
the fish was excluded from further analysis.
Figure 1. Otolith thin-section from 26 year old red
drum.
Page 25
VMRC summary report on finfish ageing, 2004 red drum
Center for Quantitative Fisheries Ecology Old Dominion University
Page 19
Red drum ages were based on a biological
birthdate of September 1, while year-class
assignment was based on a January 1 annual
birthdate. Red drum were treated in this
manner because of the timing of spawning
and the fact that the first annulus is not seen
on an otolith until a fish’s second spring.
For example, a red drum that was born in
September of 1997 and captured in March
of 1999 would not have any visible annuli
on it’s otoliths, but would be aged as a 1
year-old fish since it lived beyond one
September (September 1998). But this 1
year-old fish caught in 1999 would be
mistakenly assigned to the 1998 year-class.
In order to properly assign the fish to its
correct year-class, 1997, a January birthdate
was used which would make the fish 2
years-old (since the fish lived past January
1998 and 1999) and year-class would be
assigned correctly.
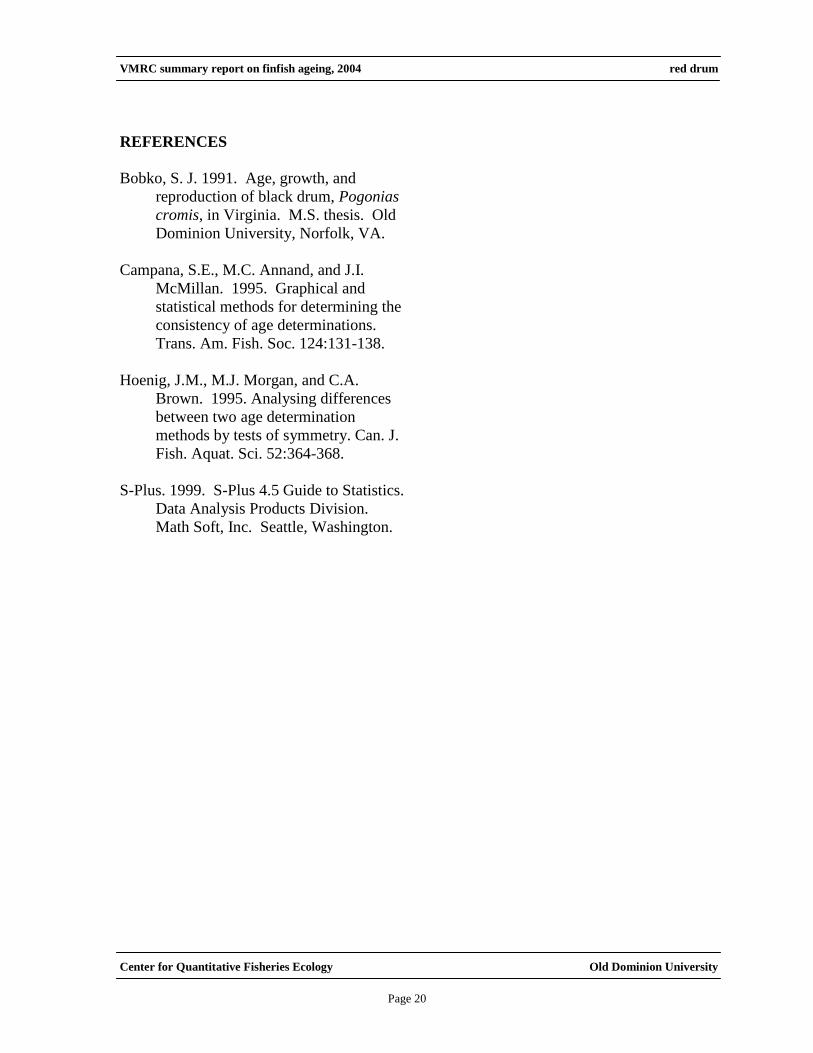
Comparison Tests Age estimates from
reader 1 were plotted against age estimates
from reader 2 to assess deviation from 1:1
equivalence (Campana et al. 1995). A test
for symmetry was used to detect any
systematic difference between the two
readers (Hoenig et al. 1995). Also, both
readers aged all 6 fish a second time to
measure reader precision and age
reproducibility. We considered a reader to
be biased if the readings revealed consistent
over or under ageing.
RESULTS
Measurements of reader self-precision were
high, with both readers able to reproduce
100 % of the ages of previously read
otoliths. Figure 2 illustrates the between
readers’ precision of age estimates. There
was 85% agreement between readers.
Of the 6 fish aged with otoliths, 2 age
classes were represented (Table 1). The
average age of the sample was 2.8 years,
and the standard deviation and standard
error were 0.4 and 0.16, respectively.
Year-class data (Figure 3) indicate that the
2001 year-class dominated the sample.
Indicative of the trend in the recreational
fishing, very few older fish were collected
in 2004.
Age-Length-Key In Table 2 we present
an age-length-key that can be used in the
conversion of numbers-at-length in the
estimated catch to numbers-at-age using
otolith ages. The table is based on VMRC’s
stratified sampling of landings by total
length inch intervals.
1 3
Reader 1
1
3
Re
ad
er
2
(1)
(5)
Otolith Ages (years)
Figure 2. Between-reader comparison of
otolith age estimates for red drum
2001 2002
Year Class
0
1
2
3
4
5
Num
ber
of F
ish
Females n = 3
Males n = 3
Unknow n n = 0
Figure 3. Year-class distribution for red
drum collected for ageing in 2004.
Distribution is broken down by sex.
Page 26
VMRC summary report on finfish ageing, 2004 red drum
Center for Quantitative Fisheries Ecology Old Dominion University
Page 20
REFERENCES
Bobko, S. J. 1991. Age, growth, and
reproduction of black drum, Pogonias
cromis, in Virginia. M.S. thesis. Old
Dominion University, Norfolk, VA.
Campana, S.E., M.C. Annand, and J.I.
McMillan. 1995. Graphical and
statistical methods for determining the
consistency of age determinations.
Trans. Am. Fish. Soc. 124:131-138.
Hoenig, J.M., M.J. Morgan, and C.A.
Brown. 1995. Analysing differences
between two age determination
methods by tests of symmetry. Can. J.
Fish. Aquat. Sci. 52:364-368.
S-Plus. 1999. S-Plus 4.5 Guide to Statistics.
Data Analysis Products Division.
Math Soft, Inc. Seattle, Washington.
Page 27
VMRC summary report on finfish ageing, 2004 red drum
Center for Quantitative Fisheries Ecology Old Dominion University
Page 21
Table 1. The number of red drum assigned to each total length-at-age
category for 6 fish sampled for age determination in Virginia during 2004.
Length Age (years)
1-inch 2 3
intervals Totals
18 - 18.99 1 0 1
24 - 24.99 0 2 2
25 - 25.99 0 3 3
Totals 1 5 6
Table 2. Age-Length key, as proportions-at-age in each 1 inch length-intervals, based
on otolith ages for red drum sampled for age determination in Virginia during 2004.
Length Age (years)
1-inch 2 3
intervals N
18 - 18.99 1.000 0.000 1
24 - 24.99 0.000 1.000 2
25 - 25.99 0.000 1.000 3
Sample Size 6
Page 28
VMRC summary report on finfish ageing, 2004 spadefish
Center for Quantitative Fisheries Ecology Old Dominion University
Page 22
Chapter 6 Atlantic Spadefish
Chaetodipterus
faber
INTRODUCTION
A total of 353 spadefish, Chaetodipterus
faber, was collected for age and growth
analysis in 2004. We were unable to age
two fish due to poor quality of their otoliths.
The average age of the sample was 2.7
years, and the standard deviation and
standard error were 2.4 and 0.1,
respectively. Sixteen age classes (1 to 3 and
5 to 16 and 20) were represented,
comprising fish from the 1984 and 1988-
1999 and 2001-2003 year-classes.
METHODS
Handling of collection Otoliths were
received by the Age & Growth Laboratory
in labeled coin envelopes. Once in our
hands, they were sorted based on date of
capture, their envelope labels were verified
against VMRC’s collection data, and
assigned unique Age and Growth
Laboratory sample numbers. All otoliths
were stored dry in labeled cell well trays.
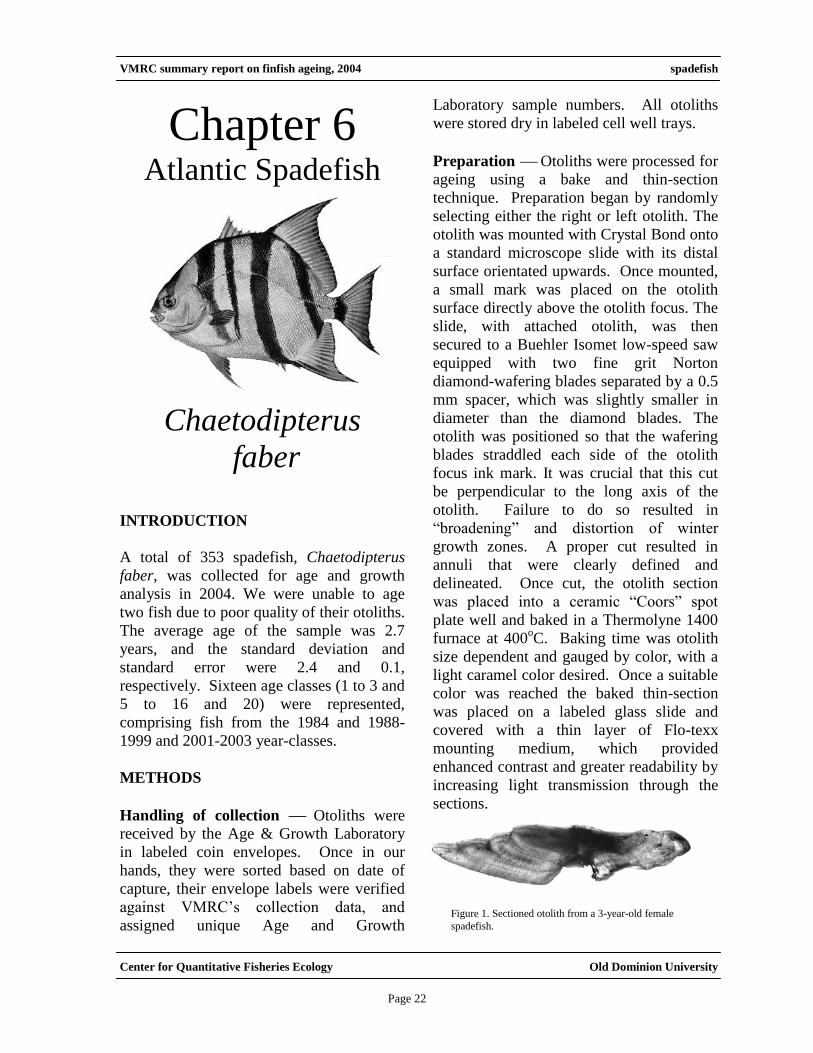
Preparation Otoliths were processed for
ageing using a bake and thin-section
technique. Preparation began by randomly
selecting either the right or left otolith. The
otolith was mounted with Crystal Bond onto
a standard microscope slide with its distal
surface orientated upwards. Once mounted,
a small mark was placed on the otolith
surface directly above the otolith focus. The
slide, with attached otolith, was then
secured to a Buehler Isomet low-speed saw
equipped with two fine grit Norton
diamond-wafering blades separated by a 0.5
mm spacer, which was slightly smaller in
diameter than the diamond blades. The
otolith was positioned so that the wafering
blades straddled each side of the otolith
focus ink mark. It was crucial that this cut
be perpendicular to the long axis of the
otolith. Failure to do so resulted in
“broadening” and distortion of winter
growth zones. A proper cut resulted in
annuli that were clearly defined and
delineated. Once cut, the otolith section
was placed into a ceramic “Coors” spot
plate well and baked in a Thermolyne 1400
furnace at 400oC. Baking time was otolith
size dependent and gauged by color, with a
light caramel color desired. Once a suitable
color was reached the baked thin-section
was placed on a labeled glass slide and
covered with a thin layer of Flo-texx
mounting medium, which provided
enhanced contrast and greater readability by
increasing light transmission through the
sections.
Figure 1. Sectioned otolith from a 3-year-old female
spadefish.
Page 29
VMRC summary report on finfish ageing, 2004 spadefish
Center for Quantitative Fisheries Ecology Old Dominion University
Page 23
Readings Two different readers aged all
sectioned otoliths using a Leica MZ-12
dissecting microscope with transmitted light
and dark-field polarization at between 8 and
100 times magnification (Figure 1).
All samples were aged in chronological
order based on collection date, without
knowledge of previously estimated ages or
the specimen lengths. When the readers’
ages agreed, that age was assigned to the
fish. When the two readers disagreed, both
readers sat down together and re-aged the
fish, again without any knowledge of
previously estimated ages or lengths, and
assigned a final age to the fish. When the
readers were unable to agree on a final age,
the fish was excluded from further analysis.
Comparison Tests Age estimates from
reader 1 were plotted against age estimates
from reader 2 to assess deviation from 1:1
equivalence (Campana et al. 1995). A test
for symmetry was used to detect any
systematic difference between the two
readers (Hoenig et al. 1995). Also, a random
sub-sample of 50 fish was selected for
second readings to measure reader precision
and age reproducibility. We considered a
reader to be biased if the readings revealed
consistent over or under ageing.
RESULTS
Measurements of reader self-precision were
high, with both readers able to reproduce
the ages of previously read otoliths (reader
1’s CV = 5.0% and reader 2’s CV = 2.2%).
Figure 2 illustrates the between readers’
precision of age estimates, with only four
age difference greater than one year. There
was no evidence of systematic disagreement
between reader 1 and reader 2 (test of
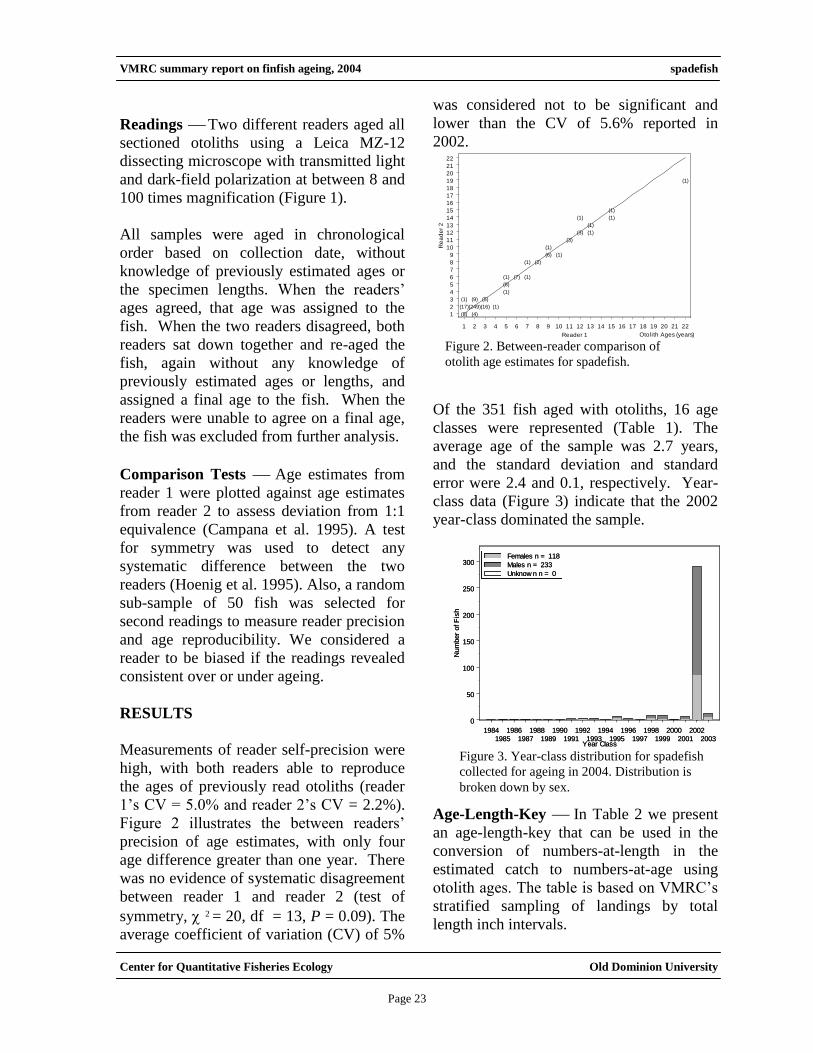
symmetry, 2 = 20, df = 13, P = 0.09). The
average coefficient of variation (CV) of 5%
was considered not to be significant and
lower than the CV of 5.6% reported in
2002.
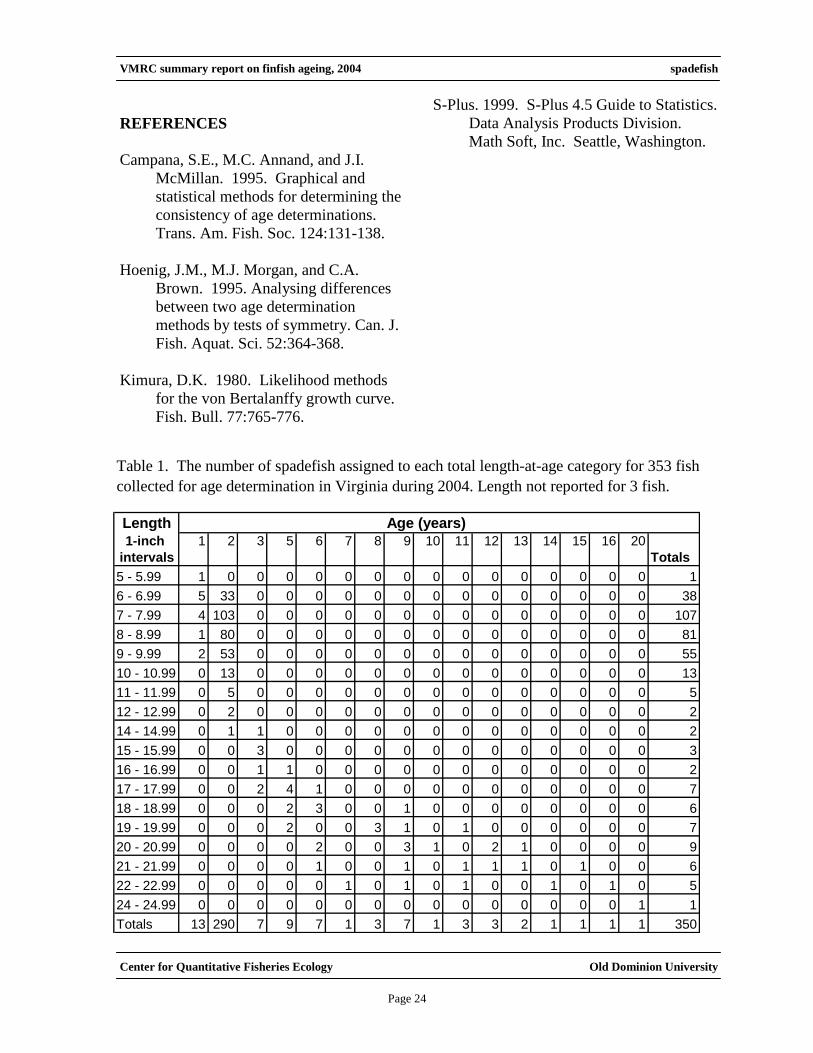
Of the 351 fish aged with otoliths, 16 age
classes were represented (Table 1). The
average age of the sample was 2.7 years,
and the standard deviation and standard
error were 2.4 and 0.1, respectively. Year-
class data (Figure 3) indicate that the 2002
year-class dominated the sample.
Age-Length-Key In Table 2 we present
an age-length-key that can be used in the
conversion of numbers-at-length in the
estimated catch to numbers-at-age using
otolith ages. The table is based on VMRC’s
stratified sampling of landings by total
length inch intervals.
1984
1985
1986
1987
1988
1989
1990
1991
1992
1993
1994
1995
1996
1997
1998
1999
2000
2001
2002
2003Year Class
0
50
100
150
200
250
300
Num
ber
of F
ish
Females n = 118
Males n = 233
Unknow n n = 0
1984
1985
1986
1987
1988
1989
1990
1991
1992
1993
1994
1995
1996
1997
1998
1999
2000
2001
2002
2003Year Class
0
50
100
150
200
250
300
Num
ber
of F
ish
Females n = 118
Males n = 233
Unknow n n = 0
Figure 3. Year-class distribution for spadefish
collected for ageing in 2004. Distribution is
broken down by sex.
Figure 2. Between-reader comparison of
otolith age estimates for spadefish.
1 2 3 4 5 6 7 8 9 10 11 12 13 14 15 16 17 18 19 20 21 22
Reader 1
1
2
3
4
5
6
7
8
9
10
11
12
13
14
15
16
17
18
19
20
21
22
Re
ad
er
2
(8) (4)
(17)(249)(16) (1)
(1) (9) (5)
(1)
(8)
(1) (7) (1)
(1) (2)
(6) (1)
(1)
(3)
(3) (1)
(1)
(1) (1)
(1)
(1)
Otolith Ages (years)
Page 30
VMRC summary report on finfish ageing, 2004 spadefish
Center for Quantitative Fisheries Ecology Old Dominion University
Page 24
REFERENCES
Campana, S.E., M.C. Annand, and J.I.
McMillan. 1995. Graphical and
statistical methods for determining the
consistency of age determinations.
Trans. Am. Fish. Soc. 124:131-138.
Hoenig, J.M., M.J. Morgan, and C.A.
Brown. 1995. Analysing differences
between two age determination
methods by tests of symmetry. Can. J.
Fish. Aquat. Sci. 52:364-368.
Kimura, D.K. 1980. Likelihood methods
for the von Bertalanffy growth curve.
Fish. Bull. 77:765-776.
S-Plus. 1999. S-Plus 4.5 Guide to Statistics.
Data Analysis Products Division.
Math Soft, Inc. Seattle, Washington.
Table 1. The number of spadefish assigned to each total length-at-age category for 353 fish
collected for age determination in Virginia during 2004. Length not reported for 3 fish.
Length Age (years)
1-inch 1 2 3 5 6 7 8 9 10 11 12 13 14 15 16 20
intervals Totals
5 - 5.99 1 0 0 0 0 0 0 0 0 0 0 0 0 0 0 0 1
6 - 6.99 5 33 0 0 0 0 0 0 0 0 0 0 0 0 0 0 38
7 - 7.99 4 103 0 0 0 0 0 0 0 0 0 0 0 0 0 0 107
8 - 8.99 1 80 0 0 0 0 0 0 0 0 0 0 0 0 0 0 81
9 - 9.99 2 53 0 0 0 0 0 0 0 0 0 0 0 0 0 0 55
10 - 10.99 0 13 0 0 0 0 0 0 0 0 0 0 0 0 0 0 13
11 - 11.99 0 5 0 0 0 0 0 0 0 0 0 0 0 0 0 0 5
12 - 12.99 0 2 0 0 0 0 0 0 0 0 0 0 0 0 0 0 2
14 - 14.99 0 1 1 0 0 0 0 0 0 0 0 0 0 0 0 0 2
15 - 15.99 0 0 3 0 0 0 0 0 0 0 0 0 0 0 0 0 3
16 - 16.99 0 0 1 1 0 0 0 0 0 0 0 0 0 0 0 0 2
17 - 17.99 0 0 2 4 1 0 0 0 0 0 0 0 0 0 0 0 7
18 - 18.99 0 0 0 2 3 0 0 1 0 0 0 0 0 0 0 0 6
19 - 19.99 0 0 0 2 0 0 3 1 0 1 0 0 0 0 0 0 7
20 - 20.99 0 0 0 0 2 0 0 3 1 0 2 1 0 0 0 0 9
21 - 21.99 0 0 0 0 1 0 0 1 0 1 1 1 0 1 0 0 6
22 - 22.99 0 0 0 0 0 1 0 1 0 1 0 0 1 0 1 0 5
24 - 24.99 0 0 0 0 0 0 0 0 0 0 0 0 0 0 0 1 1
Totals 13 290 7 9 7 1 3 7 1 3 3 2 1 1 1 1 350
Page 31
VMRC summary report on finfish ageing, 2004 spadefish
Center for Quantitative Fisheries Ecology Old Dominion University
Page 25
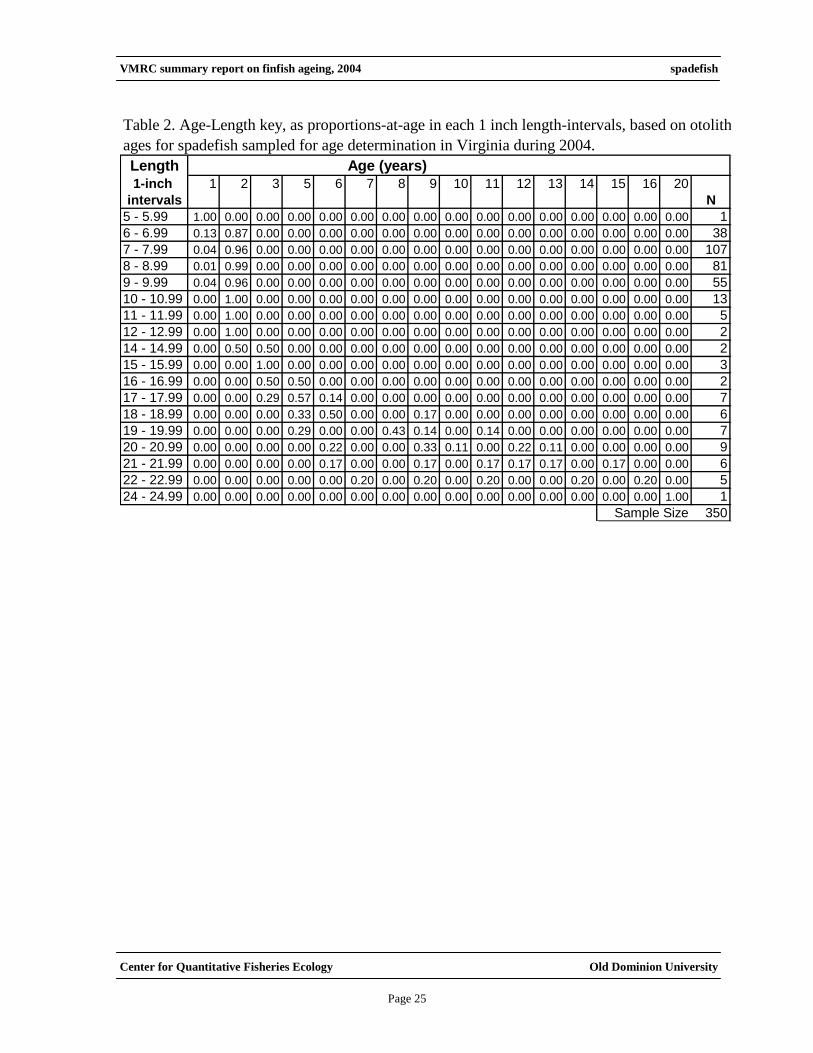
Table 2. Age-Length key, as proportions-at-age in each 1 inch length-intervals, based on otolith
ages for spadefish sampled for age determination in Virginia during 2004.
Length Age (years)
1-inch 1 2 3 5 6 7 8 9 10 11 12 13 14 15 16 20
intervals N
5 - 5.99 1.00 0.00 0.00 0.00 0.00 0.00 0.00 0.00 0.00 0.00 0.00 0.00 0.00 0.00 0.00 0.00 1
6 - 6.99 0.13 0.87 0.00 0.00 0.00 0.00 0.00 0.00 0.00 0.00 0.00 0.00 0.00 0.00 0.00 0.00 38
7 - 7.99 0.04 0.96 0.00 0.00 0.00 0.00 0.00 0.00 0.00 0.00 0.00 0.00 0.00 0.00 0.00 0.00 107
8 - 8.99 0.01 0.99 0.00 0.00 0.00 0.00 0.00 0.00 0.00 0.00 0.00 0.00 0.00 0.00 0.00 0.00 81
9 - 9.99 0.04 0.96 0.00 0.00 0.00 0.00 0.00 0.00 0.00 0.00 0.00 0.00 0.00 0.00 0.00 0.00 55
10 - 10.99 0.00 1.00 0.00 0.00 0.00 0.00 0.00 0.00 0.00 0.00 0.00 0.00 0.00 0.00 0.00 0.00 13
11 - 11.99 0.00 1.00 0.00 0.00 0.00 0.00 0.00 0.00 0.00 0.00 0.00 0.00 0.00 0.00 0.00 0.00 5
12 - 12.99 0.00 1.00 0.00 0.00 0.00 0.00 0.00 0.00 0.00 0.00 0.00 0.00 0.00 0.00 0.00 0.00 2
14 - 14.99 0.00 0.50 0.50 0.00 0.00 0.00 0.00 0.00 0.00 0.00 0.00 0.00 0.00 0.00 0.00 0.00 2
15 - 15.99 0.00 0.00 1.00 0.00 0.00 0.00 0.00 0.00 0.00 0.00 0.00 0.00 0.00 0.00 0.00 0.00 3
16 - 16.99 0.00 0.00 0.50 0.50 0.00 0.00 0.00 0.00 0.00 0.00 0.00 0.00 0.00 0.00 0.00 0.00 2
17 - 17.99 0.00 0.00 0.29 0.57 0.14 0.00 0.00 0.00 0.00 0.00 0.00 0.00 0.00 0.00 0.00 0.00 7
18 - 18.99 0.00 0.00 0.00 0.33 0.50 0.00 0.00 0.17 0.00 0.00 0.00 0.00 0.00 0.00 0.00 0.00 6
19 - 19.99 0.00 0.00 0.00 0.29 0.00 0.00 0.43 0.14 0.00 0.14 0.00 0.00 0.00 0.00 0.00 0.00 7
20 - 20.99 0.00 0.00 0.00 0.00 0.22 0.00 0.00 0.33 0.11 0.00 0.22 0.11 0.00 0.00 0.00 0.00 9
21 - 21.99 0.00 0.00 0.00 0.00 0.17 0.00 0.00 0.17 0.00 0.17 0.17 0.17 0.00 0.17 0.00 0.00 6
22 - 22.99 0.00 0.00 0.00 0.00 0.00 0.20 0.00 0.20 0.00 0.20 0.00 0.00 0.20 0.00 0.20 0.00 5
24 - 24.99 0.00 0.00 0.00 0.00 0.00 0.00 0.00 0.00 0.00 0.00 0.00 0.00 0.00 0.00 0.00 1.00 1
Sample Size 350
Page 32
VMRC summary report on finfish ageing, 2004 Spanish mackerel
Center for Quantitative Fisheries Ecology Old Dominion University
Page 26
Chapter 7 Spanish Mackerel
Scomberomorous
maculatus INTRODUCTION
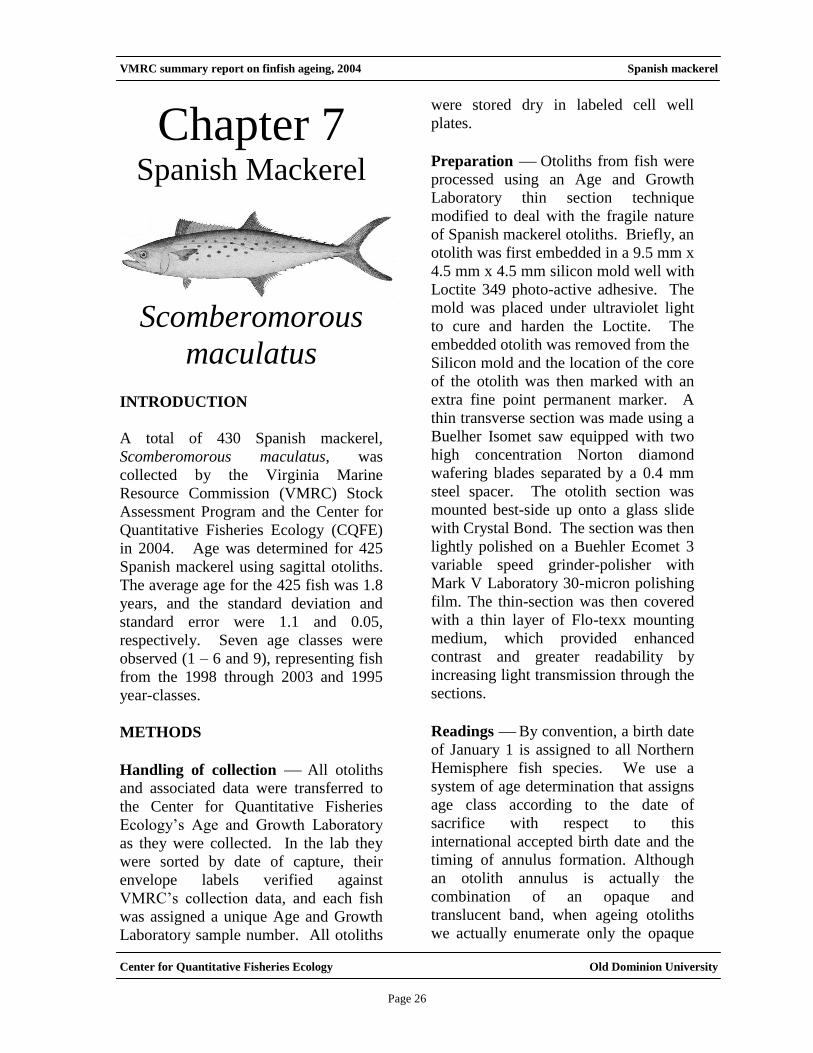
A total of 430 Spanish mackerel,
Scomberomorous maculatus, was
collected by the Virginia Marine
Resource Commission (VMRC) Stock
Assessment Program and the Center for
Quantitative Fisheries Ecology (CQFE)
in 2004. Age was determined for 425
Spanish mackerel using sagittal otoliths.
The average age for the 425 fish was 1.8
years, and the standard deviation and
standard error were 1.1 and 0.05,
respectively. Seven age classes were
observed (1 – 6 and 9), representing fish
from the 1998 through 2003 and 1995
year-classes.
METHODS
Handling of collection All otoliths
and associated data were transferred to
the Center for Quantitative Fisheries
Ecology’s Age and Growth Laboratory
as they were collected. In the lab they
were sorted by date of capture, their
envelope labels verified against
VMRC’s collection data, and each fish
was assigned a unique Age and Growth
Laboratory sample number. All otoliths
were stored dry in labeled cell well
plates.
Preparation Otoliths from fish were
processed using an Age and Growth
Laboratory thin section technique
modified to deal with the fragile nature
of Spanish mackerel otoliths. Briefly, an
otolith was first embedded in a 9.5 mm x
4.5 mm x 4.5 mm silicon mold well with
Loctite 349 photo-active adhesive. The
mold was placed under ultraviolet light
to cure and harden the Loctite. The
embedded otolith was removed from the
Silicon mold and the location of the core
of the otolith was then marked with an
extra fine point permanent marker. A
thin transverse section was made using a
Buelher Isomet saw equipped with two
high concentration Norton diamond
wafering blades separated by a 0.4 mm
steel spacer. The otolith section was
mounted best-side up onto a glass slide
with Crystal Bond. The section was then
lightly polished on a Buehler Ecomet 3
variable speed grinder-polisher with
Mark V Laboratory 30-micron polishing
film. The thin-section was then covered
with a thin layer of Flo-texx mounting
medium, which provided enhanced
contrast and greater readability by
increasing light transmission through the
sections.
Readings By convention, a birth date
of January 1 is assigned to all Northern
Hemisphere fish species. We use a
system of age determination that assigns
age class according to the date of
sacrifice with respect to this
international accepted birth date and the
timing of annulus formation. Although
an otolith annulus is actually the
combination of an opaque and
translucent band, when ageing otoliths
we actually enumerate only the opaque
Page 33
VMRC summary report on finfish ageing, 2004 Spanish mackerel
Center for Quantitative Fisheries Ecology Old Dominion University
Page 27
bands, but still refer to them as annuli.
Spanish mackerel otolith annulus
formation occurs between the months of
April and June, with younger fish
tending to lay down annuli earlier than
older fish. Fish age is written first
followed by the actual number of annuli
visible listed within parentheses (e.g.,
3(3)). The presence of a “+” after the
number in the parentheses indicates new
growth, or “plus growth” visible on the
structure’s margin. Using this method, a
fish sacrificed in January before annulus
formation with three visible annuli
would be assigned the same age, 4(3+),
as a fish with four visible annuli
sacrificed in August after annulus
formation, 4(4+). Year-class is then
assigned once the reader determines the
fish’s age and takes into account the year
of capture.
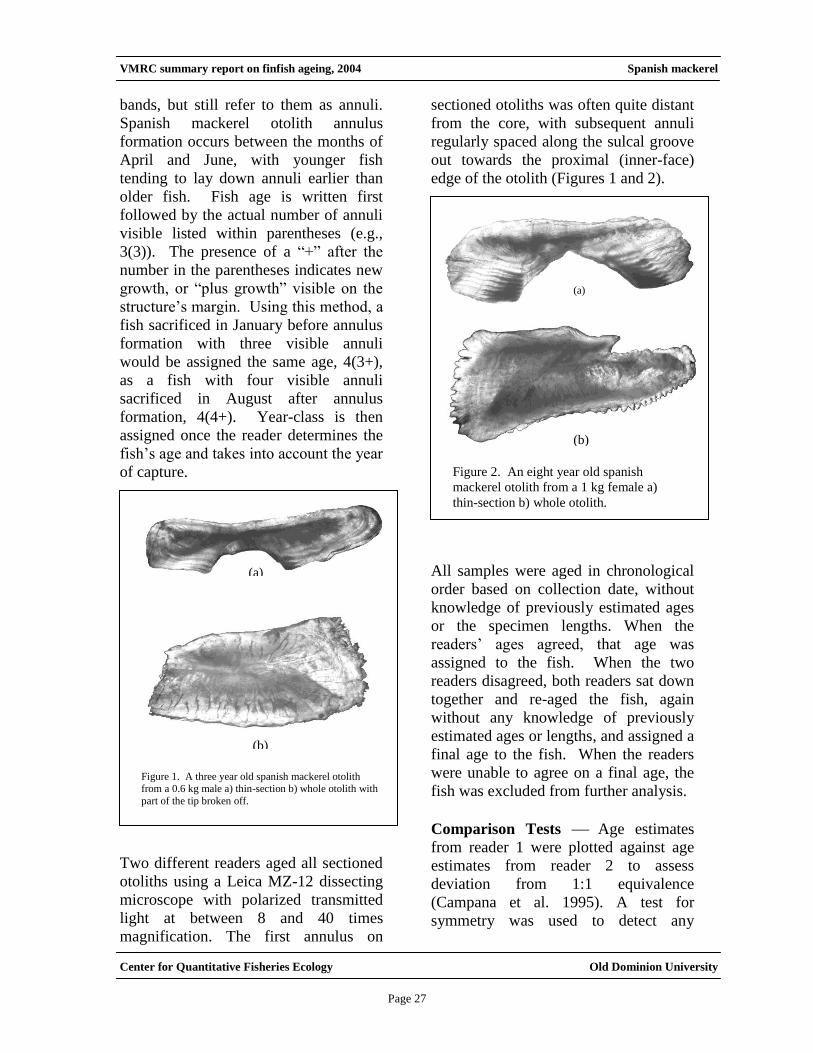
Two different readers aged all sectioned
otoliths using a Leica MZ-12 dissecting
microscope with polarized transmitted
light at between 8 and 40 times
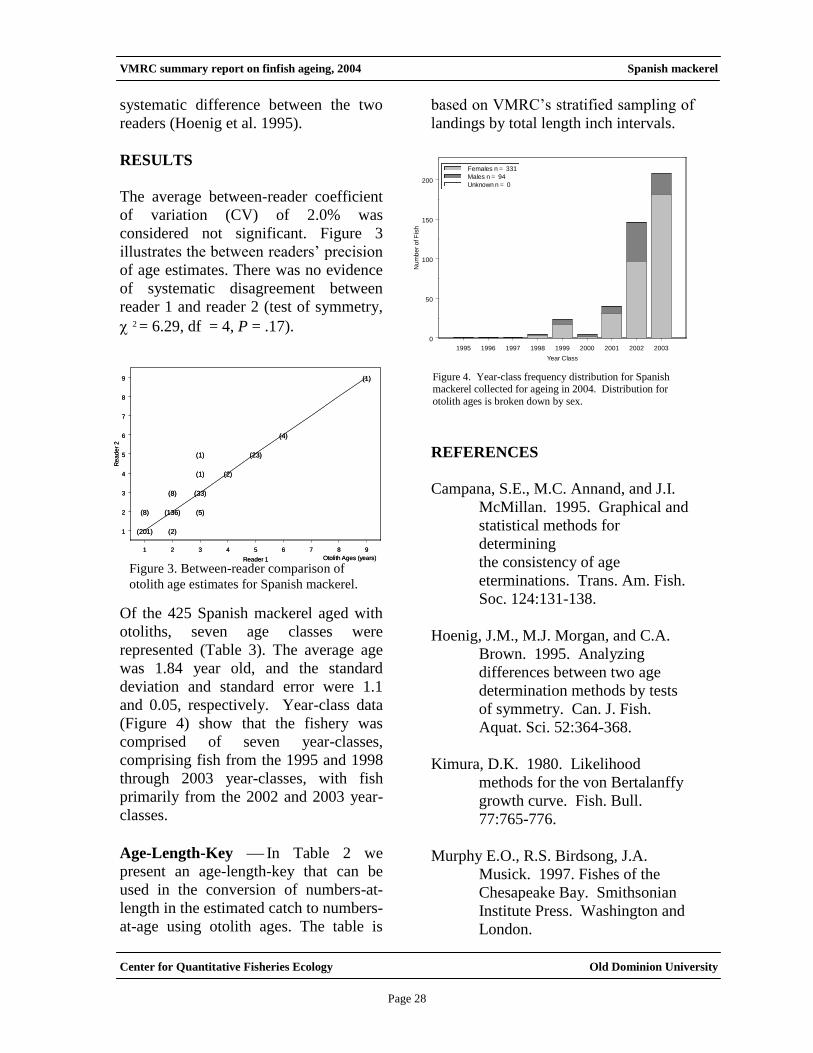
magnification. The first annulus on
sectioned otoliths was often quite distant
from the core, with subsequent annuli
regularly spaced along the sulcal groove
out towards the proximal (inner-face)
edge of the otolith (Figures 1 and 2).
All samples were aged in chronological
order based on collection date, without
knowledge of previously estimated ages
or the specimen lengths. When the
readers’ ages agreed, that age was
assigned to the fish. When the two
readers disagreed, both readers sat down
together and re-aged the fish, again
without any knowledge of previously
estimated ages or lengths, and assigned a
final age to the fish. When the readers
were unable to agree on a final age, the
fish was excluded from further analysis.
Comparison Tests Age estimates
from reader 1 were plotted against age
estimates from reader 2 to assess
deviation from 1:1 equivalence
(Campana et al. 1995). A test for
symmetry was used to detect any
(a)
(b)
Figure 2. An eight year old spanish
mackerel otolith from a 1 kg female a)
thin-section b) whole otolith.
(a)
(b)
Figure 1. A three year old spanish mackerel otolith from a 0.6 kg male a) thin-section b) whole otolith with
part of the tip broken off.
Page 34
VMRC summary report on finfish ageing, 2004 Spanish mackerel
Center for Quantitative Fisheries Ecology Old Dominion University
Page 28
systematic difference between the two
readers (Hoenig et al. 1995).
RESULTS
The average between-reader coefficient
of variation (CV) of 2.0% was
considered not significant. Figure 3
illustrates the between readers’ precision
of age estimates. There was no evidence
of systematic disagreement between
reader 1 and reader 2 (test of symmetry,
2 = 6.29, df = 4, P = .17).
Of the 425 Spanish mackerel aged with
otoliths, seven age classes were
represented (Table 3). The average age
was 1.84 year old, and the standard
deviation and standard error were 1.1
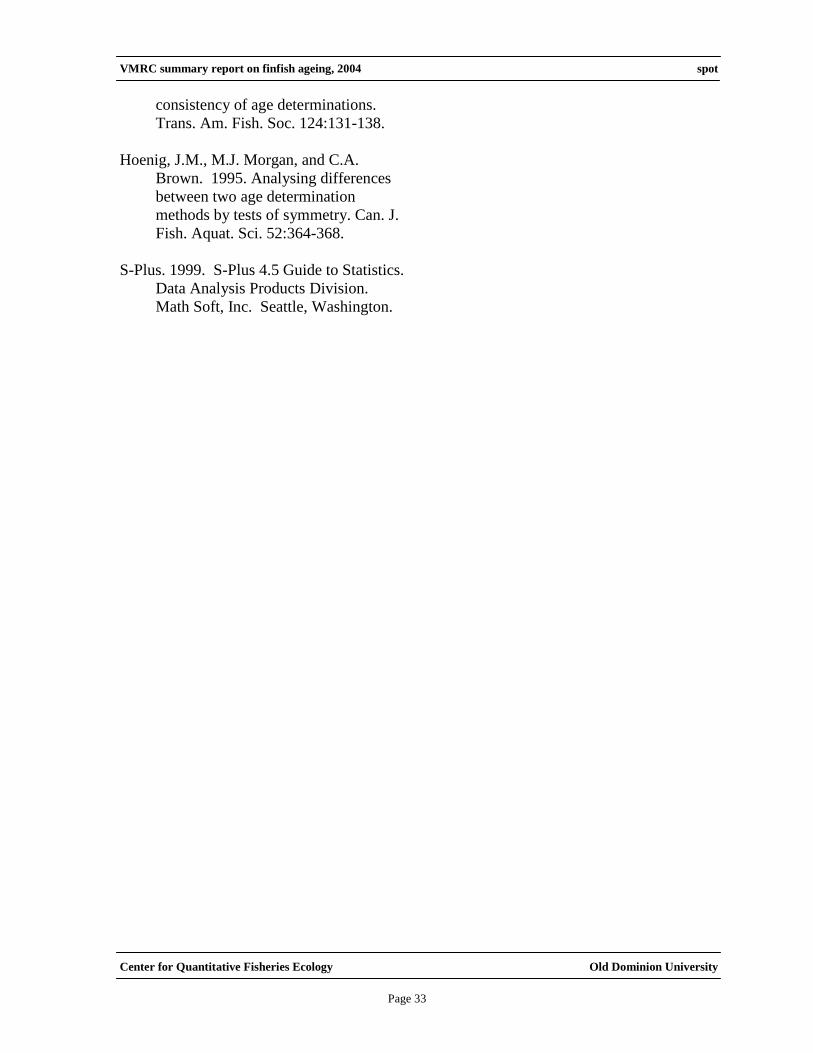
and 0.05, respectively. Year-class data
(Figure 4) show that the fishery was
comprised of seven year-classes,
comprising fish from the 1995 and 1998
through 2003 year-classes, with fish
primarily from the 2002 and 2003 year-
classes.
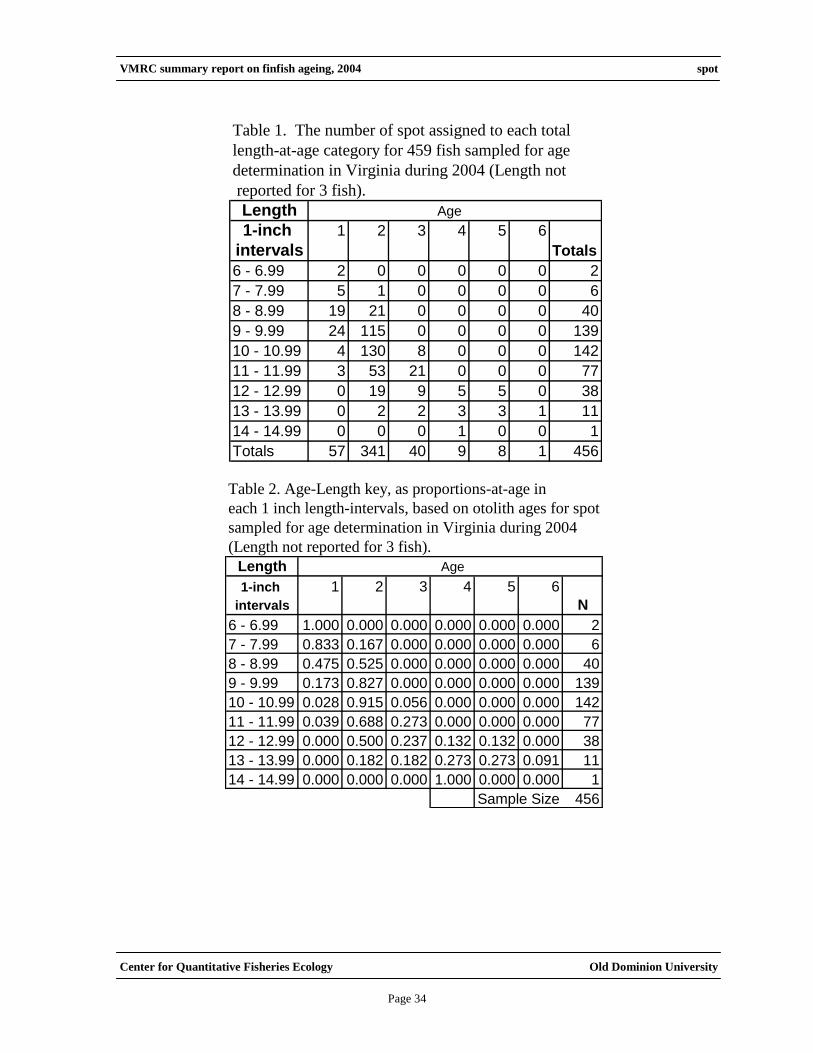
Age-Length-Key In Table 2 we
present an age-length-key that can be
used in the conversion of numbers-at-
length in the estimated catch to numbers-
at-age using otolith ages. The table is
based on VMRC’s stratified sampling of
landings by total length inch intervals.
REFERENCES
Campana, S.E., M.C. Annand, and J.I.
McMillan. 1995. Graphical and
statistical methods for
determining
the consistency of age
eterminations. Trans. Am. Fish.
Soc. 124:131-138.
Hoenig, J.M., M.J. Morgan, and C.A.
Brown. 1995. Analyzing
differences between two age
determination methods by tests
of symmetry. Can. J. Fish.
Aquat. Sci. 52:364-368.
Kimura, D.K. 1980. Likelihood
methods for the von Bertalanffy
growth curve. Fish. Bull.
77:765-776.
Murphy E.O., R.S. Birdsong, J.A.
Musick. 1997. Fishes of the
Chesapeake Bay. Smithsonian
Institute Press. Washington and
London.
Figure 3. Between-reader comparison of
otolith age estimates for Spanish mackerel.
1 2 3 4 5 6 7 8 9
Reader 1
1
2
3
4
5
6
7
8
9
Re
ad
er
2
(201) (2)
(8) (136) (5)
(8) (33)
(1) (2)
(1) (23)
(4)
(1)
Otolith Ages (years)
1 2 3 4 5 6 7 8 9
Reader 1
1
2
3
4
5
6
7
8
9
Re
ad
er
2
(201) (2)
(8) (136) (5)
(8) (33)
(1) (2)
(1) (23)
(4)
(1)
Otolith Ages (years)
Figure 4. Year-class frequency distribution for Spanish mackerel collected for ageing in 2004. Distribution for
otolith ages is broken down by sex.
1995 1996 1997 1998 1999 2000 2001 2002 2003
Year Class
0
50
100
150
200
Nu
mb
er
of F
ish
Females n = 331
Males n = 94
Unknown n = 0
Page 35
VMRC summary report on finfish ageing, 2004 Spanish mackerel
Center for Quantitative Fisheries Ecology Old Dominion University
Page 29
Table 1. The number of Spanish mackerel assigned to each total length-at-age category for
425 fish sampled for age determination in Virginia during 2004 (no length for 1 fish).
Length Age (years)
1-inch 1 2 3 4 5 6 0
intervals Totals
13 - 13.99 2 1 0 0 0 0 0 3
14 - 14.99 15 0 0 0 0 0 0 15
15 - 15.99 83 2 0 0 0 0 0 85
16 - 16.99 71 11 0 0 0 0 0 82
17 - 17.99 25 26 6 0 0 0 0 57
18 - 18.99 9 25 5 0 0 0 0 39
19 - 19.99 2 38 10 0 1 1 0 52
20 - 20.99 0 24 7 1 1 1 0 34
21 - 21.99 0 12 2 3 2 0 0 19
22 - 22.99 0 6 3 0 4 0 0 13
23 - 23.99 0 1 2 0 3 0 0 6
24 - 24.99 0 0 1 0 4 0 0 5
25 - 25.99 0 0 3 0 5 0 0 8
26 - 26.99 0 0 0 0 3 0 0 3
27 - 27.99 0 0 0 0 0 1 0 1
28 - 28.99 0 0 0 0 1 1 0 2
Totals 207 146 39 4 24 4 0 424
Page 36
VMRC summary report on finfish ageing, 2004 Spanish mackerel
Center for Quantitative Fisheries Ecology Old Dominion University
Page 30
Table 2. Age-Length key, as proportions-at-age in each 1 inch length-intervals, based on
otolith ages for Spanish mackerel sampled for age determination in Virginia during 2004.
Length Age (years)1-inch 1 2 3 4 5 6 0
intervals N
13 - 13.99 0.667 0.333 0.000 0.000 0.000 0.000 0.000 3
14 - 14.99 1.000 0.000 0.000 0.000 0.000 0.000 0.000 15
15 - 15.99 0.976 0.024 0.000 0.000 0.000 0.000 0.000 85
16 - 16.99 0.866 0.134 0.000 0.000 0.000 0.000 0.000 82
17 - 17.99 0.439 0.456 0.105 0.000 0.000 0.000 0.000 57
18 - 18.99 0.231 0.641 0.128 0.000 0.000 0.000 0.000 39
19 - 19.99 0.038 0.731 0.192 0.000 0.019 0.019 0.000 52
20 - 20.99 0.000 0.706 0.206 0.029 0.029 0.029 0.000 34
21 - 21.99 0.000 0.632 0.105 0.158 0.105 0.000 0.000 19
22 - 22.99 0.000 0.462 0.231 0.000 0.308 0.000 0.000 13
23 - 23.99 0.000 0.167 0.333 0.000 0.500 0.000 0.000 6
24 - 24.99 0.000 0.000 0.200 0.000 0.800 0.000 0.000 5
25 - 25.99 0.000 0.000 0.375 0.000 0.625 0.000 0.000 8
26 - 26.99 0.000 0.000 0.000 0.000 1.000 0.000 0.000 3
27 - 27.99 0.000 0.000 0.000 0.000 0.000 1.000 0.000 1
28 - 28.99 0.000 0.000 0.000 0.000 0.500 0.500 0.000 2
Total Sampled 424
Page 37
VMRC summary report on finfish ageing, 2004 spot
Center for Quantitative Fisheries Ecology Old Dominion University
Page 31
Chapter 8 Spot
Leiostomus
xanthurus
INTRODUCTION
A total of 459 spot, Leiostomus xanthurus,
was collected by the VMRC’s Stock
Assessment Program for age and growth
analysis in 2004. The average age for the
sample was 2.0 year old, and the standard
deviation and standard error were 0.69 and
0.03, respectively. Six age classes (1 to 6)
were represented, comprising fish from the
1998-2003 year-classes, with fish
predominantly from the 2002 year-class.
METHODS
Handling of collection Otoliths were
received by the Age & Growth Laboratory
in labeled coin envelopes. Once in our
hands, they were sorted based on date of
capture, their envelope labels were verified
against VMRC’s collection data, and
assigned unique Age and Growth
Laboratory sample numbers. All otoliths
were stored dry in labeled cell well trays.
Preparation Otoliths were processed for
ageing using a thin-sectioning technique.
The first step in otolith preparation was to
grind down the otolith in a transverse plane
to its core using a Hillquist thin section
machine’s 320-mesh diamond cup wheel.
To prevent distortion of the reading surface,
the otolith was ground exactly perpendicular
to the reading plane. The ground side of the
otolith was then placed face down in a drop
of Loctite 349 photo-active adhesive on a
labeled glass slide and placed under
ultraviolet light to allow the adhesive to
harden. The Hillquist thin section
machine’s cup wheel was used again to
grind the otolith, embedded in Loctite, to a
thickness of 0.3 to 0.5 mm. Finally, a thin
layer of Flo-texx mounting medium was
applied to the otolith section to increase
light transmission through the translucent
zones, which provided enhanced contrast
and greater readability.
Readings Two different readers aged all
sectioned otoliths using a Leica MZ-12
dissecting microscope with transmitted light
and dark-field polarization at between 8 and
100 times magnification (Figure 1).
All samples were aged in chronological
order based on collection date, without
knowledge of previously estimated ages or
the specimen lengths. When the readers’
ages agreed, that age was assigned to the
fish. When the two readers disagreed, both
Figure 1. Sectioned otolith from a 5 year old spot.
Page 38
VMRC summary report on finfish ageing, 2004 spot
Center for Quantitative Fisheries Ecology Old Dominion University
Page 32
readers sat down together and re-aged the
fish, again without any knowledge of
previously estimated ages or lengths, and
assigned a final age to the fish. When the
readers were unable to agree on a final age,
the fish was excluded from further analysis.
Comparison Tests Age estimates from
reader 1 were plotted against age estimates
from reader 2 to assess deviation from 1:1
equivalence (Campana et al. 1995). A test
for symmetry was used to detect any
systematic difference between the two
readers (Hoenig et al. 1995). Also, a random
sub-sample of 50 fish was selected for
second readings to measure reader precision
and age reproducibility. To detect any
changes or drift in our ageing methods, both
readers re-aged otoliths of 50 randomly
selected fish previously aged in 2000. We
considered a reader to be biased if the
readings revealed consistent over or under
ageing.
RESULTS
Measurements of reader precision were
high, with age disagreements for only 17
out of 458 fish aged. Figure 2 illustrates the
between readers’ precision of age estimates.
Both reader 1 and reader 2 had 100 %
agreement for precision age reading. There
was no evidence of systematic disagreement
between reader 1 and reader 2 (test of
symmetry, 2 = 7.34, df = 3, P = 0.06).
Figure 2 illustrates the between readers’
precision of age estimates, with no
differences greater than one year.
Of the 458 fish aged with otoliths, 6 age
classes were represented (Table 1). The
average age for the sample was 2.0 year old,
and the standard deviation and standard
error were 0.69 and 0.03, respectively.
Year-class data (Figure 3) show that the
fishery was comprised of 6 year-classes,
with fish spawned in 2002 dominating the
catch.
Age-Length-Key In Table 2 we present
an age-length-key that can be used in the
conversion of numbers-at-length in the
estimated catch to numbers-at-age using
otolith ages. The table is based on VMRC’s
stratified sampling of landings by total
length inch intervals.
REFERENCES
Campana, S.E., M.C. Annand, and J.I.
McMillan. 1995. Graphical and
statistical methods for determining the
Figure 2. Between-reader comparison of otolith age
estimates for spot.
1 2 3 4 5 6
Reader 1
1
2
3
4
5
6
Re
ad
er
2
(54) (6)
(1) (334) (7)
(2) (36)
(9)
(7) (1)
(1)
Otolith Ages (years)
Figure 3. Year-class distribution for spot collected for
ageing in 2004. Distribution is broken down by sex.
1998 1999 2000 2001 2002 2003
Year Class
0
100
200
300
Nu
mb
er
of F
ish
Females n = 309
Males n = 120
Unknown n = 29
1998 1999 2000 2001 2002 2003
Year Class
0
100
200
300
Nu
mb
er
of F
ish
Females n = 309
Males n = 120
Unknown n = 29
Page 39
VMRC summary report on finfish ageing, 2004 spot
Center for Quantitative Fisheries Ecology Old Dominion University
Page 33
consistency of age determinations.
Trans. Am. Fish. Soc. 124:131-138.
Hoenig, J.M., M.J. Morgan, and C.A.
Brown. 1995. Analysing differences
between two age determination
methods by tests of symmetry. Can. J.
Fish. Aquat. Sci. 52:364-368.
S-Plus. 1999. S-Plus 4.5 Guide to Statistics.
Data Analysis Products Division.
Math Soft, Inc. Seattle, Washington.
Page 40
VMRC summary report on finfish ageing, 2004 spot
Center for Quantitative Fisheries Ecology Old Dominion University
Page 34
Table 1. The number of spot assigned to each total
length-at-age category for 459 fish sampled for age
determination in Virginia during 2004 (Length not
reported for 3 fish).
Length Age
1-inch 1 2 3 4 5 6
intervals Totals
6 - 6.99 2 0 0 0 0 0 2
7 - 7.99 5 1 0 0 0 0 6
8 - 8.99 19 21 0 0 0 0 40
9 - 9.99 24 115 0 0 0 0 139
10 - 10.99 4 130 8 0 0 0 142
11 - 11.99 3 53 21 0 0 0 77
12 - 12.99 0 19 9 5 5 0 38
13 - 13.99 0 2 2 3 3 1 11
14 - 14.99 0 0 0 1 0 0 1
Totals 57 341 40 9 8 1 456
Table 2. Age-Length key, as proportions-at-age in
each 1 inch length-intervals, based on otolith ages for spot
sampled for age determination in Virginia during 2004
(Length not reported for 3 fish).
Length Age
1-inch 1 2 3 4 5 6
intervals N
6 - 6.99 1.000 0.000 0.000 0.000 0.000 0.000 2
7 - 7.99 0.833 0.167 0.000 0.000 0.000 0.000 6
8 - 8.99 0.475 0.525 0.000 0.000 0.000 0.000 40
9 - 9.99 0.173 0.827 0.000 0.000 0.000 0.000 139
10 - 10.99 0.028 0.915 0.056 0.000 0.000 0.000 142
11 - 11.99 0.039 0.688 0.273 0.000 0.000 0.000 77
12 - 12.99 0.000 0.500 0.237 0.132 0.132 0.000 38
13 - 13.99 0.000 0.182 0.182 0.273 0.273 0.091 11
14 - 14.99 0.000 0.000 0.000 1.000 0.000 0.000 1
Sample Size 456
Page 41
VMRC summary report on finfish ageing, 2004 spotted seatrout
Center for Quantitative Fisheries Ecology Old Dominion University
Page 35
Chapter 9 Spotted Seatrout
Cynoscion
nebulosus
INTRODUCTION
A total of 501 spotted seatrout, Cynoscion
nebulosus, was collected by the VMRC’s
Stock Assessment Program for age and
growth analysis in 2004. The average age
for the sample was 1.0 years old, and the
standard deviation and standard error were
0.62 and 0.03, respectively. Four age
classes (0 to 3) were represented,
comprising fish from the 2001-2004 year-
classes, with fish primarily from the 2003
year-class.
METHODS
Handling of collection Otoliths were
received by the Age & Growth Laboratory
in labeled coin envelopes. They were
sorted based on date of capture, their
envelope labels were verified against
VMRC’s collection data, and each fish
assigned a unique Age and Growth
Laboratory sample number. All otoliths
were stored dry in labeled cell well trays.
Preparation The first step in seatrout
otolith preparation was to make a transverse
cut just off center of the otolith with a
Hillquist thin section machine’s cut-off saw
equipped with an HCR-100 diamond blade.
To prevent distortion of the reading surface,
the cut surface of the otolith half containing
the focus was ground down on a Hillquist thin
section machine’s 320 mesh diamond cup
wheel until perpendicular to the reading
plane. The otolith’s ground surface was then
placed face down in a drop of Loctite 349
photo-active adhesive on a labeled glass slide
and placed under ultraviolet light to allow the
adhesive to harden (approximately ten
minutes). The Hillquist thin section
machine’s cup wheel was used again to grind
the otolith, embedded in Loctite, to a
thickness of 0.3 to 0.5 mm. Finally, a thin
layer of Flo-texx mounting medium was
applied to the otolith section to increase light
transmission through the translucent zones,
which provided enhanced contrast and greater
readability.
Readings Two different readers aged all
sectioned otoliths using a Leica MZ-12
dissecting microscope with transmitted light
and dark-field polarization at between 8 and
100 times magnification (Figure 1). All
Figure 1. Sectioned otolith from an 8 year old male
spotted seatrout.
Page 42
VMRC summary report on finfish ageing, 2004 spotted seatrout
Center for Quantitative Fisheries Ecology Old Dominion University
Page 36
samples were aged in chronological order
based on collection date, without
knowledge of previously estimated ages
or the specimen lengths. When the
readers’ ages agreed, that age was
assigned to the fish. When the two
readers disagreed, both readers sat down
together and re-aged the fish, again
without any knowledge of previously
estimated ages or lengths, and assigned a
final age to the fish. When the readers
were unable to agree on a final age, the
fish was excluded from further analysis.
Comparison Tests Age estimates from
reader 1 were plotted against age
estimates from reader 2 to assess deviation
from 1:1 equivalence (Campana et al.
1995). A test for symmetry was used to
detect any systematic difference between
the two readers (Hoenig et al. 1995). Also,
both readers aged all 50 fish a second time
to measure reader precision and age
reproducibility. To detect any changes or
drift in our ageing methods, both readers
re-aged otoliths of 50 randomly selected
fish previously aged in 2000. We
considered a reader to be biased if the
readings revealed consistent over or under
ageing.
RESULTS
No bias was discovered in any of the self-
precision tests of otolith age estimates,
with both readers equally able to
reproduce the ages of previously read
samples. There was also 100 percent
agreement between reader age estimates.
Figure 2 illustrates the between readers’
precision of age estimates. There was no
evidence of drift in age determination
from the 2000 precision fish with 100%
agreement for both readers.
Of the 500 fish aged with otoliths, 4 age
classes were represented (Table 1). The
average age for the sample was 1.0 years old,
and the standard deviation and standard error
were 0.62 and 0.02, respectively.
Year-class data (Figure 3) show that the
fishery was comprised of 4 year-classes,
comprising fish from the 2001-2004 year-
classes, with fish primarily from the 2003
year-class.
Age-Length-Key In Table 2 we present an
age-length-key that can be used in the
conversion of numbers-at-length in the
estimated catch to numbers-at-age using
otolith ages. The table is based on VMRC’s
stratified sampling of landings by total length
inch intervals.
Figure 2. Between-reader comparison of otolith
age estimates for spotted seatrout.
0 1 2 3
Reader 1
0
1
2
3
Re
ad
er
2
(89)
(313)
(96)
(2)
Otolith Ages (years)
Figure 3. Year-class distribution for spotted seatrout
collected for ageing in 2004. Distribution is broken
down by sex.
2001 2002 2003 2004
Year Class
0
100
200
300
Nu
mb
er
of F
ish
Females n = 202
Males n = 171
Unknown n = 127
2001 2002 2003 2004
Year Class
0
100
200
300
Nu
mb
er
of F
ish
Females n = 202
Males n = 171
Unknown n = 127
Page 43
VMRC summary report on finfish ageing, 2004 spotted seatrout
Center for Quantitative Fisheries Ecology Old Dominion University
Page 37
REFERENCES
Campana, S.E., M.C. Annand, and J.I.
McMillan. 1995. Graphical and
statistical methods for determining
the consistency of age
determinations. Trans. Am. Fish.
Soc. 124:131-138.
Hoenig, J.M., M.J. Morgan, and C.A.
Brown. 1995. Analysing differences
between two age determination
methods by tests of symmetry. Can.
J. Fish. Aquat. Sci. 52:364-368.
S-Plus. 1999. S-Plus 4.5 Guide to
Statistics. Data Analysis Products
Division. Math Soft, Inc. Seattle,
Washington.
Table 1. The number of spotted seatrout assigned to each total
length-at-age category for 501 fish sampled for age determination in
Virginia during 2004 (no length for 46 fish).
Length Age (years)
1-inch 0 1 2 3
intervals Totals
4 - 4.99 1 0 0 0 1
5 - 5.99 1 0 0 0 1
6 - 6.99 1 0 0 0 1
7 - 7.99 1 0 0 0 1
8 - 8.99 2 0 0 0 2
9 - 9.99 5 0 0 0 5
10 - 10.99 29 1 0 0 30
11 - 11.99 29 11 0 0 40
12 - 12.99 19 18 0 0 37
13 - 13.99 0 37 0 0 37
14 - 14.99 0 51 1 0 52
15 - 15.99 0 50 2 0 52
16 - 16.99 0 35 7 0 42
17 - 17.99 0 31 13 0 44
18 - 18.99 0 25 11 0 36
19 - 19.99 0 14 8 0 22
20 - 20.99 0 2 23 0 25
21 - 21.99 0 0 9 1 10
22 - 22.99 0 0 12 0 12
23 - 23.99 0 0 1 0 1
24 - 24.99 0 0 1 0 1
25 - 25.99 0 0 1 0 1
26 - 26.99 0 0 0 1 1
Totals 88 275 89 2 454
Page 44
VMRC summary report on finfish ageing, 2004 spotted seatrout
Center for Quantitative Fisheries Ecology Old Dominion University
Page 38
Table 2. Age-Length key, as proportions-at-age in each 1 inch
length-intervals, based on otolith ages for spotted seatrout sampled
for age determination in Virginia during 2004 (no length for 46 fish).
Length
1-inch 0 1 2 3
intervals N
4 - 4.99 1.000 0.000 0.000 0.000 1
5 - 5.99 1.000 0.000 0.000 0.000 1
6 - 6.99 1.000 0.000 0.000 0.000 1
7 - 7.99 1.000 0.000 0.000 0.000 1
8 - 8.99 1.000 0.000 0.000 0.000 2
9 - 9.99 1.000 0.000 0.000 0.000 5
10 - 10.99 0.967 0.033 0.000 0.000 30
11 - 11.99 0.725 0.275 0.000 0.000 40
12 - 12.99 0.514 0.486 0.000 0.000 37
13 - 13.99 0.000 1.000 0.000 0.000 37
14 - 14.99 0.000 0.981 0.019 0.000 52
15 - 15.99 0.000 0.962 0.038 0.000 52
16 - 16.99 0.000 0.833 0.167 0.000 42
17 - 17.99 0.000 0.705 0.295 0.000 44
18 - 18.99 0.000 0.694 0.306 0.000 36
19 - 19.99 0.000 0.636 0.364 0.000 22
20 - 20.99 0.000 0.080 0.920 0.000 25
22 - 22.99 0.000 0.000 1.000 0.000 12
23 - 23.99 0.000 0.000 1.000 0.000 1
24 - 24.99 0.000 0.000 1.000 0.000 1
25 - 25.99 0.000 0.000 1.000 0.000 1
26 - 26.99 0.000 0.000 0.000 1.000 1
Sample Size 454
Age (years)
Page 45
VMRC summary report on finfish ageing, 2004 striped bass
Center for Quantitative Fisheries Ecology Old Dominion University
Page 1
Chapter 10 Striped Bass
Morone
saxatilis
INTRODUCTION
A total of 830 striped bass, Morone
saxatilis, was collected by the VMRC’s
Stock Assessment Program for age and
growth analysis in 2004. Only otoliths were
collected from 6 fish and only scales were
collected from 252 fish, leaving 571 fish
from which both scales and otoliths were
collected with one specimen without any
hard part to age. The average scale age was
8.1 years, with 16 age classes (3 to 16 and
18 to 19) comprising fish from 1985, 1986
and 1988-2001 year-classes. The average
otolith age was 7.3 years, with 18 age
classes (3 to 20) comprising fish from 1984
to 2001 year-classes.
METHODS
Handling of collection Otoliths and
scales were received by the Age & Growth
Laboratory in labeled coin envelopes. Once
in our hands, they were sorted based on date
of capture, their envelope labels were
verified against VMRC’s collection data,
and each fish assigned a unique Age and
Growth Laboratory sample number. All
otoliths were stored dry in labeled cell well
plates, while scales were stored in their
original coin envelopes.
Preparation
Scales – Striped bass scales were prepared
for age and growth analysis by making
acetate impressions of the scale
microstructure. Due to extreme variation in
the size and shape of scales from individual
fish, we selected only those scales that had
even margins and uniform size. We
selected a range of four to six preferred
scales (based on overall scale size) from
each fish, making sure that only non-
regenerated scales were used. Scale
impressions were made on extruded clear
020 acetate sheets (25 mm x 75 mm) with a
Carver Laboratory Heated Press (model
“C”). The scales were pressed with the
following settings:
Pressure: 15000 psi
Temperature: 77°C (170°F)
Time: 5 to 10 min
Striped bass scales that were the size of a
quarter (coin) or larger, were pressed
individually for up to twenty minutes. After
pressing, the impressions were viewed with
a Bell and Howell microfiche reader and
checked again for regeneration and
incomplete margins. Impressions that were
too light, or when all scales were
regenerated a new impression was made
using different scales from the same fish.
Otoliths We used a thin-section and bake
technique to process striped bass otoliths for
age determination. Otolith preparation
began by randomly selecting either the right
or left otolith. The otolith was mounted with
Crystal Bond onto a standard microscope
slide with its distal surface orientated
upwards. Once mounted, a small mark was
placed on the otolith surface directly above
Page 46
VMRC summary report on finfish ageing, 2004 striped bass
Center for Quantitative Fisheries Ecology Old Dominion University
Page 2
the otolith focus. The slide, with attached
otolith, was then secured to an Isomet saw
equipped with two diamond wafering blades
separated by a 0.5 mm spacer, which was
slightly smaller in diameter than the
diamond blades. The otolith was positioned
so that the wafering blades straddled each
side of the otolith focus ink mark. It was
crucial that this cut be perpendicular to the
long axis of the otolith. Failure to do so
resulted in “broadening” and distortion of
winter growth zones. A proper cut resulted
in annuli that were clearly defined and
delineated. Once cut, the otolith section
was placed into a ceramic “Coors” spot
plate well and baked in a Thermolyne 1400
furnace at 400oC. Baking time was otolith
size dependent and gauged by color, with a
light caramel color desired. Once a suitable
color was reached the baked thin-section
was placed on a labeled glass slide and
covered with a thin layer of Flo-texx
mounting medium, which provided
enhanced contrast and greater readability by
increasing light transmission through the
sections.
Readings By convention, a birthdate of
January 1 is assigned to all Northern
Hemisphere fish species. We use a system
of age determination that assigns age class
according to the date of sacrifice with
respect to this international accepted
birthdate and the timing of annulus
formation, which occurs between the
months of May and June for striped bass.
Once the reader decides how many annuli
are visible on the ageing structure, the year
class is assigned. The year class
designation, or age, is written first followed
by the actual number of annuli visible listed
within brackets (e.g. 3(3)). The presence of
a “+” after the number in the brackets
indicates new growth, or “plus growth”
visible on the structure’s margin. Using this
method, a fish sacrificed in January before
annulus formation with three visible annuli
would be assigned the same age, 4(3+), as a
fish with four visible annuli sacrificed in
July after annulus formation, 4(4).
Two different readers aged all samples in
chronological order based on collection
date, without knowledge of previously
estimated ages or the specimen lengths.
When the readers’ ages agreed, that age was
assigned to the fish. When the two readers
disagreed, both readers sat down together
and re-aged the fish, again without any
knowledge of previously estimated ages or
lengths, and assigned a final age to the fish.
When the age readers were unable to agree
on a final age, the fish was excluded from
further analysis.
Scales - We determined fish age by viewing
acetate impressions of scales (Figure 1) with
a standard Bell and Howell R-735
microfiche reader equipped with 20 and 29
mm lenses.
Annuli on striped bass scales are identified
based on two scale microstructure features,
“crossing over” and circuli disruption.
Primarily, “crossing over” in the lateral
Figure 1. Scale impression of a 5-year-old male
striped bass.
Page 47
VMRC summary report on finfish ageing, 2004 striped bass
Center for Quantitative Fisheries Ecology Old Dominion University
Page 3
margins near the posterior\anterior interface
of the scale is used to determine the origin
of the annulus. Here compressed circuli
(annulus) “cross over” the previously
deposited circuli of the previous year’s
growth. Typically annuli of the first three
years can be observed transversing this
interface as dark bands. These bands
remain consistent throughout the posterior
field and rejoin the posterior\anterior
interface on the opposite side of the focus.
Annuli can also be observed in the anterior
lateral field of the scale. Here the annuli
typically reveal a pattern of discontinuous
and suddenly breaking segmented circuli.
This event can also be distinguished by the
presence of concentric white lines, which
are typically associated with the disruption
of circuli.
Annuli can also be observed bisecting the
perpendicular plain of the radial striations in
the anterior field of the scale. Radii
emanate out from the focus of the scale
towards the outer corner margins of the
anterior field. These radial striations consist
mainly of segmented concave circuli. The
point of intersection between radii and
annuli results in a “straightening out” of the
concave circuli. This straightening of the
circuli should be consistent throughout the
entire anterior field of the scale. This event
is further amplified by the presence of
concave circuli neighboring both directly
above and below the annulus.
The first year’s annulus can be difficult to
locate on some scales. It is typically best
identified in the lateral field of the anterior
portion of the scale. The distance from the
focus to the first year’s annulus is typically
larger with respect to the following few
annuli. For the annuli two through six,
summer growth generally decreases
proportionally. For ages greater than six, a
crowding effect of the annuli near the outer
margins of the scale is observed. This
crowding effect creates difficulties in edge
interpretation. At this point it is best to
focus on the straightening of the circuli at
the anterior margins of the scale.
When ageing young striped bass, zero
through age two, extreme caution must be
taken as not to over age the structure.
Young fish have no point of reference to aid
in the determination of the first year; this
invariably results in over examination of the
scale and such events as hatching or
saltwater incursion marks (checks) may be
interpreted as the first year.
Otoliths – Sectioned otoliths were aged by
two different readers using a Leica MZ-12
dissecting microscope with transmitted light
and dark-field polarization at between 8 and
100 times magnification (Figure 2).
By convention an annulus is identified as
the narrow opaque zone, or winter growth.
Typically the first year’s annulus can be
determined by first locating the focus of the
otolith. The focus is generally located,
depending on preparation, in the center of
the otolith, and is visually well defined as a
dark oblong region. The first year’s annulus
can be located directly below the focus,
along the outer ridge of the sulcal groove on
the ventral and dorsal sides of the otolith.
This insertion point along the sulcal ridge
resembles a check mark (not to be confused
with a false annulus). Here the annulus can
be followed outwards along the ventral and
dorsal surfaces where it encircles the focus.
Figure 2. Otolith thin-section of a 5-year-old male
striped bass.
Page 48
VMRC summary report on finfish ageing, 2004 striped bass
Center for Quantitative Fisheries Ecology Old Dominion University
Page 4
Subsequent annuli also emanate from the
sulcal ridge, however, they do not encircle
the focus, but rather travel outwards to the
distal surface of the otolith. To be
considered a true annulus, each annulus
must be rooted in the sulcus and travel
without interruption to the distal surface of
the otolith. The annuli in striped bass have
a tendency to split as they advance towards
the distal surface. As a result, it is critical
that reading path proceed in a direction
down the sulcal ridge and outwards to the
distal surface.
Comparison Tests Age estimates from
reader 1 were plotted against age estimates
from reader 2 to assess deviation from 1:1
equivalence (Campana et al. 1995). A test
for symmetry was used to detect any
systematic difference between the two
readers (Hoenig et al. 1995). Also, a random
sub-sample of 50 fish was selected for
second readings to measure reader precision
and age reproducibility. We considered a
reader to be biased if the readings revealed
consistent over or under ageing.
RESULTS
Scales Measurements of reader self-
precision was marginal; with both readers
able to reproduce the ages of previously
read scales (reader 1’s CV = 13.0% and
reader 2’s CV = 5.6%). In Figure 3 we
present a graph of the results for between-
reader scale ageing precision. There was
good between-reader agreement for scale
age readings, with age differences between
the two readers one year or less for 88.8%
of all aged fish. The average between-reader
coefficient of variation (CV) of 5.4% was
not significant, and comparable to the CV of
4.3% from 2002. There was no evidence of
systematic disagreement between reader 1
and reader 2 (test of symmetry, 2 = 48.8, df
= 37, P = 0.09).
Of the 830 striped bass aged with scales, 16
age classes (3 to 16 and 18 to 19) were
represented. The average age for the
sample was 8.1 years. The standard
deviation and standard error were 2.8 and
0.10, respectively.
Year-class data (Figure 4) indicates that
recruitment into the fishery typically begins
at age 3, which corresponds to the 2001
year-class for striped bass caught in 2004.
Striped bass appear to fully recruit to the
fishery at age 8 (1996 year-class).
2 3 4 5 6 7 8 9 10 11 12 13 14 15 16 17 18 19
Reader 1
2
3
4
5
6
7
8
9
10
11
12
13
14
15
16
17
18
19
Re
ad
er
2
(1) (33) (10) (1)
(8) (52) (7) (5) (1)
(1) (5) (40) (13) (2) (1)
(2) (12) (47) (17) (3) (1)
(3) (4) (13) (56) (6) (5) (2)
(5) (17) (70) (22) (7) (4) (2)
(1) (3) (22) (55) (27) (7) (3)
(1) (1) (8) (18) (43) (29) (2)
(1) (2) (13) (38) (9) (1)
(1) (6) (4) (13) (3) (1)
(1) (12) (2)
(1) (1) (1) (4)
(2)
(1)
(1) (1)
scale Ages (years)
Figure 3. Between-reader comparison of
scale age estimates for striped bass.
1985
1986
1987
1988
1989
1990
1991
1992
1993
1994
1995
1996
1997
1998
1999
2000
2001
Year Class
0
20
40
60
80
100
120
Nu
mb
er
of F
ish
Females n = 304
Males n = 448
Unknown n = 71
1985
1986
1987
1988
1989
1990
1991
1992
1993
1994
1995
1996
1997
1998
1999
2000
2001
Year Class
0
20
40
60
80
100
120
Nu
mb
er
of F
ish
Females n = 304
Males n = 448
Unknown n = 71
Figure 4. Year-class frequency distribution
for striped bass collected for ageing in
2004. Distribution of scale ages is broken
down by sex.
Page 49
VMRC summary report on finfish ageing, 2004 striped bass
Center for Quantitative Fisheries Ecology Old Dominion University
Page 5
Otoliths There was good between-reader
agreement for otolith age readings using
sectioned otoliths, with age differences
between the two readers one year or less for
98.0% of all aged fish (Figure 5). The
between reader average CV for otolith age
estimates was only 1.69%, very comparable
to the CV of 1.52% reported for 2003 fish.
Like scale ages, there was no evidence of
systematic disagreement between reader 1
and reader 2 (test of symmetry, 2 = 14.23,
df = 19, P = 0.7).
Measurements of reader self-precision were
high, with both readers able to reproduce
the ages of previously read otoliths (Reader
1’s CV = 4.1% and Reader 2’s CV = 0.9%).
Eighteen age classes (3 to 20) were
represented for striped bass aged with
otoliths. The average age for the sample was
7.3 years. The standard deviation and
standard error were 2.8 and 0.11,
respectively.
Comparison of Scale and Otolith Ages
While the CV of otolith and scales age
estimates was 9.0%, there was also
significant evidence of systematic
disagreement between otolith and scale ages
(test of symmetry, 2 = 94.2, df = 45, P <
0.01). Scales were assigned a lower age
than otoliths for 26% of the fish and 32% of
the time were scales assigned a higher age
than otoliths (Figure 6). There was also
evidence of bias between otolith and scale
ages using an age bias plot (Figure 7), again
with scales generally assigned higher ages
for younger fish and lower ages for older
fish than otoliths age estimates.
Age-Length-Key In Table 2 we present
an age-length-key that can be used in the
conversion of numbers-at-length in the
estimated catch to numbers-at-age using
scale ages. The table is based on VMRC’s
stratified sampling of landings by total
length inch intervals.
Figure 6. Comparison of otolith and scale
age estimates for striped bass.
3 4 5 6 7 8 9 10 11 12 13 14 15 16 17 18 19 20
Otolith Age (years)
3
4
5
6
7
8
9
10
11
12
13
14
15
16
17
18
19
20
Sca
le A
ge
(ye
ars
)(35)
(13)
(1)
(1)
(1)
(6)
(37)
(22)
(4)
(3)
(1)
(6)
(30)
(10)
(4)
(1)
(1)
(1)
(11)
(24)
(20)
(11)
(2)
(5)
(15)
(7)
(3)
(1)
(2)
(10)
(21)
(45)
(17)
(10)
(2)
(1)
(1)
(2)
(4)
(8)
(14)
(20)
(3)
(8)
(1)
(1)
(1)
(1)
(8)
(4)
(7)
(4)
(2)
(1)
(1)
(8)
(9)
(16)
(23)
(10)
(5)
(4)
(1)
(1)
(1)
(3)
(1)
(1)
(2)
(1)
(3)
(1) (1)
(1)
(1)
(1)
(1)
(1)
3 4 5 6 7 8 9 10 11 12 13 14 15 16 17 18 19 20
Reader 1
3
4
5
6
7
8
9
10
11
12
13
14
15
16
17
18
19
20
Re
ad
er
2
(47) (4)
(3) (69) (1)
(5) (46) (2)
(1) (66) (1)
(1) (1) (27) (5) (1)
(10) (92) (7) (2)
(5) (45) (4) (1)
(2) (7) (21) (7)
(1) (6) (59) (3) (1)
(6) (2) (3)
(1) (2) (3)
(1) (1)
(1)
(1)
(1)
(1)
(1)
Otolith Ages (years)
Figure 5. Between-reader comparison of
otolith age estimates for striped bass.
2 4 6 8 10 12 14 16 18 20 22
Otolith Age (years)
2
4
6
8
10
12
14
16
18
20
22
Sca
le A
ge +
/- 9
5%
Confidence
Inte
rvals
2 4 6 8 10 12 14 16 18 20 22
Otolith Age (years)
2
4
6
8
10
12
14
16
18
20
22
Sca
le A
ge +
/- 9
5%
Confidence
Inte
rvals
Figure 7. Age-bias plot for striped bass
scale and otolith age estimates.
Page 50
VMRC summary report on finfish ageing, 2004 striped bass
Center for Quantitative Fisheries Ecology Old Dominion University
Page 6
RECOMMENDATIONS
We recommend that VMRC and ASMFC
use otoliths for ageing striped bass.
Although there is more preparation time for
otoliths compared to scales, as the mean age
of striped bass increases in the recovering
fishery, otoliths should provide more
reliable estimates of age. We will continue
to compare the age estimates between
otoliths and scales.
REFERENCES
Campana, S.E., M.C. Annand, and J.I.
McMillan. 1995. Graphical and
statistical methods for determining the
consistency of age determinations.
Trans. Am. Fish. Soc. 124:131-138.
Hoenig, J.M., M.J. Morgan, and C.A.
Brown. 1995. Analysing differences
between two age determination
methods by tests of symmetry. Can. J.
Fish. Aquat. Sci. 52:364-368.
S-PLUS. 1999. Guide to Statistics, Vol 1.
Data Analysis and Products Division.
MathSoft, Inc. Seattle, Washington.
Page 51
VMRC summary report on finfish ageing, 2004 striped bass
Center for Quantitative Fisheries Ecology Old Dominion University
Page 7
Table 1. The number of striped bass assigned to each total length-at-age category for fish
collected for age determination in Virginia during 2004 (length not determined for 12 fish).
Length Age (years)
1-inch 3 4 5 6 7 8 9 10 11 12 13 14 15 16 18 19
intervals Totals
17 - 17.99 3 0 0 0 0 0 0 0 0 0 0 0 0 0 0 0 3
18 - 18.99 9 5 1 0 0 0 0 0 0 0 0 0 0 0 0 0 15
19 - 19.99 14 9 2 1 0 0 0 0 0 0 0 0 0 0 0 0 26
20 - 20.99 8 8 7 4 1 0 1 0 0 0 0 0 0 0 0 0 29
21 - 21.99 3 20 12 7 8 3 2 0 0 0 0 0 0 0 0 0 55
22 - 22.99 2 10 16 16 12 18 1 1 1 0 0 0 0 0 0 0 77
23 - 23.99 4 6 12 16 13 22 7 2 2 0 0 0 0 0 0 0 84
24 - 24.99 0 5 9 11 14 15 6 3 3 0 0 0 0 0 0 0 66
25 - 25.99 0 1 4 9 11 10 7 4 2 0 0 0 0 0 0 0 48
26 - 26.99 0 0 4 4 6 10 6 7 1 2 0 0 0 0 0 0 40
27 - 27.99 0 0 3 2 5 5 7 2 6 2 1 2 0 0 0 0 35
28 - 28.99 0 0 1 3 1 3 3 6 6 0 0 0 0 0 0 0 23
29 - 29.99 0 0 0 3 1 4 6 1 4 2 0 2 0 1 0 0 24
30 - 30.99 0 0 0 0 1 5 14 2 3 3 0 0 0 0 0 0 28
31 - 31.99 0 0 0 1 2 7 10 4 3 0 0 2 0 1 0 0 30
32 - 32.99 0 0 0 0 2 5 6 6 7 1 1 0 0 0 0 0 28
33 - 33.99 0 0 0 0 1 3 13 13 2 3 2 0 0 0 0 0 37
34 - 34.99 0 0 0 0 0 3 5 5 11 5 3 0 0 0 0 0 32
35 - 35.99 0 0 0 0 0 3 5 9 13 10 4 2 0 0 0 0 46
36 - 36.99 0 0 0 0 0 1 4 10 8 5 7 2 0 0 0 0 37
37 - 37.99 0 0 0 0 0 0 2 4 7 9 3 0 0 1 0 0 26
38 - 38.99 0 0 0 0 0 0 0 2 3 1 4 2 1 0 0 0 13
39 - 39.99 0 0 0 0 0 0 0 0 2 2 1 0 0 0 0 0 5
40 - 40.99 0 0 0 0 0 0 0 0 1 2 0 0 0 0 0 0 3
41 - 41.99 0 0 0 0 0 0 0 0 0 0 1 0 0 0 0 0 1
42 - 42.99 0 0 0 0 0 0 0 0 1 0 0 1 1 0 1 0 4
43 - 43.99 0 0 0 0 0 0 0 0 0 0 1 1 0 0 0 0 2
44 - 44.99 0 0 0 0 0 0 0 0 0 0 0 1 0 0 0 0 1
45 - 45.99 0 0 0 0 0 0 0 0 1 0 1 0 0 0 0 0 2
48 - 48.99 0 0 0 0 0 0 0 0 0 0 0 0 0 0 0 1 1
Totals 40 64 71 77 78 117 105 81 87 47 29 15 2 3 1 1 818
Page 52
VMRC summary report on finfish ageing, 2004 striped bass
Center for Quantitative Fisheries Ecology Old Dominion University
Page 8
Table 2. Age-Length key, as proportions-at-age in each 1 inch length-intervals, based on scale ages
for striped bass sampled for age determination in Virginia during 2004.Length Age (years)
1-inch 3 4 5 6 7 8 9 10 11 12 13 14 15 16 18 19
intervals N
17 - 17.99 1.000 0.000 0.000 0.000 0.000 0.000 0.000 0.000 0.000 0.000 0.000 0.000 0.000 0.000 0.000 0.000 3
18 - 18.99 0.600 0.333 0.067 0.000 0.000 0.000 0.000 0.000 0.000 0.000 0.000 0.000 0.000 0.000 0.000 0.000 15
19 - 19.99 0.538 0.346 0.077 0.038 0.000 0.000 0.000 0.000 0.000 0.000 0.000 0.000 0.000 0.000 0.000 0.000 26
20 - 20.99 0.276 0.276 0.241 0.138 0.034 0.000 0.034 0.000 0.000 0.000 0.000 0.000 0.000 0.000 0.000 0.000 29
21 - 21.99 0.055 0.364 0.218 0.127 0.145 0.055 0.036 0.000 0.000 0.000 0.000 0.000 0.000 0.000 0.000 0.000 55
22 - 22.99 0.026 0.130 0.208 0.208 0.156 0.234 0.013 0.013 0.013 0.000 0.000 0.000 0.000 0.000 0.000 0.000 77
23 - 23.99 0.048 0.071 0.143 0.190 0.155 0.262 0.083 0.024 0.024 0.000 0.000 0.000 0.000 0.000 0.000 0.000 84
24 - 24.99 0.000 0.076 0.136 0.167 0.212 0.227 0.091 0.045 0.045 0.000 0.000 0.000 0.000 0.000 0.000 0.000 66
25 - 25.99 0.000 0.021 0.083 0.188 0.229 0.208 0.146 0.083 0.042 0.000 0.000 0.000 0.000 0.000 0.000 0.000 48
26 - 26.99 0.000 0.000 0.100 0.100 0.150 0.250 0.150 0.175 0.025 0.050 0.000 0.000 0.000 0.000 0.000 0.000 40
27 - 27.99 0.000 0.000 0.086 0.057 0.143 0.143 0.200 0.057 0.171 0.057 0.029 0.057 0.000 0.000 0.000 0.000 35
28 - 28.99 0.000 0.000 0.043 0.130 0.043 0.130 0.130 0.261 0.261 0.000 0.000 0.000 0.000 0.000 0.000 0.000 23
29 - 29.99 0.000 0.000 0.000 0.125 0.042 0.167 0.250 0.042 0.167 0.083 0.000 0.083 0.000 0.042 0.000 0.000 24
30 - 30.99 0.000 0.000 0.000 0.000 0.036 0.179 0.500 0.071 0.107 0.107 0.000 0.000 0.000 0.000 0.000 0.000 28
31 - 31.99 0.000 0.000 0.000 0.033 0.067 0.233 0.333 0.133 0.100 0.000 0.000 0.067 0.000 0.033 0.000 0.000 30
32 - 32.99 0.000 0.000 0.000 0.000 0.071 0.179 0.214 0.214 0.250 0.036 0.036 0.000 0.000 0.000 0.000 0.000 28
33 - 33.99 0.000 0.000 0.000 0.000 0.027 0.081 0.351 0.351 0.054 0.081 0.054 0.000 0.000 0.000 0.000 0.000 37
34 - 34.99 0.000 0.000 0.000 0.000 0.000 0.094 0.156 0.156 0.344 0.156 0.094 0.000 0.000 0.000 0.000 0.000 32
35 - 35.99 0.000 0.000 0.000 0.000 0.000 0.065 0.109 0.196 0.283 0.217 0.087 0.043 0.000 0.000 0.000 0.000 46
36 - 36.99 0.000 0.000 0.000 0.000 0.000 0.027 0.108 0.270 0.216 0.135 0.189 0.054 0.000 0.000 0.000 0.000 37
37 - 37.99 0.000 0.000 0.000 0.000 0.000 0.000 0.077 0.154 0.269 0.346 0.115 0.000 0.000 0.038 0.000 0.000 26
38 - 38.99 0.000 0.000 0.000 0.000 0.000 0.000 0.000 0.154 0.231 0.077 0.308 0.154 0.077 0.000 0.000 0.000 13
39 - 39.99 0.000 0.000 0.000 0.000 0.000 0.000 0.000 0.000 0.400 0.400 0.200 0.000 0.000 0.000 0.000 0.000 5
40 - 40.99 0.000 0.000 0.000 0.000 0.000 0.000 0.000 0.000 0.333 0.667 0.000 0.000 0.000 0.000 0.000 0.000 3
41 - 41.99 0.000 0.000 0.000 0.000 0.000 0.000 0.000 0.000 0.000 0.000 1.000 0.000 0.000 0.000 0.000 0.000 1
42 - 42.99 0.000 0.000 0.000 0.000 0.000 0.000 0.000 0.000 0.250 0.000 0.000 0.250 0.250 0.000 0.250 0.000 4
43 - 43.99 0.000 0.000 0.000 0.000 0.000 0.000 0.000 0.000 0.000 0.000 0.500 0.500 0.000 0.000 0.000 0.000 2
44 - 44.99 0.000 0.000 0.000 0.000 0.000 0.000 0.000 0.000 0.000 0.000 0.000 1.000 0.000 0.000 0.000 0.000 1
45 - 45.99 0.000 0.000 0.000 0.000 0.000 0.000 0.000 0.000 0.500 0.000 0.500 0.000 0.000 0.000 0.000 0.000 2
48 - 48.99 0.000 0.000 0.000 0.000 0.000 0.000 0.000 0.000 0.000 0.000 0.000 0.000 0.000 0.000 0.000 1.000 1
Sample size 818
Page 53
VMRC summary report on finfish ageing, 2004 summer flounder
Center for Quantitative Fisheries Ecology Old Dominion University
Page 1
Chapter 11 Summer Flounder
Paralichthys
dentatus
INTRODUCTION
A total of 380 summer flounder,
Paralichthys dentatus, was collected by the
VMRC’s Stock Assessment Program for
age and growth analysis in 2004. Only
otoliths were collected from 9 fish and only
scales were collected from 4 fish, leaving
367 fish for which both scales and otoliths
were collected. The average scale age was
2.8 years, representing 11 year-classes
(1994 to 2004). Fish from the 2002-2003
year-classes dominated the collection. The
average otolith age was 2.7 years,
representing 11 year-classes (1994 to 2004).
METHODS
Handling of collection Otoliths and
scales were received by the Age & Growth
Laboratory in labeled coin envelopes. Once
in our hands, they were sorted based on date
of capture, their envelope labels were
verified against VMRC’s collection data,
and each fish assigned a unique Age and
Growth Laboratory sample number. All
otoliths were stored dry in labeled cell well
plates, while scales were stored in their
original coin envelopes.
Preparation
Scales – Summer flounder scales were
prepared for age and growth analysis by
making acetate impressions of the scale
microstructure. Due to extreme variation in
the size and shape of scales from individual
fish, we selected only those scales that had
even margins and uniform size. We
selected a range of five to ten preferred
scales (based on overall scale size) from
each fish, making sure that only non-
regenerated scales were used. Scale
impressions were made on extruded clear
020 acetate sheets (25 mm x 75 mm) with a
Carver Laboratory Heated Press (model
“C”). The scales were pressed with the
following settings:
Pressure: 12000 to 15000 psi
Temperature: Room temperature
Time: 7 minutes
Otoliths – The left otoliths of summer
flounder are symmetrical in relation to the
otolith nucleus, while right otoliths are
asymmetrical (Figure 1). The right sagittal
otolith was mounted with Aremco’s clear
Crystal BondTM
509 adhesive onto a
standard microscope slide with its distal
surface orientated upwards. Once mounted,
a small mark was placed on the otolith
surface directly above the otolith focus. The
slide, with attached otolith, was then
secured to a Buehler Isomet saw equipped
with two Norton diamond wafering blades
separated by a 0.5 mm stainless steel spacer,
which was slightly smaller in diameter than
the diamond blades. The otolith was
positioned so that the wafering blades
straddled each side of the otolith focus ink
mark. It was crucial that this cut be
perpendicular to the long axis of the otolith.
Page 54
VMRC summary report on finfish ageing, 2004 summer flounder
Center for Quantitative Fisheries Ecology Old Dominion University
Page 2
Failure to do so resulted in “broadening”
and distortion of winter growth zones. A
proper cut resulted in annuli that were
clearly defined and delineated. Once cut,
the otolith section was placed into a ceramic
“Coors” spot plate well and baked in a
Thermolyne 1400 furnace at 400oC. Baking
time was otolith size dependent and gauged
by color, with a light caramel color desired.
Once a suitable color was reached the baked
thin-section was placed on a labeled glass
slide and covered with a thin layer of Flo-
texx mounting medium, which provided
enhanced contrast and greater readability by
increasing light transmission through the
sections.
Readings By convention, a birthdate of
January 1 is assigned to all Northern
Hemisphere fish species. The Age and
Growth Lab uses a system of age
determination that assigns age class
according to the date of sacrifice with
respect to this international accepted
birthdate and the timing of annulus
formation, which occurs in Virginia’s
waters between the months of February and
April. Using this method, a fish sacrificed in
January before annulus formation with three
visible annuli will be assigned the same age
as a fish with four visible annuli sacrificed
in July after annulus formation. Once the
reader has decided how many annuli are
visible on the ageing structure, the year
class is assigned. The year class
designation, or age, is written first followed
by the actual number of annuli visible listed
within brackets (e.g. 3(3)). The presence of
a “+” after the number in the brackets
indicates new growth, or “plus growth”
visible on the structure’s margin.
Two different readers aged all samples in
chronological order based on collection
date, without knowledge of previously
estimated ages or the specimen lengths.
When the readers’ ages agreed, that age was
assigned to the fish. When the two readers
disagreed, both readers sat down together
and re-aged the fish, again without any
knowledge of previously estimated ages or
lengths, and assigned a final age to the fish.
When the readers were unable to agree on a
final age, the fish was excluded from further
analysis.
Scales - We determined fish age by viewing
the acetate impressions of scales (Figure 2)
with a standard Bell and Howell R-735
microfiche reader equipped with 20 and 29
mm lenses.
Annuli on summer flounder scales are
primarily identified by the presence of
crossing over of circuli. Crossing over is
most evident on the lateral margins near the
posterior/anterior interface of the scale.
Here compressed circuli (annulus) “cross
over” the deposited circuli of the previous
year’s growth. Typically the annulus will
protrude partially into the ctenii of the
posterior field, but not always.
(a) (b)
Figure 1. Whole otoliths from a 485 mm (total
length) female summer flounder. (a) left otolith
(b) right otolith.
Page 55
VMRC summary report on finfish ageing, 2004 summer flounder
Center for Quantitative Fisheries Ecology Old Dominion University
Page 3
Following the annulus up into the anterior
field of the scale reveals a pattern of
discontinuous and suddenly breaking
segmented circuli. This event can also be
distinguished by the presence of concentric
white lines, which are associated with the
disruption of circuli. This pattern should be
continuous throughout the entire anterior
field of the scale. Locating the first annulus
can be difficult due to latitudinal differences
in growth rates and changes in the size of
the first annulus due to a protracted
spawning season. We consider the first
annulus to be the first continuous crossing
over event formed on the scale.
Otoliths – Sectioned otoliths were aged by
two different readers using a Leica MZ-12
dissecting microscope with transmitted light
and dark-field polarization at between 8 and
100 times magnification (Figure 3).
Summer flounder otoliths are composed of
visually distinct summer and winter growth
zones. By convention, an annulus is
identified as the narrow opaque zone, or
winter growth band. With sectioned
otoliths, to be considered a true annulus,
these growth bands must be rooted in the
sulcus and able to be followed, without
interruption to the distal surface of the
otolith. The annuli in summer flounder
have a tendency to split as they advance
towards the distal surface. As a result, it is
critical that the reading path proceeds in a
direction from the sulcus to the proximal
surface. The first annulus is located directly
below the focus and near the upper portion
of the sulcal groove. The distance from the
focus to the first year is moderate, with
translucent zone deposition gradually
becoming smaller as consecutive annuli are
deposited towards the outer edge.
Comparison Tests Age estimates from
reader 1 were plotted against age estimates
from reader 2 to assess deviation from 1:1
equivalence (Campana et al. 1995). A test
for symmetry was used to detect any
systematic difference between the two
readers (Hoenig et al. 1995). Also, a random
sub-sample of 50 fish was selected for
second readings to measure reader precision
and age reproducibility. We considered a
reader to be biased if the readings revealed
consistent over or under ageing.
Figure 3. Otolith section from a 590 mm, 6-
year-old female summer flounder
collected in November. Same fish as
Figure 2.
Figure 2. Scale impression of a 590 mm female
summer flounder collected in
November and aged as 4-years-old with scales. The question mark is
located at a possible “3rd” annulus.
Page 56
VMRC summary report on finfish ageing, 2004 summer flounder
Center for Quantitative Fisheries Ecology Old Dominion University
Page 4
RESULTS
Scales Measurements of reader self-
precision were high, with both readers able
to reproduce the ages of previously read
scales (reader 1’s CV = 5.3% and reader 2’s
CV = 1.6%). There was no evidence of
systematic disagreement between reader 1
and reader 2 (test of symmetry, 2 = 13.1, df
= 8, P = 0.1). In Figure 4 we present a
graph of the results for between-reader scale
ageing precision. The average between-
reader coefficient of variation (CV) of 3.3%
was not significant.
Of the 371 fish aged with scales, 11 age-
classes (0 to 10) were represented (Table 1).
The average scale age was 2.7 years, and
the standard deviation and standard error
were 1.7 and 0.09, respectively.
Year-class data (Figure 5) indicate that
recruitment into the fishery began at age 1,
which corresponds to the 2003 year-class
for summer flounder caught in 2004. Year-
class abundance was high for the 2002–
2003 year-classes, but declined sharply in
the 2001 year-class and remained low for
the earlier years.
Otoliths Measurements of reader self-
precision were high, with both readers able
to reproduce the ages of previously read
otoliths (reader 1’s CV = 3.42% and reader
2’s CV = 0.62%). There was no evidence
of systematic disagreement between reader
1 and reader 2 (test of symmetry, 2 = 17, df
= 10, P = 0.07). In Figure 6 we present a
graph of the results for between-reader
otolith ageing precision. The average
between-reader coefficient of variation
(CV) of 1.12% was not significant.
Of the 376 fish aged with otoliths, 11 age-
classes (0 to 10) were represented. The
average age for the sample was 2.7 years.
0 1 2 3 4 5 6 7 8 9 10
Reader 1
0
1
2
3
4
5
6
7
8
9
10
Re
ad
er
2
(1)
(70)
(149) (7)
(12) (26) (2)
(12) (32) (5)
(6) (13) (4)
(6) (10) (2)
(3) (2)
(1) (2) (3)
(1)
(1) (1)
scale Ages (years)
Figure 4. Between-reader comparison of
scale age estimates for summer flounder.
1994 1995 1996 1997 1998 1999 2000 2001 2002 2003 2004
Year Class
0
50
100
150
Nu
mb
er
of
Fis
h
Females n = 332
Males n = 34
Unknown n = 5
Figure 5. Scale year-class distribution for
summer flounder collected in 2004.
Distribution is broken down by sex.
Figure 6. Between-reader comparison of otolith
age estimates for summer flounder.
0 1 2 3 4 5 6 7 8 9 10
Reader 1
0
1
2
3
4
5
6
7
8
9
10
Re
ad
er
2
(1)
(1) (67) (2)
(5) (164) (1)
(6) (38)
(5) (28) (3)
(4) (20)
(1) (12) (1)
(1) (8) (2)
(3)
(1)
(2)
Otolith Ages (years)
Page 57
VMRC summary report on finfish ageing, 2004 summer flounder
Center for Quantitative Fisheries Ecology Old Dominion University
Page 5
The standard deviation and standard error
were 1.7 and 0.09, respectively.
Comparison of Scale and Otolith Ages
Otolith and scales ages were similar, with
an average CV of 5.1% for the 367 fish for
which both otoliths and scales were
collected. Although statistically there was
no evidence of systematic disagreement
between otolith and scale ages (test of
symmetry, 2 = 15.5, df = 15, P = 0.41),
signs of under-aging occurred and could be
important when older year classes might be
present. In Figure 7 we present a graph of
the results for between-reader otolith/scale
ageing precision. There was some evidence
of bias between otolith and scale ages for
the oldest fish in the sample (Figure 8), but
this could be due to the extremely small
number of fish in these age categories.
Age-Length-Key In Table 2 we present
an age-length-key that can be used in the
conversion of numbers-at-length in the
estimated catch to numbers-at-age using
scale ages. The table is based on VMRC’s
stratified sampling of landings by total
length inch intervals.
REFERENCES
Bolz, G., R. Monaghan, K. Lang, R.
Gregory, and J. Burnett. 1999.
Proceedings of the summer flounder
ageing workshop, 1-2 February 1999,
Woods Hole, MA. . NOAA Tech.
Memo, in press.
Campana, S.E., M.C. Annand, and J.I.
McMillan. 1995. Graphical and
statistical methods for determining the
consistency of age determinations.
Trans. Am. Fish. Soc. 124:131-138.
Hoenig, J.M., M.J. Morgan, and C.A.
Brown. 1995. Analysing differences
between two age determination
methods by tests of symmetry. Can. J.
Fish. Aquat. Sci. 52:364-368.
S-Plus. 1999. S-Plus 4.5 Guide to Statistics.
Data Analysis Products Division.
Math Soft, Inc. Seattle, Washington.
Figure 7. Comparison of otolith and scale age
estimates for summer flounder.
0 1 2 3 4 5 6 7 8 9 10
Otolith Age (years)
0
1
2
3
4
5
6
7
8
9
10
Sca
le A
ge
(ye
ars
)
(1)
(65)
(8)
(4)
(146)
(9)
(1)
(5)
(24)
(11)
(4)
(4)
(25)
(3)
(2)
(1)
(3)
(18)
(3)
(1)
(1)
(8)
(3)
(1)
(3)
(4)
(1)
(1)
(1)
(3)
(1) (1)
(1)
0 1 2 3 4 5 6 7 8 9 10
Otolith Age (years)
0
1
2
3
4
5
6
7
8
9
10
Sca
le A
ge +
/- 9
5%
Confidence
Inte
rvals
Figure 8. Age-bias plot for summer
flounder scale and otolith age estimates.
Page 58
VMRC summary report on finfish ageing, 2004 summer flounder
Center for Quantitative Fisheries Ecology Old Dominion University
Page 6
Table 1. The number of summer flounder assigned to each total length-at-age category for 380 fish
sampled for age determination in Virginia during 2004 (scales not collected for 9 fish).
Length
1-inch 0 1 2 3 4 5 6 7 8 9 10
intervals Totals
11 - 11.99 0 2 0 0 0 0 0 0 0 0 0 2
12 - 12.99 0 11 1 0 0 0 0 0 0 0 0 12
13 - 13.99 0 14 4 1 0 0 0 0 0 0 0 19
14 - 14.99 1 28 33 4 2 0 0 0 0 0 0 68
15 - 15.99 0 13 58 5 2 0 0 1 0 0 0 79
16 - 16.99 0 2 35 6 7 3 0 0 0 0 0 53
17 - 17.99 0 0 18 7 9 3 1 0 0 0 0 38
18 - 18.99 0 0 6 7 6 3 0 0 0 0 0 22
19 - 19.99 0 0 2 4 10 3 0 0 0 0 0 19
20 - 20.99 0 0 1 2 2 6 1 0 0 0 0 12
21 - 21.99 0 0 2 0 1 6 5 0 0 0 0 14
22 - 22.99 0 0 0 1 1 2 1 0 1 0 0 6
23 - 23.99 0 0 0 2 1 1 1 3 0 0 0 8
24 - 24.99 0 0 0 0 0 1 5 3 0 1 0 10
25 - 25.99 0 0 0 0 0 0 2 1 1 0 0 4
26 - 26.99 0 0 0 0 0 0 0 0 1 1 1 3
27 - 27.99 0 0 0 0 0 0 0 0 1 0 0 1
29 - 29.99 0 0 0 0 0 0 0 0 0 1 0 1
Totals 1 70 160 39 41 28 16 8 4 3 1 371
Age (years)
Table 2. Age-Length key, as proportions-at-age in each 1 inch length-intervals, based on scale ages for summer
flounder sampled for age determination in Virginia during 2004.
Length
1-inch 0 1 2 3 4 5 6 7 8 9 10
intervals N
11 - 11.99 0.000 1.000 0.000 0.000 0.000 0.000 0.000 0.000 0.000 0.000 0.000 2
12 - 12.99 0.000 0.917 0.083 0.000 0.000 0.000 0.000 0.000 0.000 0.000 0.000 12
13 - 13.99 0.000 0.737 0.211 0.053 0.000 0.000 0.000 0.000 0.000 0.000 0.000 19
14 - 14.99 0.015 0.412 0.485 0.059 0.029 0.000 0.000 0.000 0.000 0.000 0.000 68
15 - 15.99 0.000 0.165 0.734 0.063 0.025 0.000 0.000 0.013 0.000 0.000 0.000 79
16 - 16.99 0.000 0.038 0.660 0.113 0.132 0.057 0.000 0.000 0.000 0.000 0.000 53
17 - 17.99 0.000 0.000 0.474 0.184 0.237 0.079 0.026 0.000 0.000 0.000 0.000 38
18 - 18.99 0.000 0.000 0.273 0.318 0.273 0.136 0.000 0.000 0.000 0.000 0.000 22
19 - 19.99 0.000 0.000 0.105 0.211 0.526 0.158 0.000 0.000 0.000 0.000 0.000 19
20 - 20.99 0.000 0.000 0.083 0.167 0.167 0.500 0.083 0.000 0.000 0.000 0.000 12
21 - 21.99 0.000 0.000 0.143 0.000 0.071 0.429 0.357 0.000 0.000 0.000 0.000 14
22 - 22.99 0.000 0.000 0.000 0.167 0.167 0.333 0.167 0.000 0.167 0.000 0.000 6
23 - 23.99 0.000 0.000 0.000 0.250 0.125 0.125 0.125 0.375 0.000 0.000 0.000 8
24 - 24.99 0.000 0.000 0.000 0.000 0.000 0.100 0.500 0.300 0.000 0.100 0.000 10
25 - 25.99 0.000 0.000 0.000 0.000 0.000 0.000 0.500 0.250 0.250 0.000 0.000 4
26 - 26.99 0.000 0.000 0.000 0.000 0.000 0.000 0.000 0.000 0.333 0.333 0.333 3
27 - 27.99 0.000 0.000 0.000 0.000 0.000 0.000 0.000 0.000 1.000 0.000 0.000 1
29 - 29.99 0.000 0.000 0.000 0.000 0.000 0.000 0.000 0.000 0.000 1.000 0.000 1
Sample Size 371
Age (years)
Page 59
VMRC summary report on finfish ageing, 2004 tautog
Center for Quantitative Fisheries Ecology Old Dominion University
Page 1
Chapter 12 Tautog
Tautoga
onitis
INTRODUCTION
A total of 506 tautog, Tautoga onitis, was
collected by the VMRC’s Stock Assessment
Program for age and growth analysis in
2004. Otoliths were not collected from 5
fish and opercula were not collected from
62 fish, leaving 439 fish for which both
otoliths and opercula were collected. Our
results and analyses are based on operculum
ages, unless otherwise noted, to allow our
data to be directly comparable to other
tautog age and growth studies. The average
operculum age for the sample was 4.7 years,
and the standard deviation and standard
error were 2.6 and 0.1, respectively. Fifteen
age-classes (2-15, and 17) were represented,
comprising fish from the 1987 and 1989
through 2002 year-classes.
METHODS
Handling of collection Otoliths and
opercula were received by the Age &
Growth Laboratory in labeled coin
envelopes. Once in our hands, they were
sorted based on date of capture, their
envelope labels were verified against
VMRC’s collection data, and each fish
assigned a unique Age and Growth
Laboratory sample number. All otoliths
were stored dry in labeled cell well plates,
while opercula were stored frozen in their
original coin envelopes until processed.
Preparation
Opercula – Tautog opercula were boiled for
several minutes to remove any attached skin
and muscle tissue. After boiling, opercula
were examined to determine whether they
were collected whole or in some way
damaged. Opercula were allowed to dry
and finally stored in new labeled coin
envelopes.
Otoliths – Because of the small size of a
tautog otolith, it required extra steps in
preparation for ageing. An otolith was first
baked in a Thermolyne 1400 furnace at
400C for one to two minutes until it turned
a medium brown color (caramel). The
location of the core of the otolith was
marked with a felt pen and the entire otolith
was embedded in Loctite 349 adhesive,
placed under UV light, and allowed to
harden overnight. The otolith was then
transversely sectioned through the felt pen
mark with a low speed Buehler Isomet saw
equipped with double wafering blades
separated by a 0.5 mm spacer. The
sectioned side of the otolith was then placed
face down in a drop of Loctite 349 photo-
active adhesive on a labeled glass slide and
placed under ultraviolet light to allow the
adhesive to harden (approximately ten
minutes). The otolith section was then
polished using a Buehler Ecomet 3 variable
speed grinder-polisher with Mark V
Laboratory 30-micron polishing film. After
polishing, a thin layer of Flo-texx mounting
medium was applied to the otolith section to
increase light transmission through the
Page 60
VMRC summary report on finfish ageing, 2004 tautog
Center for Quantitative Fisheries Ecology Old Dominion University
Page 2
translucent zones, which provided enhanced
contrast and greater readability.
Readings Opercula were aged on a light
table with no magnification (Figure 1).
Sectioned otoliths were aged by two
different readers using a Leica MZ-12
dissecting microscope with transmitted light
and dark-field polarization at between 8 and
100 times magnification (Figure 2).
Two different readers aged all samples in
chronological order based on collection
date, without knowledge of previously
estimated ages or the specimen lengths.
When the readers’ ages agreed, that age was
assigned to the fish. When the two readers
disagreed, both readers sat down together
and re-aged the fish, again without any
knowledge of previously estimated ages or
lengths, and assigned a final age to the fish.
When the readers were unable to agree on a
final age, the fish was excluded from further
analysis.
Comparison Tests Age estimates from
reader 1 were plotted against age estimates
from reader 2 to assess deviation from 1:1
equivalence (Campana et al. 1995). A test
for symmetry was used to detect any
systematic difference between the two
readers (Hoenig et al. 1995). Also, a random
sub-sample of 50 fish was selected for
second readings to measure reader precision
and age reproducibility. We considered a
reader to be biased if the readings revealed
consistent over or under ageing
RESULTS
Opercula Measurements of reader self-
precision were high, with both readers able
to reproduce the ages of previously read
opercula (Reader 1’s CV = 7.6% and
Reader 2’s CV = 2.6%). In Figure 3 we
present a graph of the results for between-
reader operculum ageing precision. There
was evidence of systematic disagreement
between reader 1 and reader 2 (test of
symmetry, 2 = 107, df = 40, P < 0.01).
Figure 1. Operculum from a 13 year-old male
tautog.
Figure 2. Otolith section from a 13 year-old
male tautog. Same fish as Figure 1.
2 3 4 5 6 7 8 9 10 11 12 13 14 15 16 17 18
Reader 1
2
3
4
5
6
7
8
9
10
11
12
13
14
15
16
17
18
Re
ad
er
2
(13) (9) (1)
(1) (96)(49) (9)
(6) (75)(25) (8) (1)
(1) (4) (26) (9) (7) (2) (1)
(4) (13) (4) (1) (1)
(1) (2) (8) (6) (1) (1) (1)
(1) (4) (2) (2) (1) (1)
(1) (1) (6) (1) (1) (1)
(1) (4) (3) (1) (1)
(2) (1) (1) (1)
(1) (3) (4) (1) (1)
(1) (1) (1)
(1) (1)
(1) (2) (1)
(1)
Opercle Ages (years)
Figure 3. Between-reader comparison of
operculum age estimates for tautog.
Page 61
VMRC summary report on finfish ageing, 2004 tautog
Center for Quantitative Fisheries Ecology Old Dominion University
Page 3
The average between-reader coefficient of
variation (CV) of 8.3% and was not
significant.
The average operculum age for the sample
was 4.7 years, and the standard deviation
and standard error were 2.6 and 0.1,
respectively.
Year-class data (Figure 4) indicate that full
recruitment into the fishery occurred at age
three, which corresponds to the 2001 year-
class for tautog caught in 2004. Year-class
abundance was high for the 1999–2001
year-classes.
Otoliths Measurements of reader self-
precision were high, with both readers able
to reproduce the ages of previously read
otoliths (reader 1’s CV = 2.9% and reader
2’s CV = 1.6%). There was no evidence of
systematic disagreement between reader 1
and reader 2 (test of symmetry, 2 = 24.2, df
= 19, P = 0.18). In Figure 5 we present a
graph of the results for between-reader
otolith ageing precision. The average
between-reader coefficient of variation
(CV) of 1.32 % was not significant.
Of the 501 fish aged with otoliths, 16 age-
classes (2 through 16, and 20) were
represented. The average age for the sample
was 4.7 years. The standard deviation and
standard error were 2.7 and 0.1,
respectively.
Comparison of Operculum and Otolith
Ages The between-structure average CV
of 6.8% was comparable to the within
structure CV’s. There was evidence of
systematic disagreement between otolith
and operculum ages (test of symmetry, 2 =
66.8, df = 33, P < 0.01). Operculum were
assigned a lower age than otoliths for 9% of
the fish and 26% of the time were
operculum assigned a higher age than
otoliths (Figure 6). There was also evidence
of bias between otolith and scale ages using
an age bias plot (Figure 7), again with
1987
1988
1989
1990
1991
1992
1993
1994
1995
1996
1997
1998
1999
2000
2001
2002Year Class
0
50
100
150
Nu
mb
er
of
Fis
h
Females n = 188
Males n = 252
Unknown n = 3
Figure 4. Operculum year-class distribution
for tautog collected in 2004. Distributions
are broken down by sex.
2 3 4 5 6 7 8 9 10 11 12 13 14 15 16 17 18 19 20 21
Reader 1
2
3
4
5
6
7
8
9
10
11
12
13
14
15
16
17
18
19
20
21
Re
ad
er
2
(26)(2)
(2)(188)(4)
(1) (4)(117)(1)
(3)(38)(2)
(20)
(2)(16)
(5)(19)
(5)
(1) (4) (9)
(1) (5)
(1) (2) (3) (3) (1)
(2) (3) (2)
(2) (1) (1)
(1) (1)
(1)
(1)
(1)
Otolith Ages (years)
Figure 5. Between-reader comparison
of otolith age estimates for tautog.
2 3 4 5 6 7 8 9 10 11 12 13 14 15 16 17
Otolith Age (years)
2
3
4
5
6
7
8
9
10
11
12
13
14
15
16
17
Op
erc
ulu
m A
ge
(ye
ars
)
(14)
(11)
(2)
(2)
(130)
(41)
(5)
(2)
(1)
(2)
(9)
(77)
(15)
(2)
(1)
(4)
(24)
(9)
(2)
(1)
(2)
(10)
(1) (9)
(3)
(1)
(1)
(1)
(1)
(4)
(5)
(5)
(1)
(1)
(2)
(2)
(1)
(1)
(3)
(4)
(2)
(1)
(3)
(1)
(2)
(3)
(2)
(1)
(1)
(1)
(1)
(1) (2)
(1)
(1)
(1)
(1)
(1)
(1)
Figure 6. Comparison of otolith and
operculum age estimates for tautog.
Page 62
VMRC summary report on finfish ageing, 2004 tautog
Center for Quantitative Fisheries Ecology Old Dominion University
Page 4
operculum generally assigned higher ages
for younger fish and lower ages for older
fish than otoliths age estimates.
Age-Length-Key In Table 2 we present
an age-length-key that can be used in the
conversion of numbers-at-length in the
estimated catch to numbers-at-age using
operculum ages. The table is based on
VMRC’s stratified sampling of landings by
total length inch intervals.
REFERENCES
Campana, S.E., M.C. Annand, and J.I.
McMillan. 1995. Graphical and
statistical methods for determining the
consistency of age determinations.
Trans. Am. Fish. Soc. 124:131-138.
Hoenig, J.M., M.J. Morgan, and C.A.
Brown. 1995. Analysing differences
between two age determination
methods by tests of symmetry. Can. J.
Fish. Aquat. Sci. 52:364-368.
S-Plus. 1999. S-Plus 4.5 Guide to Statistics.
Data Analysis Products Division.
Math Soft, Inc. Seattle, Washington.
White, G.G., J.E. Kirkley, and J.A. Lucy.
1997. Quantitative assessment of
fishing mortality for tautog, Tautoga
onitis, in Virginia. Preliminary report
to the Virginia Marine Recreational
Advisory Board and Virginia Marine
Resources Commission. Newport
News, VA.
2 3 4 5 6 7 8 9 10 11 12 13 14 15 16 17
Otolith Age (years)
2
3
4
5
6
7
8
9
10
11
12
13
14
15
16
17
Operc
ulu
m A
ge +
/- 9
5%
Confidence
Inte
rvals
Figure 7. Age-bias plot for tautog otolith
and operculum age estimates.
Page 63
VMRC summary report on finfish ageing, 2004 tautog
Center for Quantitative Fisheries Ecology Old Dominion University
Page 5
Table 2. Age-Length key, as proportions-at-age in each 1 inch length-class, based on operculum ages for
tautog sampled for age determination in Virginia during 2004.Length Age (years)
1-inch 2 3 4 5 6 7 8 9 10 11 12 13 14 15 17
intervals N
10 - 10.99 0.000 0.000 1.000 0.000 0.000 0.000 0.000 0.000 0.000 0.000 0.000 0.000 0.000 0.000 0.000 1
12 - 12.99 0.667 0.333 0.000 0.000 0.000 0.000 0.000 0.000 0.000 0.000 0.000 0.000 0.000 0.000 0.000 3
13 - 13.99 0.061 0.694 0.245 0.000 0.000 0.000 0.000 0.000 0.000 0.000 0.000 0.000 0.000 0.000 0.000 49
14 - 14.99 0.083 0.541 0.284 0.073 0.009 0.009 0.000 0.000 0.000 0.000 0.000 0.000 0.000 0.000 0.000 109
15 - 15.99 0.023 0.432 0.341 0.080 0.068 0.011 0.023 0.011 0.000 0.011 0.000 0.000 0.000 0.000 0.000 88
16 - 16.99 0.015 0.224 0.373 0.164 0.075 0.030 0.045 0.030 0.030 0.015 0.000 0.000 0.000 0.000 0.000 67
17 - 17.99 0.021 0.085 0.340 0.255 0.149 0.000 0.085 0.021 0.043 0.000 0.000 0.000 0.000 0.000 0.000 47
18 - 18.99 0.000 0.033 0.233 0.167 0.133 0.100 0.033 0.067 0.067 0.000 0.067 0.033 0.033 0.033 0.000 30
19 - 19.99 0.000 0.000 0.333 0.000 0.083 0.083 0.000 0.083 0.000 0.083 0.083 0.083 0.000 0.083 0.083 12
20 - 20.99 0.000 0.000 0.000 0.045 0.045 0.364 0.000 0.136 0.045 0.091 0.136 0.091 0.045 0.000 0.000 22
21 - 21.99 0.000 0.000 0.000 0.000 0.000 0.250 0.000 0.000 0.000 0.250 0.250 0.250 0.000 0.000 0.000 4
22 - 22.99 0.000 0.000 0.000 0.000 0.000 0.000 0.000 0.000 0.333 0.000 0.333 0.333 0.000 0.000 0.000 3
23 - 23.99 0.000 0.000 0.000 0.000 0.000 0.000 0.000 1.000 0.000 0.000 0.000 0.000 0.000 0.000 0.000 1
30 - 30.99 0.000 0.000 0.000 0.000 0.000 0.000 0.000 0.000 0.000 0.000 0.000 0.000 0.000 1.000 0.000 1
Sample Size 437
Table 1. The number of tautog assigned to each total length-at-age category for 506 fish sampled
for operculum age determination in Virginia during 2004 (operculum not collected for 62 fish and
length not reported for 7 fish).
Length Age (years)
1-inch 2 3 4 5 6 7 8 9 10 11 12 13 14 15 17
intervals Totals
10 - 10.99 0 0 1 0 0 0 0 0 0 0 0 0 0 0 0 1
12 - 12.99 2 1 0 0 0 0 0 0 0 0 0 0 0 0 0 3
13 - 13.99 3 34 12 0 0 0 0 0 0 0 0 0 0 0 0 49
14 - 14.99 9 59 31 8 1 1 0 0 0 0 0 0 0 0 0 109
15 - 15.99 2 38 30 7 6 1 2 1 0 1 0 0 0 0 0 88
16 - 16.99 1 15 25 11 5 2 3 2 2 1 0 0 0 0 0 67
17 - 17.99 1 4 16 12 7 0 4 1 2 0 0 0 0 0 0 47
18 - 18.99 0 1 7 5 4 3 1 2 2 0 2 1 1 1 0 30
19 - 19.99 0 0 4 0 1 1 0 1 0 1 1 1 0 1 1 12
20 - 20.99 0 0 0 1 1 8 0 3 1 2 3 2 1 0 0 22
21 - 21.99 0 0 0 0 0 1 0 0 0 1 1 1 0 0 0 4
22 - 22.99 0 0 0 0 0 0 0 0 1 0 1 1 0 0 0 3
23 - 23.99 0 0 0 0 0 0 0 1 0 0 0 0 0 0 0 1
30 - 30.99 0 0 0 0 0 0 0 0 0 0 0 0 0 1 0 1
Totals 18 152 126 44 25 17 10 11 8 6 8 6 2 3 437
Page 64
VMRC summary report on finfish ageing, 2004 weakfish
Center for Quantitative Fisheries Ecology Old Dominion University
Page 1
Chapter 13 Weakfish
Cynoscion
regalis
INTRODUCTION
A total of 657 weakfish, Cynoscion regalis,
was collected by the VMRC’s Stock
Assessment Program for age and growth
analysis in 2004. The average age was 2.3
year old, and the standard deviation and
standard error were 1.0 and 0.04,
respectfully. Nine age classes (1 to 5, and 7
to 10) were represented, comprising fish
from the 1994-1997 and 1999-2003 year-
classes, with fish primarily from the 2001
through 2003 year-classes.
METHODS
Handling of collection Otoliths were
received by the Age & Growth Laboratory
in labeled coin envelopes. Once in our
hands, they were sorted based on date of
capture, their envelope labels were verified
against VMRC’s collection data, and
assigned unique Age and Growth
Laboratory sample numbers. All otoliths
were stored dry in labeled cell well trays.
Preparation The first step in otolith
preparation was to grind down the otolith in
a transverse plane to its core using a
Hillquist thin section machine’s 320-mesh
diamond cup wheel. To prevent distortion
of the reading surface, the otolith was
ground exactly perpendicular to the reading
plane. The otolith’s ground surface was
then placed face down in a drop of Loctite
349 photo-active adhesive on a labeled glass
slide and placed under ultraviolet light to
allow the adhesive to harden. The Hillquist
thin section machine’s cup wheel was used
again to grind the otolith, embedded in
Loctite, to a thickness of 0.3 to 0.5 mm.
Finally, a thin layer of Flo-texx mounting
medium was applied to the otolith section to
increase light transmission through the
translucent zones, which provided enhanced
contrast and greater readability.
Readings Two different readers aged all
sectioned otoliths using a Leica MZ-12
dissecting microscope with transmitted light
and dark-field polarization at between 8 and
100 times magnification (Figure 1). Each
reader aged all of the otolith sections using
ageing criteria listed in Lowerre-Barbieri et
al. (1994). All samples were aged in
chronological order based on collection
date, without knowledge of previously
estimated ages or the specimen lengths.
When the readers’ ages agreed, that age was
assigned to the fish. When the two readers
disagreed, both readers sat down together
Figure 1. Sectioned otolith from a 7 year old female
weakfish.
Page 65
VMRC summary report on finfish ageing, 2004 weakfish
Center for Quantitative Fisheries Ecology Old Dominion University
Page 2
and re-aged the fish, again without any
knowledge of previously estimated ages or
lengths, and assigned a final age to the fish.
When the readers were unable to agree on a
final age, the fish was excluded from further
analysis.
Comparison Tests Age estimates from
reader 1 were plotted against age estimates
from reader 2 to assess deviation from 1:1
equivalence (Campana et al. 1995). A test
for symmetry was used to detect any
systematic difference between the two
readers (Hoenig et al. 1995). Also, a random
sub-sample of 50 fish was selected for
second readings to measure reader precision
and age reproducibility. We considered a
reader to be biased if the readings revealed
consistent over or under ageing.
RESULTS
The measurement of reader self-precision
was high for both readers (reader 1’s CV =
0% and reader 2’s CV = 0%). There was no
evidence of systematic disagreement
between reader 1 and reader 2 (test of
symmetry, 2 = 9, df = 6, P = 0.17). Figure
2 illustrates the between readers’ precision
of age estimates. The average coefficient of
variation (CV) of 0.5% was not significant.
Of the 657 fish aged with otoliths, nine age
classes were represented (Table 1). The
average age was 2.3 years old, and the
standard deviation and standard error were
1.0 and 0.04, respectfully.
Year-class data (Figure 3) show that the
fishery was comprised of nine year-classes,
comprising fish from the 1994-1997 and
1999-2002 year-classes, with fish primarily
from the 2001 through 2003 year-classes.
Age-Length-Key In Table 2 we present
an age-length-key that can be used in the
conversion of numbers-at-length in the
estimated catch to numbers-at-age using
otolith ages. The table is based on VMRC’s
stratified sampling of landings by total
length inch intervals.
REFERENCES
Campana, S.E., M.C. Annand, and J.I.
McMillan. 1995. Graphical and
statistical methods for determining the
consistency of age determinations.
Trans. Am. Fish. Soc. 124:131-138.
Hoenig, J.M., M.J. Morgan, and C.A.
Brown. 1995. Analysing differences
1 2 3 4 5 6 7 8 9 10
Reader 1
1
2
3
4
5
6
7
8
9
10
Re
ad
er
2
(85) (2)
(370) (1)
(3) (162) (1)
(1) (9)
(1) (12)
(2)
(3)
(3)
(2)
Otolith Ages (years)
Figure 2. Between-reader comparison of
otolith age estimates for weakfish.
1994 1995 1996 1997 1998 1999 2000 2001 2002 2003
Year Class
0
100
200
300
400
Nu
mb
er
of F
ish
Females n = 481
Males n = 175
Unknown n = 1
Figure 3. Year-class frequency distribution
for weakfish collected for ageing in 2004.
Distribution is broken down by sex.
Page 66
VMRC summary report on finfish ageing, 2004 weakfish
Center for Quantitative Fisheries Ecology Old Dominion University
Page 3
between two age determination
methods by tests of symmetry. Can. J.
Fish. Aquat. Sci. 52:364-368.
Lowerre-Barbieri, S.K., M.E. Chittenden
Jr., and C.M. Jones. 1994. A
comparison of a validated otolith
method to age weakfish, Cynoscion
regalis, with the traditional scale
method. Fish Bull. 92:555-568.
S-Plus. 1999. S-Plus 4.5 Guide to Statistics.
Data Analysis Products Division.
Math Soft, Inc. Seattle, Washington.
Table 1. The number of weakfish assigned to each total length-at-age category for
657 fish sampled for age determination in Virginia during 2004 (no lengths for 2 fish).
Length Age (years)
1-inch 1 2 3 4 5 7 8 9 10
intervals Totals
7 - 7.99 1 0 0 0 0 0 0 0 0 1
8 - 8.99 4 0 0 0 0 0 0 0 0 4
9 - 9.99 33 27 1 0 0 0 0 0 0 61
10 - 10.99 26 114 8 0 0 0 0 0 0 148
11 - 11.99 8 146 45 1 0 0 0 0 0 200
12 - 12.99 10 62 50 2 0 0 0 0 0 124
13 - 13.99 1 14 25 1 0 0 0 0 0 41
14 - 14.99 3 1 12 1 1 0 0 0 0 18
15 - 15.99 1 1 8 1 1 0 0 0 0 12
16 - 16.99 0 3 6 1 0 0 0 0 0 10
17 - 17.99 0 2 1 0 0 0 0 0 0 3
18 - 18.99 0 0 4 0 0 0 0 0 0 4
19 - 19.99 0 0 1 2 0 0 0 0 0 3
20 - 20.99 0 0 2 1 1 0 0 0 0 4
22 - 22.99 0 0 0 1 0 0 0 0 0 1
23 - 23.99 0 0 3 0 0 0 0 0 0 3
27 - 27.99 0 0 0 0 3 0 0 0 0 3
28 - 28.99 0 0 0 0 4 0 0 0 0 4
29 - 29.99 0 0 0 0 2 1 1 1 0 5
30 - 30.99 0 0 0 0 0 1 1 0 0 2
31 - 31.99 0 0 0 0 0 0 1 2 1 4
34 - 34.99 0 0 0 0 0 0 0 0 1 1
Totals 87 370 166 11 12 2 3 3 2 655
Page 67
VMRC summary report on finfish ageing, 2004 weakfish
Center for Quantitative Fisheries Ecology Old Dominion University
Page 4
Table 2. Age-Length key, as proportions-at-age in each 1 inch length-intervals, based
on otolith ages for weakfish sampled for age determination in Virginia during 2004.
Length Age (years)1-inch 1 2 3 4 5 7 8 9 10
intervals N7 - 7.99 1.000 0.000 0.000 0.000 0.000 0.000 0.000 0.000 0.000 1
8 - 8.99 1.000 0.000 0.000 0.000 0.000 0.000 0.000 0.000 0.000 4
9 - 9.99 0.541 0.443 0.016 0.000 0.000 0.000 0.000 0.000 0.000 61
10 - 10.99 0.176 0.770 0.054 0.000 0.000 0.000 0.000 0.000 0.000 148
11 - 11.99 0.040 0.730 0.225 0.005 0.000 0.000 0.000 0.000 0.000 200
12 - 12.99 0.081 0.500 0.403 0.016 0.000 0.000 0.000 0.000 0.000 124
13 - 13.99 0.024 0.341 0.610 0.024 0.000 0.000 0.000 0.000 0.000 41
14 - 14.99 0.167 0.056 0.667 0.056 0.056 0.000 0.000 0.000 0.000 18
15 - 15.99 0.083 0.083 0.667 0.083 0.083 0.000 0.000 0.000 0.000 12
16 - 16.99 0.000 0.300 0.600 0.100 0.000 0.000 0.000 0.000 0.000 10
17 - 17.99 0.000 0.667 0.333 0.000 0.000 0.000 0.000 0.000 0.000 3
18 - 18.99 0.000 0.000 1.000 0.000 0.000 0.000 0.000 0.000 0.000 4
19 - 19.99 0.000 0.000 0.333 0.667 0.000 0.000 0.000 0.000 0.000 3
20 - 20.99 0.000 0.000 0.500 0.250 0.250 0.000 0.000 0.000 0.000 4
22 - 22.99 0.000 0.000 0.000 1.000 0.000 0.000 0.000 0.000 0.000 1
23 - 23.99 0.000 0.000 1.000 0.000 0.000 0.000 0.000 0.000 0.000 3
27 - 27.99 0.000 0.000 0.000 0.000 1.000 0.000 0.000 0.000 0.000 3
28 - 28.99 0.000 0.000 0.000 0.000 1.000 0.000 0.000 0.000 0.000 4
29 - 29.99 0.000 0.000 0.000 0.000 0.400 0.200 0.200 0.200 0.000 5
30 - 30.99 0.000 0.000 0.000 0.000 0.000 0.500 0.500 0.000 0.000 2
31 - 31.99 0.000 0.000 0.000 0.000 0.000 0.000 0.250 0.500 0.250 4
Sample Size 655