Summary Report for Lake Worth Lagoon Contacts: Beth Orlando, South Florida Water Management District Eric Anderson, Department of Environmental Resource Management, Palm Beach County Laura Yarbro, Florida Fish and Wildlife Conservation Commission In Seagrass Integrated Mapping and Monitoring Program Mapping and Monitoring Report No. 2.0 FWRI Technical Report TR-17 version 2 2016 Edited by Laura A. Yarbro and Paul R. Carlson Jr. Florida Fish and Wildlife Conservation Commission Fish and Wildlife Research Institute 100 Eighth Avenue Southeast St. Petersburg, Florida 33701 USA
Transcript
Summary Report for Lake Worth Lagoon
Contacts:
Beth Orlando, South Florida Water Management District
Eric Anderson, Department of Environmental Resource Management,
Palm Beach County
Laura Yarbro, Florida Fish and Wildlife Conservation Commission
In
Seagrass Integrated Mapping and Monitoring Program
Mapping and Monitoring Report No. 2.0
FWRI Technical Report TR-17 version 2
2016
Edited by Laura A. Yarbro and Paul R. Carlson Jr.
Florida Fish and Wildlife Conservation Commission
Fish and Wildlife Research Institute
100 Eighth Avenue Southeast
St. Petersburg, Florida 33701 USA
SIMM Report No. 2.0 Summary Report for Lake Worth Lagoon Yarbro & Carlson
Summary Report for Lake Worth Lagoon
Contacts: Beth Orlando, South Florida Water Management District (mapping and monitoring); Eric Anderson, Department of Environmental Resource Management, Palm Beach County (monitoring); Laura Yarbro (editor)
General assessment: Field surveys in 2013 of seagrass beds identified in maps from 2007 imagery showed that acreage had declined from 1,688 acres in 2007 to 1,592 acres in 2013. Seagrass cover in Lake Worth Lagoon (LWL) between 2001 and 2007 was generally stable or slightly increasing in area. Most of the seagrass (65%) is found in North LWL near Singer Island in Riviera Beach (Figure 1). Seven species of seagrass are found in the lagoon. Based on data from the 2013 field surveys, the most common species in North LWL was manateegrass (Syringodium filiforme), followed in occurrence by shoalgrass (Halodule wrightii), paddlegrass (Halophila decipiens), Johnson’s seagrass (Halophila johnsonii) and turtlegrass (Thalassia testudinum). The least coverage by seagrasses (12%) occurs in the central lagoon, and seagrasses in the southern lagoon occurred slightly more frequently than those in the central lagoon. Johnson’s seagrass was most common in the central lagoon, and paddlegrass, shoalgrass, and Johnson’s seagrass were most common in the southern lagoon. Seagrass species composition has become more variable since 2012. Annual transect monitoring indicated decreases in cover and density after the 2004, 2005, and 2006 hurricanes. Record high levels of
Figure 1 Seagrass beds in Lake Worth Lagoon, 2007.
seagrass cover and density were noted in 2007, but slight decreases were observed in 2008 and 2009. Tropical Cyclone Isaac in August 2012 caused heavy freshwater runoff to the lagoon and the abundance of seagrasses sharply decreased, especially near the mouth of the C-51 canal in the central lagoon (RECOVER, 2014).
FWRI Technical Report TR-17 version 2.0 246
SIMM Report No. 2.0 Summary Report for Lake Worth Lagoon Yarbro & Carlson
Freshwater inputs were much greater than normal during the wet season of 2013 and seagrasses have not yet recovered. Heavy rains in southern Florida in winter and spring of 2016 forced the U.S. Army Corps of Engineers to discharge large amounts of freshwater to estuaries in south Florida, further exacerbating damage to seagrasses. Stressors include low and varying salinity, nutrients, suspended sediments, and turbidity associated with stormwater discharges from three major canals (C-51,
West Palm Beach Canal; C-16, Boynton Canal; and C-17, Earman River). As this report was finalized, a catastrophic cyanobacterial bloom originating from Lake Okeechobee was overgrowing lagoon waters. Emergency response by a variety of agencies continues.
Minor propeller scarring is evident around South Lake Worth (Boynton) Inlet and Lake Worth (Palm Beach) Inlet but is minimal elsewhere.
General Status of Seagrasses in Lake Worth Lagoon
Status and stressors Status Trend Assessment, causes
Seagrass cover Red Declining Heavy runoff, turbid waters
Water clarity Red Declining Affected by runoff, storms
Nutrients, turbidity Yellow Increasing Affected by runoff, storms
Natural events Red Serious impacts 2004–2006 tropical cyclones;
excessive rainfall in 2013, 2016
Propeller scarring Green Localized Near inlets
Geographic extent: Lake Worth Lagoon is a long, narrow body of water located inside barrier islands in Palm Beach County (Figure 1); historically, it was a freshwater lake prior to modifications that included channel dredging, creation of canals, port development, and hardening of the shorelines. At present, LWL is an urban lagoon with more than 80% of its shoreline hardened by bulkheads. The lagoon can be divided into three segments based on water quality, water circulation, and physical characteristics. The northern LWL extends from North Palm Beach at PGA Boulevard to the Flagler Memorial Bridge in Riviera Beach and includes the Lake Worth Inlet to the Atlantic Ocean. The northern segment
receives freshwater from the C-17 canal (Earman River). The central LWL is adjacent to West Palm Beach, extending from the Flagler Memorial Bridge south to Lake Worth Road and Bridge; it receives most of the freshwater inflow (51%) from the C-51 canal to the lagoon. The southern LWL extends from the Lake Worth Bridge in the north to Boynton Beach at the southern end of the lagoon. The southern segment receives freshwater from the C-16 canal (the Boynton Beach Canal) and has an opening to the Atlantic Ocean at the South Lake Worth Inlet in Boynton Beach. Freshwater coming into the lagoon reduces salinity levels, causes highly variable salinities from season to season and year to year, and
FWRI Technical Report TR-17 version 2.0 247
SIMM Report No. 2.0 Summary Report for Lake Worth Lagoon Yarbro & Carlson
brings in large amounts of nutrients, suspended sediments and contaminants (RECOVER, 2014).
Mapping and Monitoring Recommendations
• Map and monitor seagrasses in areas where conventional aerial photography is not effective (where water is too deep; visibility through the water column is poor; and diminutive species such as paddlegrass and Johnson’s seagrass are dominant).
• Collect aerial photography on a routine basis, when waters are clear enough to image the bottom.
• Continue the field monitoring program carried out by the South Florida Water Management District (SFWMD) and partners.
Management and Restoration Recommendations
• Monitor the effects of hydrologic changes in the watershed on seagrasses. The restoration target for submersed aquatic vegetation in LWL is 2,000 acres, based on water depths and sediment types for each segment of the lagoon. Assessment of the proposed changes in freshwater discharges, nutrient loads, and sediment loads from the canals that empty into LWL on the distribution and abundance of seagrasses will provide information on the impacts of hydrologic changes on seagrasses in the LWL.
• Evaluate nutrient and suspended sediment loading from the agricultural areas (L8 basin) and
identify the most cost-effective management options.
Summary assessment: Based on field surveys, seagrass acreage in Lake Worth Lagoon was estimated to be 1,592 acres in 2013, a small decrease (96 acres) from 1,688 acres mapped from imagery collected in 2007. Most of the losses occurred in the central lagoon. Seagrasses remained relatively stable between 2001 and 2007, although some increases in patchy cover were observed (Table 1). From 1990 to 2001, 484 acres of seagrass, or 23%, were apparently lost (data not shown), but different mapping methods were used in the 1990 assessment, which may account for some of this difference. Annual fixed transect monitoring by staff from Palm Beach County showed that seagrass cover varied over the nine years of the project: years of poor water quality due to increased freshwater releases (2004, 2005, and 2006) coincided with widespread reductions in seagrass cover. The monitoring program documented increases in seagrasses in 2001, 2002, 2007, and 2009, when water quality was better. However, it is very difficult to provide an accurate estimate of seagrass habitat in the lagoon because of poor water quality, limited visibility through the water column, and the very small size and limited optical signature of Johnson’s seagrass and paddlegrass. Stressors include increased freshwater inputs to the lagoon, nutrients, sedimentation, turbidity, and phytoplankton and cyanobacterial blooms associated with runoff from urban storm water and regional canal discharges. Impacts of regional canal discharges extend throughout the lagoon but are most severe in the central portions adjacent to the C-51 canal. The hurricanes of 2004, 2005, 2006,
FWRI Technical Report TR-17 version 2.0 248
SIMM Report No. 2.0 Summary Report for Lake Worth Lagoon Yarbro & Carlson
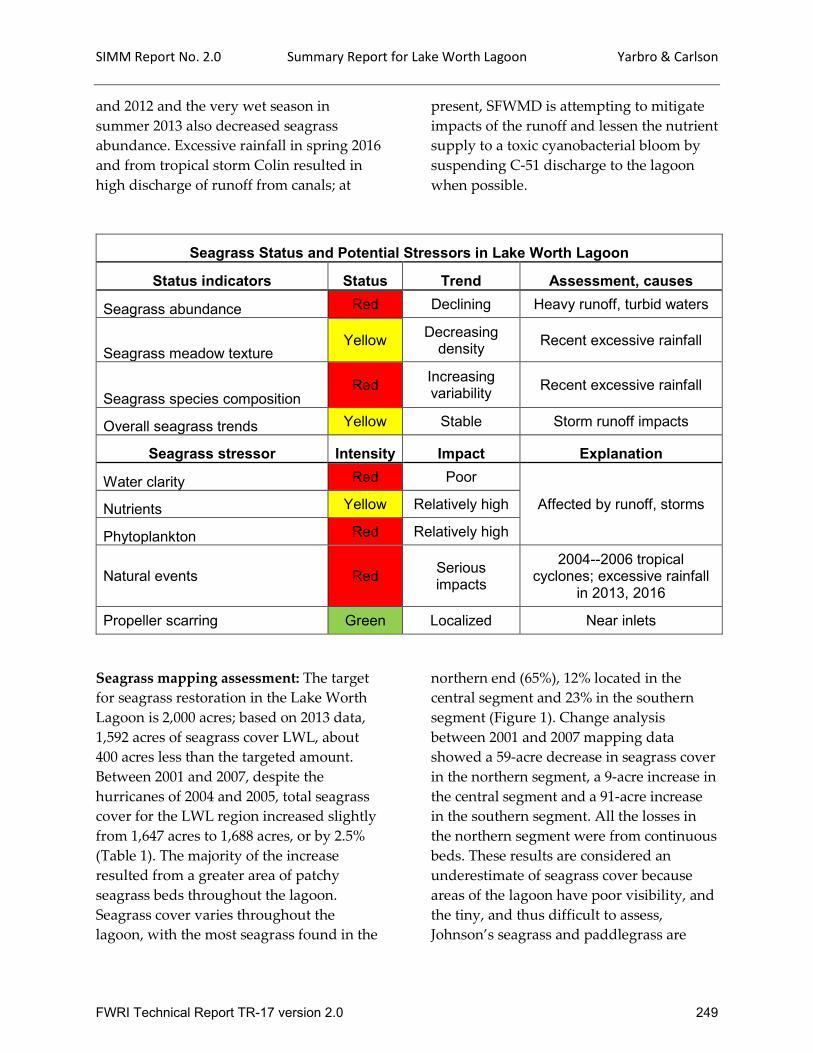
and 2012 and the very wet season in summer 2013 also decreased seagrass abundance. Excessive rainfall in spring 2016 and from tropical storm Colin resulted in high discharge of runoff from canals; at
present, SFWMD is attempting to mitigate impacts of the runoff and lessen the nutrient supply to a toxic cyanobacterial bloom by suspending C-51 discharge to the lagoon when possible.
Seagrass Status and Potential Stressors in Lake Worth Lagoon
Status indicators Status Trend Assessment, causes
Seagrass abundance Red Declining Heavy runoff, turbid waters
Affected by runoff, storms Nutrients Yellow Relatively high
Phytoplankton Red Relatively high
Natural events Red Serious impacts
2004--2006 tropical cyclones; excessive rainfall
in 2013, 2016
Propeller scarring Green Localized Near inlets
Seagrass mapping assessment: The target for seagrass restoration in the Lake Worth Lagoon is 2,000 acres; based on 2013 data, 1,592 acres of seagrass cover LWL, about 400 acres less than the targeted amount. Between 2001 and 2007, despite the hurricanes of 2004 and 2005, total seagrass cover for the LWL region increased slightly from 1,647 acres to 1,688 acres, or by 2.5% (Table 1). The majority of the increase resulted from a greater area of patchy seagrass beds throughout the lagoon. Seagrass cover varies throughout the lagoon, with the most seagrass found in the
northern end (65%), 12% located in the central segment and 23% in the southern segment (Figure 1). Change analysis between 2001 and 2007 mapping data showed a 59-acre decrease in seagrass cover in the northern segment, a 9-acre increase in the central segment and a 91-acre increase in the southern segment. All the losses in the northern segment were from continuous beds. These results are considered an underestimate of seagrass cover because areas of the lagoon have poor visibility, and the tiny, and thus difficult to assess, Johnson’s seagrass and paddlegrass are
FWRI Technical Report TR-17 version 2.0 249
SIMM Report No. 2.0 Summary Report for Lake Worth Lagoon Yarbro & Carlson
dominant. As a result, mapping efforts may not have accurately identified seagrass cover. Mapping efforts identified only seagrass beds that were 0.25 acre or more in size and were designed to detect large-scale changes.
Monitoring assessment: In 2000, the Palm Beach County Department of Environmental Resource Management (PBC DERM) initiated a long-term seagrass monitoring program that included the establishment and annual assessment of nine fixed transects throughout LWL. With
improving water quality and clarity, seagrasses are expected to grow at greater depths or to increase in density and diversity. To test this hypothesis, transects were located in areas where the lagoon bottom increased in depth by 1–2 ft. within 50–100 ft. of the edge of an existing bed. The first five years of surveys showed fluctuations in seagrass cover with no obvious pattern of increase or decrease—until the hurricanes of 2004. Surveys conducted in June 2005 and 2006 showed a large decrease in seagrass cover in most areas of the lagoon (Figure 2).
Table 1 Seagrass acreage in Lake Worth Lagoon (LWL) based on mapping data obtained by photo-interpretation of aerial imagery.
Year Habitat type North LWL
Central LWL
South LWL
Total LWL
2001 Patchy 13 1 0 14
Continuous 1,136 195 302 1,633
All seagrass 1,149 196 302 1,647
2007 Patchy 21 21 10 52
Continuous 1,069 184 383 1,636
All seagrass 1,090 205 393 1,688
Change, 2001–2007
Patchy 8 20 10 38
Continuous -67 -11 81 3
All seagrass -59 9 91 41
Percent Change -5.10% 4.6% 30% 2.5%
These losses likely resulted from increased turbidity and suspended sediments caused by runoff from the hurricanes and discharges from Lake Okeechobee, as well as burial and scour from wave action. Areas suffering the least impact were shallow sites and sites closer to inlets where water
quality was least affected by runoff. The 2007 survey reported record highs in terms of total number of sampling locations at which seagrass was observed and of percentage cover at the sampling locations. The 2007, 2008, and 2009 surveys documented not only increases in seagrass
FWRI Technical Report TR-17 version 2.0 250
SIMM Report No. 2.0 Summary Report for Lake Worth Lagoon Yarbro & Carlson
cover but also the expansion of beds into deeper water.
A monitoring program, coordinated by SFWMD, began in December 2008, and consists of monitoring five seagrass beds every two months. At each site, 30 1-m2 quadrats are evaluated for seagrass species composition and canopy height. Two sites are located in the northern LWL, north and south of outlet of the C-17 canal, and the
remaining three sites are in the central LWL, with two sites north of the outlet of the C-51 canal and one site south of the C-51 outlet. In 2012, the northernmost site, near the outlet of the C-51 canal was eliminated, and sampling frequency was reduced to twice yearly, once in spring and once in fall. Beginning in 2014, monitoring frequency was increased to 4–5 times between March and October of each year.
Figure 2 Seagrass occurrence along monitoring transects, 2000–2009. In 2000, the project consisted of only five transects (15 stations). In 2001–2005 and 2007-2009, monitoring occurred along nine transects (27 stations). In 2006, poor water quality allowed for the monitoring of only four transects (12 stations). In 2006, the number shown is the average of 2005 and 2007 values.
Mapping and Monitoring Recommendations
• Continue to map and monitor seagrasses in areas where conventional aerial photography is not effective (where water is too deep; visibility through the water column is poor; and diminutive species such as paddlegrass and Johnson’s seagrass are dominant).
• Collect aerial photography on a routine basis, when waters are clear enough to image the bottom.
• Continue the field monitoring program carried out by SFWMD and partners.
Management and Restoration Recommendations
• Assess proposed changes in freshwater discharges, nutrient loads, and sediment loads from the canals that empty into LWL.
• Evaluate nutrient and suspended sediment loading from the agricultural areas (L8 basin), and identify the most cost-effective management options.
• Assess the effects of high levels of storm runoff and canal discharges in 2016 on seagrass communities in the central lagoon.
FWRI Technical Report TR-17 version 2.0 251
SIMM Report No. 2.0 Summary Report for Lake Worth Lagoon Yarbro & Carlson
• Establish a framework for detecting effects of climate change and ocean acidification on coastal marine resources in the region.
Mapping methods, data, and imagery: In 2001 and 2007, natural color aerial photography of the Lake Worth Lagoon region was flown at 1:10,000 scale for Palm Beach County by U.S. Imaging (Bartow, FL). The original negative and copies of diapositives are housed at PBC DERM. Benthic habitats were classified and mapped by Avineon, Inc. (Clearwater, FL) using the Florida Land Use Cover and Forms Classification System (Florida Department of Transportation, 1999). ArcMap shapefiles of benthic habitats are available on the Fish and Wildlife Research Institute Marine Resources Geographic Information System (MRGIS) website (http://ocean.floridamarine.org/mrgis/.) or by contacting PBC DERM. Acquisition of aerial imagery was planned for 2012, but water clarity in the lagoon was not sufficient to image the bottom. Instead, a field survey was designed and carried out in 2013 to identify whether seagrass beds mapped from 2007 imagery had expanded or receded. More than 1,500 sites were visited, including locations in Jupiter Sound, Lake Wyman, and Lake Boca Raton.
Monitoring methods and data: A variety of groups and agencies monitors seagrass in Lake Worth Lagoon (Table 2). Between 2000 and 2009, the PBC DERM Fixed Transect Monitoring Project (FTMP) monitored seagrass annually along nine transects (27 stations) throughout LWL. From 2006 through 2012, the Fish and Wildlife Research Institute (FWRI) and the National Oceanic and Atmospheric Administration (NOAA) monitored Johnson’s seagrass (H. johnsonii) at 8 locations and 33 stations in August for the H. johnsonii Recover Team. This monitoring effort will resume in 2016. And in 2009, the South Florida Water Management District (SFWMD) and the U.S Army Corps of Engineers (USACOE) began bimonthly monitoring at five locations (with 30 stations at each location) for the Comprehensive Everglades Restoration Plan (CERP) Restoration, Coordination, and Verification (RECOVER) Seagrass Monitoring Section. In 2012 and 2013, the northernmost location was eliminated and sampling frequency was reduced to once in spring and once in fall each year. Since 2014, monitoring frequency has increased to 4–5 times between March and October of each year. At each site, 30 1–m2 quadrats are randomly scattered, and the seagrass species present is determined for 25 sub-quadrants of each quadrat. Canopy height is also estimated in each quadrat.
SIMM Report No. 2.0 Summary Report for Lake Worth Lagoon Yarbro & Carlson
Pertinent Reports and Scientific
Publications
CARTER, K. 2013. Numeric Nutrient Criteria Update. Presentation to the Palm Beach County Water Resources Task Force, South Florida Water Management District, West Palm Beach, FL, 19 p. http://www.pbcgov.com/wrtf/pdf/presentat
ions/101713‐NNC_Update.pdf. Accessed April 2016. CHESNES, T. C., S. DUNCAN, K. SWICK, and C. JABALY. 2014. Biodiversity of submerged aquatic vegetation in Lake Worth Cove, a protected region of Lake Worth Lagoon, Florida. Biodiversity 12: 90–96. CHRISTIAN, J., and M. O. HALL. 2012. Task 1: Johnson’s Seagrass distribution and abundance surveys and monitoring of populations in the southern range. Project Report 10 submitted to the Lake Worth Lagoon Initiative. West Palm Beach, FL, 12 p. http://www.lwli.org/pdfs/2013Management
Plan/2012JohnsonsSeagrassSurveys2006‐2011.pdf. Accessed April 2016. CRIGGER, D. K., G. A. GRAVES, and D. L. FIKE. 2005. Lake Worth Lagoon conceptual ecological model. Wetlands 25:943–954.
FLORIDA DEPARTMENT OF TRANSPORTATION. 1999. Florida Land Use, Cover and Forms Classification System, a Handbook, Division of Surveying and Mapping, Geographic Mapping Section, Tallahassee, FL, 92 p.
LAKE WORTH LAGOON HABITAT WORKING GROUP. 2014. Lake Worth
eetings/20140313LWLSeagrassMapping.pdf. Accessed April 2016.
LAKE WORTH LAGOON INITIATIVE SYMPOSIUM. 2013. Presentation abstracts. Palm Beach Atlantic University, West Palm Beach, FL, 51 p. LAKE WORTH LAGOON MANAGEMENT PLAN. 2013. Lake Worth Lagoon Initiative. West Palm Beach, FL, 235 p. http://www.pbcgov.org/erm/lwli/pdfs/2013
ManagementPlan/2013LWLmanagementpla
nFINAL.pdf. Accessed April 2016. PALM BEACH COUNTY DEPARTMENT OF ENVIRONMENTAL RESOURCES MANAGEMENT IN CONJUNCTION WITH DAMES AND MOORE. 1990. Lake Worth Lagoon natural resources inventory and resource management study, West Palm Beach, FL, 226 p. PALM BEACH COUNTY DEPARTMENT OF ENVIRONMENTAL RESOURCES MANAGEMENT AND STATE OF FLORIDA DEPARTMENT OF ENVIRONMENTAL PROTECTION, SOUTHEAST DISTRICT. 1998. Lake Worth Lagoon management plan, West Palm Beach, FL, 257 p. PALM BEACH COUNTY DEPARTMENT OF ENVIRONMENTAL RESOURCES MANAGEMENT. 2008. Palm Beach County Mangrove and Seagrass Mapping Project. Final report prepared by Avineon, Inc., West Palm Beach, FL, 18 p.
FWRI Technical Report TR-17 version 2.0 253
SIMM Report No. 2.0 Summary Report for Lake Worth Lagoon Yarbro & Carlson
PALM BEACH COUNTY DEPARTMENT OF ENVIRONMENTAL RESOURCES MANAGEMENT. 2009. Lake Worth Lagoon: fixed transect seagrass monitoring cumulative report 2000-2008. Final report prepared by Applied Technology and Management, Inc., West Palm Beach, FL.
PARKER, M. L., W. S. ARNOLD, S. P. GEIGER, P. GORMAN, and E. H. LEONE. 2013. Impacts of freshwater management activities on Eastern Oyster (Crassotrea virginica) density and recruitment: recovery and long-term stability in seven Florida estuaries. Journal of Shellfish Research 32: 695–708.
Restoration Coordination and VERification. 2007. Final 2007 system status report. Section 5. Northern Estuaries Module, Comprehensive Everglades Restoration Plan, 5–16 p.
RECOVER: 2014 SYSTEM STATUS REPORT LAKE WORTH LAGOON. 2014. Comprehensive Everglades Restoration Plan (CERP). http://141.232.10.32/pm/ssr_2014/area_lwl_2014.aspx. Accessed April 2016.
General References and Additional Information
Lake Worth Lagoon Initiative, http://www.pbcgov.org/erm/lwli/index.asp. Accessed April 2016.
Seagrasses. Palm Beach County. http://www.pbcgov.com/erm/lakes/seagrasses/. Accessed April 2016.
Seagrass Poster. Palm Beach County. http://www.co.palm-beach.fl.us/erm/lakes/estuarine/lake-worth-lagoon/pdf/Poster-Seagrasses-General.pdf. Accessed April 2016.
Contacts
Mapping and monitoring: Beth Orlando, South Florida Water Management District, 561-682-2891, [email protected].
Monitoring: Eric Anderson, Department of Environmental Resource Management, Palm Beach County, 561-233-2514, [email protected].
Editor: Laura Yarbro, Florida Fish and Wildlife Conservation Commission, 727-896-8626, [email protected].
Document Citation:
Orlando, B., E. Anderson, and L. A. Yarbro. 2016. Summary report for Lake Worth Lagoon. pp. 246-254, in L. A. Yarbro and P. R. Carlson Jr., eds. Seagrass Integrated Mapping and Monitoring Report No. 2. Fish and Wildlife Research Institute Technical Report TR-17, version 2. Florida Fish and Wildlife Conservation Commission, St. Petersburg. 281 p. DOI: 10.13140/RG.2.2.12366.05445.