73
Summer Flounder 2016-2018 Management Measures August 12, 2015 New York, NY
Summer Flounder
2016-2018 Management Measures
August 12, 2015
New York, NY

Outline
1. Specifications Timeline
2. Stock Status
3. Regulatory Review
4. Recent Fishery Performance
5. Advisory Panel Fishery Performance Reports
6. Staff Recommendations
7. SSC Recommendations
8. Monitoring Committee Recommendations
9. Additional Advisor Comments

Specifications Timeline
• Advisory Panel meets to develop Fishery Performance Reports
June 17
• SSC meets to recommend ABCsJuly 22-23
• Monitoring Committee meets to recommend ACTs
July 23-24
• Advisory Panel webinar to review stock status and SSC/MC recommendations
July 29
• Joint Council and Board meetingAugust 12

STOCK STATUS

Stock Status
2013: Last benchmark assessment (SAW/SARC 57)
• Age-structured assessment program (ASAP)
• Not overfished, overfishing not occurring in 2012
2014: Data update only
• Catch, landings, discards, fishery independent survey indices
2015: Assessment update
• Not overfished, but overfishing was occurring in 2014

Biological Reference Points
Fishing mortality threshold
• F35% = FMSY proxy = 0.309
Biomass target
• SSB35% = SSBMSY = 137.56 mil lb (62,394 mt)
Biomass threshold
• Minimum stock size threshold = 1/2 SSBMSY =
68.78 mil lb (31,197 mt)
From SAW/SARC 57:

Fishing Mortality
0.0
0.2
0.4
0.6
0.8
1.0
1.2
1.4
1.6
1.8
2.0
0
5,000
10,000
15,000
20,000
25,000
30,0001
98
2
198
6
1990
199
4
199
8
200
2
200
6
2010
F (
ag
e 4
)
To
tal C
atc
h (
mt)
Total Catch and Fishing Mortality(from 2013 assessment)
Total Catch F (age 4) F35% = FMSY = 0.309

Fishing Mortality
0.0
0.2
0.4
0.6
0.8
1.0
1.2
1.4
1.6
1.8
2.0
0
5,000
10,000
15,000
20,000
25,000
30,0001
98
2
198
4
198
6
1988
199
0
199
2
199
4
199
6
199
8
200
0
200
2
200
4
200
6
200
8
201
0
201
2
2014
F (
ag
e 4
)
To
tal C
atc
h (
mt)
Total Catch and Fishing Mortality2015 Update
Total Catch F (age 4) FMSY= F35% = 0.309

SSB and Recruitment
0
20,000
40,000
60,000
80,000
100,000
0
10,000
20,000
30,000
40,000
50,000
60,000
70,0001
98
2
198
6
199
0
199
4
199
8
200
2
2006
201
0
R (
ag
e 0
, 0
00
s)
SS
B (
mt)
Spawning Stock Biomass (SSB) and Recruitment (R)
(from 2013 assessment)
R SSB SSB35% = SSBMSY = 62,394 mt
SSB threshold
SSB target

SSB and Recruitment
0
20,000
40,000
60,000
80,000
100,000
0
10,000
20,000
30,000
40,000
50,000
60,000
70,000
1982
1984
1986
1988
1990
1992
1994
1996
1998
20
00
2002
2004
2006
20
08
2010
2012
2014
R (
ag
e 0
, 0
00
s)
SS
B (
mt)
Spawning Stock Biomass (SSB) and Recruitment (R)
2015 Update
R SSB
SSBMSY = SSB35% = 62,394 mt 1/2 SSBMSY = 1/2 SSB35% = 31,197 mt
SSB threshold
SSB target

Note: shift in F (up) and SSB (down)from 2011 to 2012 to 2013 assessments
Summer Flounder Historical Retrospective
1990-2015 Stock Assessments
1980 1985 1990 1995 2000 2005 2010 2015
Fis
hin
g M
ort
ali
ty (
F)
0.0
0.5
1.0
1.5
2.0
2.5
Year
1980 1985 1990 1995 2000 2005 2010 2015
SS
B (
000s m
t)
0
15
30
45
60
75
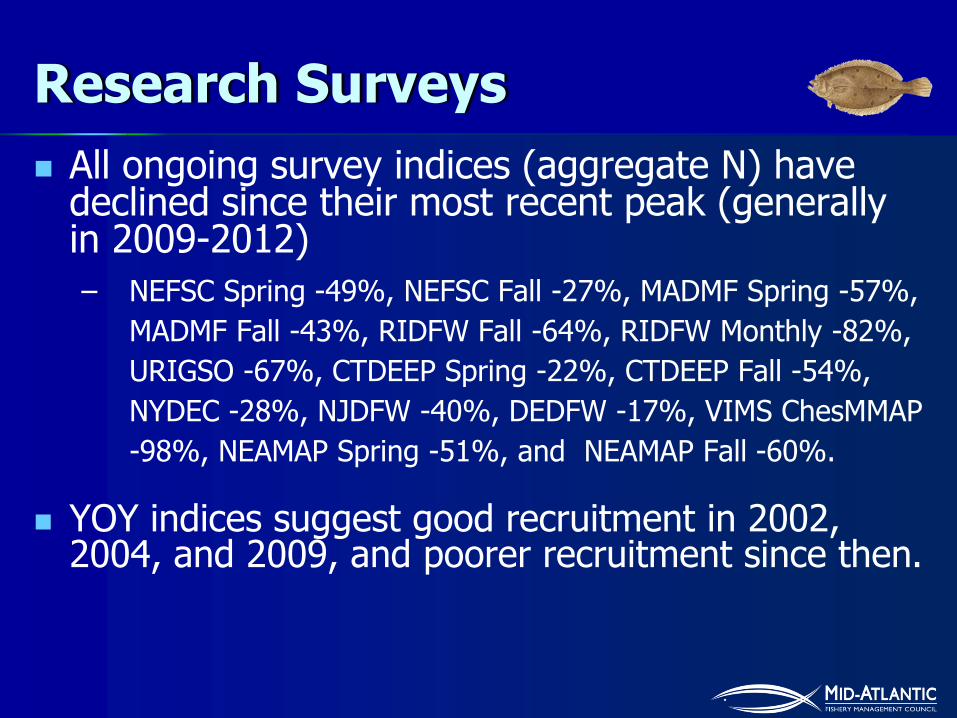
Research Surveys
All ongoing survey indices (aggregate N) have declined since their most recent peak (generally in 2009-2012)
– NEFSC Spring -49%, NEFSC Fall -27%, MADMF Spring -57%,
MADMF Fall -43%, RIDFW Fall -64%, RIDFW Monthly -82%,
URIGSO -67%, CTDEEP Spring -22%, CTDEEP Fall -54%,
NYDEC -28%, NJDFW -40%, DEDFW -17%, VIMS ChesMMAP
-98%, NEAMAP Spring -51%, and NEAMAP Fall -60%.
YOY indices suggest good recruitment in 2002, 2004, and 2009, and poorer recruitment since then.
REGULATORY REVIEW

Regulatory Review
Multi-year specifications were set for 2014-2015, based on 2013 assessment projections
In 2014: SSC and Council/Board reviewed 2015 catch limits – Data update
– No changes recommended

Regulatory Review
2013 assessment: Level 3
– Now: “SSC-modified OFL probability distribution” level
No alternative level of uncertainty in OFL provided in assessment as required for level 2

Regulatory Review
Specified a CV of 60%
– “Considerably more accurate” than other mid-Atlantic assessments
– 60% based on review of CVs in published simulation experiments where model fully reflected underlying population dynamics
Regulatory Review
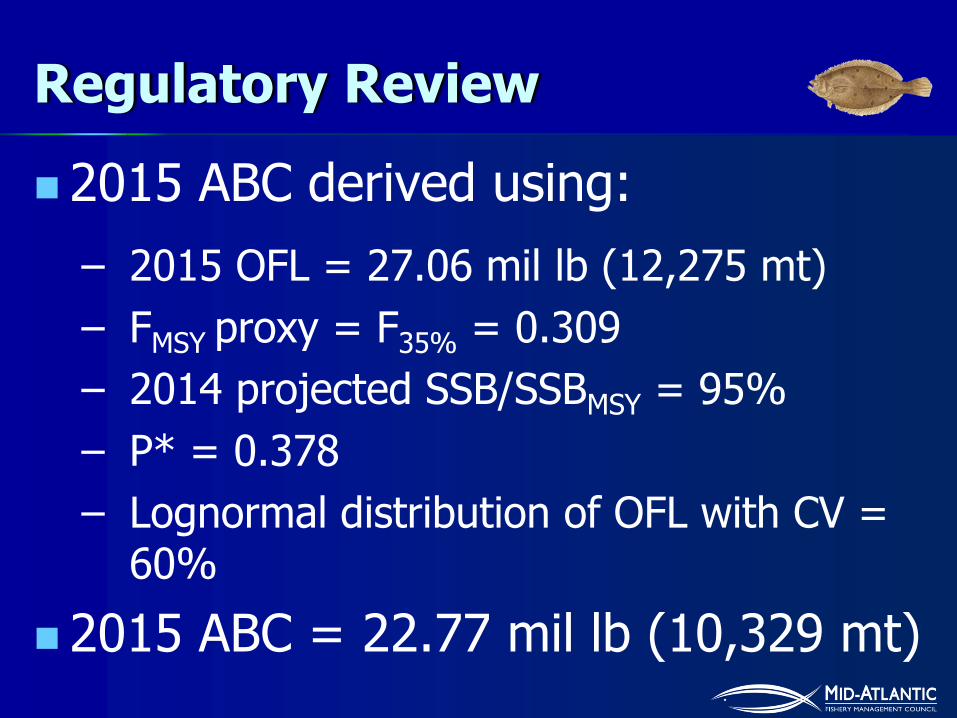
2015 ABC derived using:
– 2015 OFL = 27.06 mil lb (12,275 mt)
– FMSY proxy = F35% = 0.309
– 2014 projected SSB/SSBMSY = 95%
– P* = 0.378
– Lognormal distribution of OFL with CV = 60%
2015 ABC = 22.77 mil lb (10,329 mt)

RECENT FISHERY PERFORMANCE

Fishery Performance
0
10
20
30
40
50
60
70
Lan
din
gs (
Mill
ion
s o
f lb
)
Commercial Recreational
Total landings
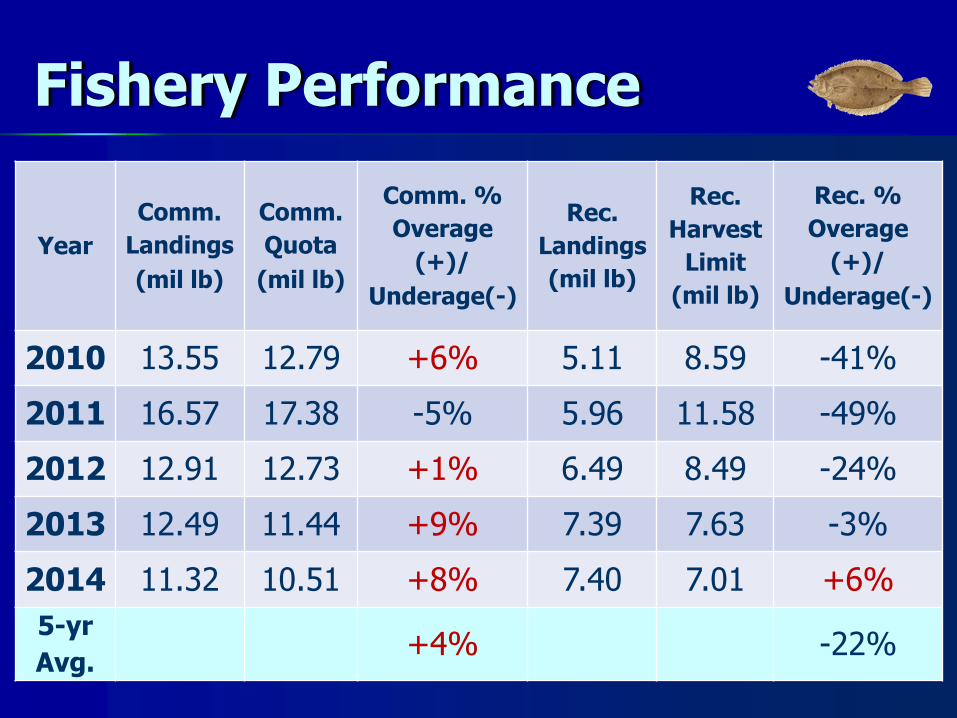
Fishery Performance
Year
Comm.
Landings
(mil lb)
Comm.
Quota
(mil lb)
Comm. %
Overage
(+)/
Underage(-)
Rec.
Landings
(mil lb)
Rec.
Harvest
Limit
(mil lb)
Rec. %
Overage
(+)/
Underage(-)
2010 13.55 12.79 +6% 5.11 8.59 -41%
2011 16.57 17.38 -5% 5.96 11.58 -49%
2012 12.91 12.73 +1% 6.49 8.49 -24%
2013 12.49 11.44 +9% 7.39 7.63 -3%
2014 11.32 10.51 +8% 7.40 7.01 +6%
5-yr
Avg.+4% -22%

Quota Monitoring

ADVISORY PANEL FISHERY PERFORMANCE REPORT
Fishery Performance Report
Environmental and Ecological Issues
Fishery performing well biologically
Market and Economic Issues
Commercial fishery performance could be improved
Potential to increase profits by reducing operating costs

Fishery Performance Report
Market and Economic Issues
Current state-by-state regulations and landings restrictions result in significant steam time/high operating costs
Overall economy has had big impact on for-hire and private recreational sectors
Southern NJ negatively impacted by regional recreational management

Fishery Performance Report
General Management Issues
Current large size limits focus effort on large females
Management should focus on reducing waste and increasing utilization of catch
Assumed discard mortality rates for recreational fishery may be underestimates
Fishery Performance Report
Commercial Management Issues
Turtle Excluder Device (TED) requirements affect distribution of effort and landings (reduced effort in southern end of management unit)
Minimum size limit unnecessary given minimum mesh size
– Eliminate min. size to reduce regulatory discards

Fishery Performance Report
Commercial Management Issues
Regional differences in discard mortality due to use of conveyers in northern areas to sort fish on deck

Fishery Performance Report
Recreational Management Issues
Northern and Southern New Jersey should have different recreational measures
Discards have increased due to high minimum size limits
Reduced opportunity to keep fish has led to decreases in for-hire customers

Fishery Performance Report
Recreational Management Issues
Total length limit suggested
Restrictions on striped bass may explain some increased effort on summer flounder and sea bass
Some believe sector separation should be considered (for-hire vs. private), but basis for separation would be flawed if MRIP data used

Fishery Performance Report
Recreational Management Issues
Concern about accuracy of MRIP estimates
Effort survey is flawed; coastal household telephone surveys not working
NMFS should test phone/web app for recreational data collection
Fishery Performance Report
Recreational Management Issues
Management should make better use of for-hire VTR data
Education/outreach should be increased on flounder handling, release techniques, and optimal hook size

Fishery Performance Report
Research Needs
Sex-specific assessment model
Information about segregation by season and sex
Spawning areas and timing to inform potential management strategies
Fishermen input needed on trawl survey design
STAFF RECOMMENDATIONS
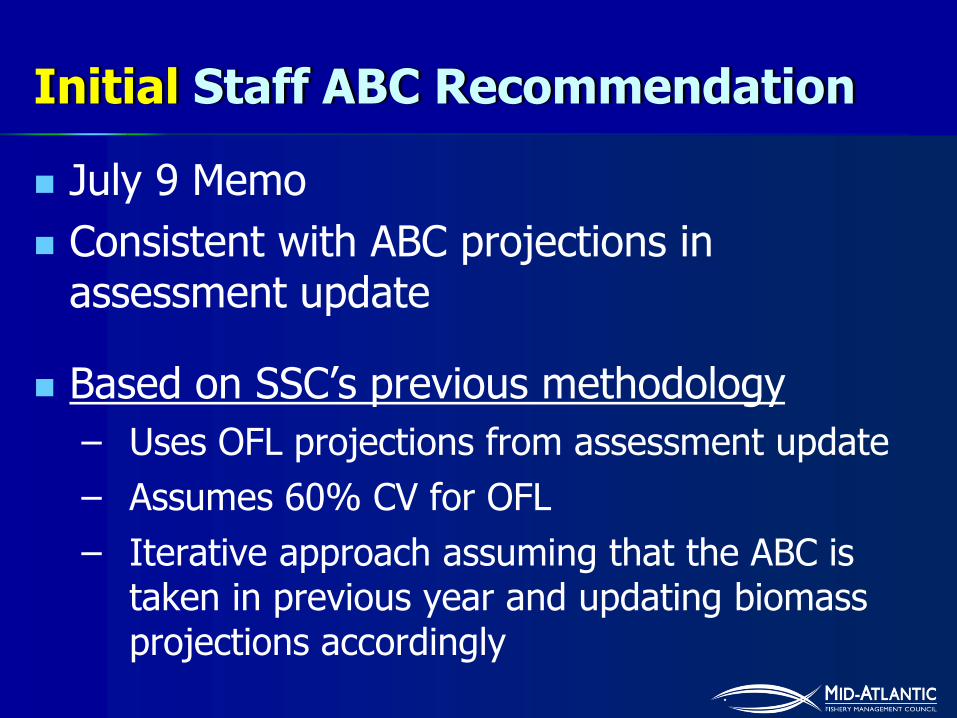
Initial Staff ABC Recommendation
July 9 Memo
Consistent with ABC projections in assessment update
Based on SSC’s previous methodology
– Uses OFL projections from assessment update
– Assumes 60% CV for OFL
– Iterative approach assuming that the ABC is taken in previous year and updating biomass projections accordingly

Initial Staff ABC Recommendation
YearABC
(mil lb)ABC (mt) F P*
SSB
(mil
lb)
SSB
(mt)
2015 22.77 10,329 0.385 n/a 93.53 42,423
2016 12.60 5,713 0.208 0.258 104.17 47,251
2017 15.20 6,894 0.222 0.292 114.38 51,880
2018 18.12 8,219 0.234 0.325 123.13 55,852
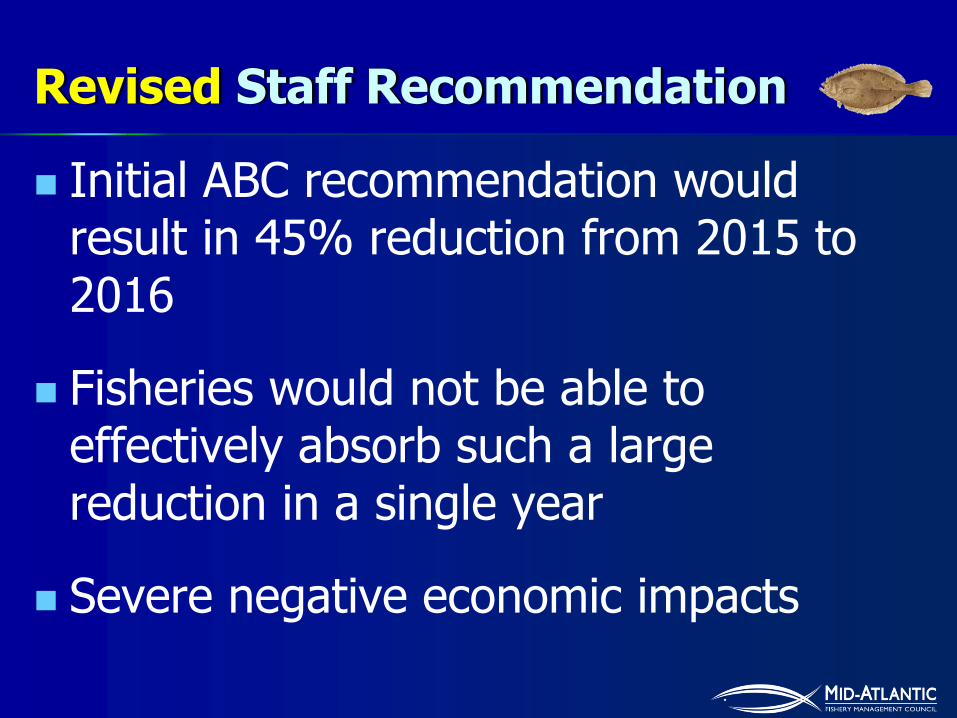
Revised Staff Recommendation
Initial ABC recommendation would result in 45% reduction from 2015 to 2016
Fisheries would not be able to effectively absorb such a large reduction in a single year
Severe negative economic impacts

Revised Staff Recommendation
July 17 Memo
Staff recommend 3-year phase-in of catch reductions
Regulations allow deviation from control rule, provided that the ABC does not exceed OFL and probability of overfishing does not exceed 50%

Revised Staff Recommendation
Staff recommends deviating from ABC control rule and applying reduced buffer between the OFL and ABC in 2016 and 2017 to address economic and social concerns
Buffer for scientific uncertainty
ABC
OFL

Revised Staff Recommendation
Start with calculated buffer for 2016 based on typical application of Council risk policy
Using that calculated % buffer:
– Apply 1/3 in 2016
– Apply 2/3 in 2017
– Full buffer in 2018
% buffer
ABC
OFL
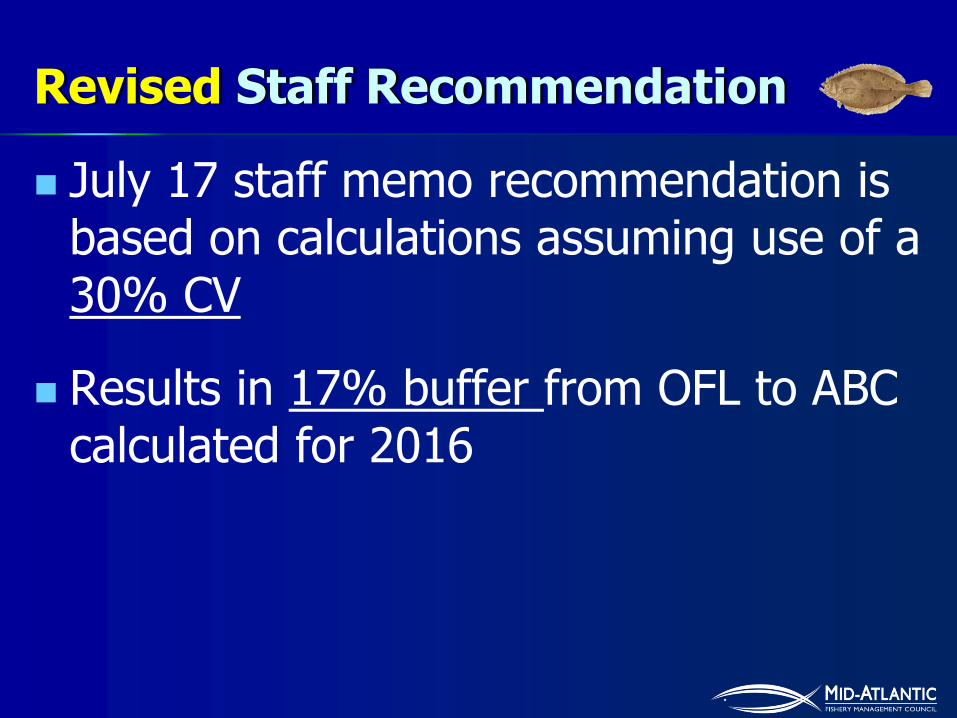
Revised Staff Recommendation
July 17 staff memo recommendation is based on calculations assuming use of a 30% CV
Results in 17% buffer from OFL to ABC calculated for 2016

Revised Staff Recommendation
OFL
ABC
10% buffer
OFL
ABC
12% buffer6%
buffer
17% buffer
ABC
OFL
2016 2017 2018
Phase-in approach in July 17 memo (30% CV):
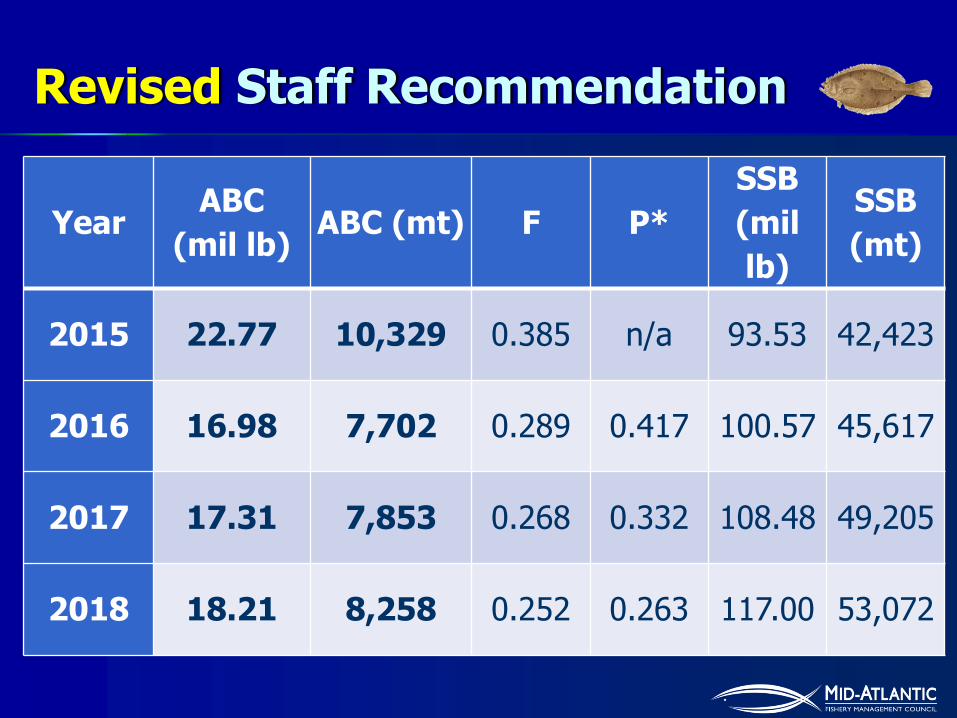
YearABC
(mil lb)ABC (mt) F P*
SSB
(mil
lb)
SSB
(mt)
2015 22.77 10,329 0.385 n/a 93.53 42,423
2016 16.98 7,702 0.289 0.417 100.57 45,617
2017 17.31 7,853 0.268 0.332 108.48 49,205
2018 18.21 8,258 0.252 0.263 117.00 53,072
Revised Staff Recommendation

MAFMC SSCABC Recommendation
Summer Flounder
2016 Fishing Year
1) The level of uncertainty that the SSC deems mostappropriate for the information content of the mostrecent stock assessment, based on criteria listed in theOmnibus Amendment.
• Model structure for update was unchanged from SARC 57, the last accepted benchmark.
SSC Decision: SSC-modified OFL probability
distribution

2) If possible, the level of catch (in weight) and theprobability of overfishing associated with theoverfishing limit (OFL).
• Accepted FMSY proxy=F35% = 0.309
SSC Decision:
2016 8,194 mt 18.064 M lbs
2017 8,991 mt 19.821 M lbs
2018 10,159 mt 22.396 M lbs

3) The level of catch (in weight) and the probability ofoverfishing associated with the acceptablebiological catch (ABC) for the stock based on anapproach which phases-in any required reductions inthe ABC specifications over a three-year period withoutexceeding the OFL or P* = 50%.
• SSC maintained the CV=60%
• ABC is ~ 90% of OFL in 2016
SSC Decision:
2016 7,375 mt 31.107 M lbs P*=0.425
2017 7,193 mt 28.397 M lbs P*=0.344
2018 7,111 mt 27.050 M lbs P*=0.260

3) The level of catch (in weight) and the probability ofoverfishing associated with the acceptablebiological catch (ABC) for the stock based on anapproach which phases-in any required reductions inthe ABC specifications over a three-year period withoutexceeding the OFL or P* = 50%.
• The phased in approach does not meet the Council’s risk policy in the first two years.
• The projected 2018 biomass is approx. equal to that expected if risk policy had been followed.
SSC Notes:
3) The level of catch (in weight) and the probability ofoverfishing associated with the acceptablebiological catch (ABC) for the stock.
• An updated assessment must be conducted for the SSC review of the Summer Flounder ABCs next year.
SSC Decision:

4) The most significant sources of scientific uncertaintyassociated with determination of OFL and ABC.
• Retrospective patterns evident in the assessment update have substantial implications for the reliability of model projections and inferences regarding the status of the stock. The causes of the retrospective pattern are unknown.
• Projections are made assuming the ABC will be harvested fully, but not exceeded. However, there are trends in harvest indicating an increasingly likelihood of catches exceeding ABCs.
SSC Decision (1 of 3):

4) The most significant sources of scientific uncertaintyassociated with determination of OFL and ABC.
• The potential exists for sex-specific differences in life history parameters.
• The existence of spatially distinct size distributions.
• NEFSC surveys and PMAFS fishery sampling confirm sexually-dimorphic and time-varying spatial differences in growth that are not fully accounted for in the stock assessment because not all fishery and survey catches were fully and independently sampled by sex.
SSC Decision (2 of 3):
4) The most significant sources of scientific uncertaintyassociated with determination of OFL and ABC.
• Landings from commercial fishery assume no under-reporting of Summer Flounder landings and thus should be considered minimal estimates.
• The current assumption for M remains an ongoing source of uncertainty. M is highly influential on assessment results and impacts nearly all aspects of the assessment and evaluation of status.
• The stock-recruitment relationship could not be defined internally in the model and thus an FMSY proxy was used to calculate the OFL.
SSC Decision (3 of 3):

5) Ecosystem considerations accounted for in the stockassessment.
SSC Decision: No additional ecosystem
recommendations were considered by the SSC

6) Research recommendations (1 of 2).
• The SSC recommends an expedited benchmark assessment to seek to improve model performance and reduce the retrospective bias present in the current assessment update.

6) Research recommendations (2 of 2).
• The SSC recognizes the research recommendations provided in the assessment report. In addition, the SSC recommends research be conducted to:
– Evaluate uncertainties in biomass to determine potential modifications to OFL CV employed;
– Evaluate fully the sex- and size distribution of landed and discarded fish, by sex, in the Summer Flounder fisheries;
– Evaluate past and possible future changes to size regulations on retention and selectivity in stock
assessments and projections; and
– Incorporate sex-specific differences in size at age into the stock assessment.
6) Certification that the recommendations provided bythe SSC represent the best scientificinformation available.
To the best of the SSC's knowledge, these
recommendations are based on the best
available scientific information.
MONITORING COMMITTEE RECOMMENDATIONS

Monitoring Committee Recs.
Monitoring Committee met July 23-24 to recommend Annual Catch Targets (ACTs) to account for management uncertainty
Also began review of commercial management measures
Monitoring Committee Recs.
Commercial monitoring and closure system is timely; has typically been successful in holding landings to quota
However – 2 years of above-average overages (2013 and 2014)
States and GARFO should identify reporting/monitoring problems
Monitoring Committee Recs.
If larger overages continue, Committee may need to address through future ACTs
Committee recommends no reduction from the commercial ACL to ACT for 2016-2018
Monitoring Committee Recs.
Recreational fishery has performed relatively well for the past 5 years
However, Monitoring and Technical Committees will need to carefully consider effects of proposed harvest limit decreases
– No in-season closure authority for recreational fishery

Monitoring Committee Recs.
Committee will consider management uncertainty explicitly when recommending recreational measures this fall
Committee recommends no reduction from the recreational ACL to ACT for 2016-2018
Monitoring Committee Recs.
Monitoring/Technical Committees will conduct a thorough evaluation of commercial management measures this fall, for Council/Board consideration in December
– Minimum fish size– Minimum mesh size – Seasonal possession limit triggers (incidental
possession limits) – Exemption programs (small mesh exemption
program and NC flynet exemption)

OFL
ABC
Commercial ACL Comm. landings plus discards
Commercial ACT
Commercial Quota ACT minus comm. discards
Recreational ACL Rec. landings plus discards
Recreational ACT
Recreational Harvest LimitACT minus rec. discards
State Quotas
Landings portion
Recreational landings
40% of landings portion (FMP)
Comm. discardsDiscards portion x avg. % of discards from comm. fishery,
2012-2014
Rec. discardsDiscards portion x avg. % of discards from rec. fishery,
2012-2014
Discards portion
Commercial landings
60% of landings portion (FMP)

2016-2018 SSC Recommendations
YearABC
(mil lb)ABC (mt)
% change
from 2015
2015 22.77 10,329 --
2016 16.26 7,375 -29%
2017 15.86 7,193 -30%
2018 15.68 7,111 -31%

Commercial Quotas
Management Measure2015 2016 2017 2018
mil lb mil lb mil lb mil lb
ABC 22.77 16.26 15.86 15.68
ABC landings portion 18.45 13.54 13.19 13.16
ABC discards portion 4.32 2.72 2.67 2.52
Commercial ACL=ACT 13.34 9.42 9.19 9.10
Projected comm.
discards2.27 1.30 1.28 1.21
Commercial quota 11.07 8.12 7.91 7.89

Rec Harvest Limits
Management Measure2015 2016 2017 2018
mil lb mil lb mil lb mil lb
ABC 22.77 16.26 15.86 15.68
ABC landings portion 18.45 13.54 13.19 13.16
ABC discards portion 4.32 2.72 2.67 2.52
Recreational ACL=ACT 9.44 6.84 6.67 6.58
Projected rec. discards 2.06 1.42 1.39 1.32
Recreational
harvest limit 7.38 5.42 5.28 5.26

ADDITIONAL ADVISOR COMMENTS

Additional Advisor Comments
Reiterated that fishery seems to be performing well
Need to better account for stock expansion and shift to the northeast
Concern that quota cuts and reduced fishing pressure will lead to further reduced recruitment

Additional Advisor Comments
Catch limit cuts of this magnitude are too drastic and too fast
Will have devastating economic and social impacts
– Elimination of directed fishery in some areas; will not be economically feasible to target
– Effort shifts to other species, though many are low value or already very restricted

Additional Advisor Comments
Concerns about trawl survey assessment inputs
– Timing
– Areas covered
– Gear configuration and flatfish catchability
– Calibration coefficients (Albatross vs. Bigelow)

Additional Advisor Comments
Additional assessment concerns:
– Uncertainty with regard to other inputs, e.g., MRIP
– Discard mortality rate assumptions
– SSB target is too high
– Too much precaution built in

Additional Advisor Comments
Other recommendations:
– Alternative recreational strategies (e.g., total cumulative length limit or slot limit)
– Lower minimum sizes to reduce pressure on large spawning females
– Reduce biomass of predator species
– Sex-based assessment
– Reduce discard mortality
– Spawning time/area management

QUESTIONS?


