21
WELINGKAR INSTITUTE OF MANAGEMENT DEVELOPMENT & RESEARCH SUMMER PROJECT ON REAL ESTATE SECTOR RESEARCH BY ANIRUDHA DAMANI PGDM 2012 – 14 TRIMESTER IV SPECIALISATI ON: FINANCE ROLL NO : 96
| Date post: | 03-Jun-2018 |
| Category: |
Documents |
| Upload: | anirudha-damani |
| View: | 221 times |
| Download: | 0 times |

8/12/2019 Summer Project Report real estates
http://slidepdf.com/reader/full/summer-project-report-real-estates 1/21
WELINGKAR INSTITUTE OF MANAGEMENT DEVELOPMENT &
RESEARCH
SUMMER PROJECT
ON
REAL ESTATE SECTOR RESEARCH
BY
ANIRUDHA DAMANI
PGDM 2012 – 14 TRIMESTER IV
SPECIALISATION: FINANCE
ROLL NO : 96

8/12/2019 Summer Project Report real estates
http://slidepdf.com/reader/full/summer-project-report-real-estates 2/21
ACKNOWLEDGEMENT
It has been immense pleasure and truly enriching experience doing my Summer
Internship at the CONTENT BOX SOLUTIONS PVT LTD
I want to express my deepest sense of gratitude to Mr. Vishal Kapoor my
project guide without whose guidance and help it would not have been possible
for me to complete this project. I would also like to thank him for sparing his
valuable time for me and for his guidance and valuable insights during thecourse of the internship.
I would also like to thank to Mrs Smeeta Bhatkal for her assistance while
internship period. I owe a special thanks to all members of Content Box for
their support and guidance.
ANIRUDHA DAMANI
8/12/2019 Summer Project Report real estates
http://slidepdf.com/reader/full/summer-project-report-real-estates 3/21
SECTOR RESEARCH
ECONOMIC OVERVIEW
Despite adversities affecting the global economy, Indian Economy hasmanaged to sail through the rough water by registering the GDP growthrate of 6.5 percent in FY 2011-12 and the economy continue to aspire forthe double growth rate. The global economic concerns that prevailedduring the year were primarily the debt-repayment crisis in the euro zone,
particularly in Greece, slowdown in the US economy and the advent ofthe tsunami in Japan early in the year. All these factors led to uncertaintyand lowered business confidence. The Indian Gross Domestic Product(GDP) grew at 6.5 percent in FY 2011-12 from 8.4 percent in FY 2010-11.The Index of Industrial Production (IIP) dropped to a decade low to 3.9
percent (as on March 2012) due to the slump in investment. WholesalePrice Index (WPI) as a measure of inflation stood at 9.1 percent for mostof the fiscal year. The RBI had to resort to tight monetary policies andhiked the interest rate by 375bps during the period March 2010 to
November 2011 in order to curb inflation. Rising inflation coupled withincreasing interest rates resulted in rising input costs, affecting marginsand profitability in most industries across the board.
INDUSTRY OVERVIEW
One of the key parameters of global competitiveness of any economy liesin its standard of infrastructure and service delivery patterns. Accordingto the Global Competitiveness Report, 2011-12 issued by of the WorldEconomic Forum (WEF), India ranks 89th in terms of basic infrastructureout of a total of 142 countries. The report states that India has mediocre
accomplishments in the basic factors underpinning competitiveness as itssupply of transport, Information and Communication Technology (ICT),and energy infrastructure has stayed insufficient and ill-adapted to the
business needs.The Eleventh Five Year Plan emphasized the need for removinginfrastructure bottlenecks for sustained growth. Its,therefore, proposed aninvestment of US $500 billion in infrastructure sectors through a mix of
public and private sector funds to reduce deficits in identifiedinfrastructure sectors. Asa percentage of the Gross Domestic Product
(GDP), investment in infrastructure was expected to increase to around 9 percent.
8/12/2019 Summer Project Report real estates
http://slidepdf.com/reader/full/summer-project-report-real-estates 4/21
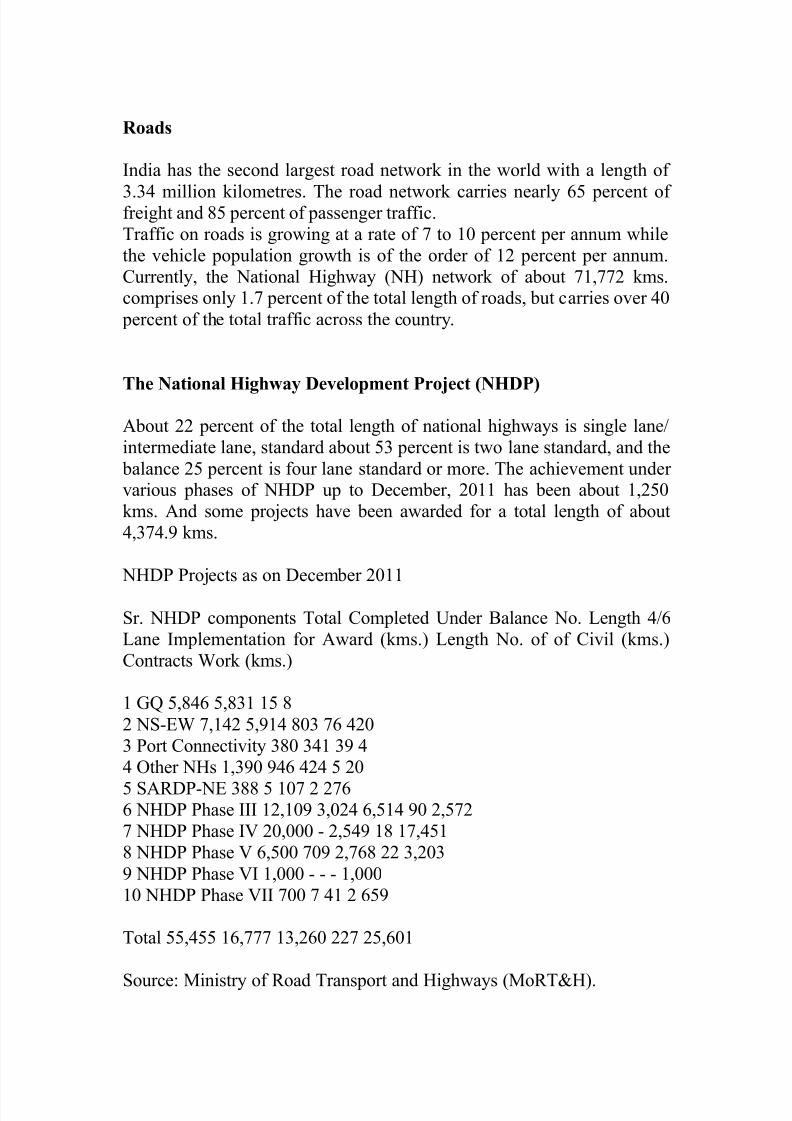
Roads
India has the second largest road network in the world with a length of
3.34 million kilometres. The road network carries nearly 65 percent offreight and 85 percent of passenger traffic.Traffic on roads is growing at a rate of 7 to 10 percent per annum whilethe vehicle population growth is of the order of 12 percent per annum.Currently, the National Highway (NH) network of about 71,772 kms.comprises only 1.7 percent of the total length of roads, but carries over 40
percent of the total traffic across the country.
The National Highway Development Project (NHDP)
About 22 percent of the total length of national highways is single lane/intermediate lane, standard about 53 percent is two lane standard, and the
balance 25 percent is four lane standard or more. The achievement undervarious phases of NHDP up to December, 2011 has been about 1,250kms. And some projects have been awarded for a total length of about4,374.9 kms.
NHDP Projects as on December 2011
Sr. NHDP components Total Completed Under Balance No. Length 4/6Lane Implementation for Award (kms.) Length No. of of Civil (kms.)Contracts Work (kms.)
1 GQ 5,846 5,831 15 82 NS-EW 7,142 5,914 803 76 4203 Port Connectivity 380 341 39 44 Other NHs 1,390 946 424 5 20
5 SARDP-NE 388 5 107 2 2766 NHDP Phase III 12,109 3,024 6,514 90 2,5727 NHDP Phase IV 20,000 - 2,549 18 17,4518 NHDP Phase V 6,500 709 2,768 22 3,2039 NHDP Phase VI 1,000 - - - 1,00010 NHDP Phase VII 700 7 41 2 659
Total 55,455 16,777 13,260 227 25,601
Source: Ministry of Road Transport and Highways (MoRT&H).

8/12/2019 Summer Project Report real estates
http://slidepdf.com/reader/full/summer-project-report-real-estates 5/21
The targets for the road transport sector during the Twelfth Five YearPlan are indeed massive. As against the estimated public and private-sector investment of about ` 1,52,201 cr. during the Eleventh Five Year
Plan, the total investment requirement during the Twelfth Five Year Plan by the Central Government in the road sector would be about ` 6,11,344cr. The share of the private sector is projected to be about 38 percent. Thesector is yet to achieve the target of 20 kms. roads a day due to a varietyof factors. Several initiatives have been taken for resolving these issuesand it is expected that during the Twelfth Five Year Plan roadconstruction work is excepted pick up. During the financial year 2012-13,about 6,088 kms. of the national highways are to be improved along withconstruction/rehabilitation of 130 bridges and 7 bypasses at an estimatedcost of ` 22,600 cr. Besides budgetary support, the Internal ExtraBudgetary Resources (IEBR) through external borrowings will also beutilized.
The Ministry of Road Transport and Highways has taken up the SpecialAccelerated Road Development Programme in the North Eastern Region(SARDP-NE) for widening of 10,141 kms. of national highways andother roads in three phases ensuring connectivity of 88 districtheadquarters in the north eastern region to the national highways. Anoutlay of ` 2000 cr. has been proposed for SARDP-NE for the year 2012-
13.
Power
Electricity generation by power utilities during 2011-12 was targeted toincrease by 5.4 percent to reach 855 billion units. Growth in power
generation during April-December 2011 was 9.2 percent as compared to4.6 percent during April-December 2010. Nuclear, hydro, and thermal
power generation registered a year-on-year growth of 33.2 percent, 19.2 percent and 6.7 percent respectively in 2011-12.

8/12/2019 Summer Project Report real estates
http://slidepdf.com/reader/full/summer-project-report-real-estates 6/21
POWER GENERATION STATISTICS OF INDIA
Power 2009-10, 2010-11 April – Growth
Hydroelectric # 106.7 114.3 90.2 107.5 19.2Thermal 640.9 665.1 484.9 517.1 6.7
Nuclear 18.6 26.3 17.9 23.8 33Bhutan Import 5.4 5.6 5.4 5.1 -5.6
Total 771.6 811.3 598.4 653.5 9.2Source: Ministry of Power
Note: # Excludes generation from hydro stations up to 25 Mega Watt(MW)
The deficit in power supply in terms of peak availability and totalavailability declined during the Eleventh Five Year Plan. While theenergy deficit decreased from 9.6 percent in the terminal year of theTenth Plan (2006-07) to 7.9 percent during April-December 2011, peakdeficit declined from 13.8 percent in 2006-07 to 10.6 percent during thecurrent financial year (up to December 2011).The Eleventh Five Year Plan initially envisaged a capacity addition of
78,700 MW, of which 19.9 percent was hydro power, 75.8 percentthermal power, and the rest nuclear power. At the time of the Mid TermAppraisal (MTA) of the Eleventh Five Year Plan, the target was revisedto 62,374 MW with thermal, hydro, and nuclear power segmentscontributing 50,757 MW, 8,237 MW and 3,380 MW respectively. Acapacity addition of 46,669.7 MW has been achieved until 15 January2012. Projects with a capacity of 7,645 MW are under construction forcommissioning during the remaining period. Capacity addition during theEleventh Plan is, therefore, expected to be about 50,000 to 52,000 MW.
In the thermal sector, capacity addition continued to keep its momentumthroughout the Plan period, except in the second year. During 2007- 08,the first year of the Eleventh Five Year Plan, 9,263 MW thermal capacitywas added. In 2008-9, as against a target of 7,530 MW, a capacity of only3,454 MW could be added. Capacity addition during 2009-10 and 2010 -11 was 9,585 MW and 12,160 MW respectively. In the year 2011-12,capacity addition of 17,601 MW has been planned and until 15 January2012, 12,207.7 MW has already been added. This is the highest capacity
addition ever achieved in a single year.
8/12/2019 Summer Project Report real estates
http://slidepdf.com/reader/full/summer-project-report-real-estates 7/21
Railways
Indian railways have played an invaluable role in integrating markets and
connecting communities across the length and breadth of the country. Itconstitutes the backbone of country’s infrastructure along with roadways.Indian railways constitute one of the largest railway system of the worldwith over 64,000 route kilometres and 1.55 million employees. However,capacity addition in the railways sector remains the key challenge duringthe coming years. The sector has huge opportunity to grow and the railshare in cargo and passenger services can increase significantly. Itscurrent share of freight traffic is only about 36 percent as compared toabout 50 percent in the US and China.
Due to capacity constraints, Indian Railways is unable to offer value-added services. There is need for a paradigm shift in building railinfrastructure and running rail services. The Vision 2020 document of theMinistry of Railways projects investment need of ` 7,20,000 cr. for thesector. During the Twelfth Five Year Plan the railways’ focus would be
on construction of six dedicated freight corridors, segregation of freightand passenger lines, providing improved connectivity to industry clustersand ports, etc. Indian Railways have been generating about 35 percent ofresources internally, about 38 percent is provided through budgetary
support and the balance of about 27 percent is raised through ExtraBudgetary Resources (EBR). Given the limitation of internal and
budgetary sources, bulk investment has to be done by the private sectorthrough public private partnership (PPP).Indian Railways has initiated PPP projects during the Eleventh Plan insome areas such as port connectivity projects, container operations,wagon investment schemes, and private freight terminals but the scope ofPPP needs to be widened further. In order to promote PPP in the railsector, there is a need to set up special units to handle and monitor PPP
projects and give special thrust on capacity building. The finances ofIndian Railways are expected to improve substantially with the recentincrease in the freight charges in the railway budget 2012. With hugeopportunities and improving outlook in the future, we expect a lot ofactivities in the railway segment.

8/12/2019 Summer Project Report real estates
http://slidepdf.com/reader/full/summer-project-report-real-estates 8/21
Real Estate
Economic growth of a country has a direct bearing on the real estatesector and especially on the office space segment. The level of economic
activity influences the amount of incremental office space demandedduring a year. Currently, the top seven cities of India viz. Mumbai,
National Capital Region, Bangalore, Pune, Chennai, Hyderabad andKolkata together occupy 389 million sq.ft. of grade A office space. Therecessionary condition in 2008 led to many projects getting delayed andthese projects eventually entered the market post 2009 when the domesticeconomy started showing signs of recovery. This resulted in huge amountof new office space supply entering the market during the previous twoyears resulting into over supply and higher vacancy levels. Sources fromthe Reserve Bank of India indicate that in the residential segment,housing loan growth slowed to 12.1% for the year ended March 2012from 16% in the previous year.Also, before real estate prices peaked in 2008, big lenders were managingto grow their home loan portfolio at an annual average of 25%. However,demand in metros has slowed down during the year 2011-12. This ismainly due to high interest rates, which have made buyers hesitant to buy
property.There are also very few new projects being announced as builders anddevelopers have been affected by high interest rates too. Demand has
slowed down and a number of transactions are falling. In the top 10 cities,sales volume has dropped 10 percent in the last one year. Mumbai is theworstaffected market with a 40 percent decline in transactions, but priceshave remained more or less stable across these regions. In spite of a dip indemand, developers are managing to hold on to prices, and areanticipating spurt in demand as the situation improves.
FUTURE OUTLOOK
The Planning Commission has projected an investment of over ` 45 lakhcr. (about US $1 trillion) during the Twelfth Five Year Plan (2012-17). Itis expected that at least 50 percent of this investment will come from the
private sector as against the 36 percent anticipated in the Eleventh Planand the public sector investment needs to increase to over ` 22.5 lakh cr.As against an expenditure of ` 13.1 lakh cr. during the Eleventh Plan. Ofthis, more than US $150 billion is earmarked for the development ofcountry’s road and highway infrastructure. Financing infrastructure will,therefore, be a big challenge in the coming years and will require some
innovative ideas and new models of financing.

8/12/2019 Summer Project Report real estates
http://slidepdf.com/reader/full/summer-project-report-real-estates 9/21
COMPANY OVERVIEW
Supreme Infrastructure India Ltd. (SIIL) has been in the business of
infrastructure for more than 25 years. SIIL started as aggregate supplierwith its own quarries and crusher plants and moved up the value chain ininfrastructure sector through forward integration and has built diversecapabilities across Engineering Procurement and Commissioning (EPC)segments such as roads, bridges, buildings, railways, sewages/irrigationand power. It has a strong integrated model ensuring better control over
project execution as well as better margins. The Company has a welldiversified order book across verticals and geographies resulting intolower risk. The Company has projects spread across verticals such as
roads, bridges, railways, power, real estate, irrigation and sewerageacross the country.

8/12/2019 Summer Project Report real estates
http://slidepdf.com/reader/full/summer-project-report-real-estates 10/21
The Company has further moved up the value chain and forayed intoBOT Projects through its subsidiary companies viz. SupremeInfrastructure BOT Private Limited and Supreme Infrastructure BOT
Holdings Private Limited. The Company has a current BOT portfolio of 9 projects out of which two are operational, namely – ‘Kopargaon-Ahmednagar Toll Plaza’ and ‘Patiala Nabha Malerkotla (PNM) TollPlaza’. The Equity funding for all projects has largely been tied up as 3iIndia Infrastructure Fund has invested ` 2 bn. for a minority stake in threeroad BOT projects. The Company has further de-riske its business modelas the EPC portion of the BOT projects would be executed by theCompany which would boost the order book of the Company and it willalso reduce the execution risk for Supreme BOT as the Company hasstrong execution capabilities in the roads and bridges segment.Due to resource integration business model, the Company has access tocaptive quarrying and crushing plants, ready mix concrete (RMC) plants,asphalt plants and wet mix plants. This not only insulates the Companyagainst any fluctuations in input prices, but also ensures a smooth anduninterrupted supply of raw materials, enabling the Company to executeall its projects within the stipulated time thereby ensuring higher margins.The aggregates, which constitute approximately 25- 35 percent of thematerial cost, are sourced internally leading to savings in costs and, thus,lending additional margin advantage of around 3 - 4 percent.
The Company’s current order book of ` 39,028 mn. ( including L1 orders)as on 31st March,2012 is spread across 6 verticals and 9 states withwestern India constituting 60.7 percent of the total order book. However,going forward, the Company plans to increase its geographic presence tonorthern and eastern part of the country. The Company has a growingorder book of ` 15,320 mn. from north and east that includes states suchas Jharkand, West Bengal, Assam and Orissa in East and Rajasthan, UP,Punjab and Haryana in the North.
Strengths & Opportunities
Quarrying Sites
The Company has access to three quarrying sites at Padgha inMaharashtra, Kotputli in Rajasthan and Pathankot in Punjab. All thequarrying sites are within 100-150 kms. radius from the project sites.These sites provide assured supply of aggregates which constitute around
25-30 percent of the raw material cost resulting into margin advantage forthe Company as compared to its peers. This will encourage the Company
8/12/2019 Summer Project Report real estates
http://slidepdf.com/reader/full/summer-project-report-real-estates 11/21
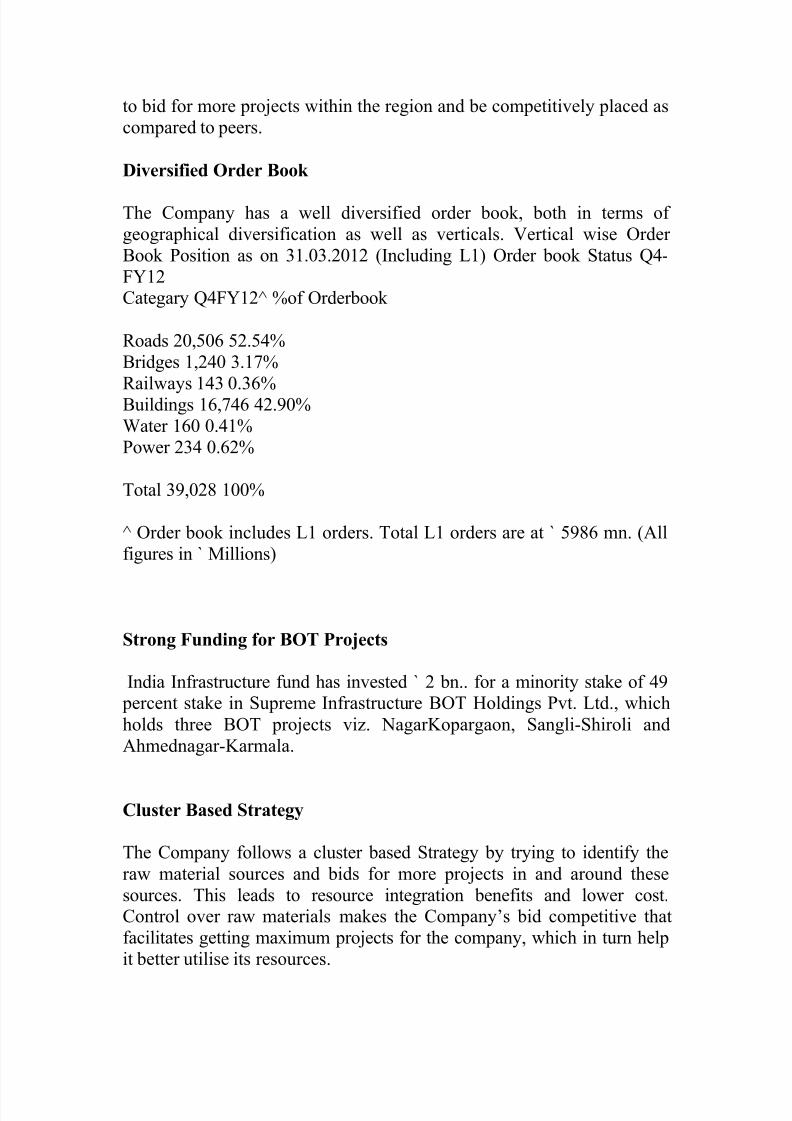
to bid for more projects within the region and be competitively placed ascompared to peers.
Diversified Order Book
The Company has a well diversified order book, both in terms ofgeographical diversification as well as verticals. Vertical wise OrderBook Position as on 31.03.2012 (Including L1) Order book Status Q4-FY12Categary Q4FY12^ %of Orderbook
Roads 20,506 52.54%Bridges 1,240 3.17%Railways 143 0.36%Buildings 16,746 42.90%Water 160 0.41%Power 234 0.62%
Total 39,028 100%
^ Order book includes L1 orders. Total L1 orders are at ` 5986 mn. (Allfigures in ` Millions)
Strong Funding for BOT Projects
India Infrastructure fund has invested ` 2 bn.. for a minority stake of 49 percent stake in Supreme Infrastructure BOT Holdings Pvt. Ltd., whichholds three BOT projects viz. NagarKopargaon, Sangli-Shiroli andAhmednagar-Karmala.
Cluster Based Strategy
The Company follows a cluster based Strategy by trying to identify theraw material sources and bids for more projects in and around thesesources. This leads to resource integration benefits and lower cost.Control over raw materials makes the Company’s bid competitive that
facilitates getting maximum projects for the company, which in turn helpit better utilise its resources.

8/12/2019 Summer Project Report real estates
http://slidepdf.com/reader/full/summer-project-report-real-estates 12/21
Owned Construction Equipment and Machinery
The Company has invested heavily into developing its own constructionequipment and machineries. Besides delivering higher margins, this also
ensures that the Company has a much better control over its projects andit does not have to depend on any third party for supplies of equipments.
Threats
a. High Interest Rates
The RBI hiked the interest rate by 375 bps during the period March 2010- November 2011 in order to curb inflation. Further increase in interestrates may adversely affect the margins and profitability of the Company.
b. Policies
Major portion of the order book consists of projects awarded by thegovernment agencies. Any change in the Government’s policy may
impact the Company’s future plans and performance.
c. Investment Slowdown and Rise in Competition
Due to the slowdown in Investment, the Index of Industrial Production(IIP) dropped to a decade low to 3.9 percent (as on March 2012). Also,there is increased competition within the infrastructure industry.However, the Company believes that it is fairly insulated against the riskdue to its strong order book position, backward integrated model and vastexperience in the industry.
d. Execution Risks in BOT Projects
The Company has multiple projects in the BOT space and does face a riskin execution. It currently has a portfolio of nine projects out of which twohave become operational. The Company has a record of abiding by thetimelines in its execution of projects.
8/12/2019 Summer Project Report real estates
http://slidepdf.com/reader/full/summer-project-report-real-estates 13/21
e. Traffic Risks in BOT Projects
In the event of a slowdown in traffic over the road on which theCompany is executing projects, there could be risk of lower toll
realisations. But this is highly unlikely, as the Company is executing projects for roads that are in high growth regions or have high existingtraffic.
f. External Macro Conditions
The Infrastructure industry, like any other industry is also exposed andvulnerable to the risk of any adverse change in macro economic situation.In case of prolonged recessionary conditions leading to a slowdown ofeconomic growth, the Company’s prospects may also be affected.
Risk Mitigation Strategy
The Company takes full cognizance of the fact that identification andevaluation of risks and their management is crucial for its performanceand delivering value to its stakeholders. The Company keeps assessing itsrisks at regular intervals and takes measures to mitigate the same.
8/12/2019 Summer Project Report real estates
http://slidepdf.com/reader/full/summer-project-report-real-estates 14/21
FINANCIAL AND OPERATIONAL OVERVIEW
The order book of the Company stood at ` 39,028 mn. as of 31st March2012 (including L1 orders) compared to ` 31,170 mn. as of 31st March
2011, recording a growth of 27.7 percent.
The income from operations stood at ` 15,059.1 mn. for the year ended31st March, 2012 as compared to ` 9,178.5 mn. In the previous year,recording an increase of 64.1 percent.
The Company achieved Earnings Before Interest, Tax, Depreciation andAmortization (EBITDA) of ` 2462.8 mn. For the year ended 31st March,2012 as compared to `1614.7 mn. in the previous year registering, anincrease of 52.52 percent.
The Profit after Tax (PAT) of the Company stood at ` 918.0 mn. for theyear ended 31st March, 2012 as compared to ` 759.5 mn. in the previousyear, registering an increase of 20.87 percent.
The Earnings per Share (EPS) of the Company have also increased by13.6 percent over the previous year from ` 48.26 to ` 54.81 for thefinancial year ended March, 31, 2012.
INTERNAL CONTROL
The Company has sufficient and commensurate internal control systemsto match the size and the sector that it is in. It has well-defined andclearly laid-out policies, processes and systems. These are strictly andregularly monitored by the top management and any digression ordiscrepancy is immediately flagged off and corrected. All requisiteregulations, rules and laws of the land are strictly followed. TheCompany has a sound system for financial reporting and well defined
management reporting systems. These are supported by ManagementInformation System (MIS) that regularly checks, monitors and controlsall operational expenditure against budgeted allocations. The Companyalso has a regular internal audit process that is monitored and reviewed
by the Audit Committee, which ensures that any deviations from set benchmarks are immediately reported and corrected. The Companyregularly keeps upgrading the systems and processes to ensure that theseare up to date and latest.

8/12/2019 Summer Project Report real estates
http://slidepdf.com/reader/full/summer-project-report-real-estates 15/21
HUMAN RESOURCES
The Company recognizes that its people are its most important resources.It workforce comprises highly skilled and qualified employees. As it
strives to provide the best working conditions, no compromise is madefor the health and safety of its people at its offices or its project sites. TheCompany’s work -culture is based on sincerity, hard-work and a penchantfor perfection and excellence. It encourages development of skills of its
people and regularly holds training sessions. It also has a system ofrecognising and rewarding exceptional performance with commensurateincentives.As on 31st March, 2012, the Company has over 1850employees.

8/12/2019 Summer Project Report real estates
http://slidepdf.com/reader/full/summer-project-report-real-estates 16/21
OBSERVATIONS
1. Residential Real Estate
Macro-economic factors dampened transactions in 2012 .The year2012 saw macro-economic factors weighing down the growth ofresidential capital values across the 10 major cities in India(namely Mumbai, NCR Bengaluru, Kolkata, Chenna,Hyderabad, Pune, Ahmedabad, Chandigarh and Kochi). Highinterest rates coupled with sticky inflation continued to exert pressureon demand as potential buyers chose to emain in a wait-and-watch mode. As a result, the number of transactions acrossthese cities either remained stable or declined from the 2011levels. Average capital values in the 10 cities grew at amarginal rate of 3-5 per cent in 2012 on a y-o-y basis. The growth,however, was seen primarily in the latter half of the year.
Mumbai and NCR to account for over half of the total estimated supply during 2013-2015 As far as residential supply in the 10 major cities is concerned,nearly 2.1 billion sq ft is planned of which CRISIL Research expectsnearly 67 per cent or around 1.4 billion sq ft. to come up by 2015.Mumbai and NCR alone are expected to account for nearly 55 per cent of
the estimated supply.
2. Commercial Office Space
Rentals in 90 per cent of the micro-markets across 10 major cities remain lower than their 2008 peaks During the economic slowdown of 2008-09, demand for commercialoffice space especially from the IT/ITeS and BFSI sectors
plummeted leading to a sharp correction in lease rentals.
Between the first half of 2008 and the second half of 2009,average lease rentals corrected by almost 25-30 per cent.The subsequent period has seen a rather sideward movement inaverage lease rentals in the 10 major cities barring a few micro-markets which have witnessed either an uptrend or a downtrend. Duringthis period, demand gained momentum briefly in the first half of2011, but the existing vacancy levels prevented any major appreciation inlease rentals. A lean demand scenario has also adversely impacted theexecution of many projects. Currently, lease rentals in almost 90 percent
of the micromarkets in the 10 major cities are nearly 25-30 percent below their peak levels seen in the first half of 2008

8/12/2019 Summer Project Report real estates
http://slidepdf.com/reader/full/summer-project-report-real-estates 17/21
Only 37 per cent of the total planned supply to materialise by 2015;oversupply to persist Of the total supply of 445 million sq ft
planned across 10 major cities (Mumbai, NCR, Bengaluru,Kolkata, Chennai, Hyderabad, Pune, Ahmedabad, Chandigarh and
Kochi), CRISIL Research expects around 167 million sq ft ofoffice space to come up during 2013- 2015. Of the likely supplyadditions, NCR, Bengaluru and Pune will together account for nearly 53
per cent. In relation to supply, demand is expected to be at about66 million sq ft during the 2013-2015 period.
3. Organised Retail
Vacancy levels continue to impact growth in rentals In the post2008-09 era, the organised retail real estate segment has struggled togain traction due to the prevailing oversupply. In the period since thefirst half of 2010, lease rentals have remained flat in most micromarkets across the 10 major cities in India due to high vacancy levels.Rentals have not breached the peak levels seen during the first halfof 2008 in any of the micro-markets across the 10 major cities.NCR to see maximum additions in mall space during 2013 to 2015 The total planned supply of retail space across the 10 major
cities is estimated at about 67 million sq ft, of which CRISILResearch expects abound 38 million sq ft to come up during the 2013-2015 period. In number terms, CRISIL Research expects about 80 mallsout of the total planned 141 malls to come up by 2015, of which 15malls are expected to come up in NCR.

8/12/2019 Summer Project Report real estates
http://slidepdf.com/reader/full/summer-project-report-real-estates 18/21
Findings & Learning
Wth the macro-economic environment keeping potential buyers in await-and-watch mode, the year 2012 saw the residential real estate
market in India struggle. Factors such as high interest rates and stickyinflation continued to impact buyer sentiments and led to a fall intransactions across the 10 major cities of India (Ahmedabad,Bengaluru, Chennai, Chandigarh, Hyderabad, Kochi, Kolkata,Mumbai, NCR and Pune). However, with a reduction in interestrates and an expected improvement in macro-economic conditions,CRISIL Research expects demand conditions to improve in2013 and 2014, enabling a 5-7 per cent y-o-y growth in average capitalvalues in 2013 and another 6-8 per cent in 2014.
The year 2011-12 was difficult for organised retailers. Revenuegrowth of most players dipped sharply on account of weakconsumer sentiments. Apparel prices also rose sharply with the increasein cotton prices and the levy of excise duty on branded apparel led to flat-to- negative volume growth for apparels. This added to the woes oforganised retailers (as apparel accounts for one-third of organised
retail). Growth slowed down in same store sales. Overall, growth inorganised retail was lower at 16 per cent in 2011-12 as compared with astrong 23 per cent growth in 2010-11. In 2012-13, we expectorganised retail growth to remain subdued at 8-10 % Lease rentals forretail real estate space, which remained flat in 2012, areexpected to go up in 2013 and 2014. Limited supply additions (ofmalls) coupled with an improvement in demand will enablethis increase.Uncertainty in the macro-economic environment will continue to
impact both business and leisure travel in the current year and thenext (2012-13 and 2013-14). Slowdown in travel in turn wouldaffect room demand growth for premium segment hotels. During2012-13 and 2013-14, room supply is expected to grow at 12 percentCAGR, while room demand is forecast to grow only at 6 percent CAGR. This demand-supply imbalance will lead to a fall in
both occupancy rates (ORs) and average room rates (ARRs). By2013-14, the fall in aggregate ORs is expected to be the steepest in thedecade at 58 per cent as 11,750 premium segment hotel
rooms get added to the existing inventory of 46,200 rooms

8/12/2019 Summer Project Report real estates
http://slidepdf.com/reader/full/summer-project-report-real-estates 19/21
across 12 key destinations of India (Agra, Ahmedabad, Bengaluru,Chennai, Goa, Hyderabad, Jaipur, Kolkata, Kerala, Mumbai, NCR andPune) These destinations together account for 80 percent of the
premium segment hotel revenues. Intense competition will cause ARRs
to decline at 5 percent CAGR to Rs 7,000 in 2013-14 from Rs 7,750in 2011-12. Consequently, the revenues per available room(RevPAR) will decline by about 10 per cent CAGR to rs 4,050 in 2013-14 over 2011-12

8/12/2019 Summer Project Report real estates
http://slidepdf.com/reader/full/summer-project-report-real-estates 20/21

8/12/2019 Summer Project Report real estates
http://slidepdf.com/reader/full/summer-project-report-real-estates 21/21


