94
CHAPTER - 1
| Date post: | 23-Dec-2015 |
| Category: |
Documents |
| Upload: | anshul5410 |
| View: | 84 times |
| Download: | 0 times |

CHAPTER - 1

- 2 -

- 3 -
OBJECTIVES OF THE STUDY
The study was conducted at S.S.SAIB CONSTRUCTION PRIVATE LIMITED, keeping
in mind the following objectives. It helps-
• To analyse the financial statement.
• To simplify the accounting data.
• To find out the weak spots of the business.
• To measure the trends of the business.
• To study about the financial soundness.
• To study liquidity position of the company by taking various measurements.
• To evaluate the financial performance of the company.
SCOPE OF THE STUDY
• The ability of the firm to meet current obligation.
• The extent to which firm has used its long term solvency by borrowing funds.
• The efficiency to which firm is utilizing its assets in generating sales revenue; and
• The overall operating efficiency and performance of the firm.

- 4 -
RESEARCH METHODOLOGY
Meaning of Research
Research is common parlance refers to search for knowledge. Once can also define
research as a scientific and systematic search for pertinent information on a specific topic.
Infact, research is an art of scientific investigation.
Types of Research
The basic types of research are as follows:
1. Descriptive Vs. Analytical: Descriptive research includes survey and fact finding
enquires of different kinds. In analytical research, on the other hand, the
researcher has to use facts or information already available, and analysis there to
make a critical evaluation of the material.
2. Applied Vs. Fundamental: Research can either be applied or action research or
fundamental to basic or pure Research. Applied research aims at finding a solution
for an immediate problem facing a society or an business organization where as
fundamental research mainly concerned with Generalizations and with the
formulation of the theory.
3. Quantitative Vs. Qualitative: Quantitative research is based on the measurement
of quantity or amount. It is applicable to phenomena that can be expressed in
terms of quantity. Qualitative research, on the other hand, is concerned with
qualitative phenomena, i.e. phenomena.
4. Conceptual Vs. Empirical: Conceptual research is that related to some ideas or
theory. It is generally used by philosophies and thinkers to develop new concept
or to reinterpret existing ones.
5. Some other types of researches: All other type of research are variation of one or
more of the above stated approaches, based on either the purpose of research or
the time required to accomplish research, on the environment in which research is
done or on the basis of some other similar factors.

- 5 -
RESEARCH DESIGN
Research design specifies the methods and procedures for conducting a particular
research study. A research design is the arrangement of conditions for collection and
analysis of the data in a manner that aims to combine relevance to the research purpose
with economy in procedure.
Research design is broadly classified into three types which are as follows:
• Exploratory Research Design
• Descriptive Research Design
• Causal Research Design
I have chosen the descriptive design.

- 6 -
DESCRIPTIVE RESEARCH DESIGN:
Descriptive research studies are those studies which are concerned with described the
characteristics of particular individual.
In descriptive as well as in diagnostic studies, the researcher must be able to define
clearly, what he wants to measure and must find adequate methods for measuring it along
with a clear cut definition of population he want to study. Since the aim is to obtain
complete and accurate information in the said studies, the procedure to be used must be
carefully planned. The research design must make enough provision against bias and
must maximize reliability, with due concern for the economical.
METHOD OF DATA COLLECTION
SOURCES OF DATA:- To fulfill the information need of the study. The data is collected from primary as well as
secondary sources.

- 7 -
SECONDARY DATA:- Secondary data means that are already available i.e. they refer the data which have
already been collected and analysed by someone else when the researcher utilizes
secondary data than he has to look into various sources from where he can obtain them, in
this case he is certainly not confronted with the problems that are usually associated with
the collection of original data. Secondary data may either be published data or
unpublished data. It was collected from internal sources.
During my study I used both the sources of data collection i.e. primary and secondary
source of data. As far as secondary data is concerned, it included company profile,
company records, vouchers and various publication, internet etc.
Besides secondary data collection, primary sources like interview and observations are
used for understanding the study.
I used the various types of secondary data in my study:
• Organisational file,
• Official records,
• Newspapers,
• Magazines,
• Management books,
• Preserved information in the company’s database,
• Website of the company.
ADVANTAGES:
• Helps in identifying the research problem.
• Helps in generation of new ideas which can be authenticated by primary research.
• Helps in gaining better insight into the project.
• Helps in understanding the concept better.
• Easy to collect.
• Less expensive as compare to primary data.
DISADVANTAGES:
• May not always answer the specific questions pertaining to your study.
• Lack of availability.
• Inaccurate, adulterated and outdated data.

- 8 -
LIMITATIONS OF THE STUDY
Though the present study aimed to achieve the above-mentioned objectives in full
earnest and accuracy, it was hampered due to certain limitations. Some of the limitations
of this study may be summarized as follows:-
• Getting accurate data from the company is very difficult.
• Since I did not have the privilege to work on a large scale, so many findings and
recommendation may not be as much in tune with their ground realities as may be
considered desirable.
• Last but not the least, the time constraint faced is the project might have affected
the comprehensiveness of its findings.

- 9 -
CHAPTER-2

- 10 -

- 11 -
Ratio Analysis
Ratio analysis is a powerful tool of financial analysis. A ratio is defined as “the indicated
quotient of two mathematical expressions” and “as the relations between two or more
things.”
In financial analysis, a ratio is used as a benchmark for evaluating the financial position
and performance. The absolute accounting figures reported in the financial statement do
not provide a meaningful understanding of the performance and financial position of a
firm. For example, Rs.5 crores net profit may look impressive, but firm’s performance
can be said to be good or bad only when the N.P. figure is related to firm’s investment.
Ratio helps to summarize large quantities of financial data and to make qualitative
judgment about the firm’s performance.
Standards of comparison
The ratio analysis involves comparison for a useful interpretation of the financial
statements. A single ratio in itself does not indicate favorable or unfavorable condition. It
should be compared with some standards. Standards of comparison may consist of:
• Past ratios, i.e., ratio calculated from past financial statements of the firm.
Competitive ratio, i.e., ratio of some selected firms, especially the most progressive
and successful competitor, at the same point of time;
• Industry ratios, i.e., ratio of industry which the firm belongs; and
• Projected ratios, i.e., ratios developed using the Projected, Performa, financial
statements of the same firm.

- 12 -
Time ratio analysis
The easiest way to evaluate the performance of the firm is to compare its present ratio
with the past ratios. When the financial ratios over a period of time are compared, it is
known as time series analysis. It gives an indication of the direction of change and
reflects of whether firm’s financial performance has improved deteriorated or remain
constant over time.
Cross sectional analysis
Another way of comparison is to compare ratio of the firm with some selected firms in
the same industry at the same point in time. The kind of comparison is known as the cross
sectional analysis. The kind of comparison indicates the relative financial position and
performance of the firm. A firm can easily report to such a comparison, as it is not
difficult to get the published financial statements of the similar firms.
Industry analysis
To determine financial condition and performance of a firm, its ratio may be compared
with average ratio of the industry of which firm is a member. The sort of analysis is
known as industrial analysis, help member to ascertain the financial standing and
capabilities of the firm vis-a-vis other firms in the industry. Industry ratios are important
standard in the view of the fact that each industry has its characteristics, which influence
the financial and operating relationships.
Practical difficulties:-
1. It is difficult to get average ratio for the industry.
2. Even if industry ratios are available they are average ratios of string and weak
firms. Some time difference is so wide that average is of small utility.
3. Averages may be meaning less and comparison will be futile if firm within the
same industry widely differ in their accounting policies and practices.

- 13 -
According to R.N. Anthony:
“A ratio is simply one number expressed in terms of another. It is found by dividing one
number into the other.”
Thus, we can say that the relationship between two figures expressed in arithmetical
terms is called a ‘ratio’.
Objectives of ratio analysis:
• To help in analysis of financial statement.
• To help in simplification of accounting data.
• To help in comparative studies.
• To help in locating weak spots of the business.
• To help in forecasting.
• To estimate about trends in business.
• To have effective control.
• To study about the financial soundness.
• To help in fixation of ideal standards.
Scope of ratio analysis:
The financial analyst use ratio to determine those financial characteristics of the firm in
which they are interested.
With the help of ratios, one can determine:
• The ability of the firm to meet current obligations;
• The extent to which firm has used its long term solvency by borrowing funds;
• The efficiency to which firm is utilizing its assets in generating sale revenue; and
• The overall operating efficiency and performance of the firm.

- 14 -
Performance analysis:
In fact, it has to be realised that the short and long term financial position and the
profitability of the firm are tested in every kind of financial analysis, but the emphasis
would differ. Some ratios are more important in one kind of analysis than other. If a short
term creditor analysis only the current position and find it satisfactory, he cannot be
certain about the safety of his claim if the firm’s long term financial position or
profitability is unfavorable. The satisfactory current position would become adverse in
future if the current resources are consumed by the long term financial condition.
Similarly, the ‘good’ long-term financial position is no guarantee for the long term
creditor’s claims if the current position or the profitability of the firm is ‘bad’.
Credit analysis:
In credit analysis, the analyst will usually select a few important ratios. He may use the
current ratio or quick-asset ratio to judge the liquidity or debt-paying ability; debt-equity
ratio to determine the stake of the owners in the business and the firm’s capacity to
survive in the long run and any one of the profitability. For example, return on capital
employeed to determine the firms earning prospects.
Security analysis:
The major focus of security analysis is on the long term profitability. Profitability is
dependent on number of factors. One would certainly be concerned with the efficiency
with which the firm utilizes its assets and the financial risk to which the firm is exposed.
So along with the profitability ratio one would also analyze the activity ratio and leverage
ratio.
Competitive analysis:
The ratio of the firm does not revel by themselves do not reveal anything. For meaningful
interpretation, the ratio of firm should be compared with the ratio of similar firms and
industry. The comparison will reveal whether the firm is significantly out of line with its
competitors.
Trend analysis:
The ratio analysis will reveal the financial condition of the firm more reliably when trend
ratio over time are analysed. The trend analysis of the ratio adds considerable significance
to the financial analysis because it studies ratio of several years and isolates the
exceptional instances occurring in one or two periods. Although the trend analysis of

- 15 -
company’s ratio is itself informative, but it is more informative to compare the trend in
company’s ratio with the trend in industries ratio.
Caution in using ratio analysis
The ratio analysis is widely used techniques to evaluate financial position and
performance of a business. But there are certain problems in using these ratios.
The following are certain limitations of using these ratios:
• It is difficult to decide proper basis of comparison.
• The comparison is rendered difficult because of difference in situation of two
companies.
• The price level changes make the interpretation of the ratios invalid.
• The difference in the definition of items in the balance sheet and the profit and
loss statement make the interpretation ratios more difficult.
• The ratios calculated at a point of time are less informative and defective as they
suffer short term changes.
• The ratios are generally calculated from past financial statement and, thus are no
indicators of future.
Standards of comparison:
Ratios of a company have meaning only when they compared with some standards. It is
difficult to find out a proper basis of comparison. Usually it is recommend that ratios will
be prepared with industry averages. But industry averages are not easily available.
Compare differences:
Situations of two companies are never same. Similarly, the factors influencing the
performance of a company in one year may change in another. Thus, the comparison of
ratios of the companies becomes difficult and meaningless when they are operating in
different situations.

- 16 -
Price level changes:
The accounting figures, presented in financial statements, are expressed in momentary
unit which is used to remain constant. The prices change over years, which effects
accounting earnings. At least three effects of inflation can be identified; first, nominal
value of inventory increase second, asset is stated at original cost (less depreciation) in
the balance sheet. Because of inflation, their current value or replacement cost will be
much higher than book value, third, inflation affects accounting profits of the firms,
which borrow. If the interest rates is fixed, shareholders gains at the cost of lenders.
Different definitions of variables:
In practice, differences exist as to the meaning of certain terms. Diversity of views exists
as to what would be included in the net worth or shareholders equity, current assets or
liability.
Historical data:
The basis to calculate ratios are historical financial statements. The financial analyst is
more interested in what happens in future, while the ratios indicate in the past.
Management of the company has information about the company’s future plan and
policies and be able to predict future happenings to a certain extend. But the outside
analyst has to rely on the past ratios, which may not necessarily reflect the firm’s
financial positions and performance in the future.
Types of ratios Usually ratios are calculated from the accounting data, can be grouped into various
classes, according to financial activity or functions to be evaluated.
Parties interested in the financial analysis are
• Short term creditors
• Long term creditors
• Owners
• Management

- 17 -
• Short term creditors mainly interested in the liquidity and short term
solvency of the firm.
• Long term creditors more interested in the solvency and profitability of the
firm.
• Owners concentrate on the firm’s profitability and financial condition.
• Management is interested in evaluating every aspect of the firm’s
performance. They have to protect the interest of all particles and see that
firms grow profitability.
Liquidity ratios
“Liquidity” refers to the ability of the firm to meet its current obligations. It is also called
as ‘short term solvency ratios’. These ratios are used to assess the short-term financial
position of the concern. They indicate the firm’s ability to meet its current obligation out
of the current resources.
According to Saloman J.Flink
“Liquidity is the ability of the firm to meet its current obligations as they fall due.”
According to Herbert B.Mayo
“Liquidity is the ease with which assets may be converted into cash without loss”.
Liquidity Ratios are:
1. Current Ratio.
2. Quick Ratio.
3. Cash Ratio.

- 18 -
Leverage ratios
Long term creditor like the debentures holders financial institutions etc are interested in
the firm’s long-term financial strength. These ratios are calculated to assess the ability of
the firm to meet its long-term liability as and when they become due.
To judge the financial position of the, financial leverage, or capital structure ratio are
calculated. These ratios indicate mix of funds provided by owners and lenders.
Leverage ratios are as:
1. Debt-equity ratio.
2. Debt to total funds ratio.
3. Proprietary ratio.
4. Interest coverage ratio.
Activity ratios
Activity ratios are employed to evaluate the efficiency with which the firm manages and
utilizes the assets. These are also called the turnover ratios, because they indicate the
speed with which assets are being inverted or turned over into sales. Higher turnover
ratios indicate the better utilization of capital or resources and in turn lead to higher
profitability.
Several activity ratios are calculated to judge the effectiveness of assets utilization.
These are:-
1. Inventory Turnover Ratio.
2. Debtors Turnover Ratio.
3. Fixed assets Turnover Ratio.
4. Average collection Period.

- 19 -
Profitability Ratios
A company should earn profits to survive and grow over a long period of time. Profit is
the measurement of the efficiency of the business.
Generally there are two types of profitability ratios calculated:
• Profitability in relation to sales.
• Profitability in relation to investment.
Profitability ratio includes the following:-
1. Gross Profit Ratio.
2. Net Profit Ratio.
3. Operating Profit Ratio.
4. Return on Investment.
5. Return on Equity.
Financial Statement
Financial statement means a statement or document which explains necessary financial
information’s about an institution. Financial statements are prepared rationally and on the
basis of accounting principles. Their main objective is to provide information about the
financial aspects of business. Financial statements express the financial position of a
business at the end of accounting period and the results of its operations performed during
the year.
At any movement in time, a business firm can be viewed as a pool of funds. These funds
are from various sources i.e. equity shares, preference shares, debentures, financial
institutions and past earning retained in the business. Funds raised from the sources are
committed to a number of uses i.e. fixed assets used in production of goods and services,
inventories used to facilitate production and sales, accounts receivable owned by
customers and cash and marketable securities used for transaction and liquidity purposes.
- 20 -
According to John N.Myer
“The term financial statement, as used in modern business, refers to two statements which
the accountant prepares at the end of a period of time for a business enterprise. They are
the balance sheet or a statement of financial position and the income statement, or profit
and loss statement.”
Financial statement includes:
Income statement
Balance sheet
Statement of Retained Earnings
Statement of Changes in Financial position
Analysis of Financial Statements
Financial statements are prepared for the achievement of specific objective. These
objectives include the knowledge about financial position of business, results of business
operations, liquid position, earning capacity of business, future plan for increase in
income etc. without analysis statements, the objectives cannot be fulfilled.
According to John Myer
“Financial statement analysis it’s largely a study of relationships among the various
financial factors in a business, as disclosed by a single set of statements, and a study of
the trends of these factors as shown by a series of statement”.
Process of Financial Analysis
Determining objectives of analysis
Rearrangement of facts
Approximation of figures
Comparison
Study of Trends
To Draw Conclusions
Reporting

- 21 -
Forecasting of financial analysis
Comparative financial statements
Common size statements
Trend analysis
Ratio analysis
Fund flow statements
Cash flow statements
Comparative financial statements
Under this method the items of financial statements relating to two or more periods are
kept side by side so that they can be compared. By preparing comparative financial
statement the nature and quantum of change in different items can be calculated and it also
helps in the future estimates. By comparing with the data of the previous years it can be
ascertained what type of changes in the different items of current year have taken place and
the future trend of business can be estimated.
Common size statement
One of the major drawbacks of comparative financial statements is that these statements do
not present the change in relationship of various items to Total Assets. Comparative
statements are not useful to compare two or more business because there is no common
base for comparison. Common size financial statements are such statements in which items
of the financial statements are converted in percentage on the basis of a common base. In
common size income statements net sales may be considered as 100%. Other items can be
converted as its proportion.
Trend analysis
Trend analysis helps in future forecasts of various items on the basis of the data of previous
years. Under this method one year is taken as base year and on its basis the ratios in
percentages for other years are calculated. From the study of these ratios the changes in
that item are estimated and trend is estimated. To find out trend ratios, each item of base
year is taken as 100 and percentage of item of other years can be calculated accordingly.

- 22 -

- 23 -
CHAPTER-3

- 24 -

- 25 -
S.S. SAIB CONSTRUCTION PRIVATE LIMITED
We take the opportunity to introduce our self as most respected Construction firm. We
engaged in the business of providing the ‘TOTAL SATISFACTION’ in construction/
Project work.
We provide the services for:
1) Civil Works
2) Steel works (include sheds, space frames etc)
3) Jib Cranes
4) Interior designing
5) Trolleys( any type)
6) Structure for Over head crane/ EOT cranes
7) Roller conveyers
8) Manufacturer of gutters
9) Supply parts to ACE CRANES and ECEL. (Crane Parts)
10) Specialized in SS (Stainless Steel) Fabrication Equipments
11) Porta Cabins
12) Equipments for Chemical Plants.
We are the business from last 15 years. All activity is being undertaken at our plant
located in Faridabad. This plant has the latest machinery like sheet shearing machines,
sheet bending machines, lathe machines, Arc, Tig, Mig welding machines, all kind
drilling and cutting machines, over head crane (3 ton).
We have an list of Reputed Customer’s from whom we get the repeat orders like JCB
India ltd, Yamaha motors India Pvt. Ltd, Escorts Construction and Equipment Limited,
New Holland Tractor India (P) limited, Dharampal Prem Chand Limited (Agartala).
We have a strong team of professionals and technical experts having rich experience in
their respective field in India and abroad. All activities for sophisticated and typical jobs
are being taken under the direct supervision of highly qualified and well experienced
expert hands in our factory situated in the industrial hub at Faridabad.

- 26 -
History
Managing Director - Shane Summers celebrates 33 years in the building and construction
business.
Shane Summers joined the workforce with a privately owned building company on the
Gold Coast as an apprentice carpenter and joiner in 1977. Shane worked on commercial
and industrial sites for many years and studied building at the Gold Coast Institute of
Technical and Further Education.
From 1993 – 2000, SS Constructions oversaw the construction of luxury homes at
Sanctuary Cove, Sovereign Island and the Gold Coast. From the year 2000, the company
branched out and began building commercial and industrial buildings throughout south
east Queensland.
Shane’s clients benefit from his proactive engagement with the building industry and the
community by having superior access to industry issues and information.
• Chairman (Gold Coast) Queensland Master Builders Association (QMBA) - 2005 -
2008
• Current Councilor (Gold Coast Representative) for Queensland Master Builders
Association (QMBA) - 2004 - 2009
Shane has a passion for the trade and supports the training and development of the next
generation of skillful tradesmen and quality builders.
• Chairman (Gold Coast) - Construction Training Queensland (CTQ) - 2003 - 2004
• Development of Apprenticeships Expo - to promote apprenticeships and training 2004
• Master Builders panel representative for the development and selection of the technical
courses for builders and builders licensing at Construction Training Australia- 2002
• New member of the Australian Industry Trade College- 2009

- 27 -
Plan Features:
• May be used for 1 Website
• Reports that help you track changes in your search engine ranking.
• Keyword Generator lists the top search terms for any topic in 40 languages.
• Sitemap Creator for easy search engine inclusion
• Standard SEO Plan included FREE
• Local or national advertising options
• You set the ad budget, our pros do the rest
• 1 custom business Web page
• 3 business categories
• 1 ad per business category
• Real-time tracking and reporting
Home
SS Constructions specialize in the building and construction of luxury homes, commercial
and industrial buildings in South East QLD. SS Constructions is an award winning,
privately owned Australian company based on the Gold Coast.
Formed in 1993 by Shane Summers, SSC provides building and construction services for
commercial, industrial and residential projects in South East Queensland and the Northern
Rivers area of New South Wales.
From project planning, scheduling, legal certification, material selection and support after
completion SS Constructions offers a complete building solution. You can take comfort
in SS Construction’s wealth of experience, underpinning knowledge to perform work
professionally and to your satisfaction.
The company employs exceptional staff with diverse backgrounds and experience, not
only in construction but also in the support services.

- 28 -
All Plans Include:
• Complete Search Engine Optimization (SEO) for one website
• One-click submission to Google, Yahoo!, Bing, Ask, and AOL
• Easy submission to over 100 search engines and directories
• Google Keyword Generator
• Suggested Topics Tool
• Top 10 Search Engine Optimization Checklist
• Keyword usage, Robots.txt file and Robots Meta tag analyzer
• Powerful reports that show you how to move your website up in search results
Support
Receive support and exchange ideas. Join the Search Engine Visibility Group on Go
Daddy Support to:
• Get direct access to info and news that interests you
• Interact with other members
• Gain access to new features
• Check out beta releases
• Find discount codes
• Participate in polls and much more

- 29 -
Name of satisfied organization
• M/S JCB India Limited. (Ballabgarh)
• M/S Escorts Limited. (Faridabad)
(a). Plant –1 (Engineering Division)
(b). Plant-3 (Construction Equipment Division).
(c). Agri. Machinery Group.
(d). Ford Limited.
• Claas Limited. (Faridabad)
• Yamaha. Motors India Pvt. Limited (Greater Noida & Faridabad)
• Glaxo Smith Cline Beechem consumer Health care.(Maan feed Ltd)
• Consolidated Coin Company. (Division of Nepcon turbo charger Ltd)
• Fibertex Pvt. Limited.(Faridabad)
• Asia brown Bovary Limited. (ABB) (Faridabad)
• Mahindra & Mahindra Ltd. (M&M) (Hyderabad and Haridwar)
• Knorr Bermse India. (Faridabad)
• Defence Land System India. (DLSI) (A unit of Mahindra at Haryana)
• Federal Mogul Goetze India Ltd. (Patiala and Bangalore)
• Jackson Developer Pvt. Ltd.(Owner of v3s mall, Crowne plaza)
• Suzuki Motorcycle Pvt. Ltd. (Gurgoan)

- 30 -
Name of satisfied organization
• �Kunj Bihari Processors Pvt. Limited. (Faridabad)
• Orbit resorts Limited. (Gurgoan)
• J.B.M Limited. (Gurgoan)
• Parson nutritional limited. (Horlicks). (Sahibabad (U.P)
• Khemka Container Pvt. Limited. (Noida. U.P)
• International print-o-pack. (Noida. U.P)
• Embassy of Israel. (New Delhi)
• Enpro India limited (Noida)
• C.T.C Limited (Auditorium) (New Delhi)
• TruTrac Limited. (Gurgoan)
• Oswal Electrical Limited. (Faridabad)
• JBES Limited. (Gurgoan)
• Food and Health Care (Himachal)
• Hotel Oberoi (EIH) (New Delhi)
• Tecumseh India Limited. (Faridabad)
• V3S mall. (Laxmi Nagar New Delhi)
• Radisson Hotel. (Pashim Vihar, New Delhi)

- 31 -
Awards
SS Saib Constructions has been recognized by the building and construction industry for
its success in building and residential construction. SS Saib Constructions has received
the following building awards:
• 2009 Tourism & Hospitality Facilities up to $8 Million
• 2004 Best use of site
• 2004 Housing on sloping sites
• 1998 Best use of site
• 1997 Best Contract House over $1,000,000
• 1997 Innovated use of timber
• 1997 Best use of site
• 1997 Innovative use of Technology
• 1997 Energy Efficiency in Housing
• 1997 Gold Coast House of the Year
• 1996 Queensland’s best house over $1,000,000
• 1995 Workmanship Award
• 1995 Best Home Renovation
• 1994 Best Interior Construction
• 1994 Best Use of Site
• 1994 Gold Coast Best House
• 1994 Workmanship award
• 1994 Gold Coast House of the Year

- 32 -
Testimonials
“I needed someone to build a prestige home on our prime waterfront property at
Sanctuary Cove on the Gold Coast. SS Constructions did more than just build the home.
They managed the project so I could concentrate on my business. SS Constructions
managed and co-ordinated the whole process with such competence that I didn’t have to
worry about if the job was being done properly. The finish of the home is of very high
standard. We have been in the home for several years now and the house is good as the
day it was built, which is testimony in itself to the skill and experience available from the
builder.”
Greg Matthews
“SS Constructions built a commercial factory for us at Logan home. We are based in New
Zealand and as such required more of a project manager than a standard construction
company. SS Constructions, and more specifically Shane Summers co-ordinated the
building from concept design, consent and construction. We would not hesitate to use SS
Constructions again, with them having successfully completed our building project and
would highly recommend them.”
Brian Blanchard
"Since 1994, SSC has completed a number of projects for me to my complete
satisfaction. Shane has a highly developed ability to understand his clients’ needs and to
work effectively with or without an architect’s involvement, to produce high quality
outcomes in sometimes difficult and demanding situations. I have no hesitation and much
pleasure in giving this endorsement to a builder who in my opinion produces work of the
highest possible quality."

- 33 -
Services in
Residential Building
SS Constructions has provided a premium building service to the luxury housing market
since 1993. Building luxury homes on the Gold Coast, SS Constructions places a high
priority on attention to design, detail and finish that has resulted in building awards for
design and workmanship.
Not just builders- SS Constructions provide a complete management service that includes
employing and coordinating suitable local design consultants for custom projects,
preliminary budgeting and cost management, obtaining approvals, compliance and
certification.
From past experience some of our clients may only see the project on a few occasions
during the building process. We understand that our clients are too busy with their core
businesses and lifestyles to attend to all of the organizing, so we work with our clients,
and fill the gaps to overcome the obstacles professionally.
SS Construction thrives on challenges and gets excited about difficult projects where
other builders waiver. Our approach to our work is to overcome problems based on
experience and underpinning technical knowledge and management skill.

- 34 -
Commercial Building
SS Constructions managing director Shane Summers spent 15 years managing
commercial construction projects before he built his first house. Whilst working for large
building companies when he was a younger man he developed his own successful
systems of construction, site management and cost control that always provided good
results for the clients both in quality and price.
Good projects just don’t happen. The right people need to be sourced and the right
conditions need to be established to achieve the best results. SS Constructions likes to
engage early on the project and either project manage the design team on behalf of the
client [the owner’s agent] from the outset or alternatively become part of the team
managed by the owners separate agent.
The client definitely benefits as we are not just builders and have a lot to offer in
experience.
SS Constructions is an established reliable business and has superior access to the best
personal, trade contractors and tradesmen living in and around the district. We are not
interested in just doing a job; we take pride in our work and do the best job we can.
SS Construction provided a total management service to the owner of the facility. We
employed and coordinated the design consultants, authority negotiations, approvals and
certification, construction works and hand over. A special feature to the project was to pre
manufacture the 1000m2 feature timber building off site at our factory at Coomera in
order to compensate for delays caused by council town planning negotiations. The
initiative resulted in the facility being operational for the Christmas trade which provided
the owner the opportunity to recover some of the building cost immediately.

- 35 -
Industrial Building
SS Constructions are a manufacturing company in the building industry. We are very
interested in manufacturing processes for other industries. It is so important to employ
someone interested and understands the importance of time and motion, manufacturing
processes and equipment installations. This is very exciting providing technical assistance
and expertise to another manufacturer.
Building the Tuscany Stone Facility
We achieved good results for the directors of the Tuscany Stone Co project in Ashmore
on the Gold Coast where they manufacture marble and granite products for the building
industry. The facility includes warehousing stock and handling equipment, wet sawing,
moulding and polishing equipment, office and administration facilities and worker
facilities. SS Construction project managed the design, construction and certification of
the project.

- 36 -
Sustainable Building
New challenges are presenting themselves right now for the collection of water and
recycling water for manufacturing, conservation of energy for the operation of the
buildings and thermal control, and the operation of equipment, using sustainable methods
and materials and providing a good and safe environment for workers.
SS Constructions are interested and active in using sustainable and suitable products and
materials and investigating the integration of the products into the project.
This year we have performed extensive investigated into structures made from plantation
forest pine being a 100% renewable material for commercial and industrial use. We have
engaged with Hyne Timbers, being the largest and most experienced manufacturer of
timber products in Australia. Our research indicates that we overlooking the advantages
that timber can offer over steel framed buildings under the right circumstances.
This year we also engaged with Ritek Building Solutions with their insulative roof and
wall systems and cladding materials where we can vastly improve the energy efficiency
or energy control for heating and cooling buildings.
SS Constructions are interested in researching products that are an advantage to our
clients.
- 37 -
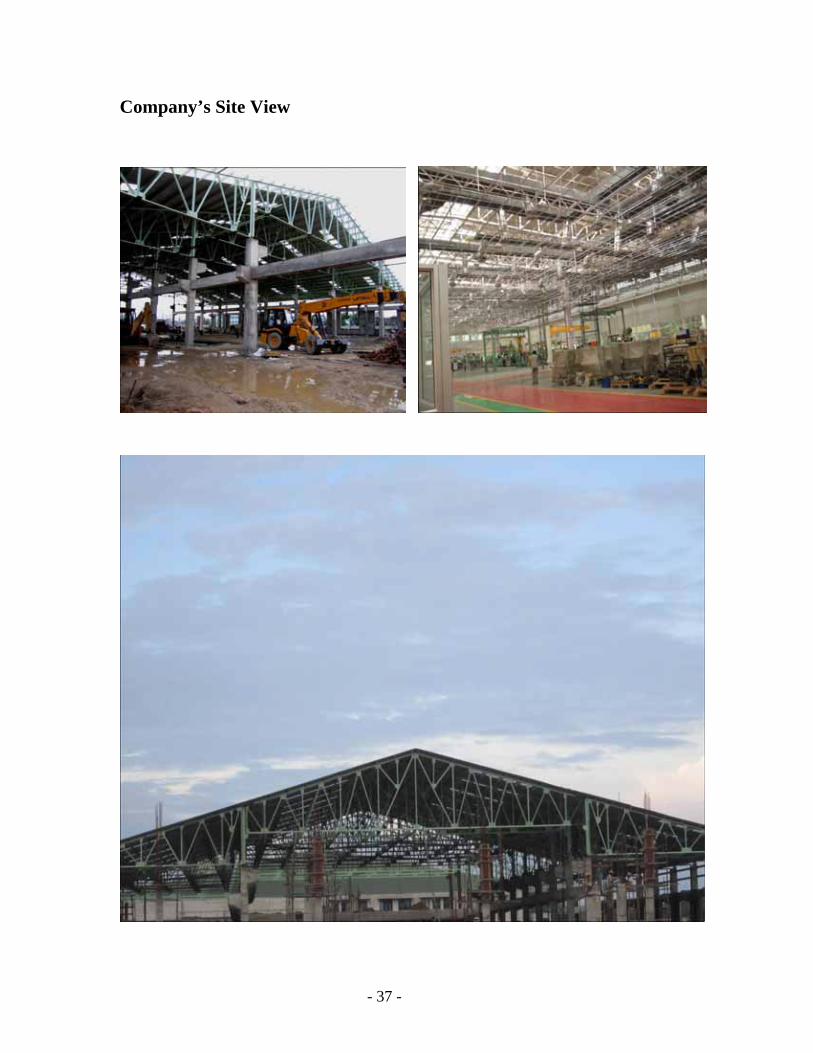
Company’s Site View

- 38 -
Site View of JCB India Ltd.
Roofing work including toughened glass and
Aluminium composite panel Glazing, painting
work and Landscaping work.
(Pre coated 0.50 mm thick sheet used Area
covered 5000 Sq.mt Aprox.)
(Project completed- 25 Days)
Structure Steel work for EOT crane for 10
TON Capacity.
(Total Qty of Steel 150 Ton)
(Project Completed - 1 month)

- 39 -
Jib cranes.
Up to 1 – 4 Ton Capacities.
(Take 10 – 15 days to supply the Jib crane after getting a Confirm order)
Project Name – Engine Assembly for JCB machines (Air Conditioned Building)
Project Features
Total Qty of steel – 180 Ton
Mezzanine floor - 750 Sq.mt ( made of deck sheet and steel columns)
Precoated Sheets – 2500 sq. Mt for Partition
- 40 -
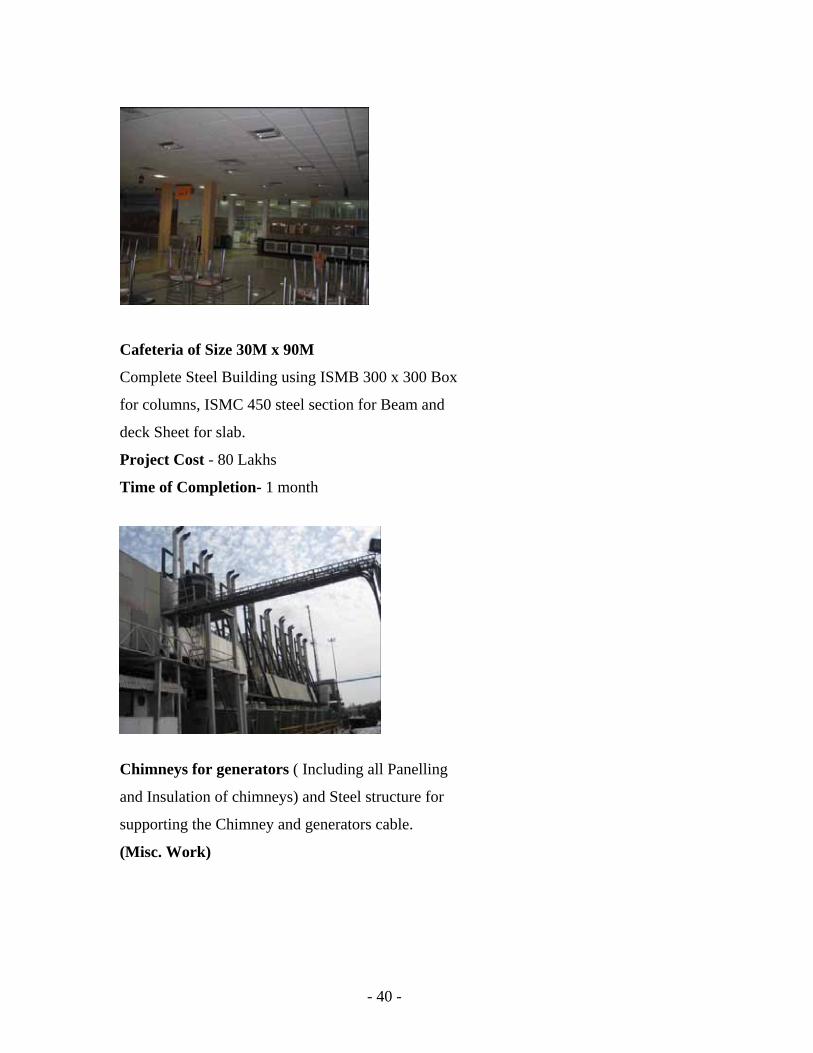
Cafeteria of Size 30M x 90M
Complete Steel Building using ISMB 300 x 300 Box
for columns, ISMC 450 steel section for Beam and
deck Sheet for slab.
Project Cost - 80 Lakhs
Time of Completion- 1 month
Chimneys for generators ( Including all Panelling
and Insulation of chimneys) and Steel structure for
supporting the Chimney and generators cable.
(Misc. Work)

- 41 -
Site View of Defence Land System India (A Unit of M & M Ltd)
Construction of mezzanine floor along with
juckting of R.C.C Columns over the basement
Area at 6mtr Height.
Side view of the going construction of new building Showing R.C.C Mezzanine floor, trusses,
R.C.C Beams, brick work etc.

- 42 -
Site View of Dharampal Premchand Ltd Agartala, Gawhati
80% of Steel was fabricated from our
Factory and rest 20% being fabricated
at site.
Fabricated 300 tons/ month.
Constructed 8 gantry For EOT Crane of
45 mtr in Length (Span) and weight of
each gantry is 35 tons and all four
gantries was fabricated at our factory.

- 43 -
View of Some Interior Design Works at different
Sites.
Site view Oberoi Hotel at Lodhi Road, New Delhi
Constructed a STEEL & GLASS STAIRCASE.
Width of the Staircase is 2.50 mtr, and
No support below the glass steps,
Thickness of each Toughened glass steps is 2 x 20 = 40 mm
Stainless Steel Cladding Done over the Steel Section.
Railing – 20 mm Toughened glass & top Rail of SS Steel pipe.

- 44 -

- 45 -
CHAPTER-4

- 46 -
Liquidity Ratios
Current Ratio Trends
This ratio explains the relationship between current assets and current liabilities of a
business. The formula of calculating the ratio is:-
Current Assets
Current ratio = _________________
Current liabilities
Current Assets include those assets which can be converted into cash within a year’s
time.
Current Assets = Cash in hand + Cash at Bank + Short term investments + Debtors +
Stock + Prepaid expenses + Bank Receivable.
Current Liabilities include those liabilities which are repayable in a year’s time.
Current Liabilities = Bank overdraft + Bank Payable + Creditors + Provision for
taxation + Proposed dividend + Loans Payable within a year.
This ratio indicates the availability of Current Assets in rupees for every one rupee of
current liability.
YEAR C.A. / C.L. CURRENT RATIO
2009-2010 (in crores) 110/31.74 3.47:1
2010-2011 (in crores) 135.56/29.31 4.79:1
Table 4.1 : Current Ratio

- 47 -
Fig. 4.1 : Current Ratio
Significance:
As a conventional rule, a ratio of 2:1 or more is considered satisfactory. It means that
current assets should, at least, be twice of its current liabilities. The higher ratio, the better
it is, because the firm will be able to pay its current liabilities more easily.
Comments:
Although the high ratio says that we can easily meet up over current liabilities but too high
ratio is also not beneficial for the company as it shows that because of poor investment
policies of the management and poor control of inventory assets are lying idle and they
should be further invested.
0
1
2
3
4
5
6
110/31.74 135.56/29.31
2009-2010 (in crores) 2010-2011 (in crores)
Year
Cur
rent
Rat
io
CURRENT RATIO

- 48 -
Quick ratio Trends
Quick ratio indicates whether the firm is in a position to pay its current liabilities within a
month or immediately.
Liquid assets
Quick Ratio = _____________________
Current liabilities
Liquid assets = Current assets – Stock – Prepaid expenses
Liquid assets mean those assets which will cash very shortly. All current assets accept
stock and prepaid expenses are included in liquid assets. Stock is excluded from liquid
assets because it has to be sold before it converted into cash. Prepaid expenses are also
excluded from it because they are not expected to be converted into cash.
YEAR L.A. / C.L. QUICK RATIO
2009-2010 (in crores) 79.71/31.74 2.51:1
2010-2011 (in crores) 97.85/28.31 3.46:1
Table 4.2 : Quick Ratio

- 49 -
Fig. 4.2 : Quick Ratio
Significance:
Generally, the quick ratio of 1:1 is considered to be satisfactory. Quick ratio thus more
rigorous test of liquidity than the current ratio ands, when used together with current ratio,
it gives a better picture of short term financial positions of the firm.
Comments:
Since quick ratio is increasing over the years, it gives a better picture of firm’s short term
financial position so firm is in a position to pay its current liabilities immediately or within
a month.
0
0.5
1
1.5
2
2.5
3
3.5
4
79.71/31.74 97.85/28.31
2009-2010 (in crores) 2010-2011 (in crores)
Year
Qui
ck R
atio
QUICK RATIO

- 50 -
Cash Ratio Trends
Since cash is the most liquid asset, a financial analyst may examine cash ratio and its
equivalent current liabilities. Trade Investments and marketable securities equivalent to
cash; so they may be included in cash ratio.
Cash ratio generally helps in finding out whether the cash is being proper utilized in the
business not and to check that whether or not cash is lying ideal in the firm It shows that
debtors are not making prompt payments and company is not able to make better
utilization of cash.
Cash + Marketable securities
Cash Ratio = ____________________________
Current Liabilities
Table 4.3 : Cash Ratio
YEAR C+M/S / C.L. CASH RATIO
2009-2010 (in crores) 15.35/31.74 0.48:1
2010-2011 (in crores) 13.31/28.31 0.47:1

- 51 -
Fig. 4.3 : Cash Ratio
Significance:
Cash ratio generally helps in finding out whether the cash is being proper utilised in the
business or not and to check that whether or not cash is lying ideal in the firm, if yes then
to make proper utilization of cash.
Comments:
As we can see that circulation of cash has decreased over the past years. It shows that
debtors are not making prompt payments and company is not able to make better
utilization of cash.
0.464
0.466
0.468
0.47
0.472
0.474
0.476
0.478
0.48
0.482
15.35/31.74 13.31/28.31
2009-2010 (in crores) 2010-2011 (in crores)
Year
Cas
h R
atio
CASH RATIO

- 52 -
Leverage ratios
Debt-Equity Ratio Trends
Several debt ratios may be used to analyse the long term solvency of the firm. The firm
may be interested in knowing the portion of the interest-bearing debt (also called funding
debt) is the capital structure. It indicates the proportion of funds which are acquired by
long term borrowing in comparison to shareholders funds.
Debt Long term Loans
Debt Equity Ratio = ___________ OR _________________
Equity Shareholders Funds
Long Term Loans = Debentures + Mortgage Loans + Bank Loan + Loan from Financial
Institutions + Public Deposits.
Shareholder’s Funds = Equity Share Capital + Preference Share Capital + Share Premium
+ General Reserves + Capital Reserves + Credit Balance of Profit and Loss Accounts –
Accumulated Losses and Fictitious Assets.
YEAR D / E DEBT-EQUITY RATIO
2009-2010 (in crores) 16.04/154.82 0.10:1
2010-2011 (in crores) 72/129.35 0.55:1
Table 4.4 : Debt Equity Ratio

- 53 -
Fig. 4.4 : Debt Equity Ratio
Significance:
The normally accepted debt equity ratio is 2:1, if the ratio is higher than 2:1, it means that
long term borrowing is more than twice in comparison to funds to provide by owners and it
will indicate a risky financial position.
Comments:
As we can see that the debt ratio of firm is decreasing over the years rather it borrowed
some funds in 2006-2007 but previous data is very sound, so it indicates that firm has a
better financial position to pay its long term debts and the ratio of previous year is less than
the required standards, which is satisfactory but it should control this increase in the last
year so that the firm can make use of market fund and increase activity.
0
0.1
0.2
0.3
0.4
0.5
0.6
16.04/154.82 72/129.35
2009-2010 (in crores) 2010-2011 (in crores)
Year
Deb
t-Equ
ity R
atio
DEBT-EQUITY RATIO

- 54 -
Debt to Total Funds Ratio Trends
This ratio expresses the relationship between long term debt and shareholders fund. It
indicates the proportion of funds which are acquired by long term borrowing in
comparison to shareholders funds. This ratio is calculated to assess the ability of the firm to
meet its long term liabilities.
Debt
Debt to Total Funds Ratio = _________________
Debt + Equity
Long Term Loans (Debt) = Debentures + Mortgage Loans + Bank Loan + Loan from
Financial Institutions + Public Deposits.
Shareholder’s Funds (Equity) = Equity Share Capital + Preference Share Capital +
Security Premium + General Reserves + Capital Reserves + Credit Balance of Profit and
Loss Accounts - Accumulated Losses and Fictitious Assets.
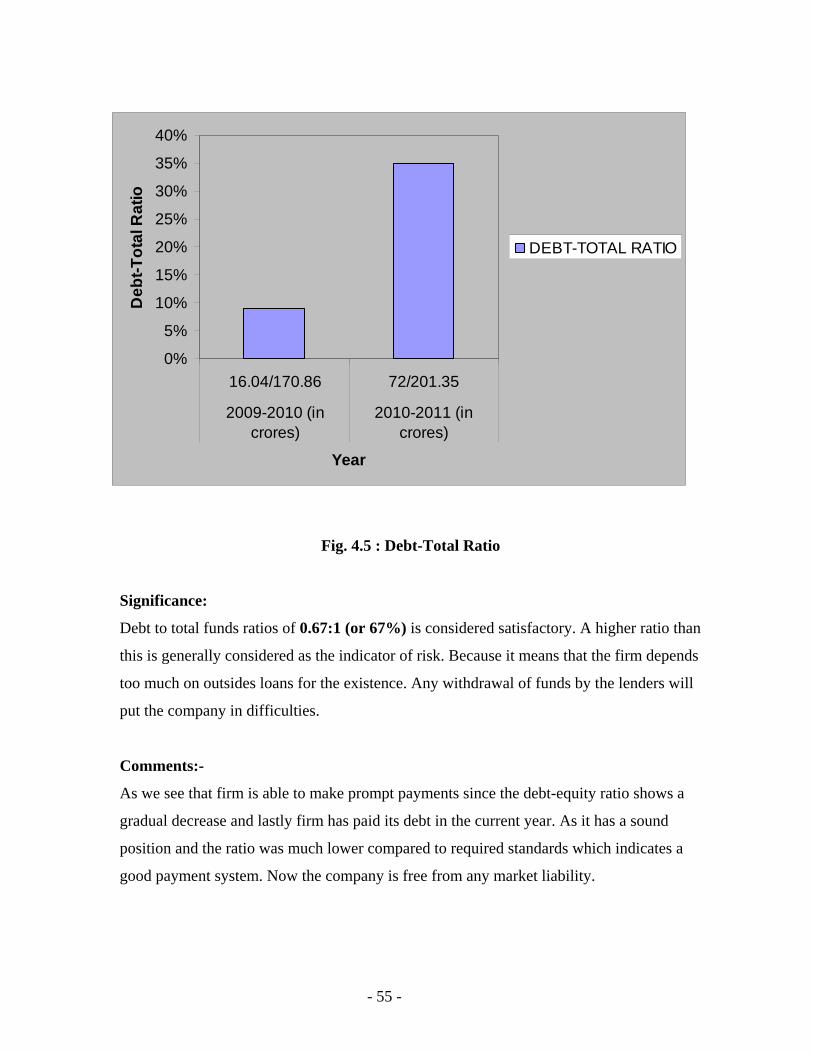
YEAR D / D+E DEBT-TOTAL RATIO
2009-2010 (in crores) 16.04/170.86 9%
2010-2011 (in crores) 72/201.35 35%
Fig. 4.5 : Debt- Total Ratio
- 55 -
Fig. 4.5 : Debt-Total Ratio
Significance:
Debt to total funds ratios of 0.67:1 (or 67%) is considered satisfactory. A higher ratio than
this is generally considered as the indicator of risk. Because it means that the firm depends
too much on outsides loans for the existence. Any withdrawal of funds by the lenders will
put the company in difficulties.
Comments:-
As we see that firm is able to make prompt payments since the debt-equity ratio shows a
gradual decrease and lastly firm has paid its debt in the current year. As it has a sound
position and the ratio was much lower compared to required standards which indicates a
good payment system. Now the company is free from any market liability.
0%
5%
10%
15%
20%
25%
30%
35%
40%
16.04/170.86 72/201.35
2009-2010 (incrores)
2010-2011 (incrores)
Year
Deb
t-Tot
al R
atio
DEBT-TOTAL RATIO

- 56 -
Proprietary Ratio Trends
This ratio indicates the proportion of total funds provided by owners or shareholders.
Equity
Proprietary Ratio = ________________
Debt + Equity
OR
Shareholder’s Funds
= ______________________________________
Shareholder’s Fund + Long-Term Loans
YEAR E / D+E PROPRIETARY RATIO
2009-2010 (in crores) 177.61/193.65 9%
2010-2011 (in crores) 194.07/266.07 35%
Table 4.6 : Proprietary Ratio

- 57 -
Fig. 4.6 : Proprietary Ratio
Significance:
The ratio should be 33% or more than that. A higher proprietary ratio is generally treated
as an indicator of sound financial position from long term point of view. Because it means
that firm is less dependent on external sources of finance. On the other hand lower the
ratio, the less secured are the long term loans and face the risk of losing their money.
Comments:
Higher proprietary ratio is treated as the indicator of sound financial position from the
long-term point of view because it is less depended on external sources of finance. The
company’s proprietary ratio is ranging between 92% to 100% which is quite good. As
clearly depicted by the calculations.
0%
5%
10%
15%
20%
25%
30%
35%
40%
177.61/193.65 194.07/266.07
2009-2010 (incrores)
2010-2011 (incrores)
Year
Prop
rieta
ry R
atio
PROPRIETARY RATIO

- 58 -
Interest Coverage Ratio Trends
This ratio is also termed as ‘debt service Ratio’ or ‘Fixed Charge Coverage Ratio’. This
ratio is calculated by dividing the net profit before charging interest and Income Tax by
‘Fixed Interest charges’.
Net Profit before interest and taxes
Interest Coverage Ratio = __________________________________
Fixed Interest Charges
Net profit before interest and taxes is to be taken for the calculation of this ratio because
this is the amount of profit out of which interest and taxes are to be paid out. Fixed interest
charges include interest on fixed (long term) loans or debentures.
YEAR NP/FIC INTEREST COVERAGE RATIO
2009-2010 (in crores) 31.10/0.62 50.16 times
2010-2011 (in crores) 30.62/0.98 31.24 times
Table 4.7 : Interest Coverage Ratio

- 59 -
Fig. 4.7 : Interest Coverage Ratio
Significance:
This ratio indicates how many times the interests charges are covered by the profits
available to pay interest charges. A long term lender is interested in findings out whether
the business will earn sufficient interest to pay the interest charges regularly. The higher
the ratio, more secure the lender is in respect of payment of interest regularly. An interest
coverage ratio of 6 to 7 times is considered appropriate.
Comments:
Normally acceptable interest coverage ratio is 6 to 7 times, when as the actual of the
company is 31.24 times in current year, it means that profits of the company are 31 times
in comparison to fixed interest charges. So the firm is able to pay the interest on long term
loans regularly.
0
10
20
30
40
50
60
31.10/0.62 30.62/0.98
2009-2010 (in crores) 2010-2011 (in crores)
Year
Inte
rest
Cov
erag
e R
atio
INTERESTCOVERAGE RATIO
- 60 -
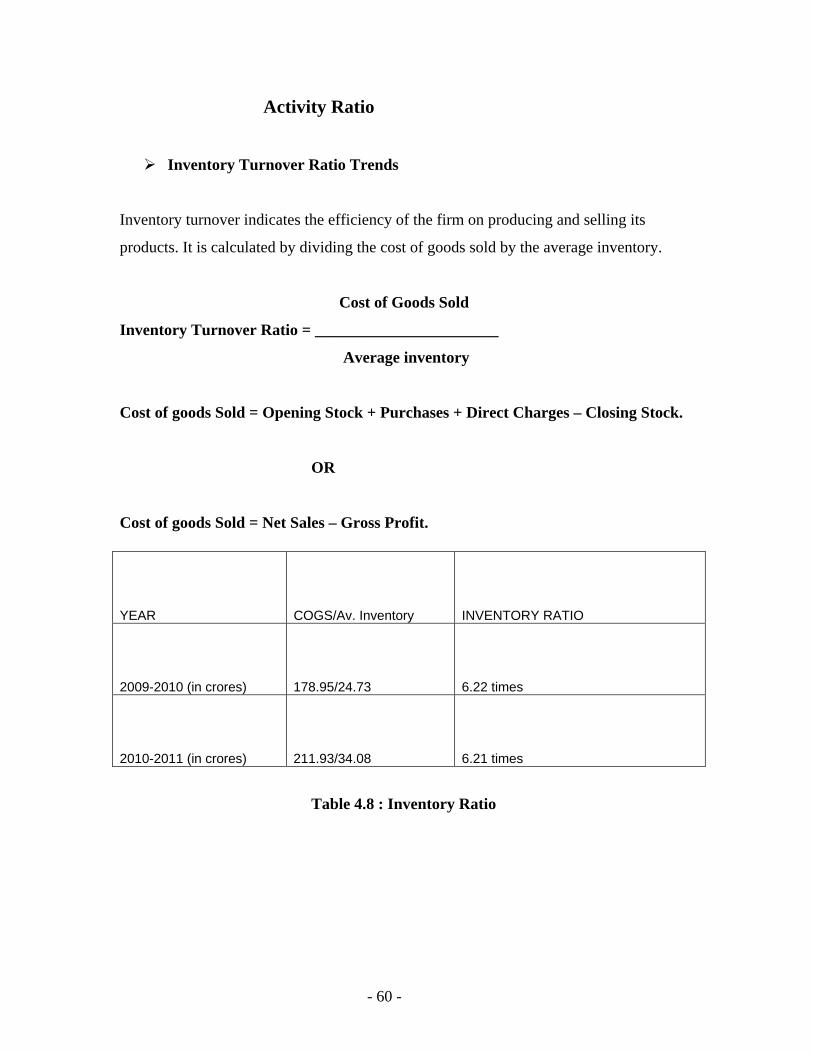
Activity Ratio
Inventory Turnover Ratio Trends
Inventory turnover indicates the efficiency of the firm on producing and selling its
products. It is calculated by dividing the cost of goods sold by the average inventory.
Cost of Goods Sold
Inventory Turnover Ratio = _______________________
Average inventory
Cost of goods Sold = Opening Stock + Purchases + Direct Charges – Closing Stock.
OR
Cost of goods Sold = Net Sales – Gross Profit.
Table 4.8 : Inventory Ratio
YEAR COGS/Av. Inventory INVENTORY RATIO
2009-2010 (in crores) 178.95/24.73 6.22 times
2010-2011 (in crores) 211.93/34.08 6.21 times

- 61 -
Fig. 4.8 : Inventory Ratio
Significance:
This ratio indicates whether or not the stock has been efficiently utilized. It shows the
speed with which the stock is rotated into sales. The higher the ratio, the better it is, since it
indicates that the stock is selling quickly. In business where stock turnover is high goods
can be sold at low margin of profit and even then the profitability can be high.
Comments:
Inventory turnover ratio of the company is quite good earlier it means that there is proper
outflow of the stock and goods do not remain in the godown for a long time. As we can see
that the inventory turnover is decreasing which shows that there is overspending in stock
which is left unused.
6.204
6.206
6.208
6.21
6.212
6.214
6.216
6.218
6.22
6.222
178.95/24.73 211.93/34.08
2009-2010 (in crores) 2010-2011 (in crores)
Year
Inve
ntor
y R
atio
INVENTORY RATIO

- 62 -
Debtors Turnover Ratio Trends
This ratio indicates the relationship between the credit sales and average debtors or debtor
of the current year.
Net Current
Debtor Turnover Ratio = _______________________________
Average Debtors + Average B/R
Bills receivable are added in debtors for the purpose of calculation of this ratio. While
calculating this ratio, provision for bad debt and doubtful debt is not deducted from total
debtors, so that it may not give a false impression that debtors are collected quickly.
Net Credit Sales = Total Sales – Cash Sales.
Average Debtors = (Opening Debtors + Closing Debtors)/2
Average Bills Receivables = (Opening B/R + Closing B/R)/2
YEAR SALES / D+B/R DEBTORS RATIO
2009-2010 (in crores) 89.79/37.57 2.38 times
2010-2011 (in crores) 123.51/45.25 2.72 times
Table 4.9 : Debtors Ratio

- 63 -
Fig. 4.9 : Debtors Ratio
Significance:
This ratio indicates the speed with which the amount is collected from debtors. The higher
the ratio, the better it is, since it indicates that amount from debtors is being collected more
quickly. The less the risk from bad debt, and so the lower the expenses of collection and
increase in the liquidity of the firm.
Comments:
Debtor turnover ratio of the company is 2.72 which is quite good it means there is efficient
credits sales policy of the management. So there is less risk of bad debts but there is
increase in the ratio from the last year.
2.2
2.3
2.4
2.5
2.6
2.7
2.8
89.79/37.57 123.51/45.25
2009-2010 (in crores) 2010-2011 (in crores)
Year
Deb
tors
Rat
io
DEBTORS RATIO

- 64 -
Average Collection Period Trends
This ratio indicates the time within which the amount is collected from debtor and bills
receivable.
Average Debtors
Average Collection Period = ___________________ * 100
Credit Sales
OR
365
= _________________
Debtors Turnover
YEAR 365/SALES AVERAGE PERIOD
2009-2010 (in crores) 365/2.38 153 days
2010-2011 (in crores) 365/2.72 134 days
Table 4.10 : Average Ratio
- 65 -
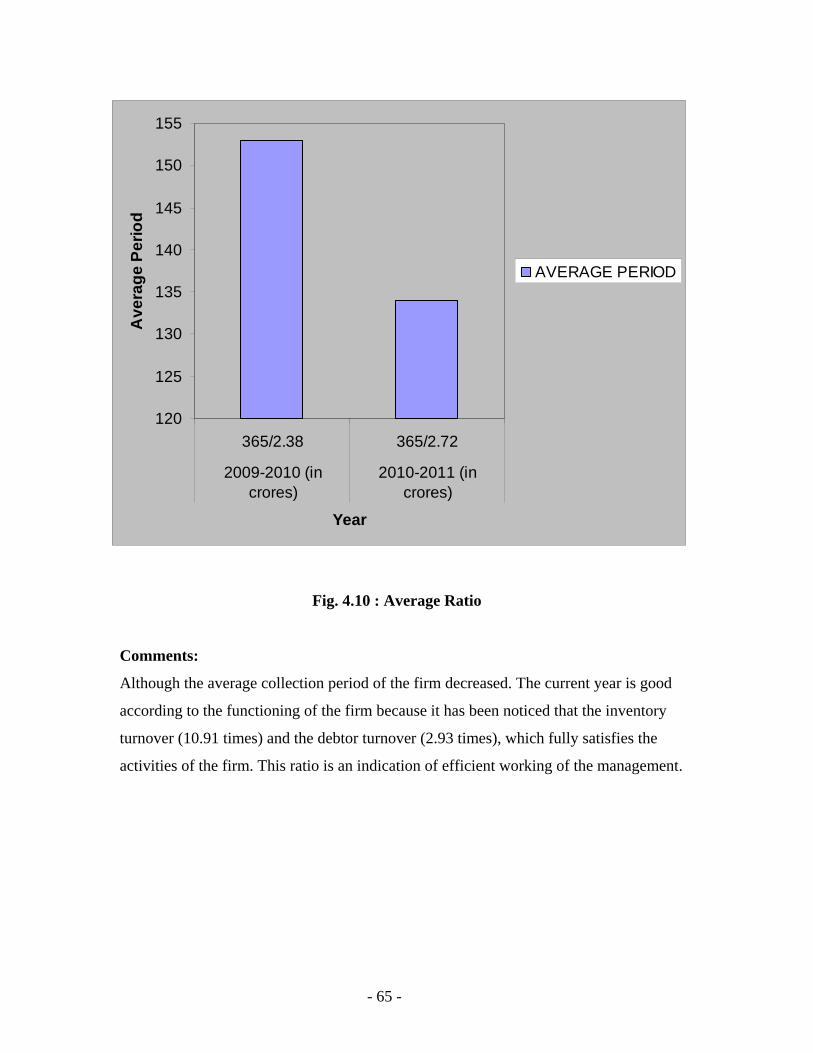
Fig. 4.10 : Average Ratio
Comments:
Although the average collection period of the firm decreased. The current year is good
according to the functioning of the firm because it has been noticed that the inventory
turnover (10.91 times) and the debtor turnover (2.93 times), which fully satisfies the
activities of the firm. This ratio is an indication of efficient working of the management.
120
125
130
135
140
145
150
155
365/2.38 365/2.72
2009-2010 (incrores)
2010-2011 (incrores)
Year
Ave
rage
Per
iod
AVERAGE PERIOD

- 66 -
Fixed Assets Turnover Ratio Trends
Assets are used to generate sales. Therefore, a firm should manage its assets efficiently to
maximize sales. The relationship between sales and assets is called assets turnover ratio.
Assets turnover ratios can be calculated.
Cost of Goods Sold
Fixed Assets Turnover Ratio = _________________________
Net Fixed Assets
Net Fixed Assets = Fixed Assets – Depreciation + Capital Work-in-Progress
YEAR COGS/F.A. FIXED ASSETS RATIO
2009-2010 (in crores) 178.95/120.86 1.48 times
2010-2011 (in crores) 211.93/168.45 1.27 times
Table 4.11 : Fixed Assets Ratio

- 67 -
Fig. 4.11 : Fixed Assets Ratio
Significance:
This ratio is of particular importance in manufacturing concerns where the investment in
fixed assets is quite high. This ratio reveals how effectively the fixed assets are being
utilized, compared with previous year.
1.15
1.2
1.25
1.3
1.35
1.4
1.45
1.5
178.95/120.86 211.93/168.45
2009-2010 (incrores)
2010-2011 (incrores)
Year
Fixe
d A
sset
s R
atio
FIXED ASSETS RATIO

- 68 -
Profitability Ratios
Gross Profit Ratio Trends
This ratio shows the relationship between Gross Profit and Sales.
Gross Profit
Gross Profit Ratio = ________________________ * 100
Net Sales
Net Sales = Sales – Sales Return
YEAR G.P. / NS GROSS PROFIT RATIO
2009-2010 (in crores) 27.58/59.79 31%
2010-2011 (in crores) 25.67123.51 21%
Table 4.12 : Gross Profit Ratio

- 69 -
Fig. 4.12 : Gross Profit Ratio
Significance:
This ratio measures the margin of profit available on sales. No ideal standard is fixed for
this ratio, but it should be adequate enough to meet not only operating expenses but also to
provide for depreciation, interest on loans, dividends and creation of reserve.
Comments:
As the figure clearly states that the revenue generated from sales is increasing but the profit
is going down by few digits because of increase in manufacturing activities. But still the
ratio of the current year is quite significant but still the company need to find the reason for
this continuous decrease in this ratio which might be problematic in new future.
0%
5%
10%
15%
20%
25%
30%
35%
27.58/59.79 25.67123.51
2009-2010 (incrores)
2010-2011 (incrores)
Year
Gro
ss P
rofit
Rat
io
GROSS PROFIT RATIO

- 70 -
Net Profit Ratio Trends
This ratio shows the relationship between the net profit and the sales. Net profit is used to
measure the overall profitability of business.Net profit margin is considered as an indicator
of the success of the management to operate the business successfully.
Net Profit
Net Profit Ratio = ______________ * 100
Net Sale
YEAR N.P. / N.S. NET PROFIT RATIO
2009-2010 (in crores) 10.35/89.79 12%
2010-2011 (in crores) 15.43/123.51 12%
Table 4.13 : Net Profit Ratio

- 71 -
Fig. 4.13 : Net Profit Ratio
Significance:
Net Profit ratio is used to measure the overall profitability of business. Net profit margin is
considered as an indicator of the success of the management to operate the business
successfully. It is possible the gross profit ratio may be increasing but net profit ratio may
not be increasing or even show a decreasing trend.
0%
2%
4%
6%
8%
10%
12%
14%
10.35/89.79 15.43/123.51
2009-2010 (in crores) 2010-2011 (in crores)
Year
Net
Pro
fit R
atio
NET PROFIT RATIO

- 72 -
Operating Profit Ratio Trends
This ratio establishes the relationship between all the operating expenses and sales.
Operating Profit
Operating Profit Ratio = ________________________ * 100
Net Sales
Operating Profit = Gross Profit – Operating expenses (efficient and administrative
expenses selling and distribution expenses, discount, interest on
short-term debts etc.)
YEAR O.P. / N.S. OPERATING PROFIT RATIO
2009-2010 (in crores) 20.21/89.79 23%
2010-2011 (in crores) 22.72/123.51 22%
Table 4.14 : Operating Profit Ratio

- 73 -
Fig. 4.14 : Operating Profit Ratio
Significance:
This ratio measure the rate of net profit earned on sales. It helps in determining the overall
efficiency of the business operations. As increase in the ratio over the previous shows
improvement in the overall efficiency and profitability of the business.
Comments:
The net profit ratio also shows a decrease the operating expenses have increased in
comparison to net year. So they should keep a watch on their operating activities and try to
reduce the expenditure incurred on them.
To the figure clearly states that the revenue generated from sales is increasing but the profit
is going down by few digits because of increase in operational activities. But still the ratio
of the current year is quite significant but this continuous decrease in the ratio might be
problematic. Current year is quite significant but this continuous decrease in the ratio
might be problematic. Quantity is decreasing but rate increased that is why there is profit
otherwise there would have been loss.
21%22%22%22%22%22%23%23%23%23%
20.21/89.79 22.72/123.51
2009-2010 (incrores)
2010-2011 (incrores)
Year
Ope
ratin
g Pr
ofit
Rat
io
OPERATING PROFITRATIO

- 74 -
Return On Investment (ROI) Trends
This ratio reflects the overall profitability of the business. It is calculated by comparing the
profit earned and the capital employed to earn it.
Profit before tax, interest and dividends
Return on investment = ________________________________________ * 100
Net worth
YEAR PROFIT / NET WORTH RETURN OF INVESTMENT
2009-2010 (in crores) 20.21/52.85 38%
2010-2011 (in crores) 27.72/57.64 48%
Table 4.15 : Return of Investment

- 75 -
Fig. 4.15 : Return of Investment
Significance:
This ratio helps in taking decisions regarding capital investment in the new projects. The
new projects will be commenced only if the rate of return on capital employed / net worth
in such projects is expected to be more than the rate of borrowings.
0%
10%
20%
30%
40%
50%
60%
20.21/52.85 27.72/57.64
2009-2010 (in crores) 2010-2011 (in crores)
Year
Ret
urn
of In
vest
men
t
RETURN OFINVESTMENT

- 76 -
Return on Equity (ROE) Trends
Equity shareholders of a company are more interested in knowing the earning capacity of
the fields in the business. As such, this ratio measures the profitability of the funds
belonging to the equity shareholders. Since the profits available to equity shareholders will
be the profit left after payment of interest, taxes and dividend on preference share capital.
Net profit after interest, tax and
Preference dividend
Return on Equity Shareholder’s Funds = ___________________________________ * 100
Equity Shareholder’s Funds
Equity Shareholder’s Funds = Equity Share Capital + All Reserves + Credit Balance
of P&L A/c – Fictitious assets – Debit Balance of P&L
A/c.
YEAR PROFIT / EQUITY RETURN OF EQUITY
2009-2010 (in crores) 10.35/4.14 3%
2010-2011 (in crores) 15.43/4.14 4%
Table 4.16 : Return of Equity

- 77 -
Fig. 4.16 : Return of Equity
Significance:
This ratio measures how efficiently the equity shareholder’s funds are being used in the
business. It is true measures of the efficiency of the management since it shows what the
earning capacity of the equity shareholders funds. The higher the ratio, the better it is,
because in such a case equity shareholders may be given a higher dividend. But the graph
is fluctuating; this shows that the shareholders are not getting constant return on their
investment.
We can compare the earning capacity of firm with the other firms with the help of this
ratio. Similarly, by comparing the previous year’s ratio with that of the current year of our
business we can ascertain whether the return on equity shareholder’s funds is increasing or
not. Their ratio may also be used for declaration of dividend and creation of reserve for
future growth.
0%
1%
1%
2%
2%
3%
3%
4%
4%
5%
10.35/4.14 15.43/4.14
2009-2010 (incrores)
2010-2011 (incrores)
Year
Ret
urn
f Equ
ity
RETURN OF EQUITY

- 78 -
FINDINGS
After collection and analyzing the data, the researcher has to accomplish the task of
drawing interferences. It’s only through interpretation that researcher can expose relations
and processes that underlie his findings. Thus interpretations a device through which the
factor that seems to explain what has been observed by researcher in the course of the
study can be understood better. So for the simplification I have divided my findings in four
parts.
Liquidity Ratio
Current ratio increases over the year which shows good sign on the part of management
functions as we notice that it is below the required standard. But idleness of assets has to
be taken care of. They should be utilized in some beneficial investment.
Quick Ratio also increases which shows that company is carrying enough amount of
liquid assets.
Cash ratio has also gone down which means debtors are not making prompt payments.
Leverage Ratio
Debt ratio of the firm is decreasing which indicates that the firm is able to pay its debts in
time.
Debt to total funds ratio is also decreasing and firm is finally paid all of its debt in the
current years which tell that firm is free from all outside liabilities.
Proprietary ratio of the firm is also much higher than 33% which is the indicator of sound
financial position as firm is less dependent on external sources of finance.

- 79 -
Turnover Ratios
Fixed assets ratio revels how efficiently the fixed assets are being utilized in the business
indicated by an increase this shows proper utilization of assets.
Inventory turnover ratio is quite high which indicates that stock is regulated into
business at regular intervals and one can also measure the sales policies of the firm.
Debtor turnover ratio also shows an increase which indicates that the amount is regularly
collected by the debtor so there is less risk of bad debts and collection period also satisfies.
Profitability Ratios
Gross profit ratio compared with the previous years shows a gradual decrease which
sounds problematic for the company.
Net profit ratio decrease with the high volumes compared in the previous year. Thus is
due to depreciation and increase in manufacturing and operating expenses.
Operating profit ratio also shows a decrease in comparison to past years.

- 80 -

- 81 -
CHAPTER-5

- 82 -
- 83 -
RECOMMENDATIONS
• The liquidity ratio shows that the liquidator’s position of the company is quite
satisfactory. All the ratios such as the current ratio, quick ratio and cash ratio show a
significant increase in comparison with past years. The company has to make full
utilization of its assets.
• Leverage position of the company is good as we can see that the ratio continuously
decreases and lastly the firm is able to pay all its debt in current year. So the firm
should try to maintain it and should invest its money in some profitable activities.
• Gross profit ratio of the company is declining, this could be due to:
Increase in the prices of raw material.
Increase in the manufacturing expenses.
There is full in the prices of unsold goods, there by reducing the value of
unsold goods.
• Focused attention should be paid by including a special drive to expatiate recoveries
from sundry debtors.
• The net profit ratio of the firm also decreases. It shows the inefficiency and
unpredictability of the business. This decline is because in expenses borne by
operating activities.
• The operating profit ratio is less than previous year.

- 84 -
CONCLUSIONS
In today’s environment it becomes very important for organizations to retain their,
becomes very important for organizations to retain their employees. The top organizations
are on the top because they value their employees and they know how to keep them glued
to the organization. Employees stay and leave organizations for some reasons. The reason
may be personal or professional. These reasons should be understood by the employer
and should be taken care of. The organizations are becoming aware of these reasons and
adopting many strategies for employee retention. The project under study in the S.S.SAIB
CONSTRUCTION PRIVATE LIMITED FARIDABAD is having a large number of
employees, but with the large number of employees the organization is having moderately
good communication, recruitment, and performance appraisal system.
From the above study of employee retention system in S.S.Saib Construction Company I
observe that employee retaining techniques adopted by organization is moderately good.
In S.S.Saib Construction Company there are sufficient activities done to improve
employee retention and retain employees for longer time. But as in this competitive there
are some limitations in the organizations which the organization has to overrule to make
their organizations better than others like-
1. Lack of open communication.
2. Proper feedback is not given to employees which may demotivate the employees.
3. Lack of appropriate development opportunities given to employees.
4. Lack of transparent work culture

- 85 -
CHAPTER-6

- 86 -

- 87 -
BIBLIOGRAPHY Books:-
a) Gupta, Shashi K.&R.K. Sharma, Financial management, Kalyani publisher
(5 th edition)
b) Goel, D.K., Analysis of Financial Statements, Arya publications,
(5 th edition)
c) Kothari, C.R., Research Methodology, Sultan Chand publications,
(3 rd edition)
d) Pandey, LM, Financial Management, Vikas publications
(2 nd edition)
World Wide Web:-
• www.ssscpl.in
• www.india-today.com
• www.ssconstruction.net
• www.ssconstruction.au
• www.ssconstruction.com

- 88 -

- 89 -
CHAPTER-7

- 90 -

- 91 -
Balance Sheet
Principal Groups 1-Apr-2011 to 31-Mar-2012
Principal Ratios 1-Apr-2011 to 31-Mar-
2012
Working Capital 1,81,38,665.53 Dr Current Ratio 1.50 : 1(Current Assets-Current
Liabilities) (Current Assets : Current Liabilities)
Cash-in-hand 80,167.50 Dr Quick Ratio 1.15 : 1Bank Accounts 21,51,174.75 Dr (Current Assets-Stock-in-hand : Current
Liabilities)
Bank OD A/c 1,02,96,889.34 Cr Debt/Equity Ratio 0.54 : 1Sundry Debtors 2,87,86,865.82 Dr (Loans (Liability) : Capital Account +
Nett Profit)
(due till today) 10,78,69,339.08 Dr
Gross Profit % 9.85 %
Sundry Creditors 3,31,31,488.20 Cr Nett Profit % 4.00 %(due till today) 7,97,64,430.24
Cr Operating Cost % 96.00 %
Sales Accounts 16,55,09,012.32 Cr
(as percentage of Sales Accounts)
Purchase Accounts 12,07,67,155.84 Dr
Recv. Turnover in days 56.66 days
Stock-in-hand 1,26,89,560.00 Dr (payment performance of Debtors) Nett Profit 66,16,325.77 Cr Return on Investment % 34.91 %Wkg. Capital Turnover 9.12 (Nett Profit / Capital Account + Nett
Profit )
(Sales Accounts / Working Capital)
Return on Wkg. Capital % 36.48 %
Inventory Turnover 13.04 (Nett Profit / Working Capital) % (Sales Accounts / Closing
Stock)

- 92 -
Data consolidated for financial analysis:
Particulars 2010 2009
Inventory (A) 37.73 30.44
Debtors (B) 73.24 51.59
Cash & Bank Balance (C) 13.31 15.35
Loans and advances (D) 11.29 12.61
Total Current Assets 135.56 110
(A + B + C + D)
Liquid assets 97.85 79.71
Fixed Assets 167.45 120.86
Current Liabilities 28.31 31.74
& Provisions
Share Capital (E) 9.19 9.19
Reserve & Surplus (F) 184.88 168.42
Shareholder’s Funds 194.07 177.61
(E + F)
Long-term Debt 72 16.04
Net Worth 194.07 177.61

- 93 -
Financial data of the company under study
Years 2010 2009
Sales 237.60 206.53
Other Income 6.59 5.05
Operating Profit 26.88 28.73
Profit before Tax 30.62 31.10
Tax 12.09 8.28
Profit after Tax 18.53 22.80
Gross Profit 25.67 27.58
Cash Sales 114.09 116.74

- 94 -


