76
Summit of the Americas ACHIEVING THE EDUCATIONAL GOALS Regional Report Regional Education Indicators Project

Summit of the Americas
ACHIEVING THEEDUCATIONAL GOALS
Regional Report
Regional EducationIndicators Project

Vivian HeylHead of the Departmentof Research and Statistics
Ministry of EducationRepublic of Chile
Cesar GuadalupeTechnical Coordinator,
Regional Information System (SIRI)UNESCO Regional Bureau of Education
for Latin America and the Caribbean
ACHIEVING THE EDUCATIONAL GOALS
© Regional Education Indicators Project
General Coordination:
Technical Coordination
Research team: Paula Darville, Javier González, Cesar Guadelupe, Vivian Heyl,Paula Louzano, Antonella Perfetti.
UNESCO Institute of Statistics provided most of the indicators used in thispublication. PRIE received financial support from the United States Agency forInternational (AID), the Ministry of Education of Chile, and UNESCO.
English translation: William GallagherGraphic design and layout: Wacquez&O’Ryan
The members of the Regional Education Indicators Project are responsible forthe content of this report. The opinions expressed herein do not necessarilyrepresent those of the Ministry of Education of Chile, nor those of UNESCO.
The place names utilized in this publication do not imply on the part of theauthors any position whatsoever in regard to the legal status of the countries,cities, territories, nor zones or in regard to their authorities or to the geographicdelimitation of their borders or limits.
This publication is available on the internet at http://www.prie.cl. It may bereproduced in its entirety or in part, always with due and explicit reference madeto the source.
ISBN: 956-8302-02-6Santiago, Chile, August, 2003
Ana Luiza MachadoDirector UNESCO Regional Bureau of
Education for Latin America and the Caribbean
Sergio BitarMinister of Education
Republic of Chile
CONTENT


5
PREFACE
The goals set by the Summit of the Americas in the area of education speak to centralconcerns that are linked both with guaranteeing the fundamental human rights of allpeople and with investing in the harmonious and equitable development of our countries.
The Regional Education Indicators Project, PRIE, is an initiative that came out of theSecond Summit of the Americas, at which Heads of State identified education as thefirst priority of the region. The work carried out by the project has aimed at constructingregional comparable indicators, with the objective of contributing to the definition ofmore effective education policies.
In this sense, the publication Educational Panorama of the Americas (2002) was aneffort to view the hemisphere from a comparative educational perspective. It showsthat the progress achieved in education has occurred in a very unequal manner, andthat there are important gaps to be overcome, both within and among countries.
It is therefore extremely important to be aware of the progress of countries in regardto the goals, as well as to have insights into the impact of the development of educationon people and on communities in order to understand the future challenges facingpublic education policies.
In this closing phase of the first three years of this project, we present a new publicationthat focuses on illustrating the progress in the hemisphere in achieving the educationgoals of the Summit of the Americas. It also considers the need for such progress interms of the impacts that education has on the lives of people, families, and communities.
This publication coincides in time both with the conclusion of the Regional EducationIndicators Project within the framework of which it has been developed, and with theThird Meeting of Ministers of Education to be held in Mexico City from August 11-13of this year. In this sense, we are confident that it will provide new elements for theconsideration of the ministers of the hemisphere at their meeting, as well as for allof those who are interested in the challenges of education, the development of ourcountries, and in the region as a whole.
Finally, we hope that the efforts carried out will continue through time, so that we mayhave information, indicators, and analyses that make it possible to track the state ofeducation in our countries in regard to the goals of the Summit, and other internationalcommitments.
Sergio BitarMinister of Education
Republic of Chile
Ana Luiza MachadoDirector UNESCO Regional Bureau of
Education for Latin America and the Caribbean

6

7
At the Second Summit of the Americas (Chile, April, 1998), the Heads of State and of Government adoptedan Action Plan for Education for the region. This plan contained the following general goals: to assure thatby the year 2010, 100% of young people would complete quality primary education, and that at least 75%of young people would have access to quality secondary education, with increasingly higher percentages ofyoung people completing their secondary school studies; and that there would be increasing opportunitiesfor life-long education for the population in general.
During the meeting of Ministers of Education of the countries attending the Second Summit of the Americas,held in Brasilia (July, 1998), it was agreed that the Ministry of Education of Chile, in collaboration with UNESCO,would coordinate the design and execution of a regional education indicators project. The purpose was forthe project to contribute to follow-up and assessment of fulfillment of the objectives of the Plan of Action inEducation for the region.
Interested countries from the entire hemisphere met in August, 2000 in Washington, DC. At that time, Chilepresented the content and methodology of the work of PRIE. Thus begining its implementation as a three-year project.
Project execution coincided with publication of Education Panorama of the Americas, a document thatpresented an overview of education in the hemisphere, based on available indicators. Execution of the Projecthas made it possible to move forward in the interpretation of available education indicators, as well as inproposing new indicators that will allow us to better verify both the progress of countries in achieving thegoals of the Summit of the Americas, and the impacts of education on the lives of communities, individuals,and families.
This publication brings together both new perspectives of available education indicators in light of the goalsof the Summit of the Americas, and considerations of the social impacts of education.
We here analyze fulfillment of the education goals of the Summit of the Americas, utilizing the most recentinformation and indicators published by the UNESCO Institute of Statistics and other sources. In addition, weoffer thoughts on the social impact of education based on experiences of the Project.
This volume is organized in the following manner: a first chapter summarizes the education goals of theSummit of the Americas, specifying their scope and meaning. It also uses available information in order toillustrate countries’ progress in terms of the Summit goals, including methodological comments on the capacityand pertinence of existing indicators for the development of such an assessment. The second chapter presentsthoughts on the social impacts of education, and illustrates some of these impacts using available informationfrom the region. Finally, we present a set of conclusions and an appendix with information used in thispublication.
We believe that this volume provides relevant information for those involved in decision-making regarding theformulation, execution, and assessment of education policies. After all, this is always the purpose and meaningof statistical information; that it be valuable for improving the living conditions of people.
INTRODUCTION


1chapterAt the Second Summit of the Americas (Chile,April, 1998), the Heads of State and of Governmentadopted an Education Action Plan. This plan set asgeneral objectives for the region that by the year2010:
1. 100% of young people would complete qualityprimary education courses;
2. At least 75% of young people would have accessto quality secondary education, with increasinghigher percentages of young people finishingsecondary school;
3. Life-long education opportunities for the generalpopulation.
This chapter seeks to specify the scope and meaningof these goals, as well as to present the situation inthe region in their regard.1
THE SITUATION REGARDING THEEDUCATION GOALS OF THESUMMIT OF THE AMERICAS
9
1 Note that in all cases, we only present information available to thesources used. Therefore, not all tables and analyses correspond to thesame sets of countries. For details on the information used, see thedata appendix.

10
A. FIRST GOAL:UNIVERSAL COMPLETIONOF QUALITY PRIMARYEDUCATION
2 Article 26, Universal Declaration of Human Rights, 1948.3 The Declaration of the Ministers of Education of Latin America and the Caribbean in 1979 (Mexico City), launching the Major Project of Education
(UNESCO, 2000). Overview of the 20 Years of the Major Project of Education in Latin America and the Caribbean. Similarly, theInternational Conference on Education For All, held in 1990 in Jomtien, Thailand (World Conference on Education For All, 1990). Satisfying BasicLearning Needs: a view for the 1990s. moved forward in the same direction, and was ratified at the World Conference of Dakar in the year2000 (World Education Forum, 2000) Framework of Action of Dakar.
DEFINITIONS
Education is considered to be a fundamental human right.2 In this sense, presenting goals regarding assuranceof access to and achievement of particular levels of education has, as a basis, the recognition of this attributeof education. It is also associated with both the individual and collective benefits that education provides interms of improving opportunities and of increasing the well-being of individuals and groups.
There is also a clear recognition of the fundamental role that basic education plays in terms of providingopportunities for the development of increased learning during the lives of individuals. In effect, the achievementof minimal levels of skills in reading, writing, and mathematics is a minimum, indispensable requisite for accessto greater opportunities for all people. The need to assure at least the kind of training that covers basic learningneeds for all people is a growing imperative that is increasingly recognized and accepted by all governments.3
It may be noted that, during recent decades the region has experienced significant growth in the levels ofaccess to primary education. In effect, primary schools today do not provide services exclusively in urbancenters, and serve a large percentage of the population of the Americas.
Nevertheless, there is general concern regarding progress in extending these service, and that advances inaccess to primary schooling be accompanied by the assurance of universal completion of studies at this level. In fact, what we see are high levels of drop out that are generally associated with the economic difficultiesof families. These result in pressures for early entry into the labor market. Drop out is also associated with thefailure of education systems to assure that children have learning opportunities that allow them to successfullymove through the education system.
Significant growth in levels of access have taken place within a context of high demographic growth. Thishas resulted in high increases in school enrollments. Thus, current education systems in the region haveachieved significant progress in guaranteeing access to primary education, although not assuring universalcompletion of this level. They have also been faced with the need, resulting from increased access, of servingunderprivileged social groups whose education requires greater efforts.
This situation has seriously compromised fulfillment of the role of education systems as creators or facilitatorsof equal opportunities. Current challenges to education systems in the region, at least in regard to primaryeducation, are no longer associated only with guaranteeing access; they are increasingly faced with the needto assure completion and the quality of services they offer.
These are the general principles and specific conditions of the region that underlie creation of the goal ofassuring that within the next 7 years, 100% of children will not only access, but also finish primary education,and that such services will be of a level of quality which truly translate into greater and better opportunities.

In order to determine in what conditions the hemisphere finds itself in regard to this goal, it is necessary tomake some initial statements that define operationally how one must proceed in order to assess the situation.
First, it is necessary to define the meaning of “primary education”. Not all national education systems use sucha term, and when they do, they do not all necessarily refer to the same thing. For example, Argentina providesa “basic” education of 9 years, while Bolivia has 8 years of “primary” education. This makes it necessary tospecify what one understands by the term primary education in order to refer to phenomena that aresubstantially common among countries, independently of national nomenclature.
Primary education is usually identified as the first cycle or stage of the learning of the basic rudiments ofreading, writing, and mathematics. With this in mind, and in order to make national education systems thathave their own nomenclatures comparable, UNESCO created the International Standardized EducationClassification. In its 1997 revision (ISCED 97), it designates the education programs that have these objectives(and other additional classification criteria) as corresponding to Level 1 of primary education.
All of the countries in the region have adapted their national systems to ISCED 97 and have thus identifiedwhat, in terms of substantive content, corresponds to ISCED 1. For example, Argentina considers as ISCED 1the first 6 years of its basic education. Bolivia considers ISCED 1 to be the first 6 years of its primary education.
Thus, this report understands as the completion of primary education the end of the number of years ofeducation equivalent to the number of grades or cycles that each country considers to correspond to level1 of ISCED 97.
Moreover, the goal refers to the need to assure that all children conclude primary education. That is, oneshould see to it that all those between 0 and 18 years of age should conclude primary education. This definitioncreates an operational problem, since a significant portion of this group of people, given their age at a giventime, have not had the opportunity to finish such studies, whether because they have not been able to beginsuch study, or because they are at some intermediate grade level.
Thus, the assessment should refer to the probability of finishing studies on the part of this population,given the observation of the current operation of education systems. In this sense, one should look at,within the population that has had the opportunity given its age, to finish their studies, if the educationsystems guarantee universal completion.
Moreover, achievement of this goal relegates the situation of the adult population in regard to access to primaryeducation to be the subject of other specific actions and concerns.
The goal also refers to the quality of primary education. That is, not only is it considered necessary that allchildren have access to and finish primary education; the quality of such education is fundamental for theimpact of this experience to be relevant in the lives of these people, and to contribute to the creation to equalityof opportunities.
11
But “education quality” is a complex and multi-faceted phenomenon. Therefore, as we shall see later,4 it needsto be viewed from a number of perspectives. From the pedagogical perspective, it is important that there isefficiency in fulfillment of curricula. From the cultural perspective, it is necessary that curricular content bebased upon the conditions, possibilities, and aspirations of different populations toward which the content isdirected. From a social point of view, education has quality when it contributes to equity through the generationof equality of opportunities. Finally, in economic terms, quality refers to efficiency in the use of resources.5
In order to approach the issue of the quality of education, UNESCO, just as the OECD, uses the input-process-outcome paradigm, in which quality of education is defined in regard to the human and material resourcesthat are invested. Similarly, in regard to what takes place in schools and in classrooms – that is the processesof teaching and learning, curricula, expectations in regard to the learning of children, etc. Thus, quality maybe defined by looking at education outcomes represented by student performance.6
In spite of this complexity regarding the quality of education, throughout the last two decades, the regionhas witnessed growing development, both on the national and international scales, of systems directed atassessing quality which have emphasized student academic achievement. In the region, these achievementlevels are assessed, either in function of what the respective curricula consider should be achieved by a givengrade or cycle of study, or in function of what, according to other constructions, one considers to be basicskills that society should assure for individuals so they may better confront the demands of a knowledge society.The first focus corresponds to studies such as that of the Latin American Laboratory for Assessment of theQuality of Education.7 The second focus corresponds to studies such as Program for International StudentAssessment (PISA), which recently has issued a new publication.8
Although academic achievement is only one aspect of the complex concept of quality, it is one that is centralfor education systems because it is related to the primary objective of these systems: to assure learning levelsthat translate into better opportunities for people. Thus, it is an area that has progressed to the point ofproviding internationally comparable information.
For the analysis of this first goal of the Summit of the Americas, we will make use of information from the firststudy of LLECE, which considers academic achievement in key subjects (language and mathematics) in the3rd and 4th grades of primary education.
12
4 See the section, “Analytic Model” in Chapter 2. This is based on Carlos Muñoz Izquierdo et.al. (2003) Desarrollo de una propuesta de indicadoresdel impacto social de la educación en América Latina y el Caribe, a study carried out by Universidad Iberoamericana de México underthe direction of Carlos Muñoz Izquierdo. This study was developed at the request of PRIE, and is available at http://www.prie.cl
5 Carlos Muñoz Izquierdo et.al. (2002) Desarrollo de una propuesta de indicadores del impacto social de la educación en América Latinay el Caribe
6 EFA (2002) Is the World on Track? Global Monitoring Report 2002, p. 807 Hereafter denominated LLECE. The results of the first study may be found in Latin American Laboratory for Assessment of the Quality of
Education: First International Comparative Study. UNESCO (2000); Latin American Laboratory for Assessment of the Quality ofEducation: First International Comparative Study, Second Report (UNESCO, 2001); Latin American Laboratory for Assessment ofthe Quality of Education: Technical Report (UNESCO, 2002); Latin American Laboratory for Assessment of the Quality of Education. Qualitative Study of Schools with Outstanding Outcomes in Seven Latin American Countries. All of these documents are available athttp://www.unesco.cl
8 See UNESCO/OECD (2003) Literacy Skills for the World of Tomorrow – Further Results from PISA 2000.
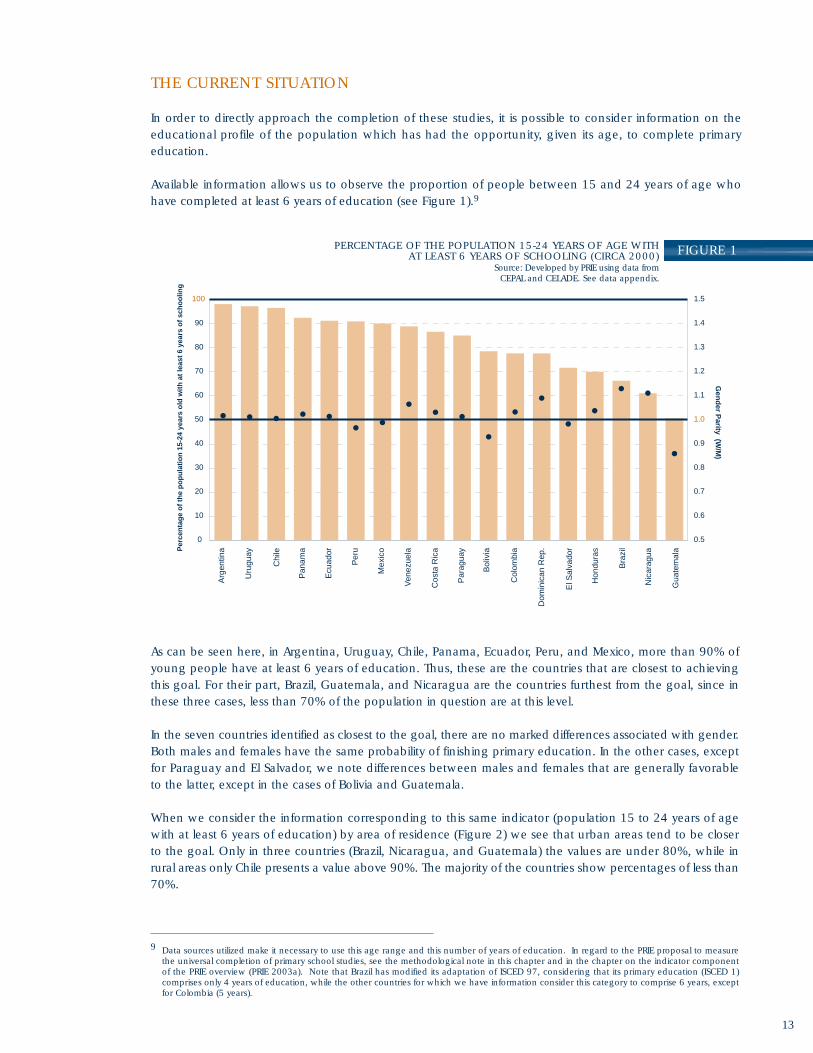
As can be seen here, in Argentina, Uruguay, Chile, Panama, Ecuador, Peru, and Mexico, more than 90% ofyoung people have at least 6 years of education. Thus, these are the countries that are closest to achievingthis goal. For their part, Brazil, Guatemala, and Nicaragua are the countries furthest from the goal, since inthese three cases, less than 70% of the population in question are at this level.
In the seven countries identified as closest to the goal, there are no marked differences associated with gender.Both males and females have the same probability of finishing primary education. In the other cases, exceptfor Paraguay and El Salvador, we note differences between males and females that are generally favorableto the latter, except in the cases of Bolivia and Guatemala.
When we consider the information corresponding to this same indicator (population 15 to 24 years of agewith at least 6 years of education) by area of residence (Figure 2) we see that urban areas tend to be closerto the goal. Only in three countries (Brazil, Nicaragua, and Guatemala) the values are under 80%, while inrural areas only Chile presents a value above 90%. The majority of the countries show percentages of less than70%.
13
FIGURE 1PERCENTAGE OF THE POPULATION 15-24 YEARS OF AGE WITHAT LEAST 6 YEARS OF SCHOOLING (CIRCA 2000)
Source: Developed by PRIE using data fromCEPAL and CELADE. See data appendix.
THE CURRENT SITUATION
In order to directly approach the completion of these studies, it is possible to consider information on theeducational profile of the population which has had the opportunity, given its age, to complete primaryeducation.
Available information allows us to observe the proportion of people between 15 and 24 years of age whohave completed at least 6 years of education (see Figure 1).9
9 Data sources utilized make it necessary to use this age range and this number of years of education. In regard to the PRIE proposal to measurethe universal completion of primary school studies, see the methodological note in this chapter and in the chapter on the indicator componentof the PRIE overview (PRIE 2003a). Note that Brazil has modified its adaptation of ISCED 97, considering that its primary education (ISCED 1)comprises only 4 years of education, while the other countries for which we have information consider this category to comprise 6 years, exceptfor Colombia (5 years).
0
10
20
30
40
50
60
70
80
90
100
Arg
entin
a
Uru
guay
Chi
le
Pan
ama
Ecu
ador
Per
u
Mex
ico
Ven
ezue
la
Cos
ta R
ica
Par
agua
y
Bol
ivia
Col
ombi
a
Dom
inic
an R
ep.
El S
alva
dor
Hon
dura
s
Bra
zil
Nic
arag
ua
Gua
tem
alaP
erce
nta
ge
of
the
po
pu
lati
on
15-
24 y
ears
old
wit
h a
t le
ast
6 ye
ars
of
sch
oo
ling
0.5
0.6
0.7
0.8
0.9
1.0
1.1
1.2
1.3
1.4
1.5
Gen
der P
arity (W/M
)

It is notable that the gap between urban and rural areas is also the most marked among the countries thatare farthest from the goal. In effect, in countries such as Brazil, Nicaragua, and Guatemala, the proportion ofyoung people who have less than 6 years of education in urban areas duplicates that observed in rural areas.
FIGURE 2 PERCENTAGE OF THE POPULATION 15-24 YEARS OF AGE WITH LESS THAN 6YEARS DE SCHOOLING BY RESIDENCE (CIRCA 2000)Source: Developed by PRIE using data fromCEPAL and CELADE. See data appendix.
10 Parity rates used in this report relate the values observed of an indicator for two populations. Thus, if the parity rate is equal to 1, this indicatesthat both values are equal. Differences in regard to value indicate that the indicator is greater for one of the populations. In the case of genderparity, the value of the indicator for the female population is the numerator. Therefore, if the parity rate is larger than 1, this indicates that theindicator has an observed value greater in the case of females; if it is lower than 1, it indicates the contrary.
Source: Developed by PRIE using data fromCEPAL and CELADE. See data appendix.
FIGURE 3 RURAL/URBAN PARITY10 BY GENDER FOR THE POPULATION 15-24 YEARSOF AGE WITH AT LEAST 6 YEARS OF SCHOOLING (CIRCA 2000)
14
0
10
20
30
40
50
60
70
80
90
100C
hile
Pan
ama
Ecu
ador
Per
u
Mex
ico
Cos
ta R
ica
Par
agua
y
Bol
ivia
Col
ombi
a
Dom
inic
an R
ep.
El S
alva
dor
Hon
dura
s
Bra
zil
Nic
arag
ua
Gua
tem
ala
Per
cen
tag
e o
f th
e p
op
ula
tio
n 1
5-24
yea
rs o
ld w
ith
at
leas
t 6
year
s o
f sc
ho
olin
g
0
0.1
0.2
0.3
0.4
0.5
0.6
0.7
0.8
0.9
1
Ru
ral/Urb
an P
arity
Urban Rural Rural/Urban Parity
0.0
0.1
0.2
0.3
0.4
0.5
0.6
0.7
0.8
0.9
1.0
Chi
le
Pan
ama
Ecu
ador
Per
u
Mex
ico
Cos
ta R
ica
Par
agua
y
Bol
ivia
Col
ombi
a
Dom
inic
an R
ep.
El S
alva
dor
Hon
dura
s
Ru
ral/U
rban
par
ity
for
the
po
pu
lati
on
15-
24 y
ears
old
wit
h a
t le
ast
6 ye
ars
of
sch
oo
ling
Men Women
Bra
zil
Nic
arag
ua
Gua
tem
ala
Also notable is the inexistence of a pattern associated with gender when we observe the differences betweenurban and rural areas (Figure 3). In effect, countries such as Chile, Mexico, Costa Rica, El Salvador, and Hondurasshow that the differences associated with gender and with residence do not mutually reinforce each other.For their part, in Peru, Bolivia, and Guatemala, the adverse conditions associated with rural residence have agreater impact on females than on males in terms of level of schooling achieved. In Panama, Paraguay,Colombia, the Dominican Republic, Brazil, and Nicaragua, education disparities in rural areas are greater inthe case of males.
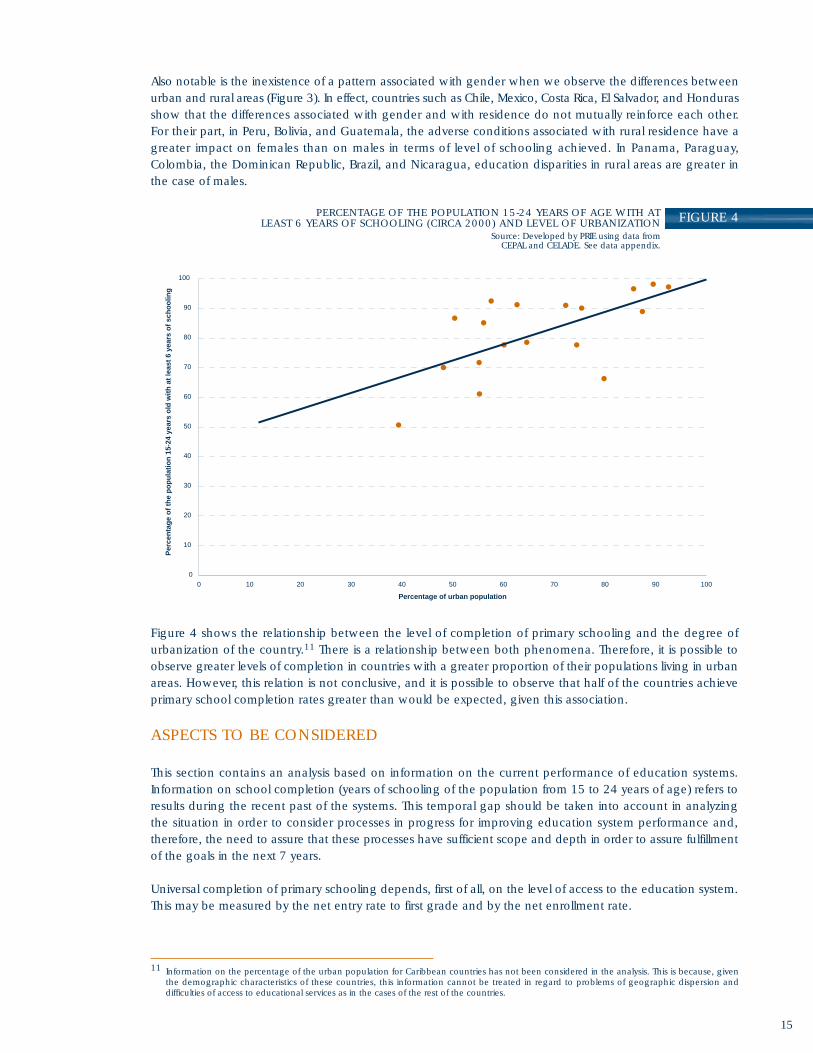
FIGURE 4PERCENTAGE OF THE POPULATION 15-24 YEARS OF AGE WITH ATLEAST 6 YEARS OF SCHOOLING (CIRCA 2000) AND LEVEL OF URBANIZATION
Source: Developed by PRIE using data fromCEPAL and CELADE. See data appendix.
Figure 4 shows the relationship between the level of completion of primary schooling and the degree ofurbanization of the country.11 There is a relationship between both phenomena. Therefore, it is possible toobserve greater levels of completion in countries with a greater proportion of their populations living in urbanareas. However, this relation is not conclusive, and it is possible to observe that half of the countries achieveprimary school completion rates greater than would be expected, given this association.
ASPECTS TO BE CONSIDERED
This section contains an analysis based on information on the current performance of education systems.Information on school completion (years of schooling of the population from 15 to 24 years of age) refers toresults during the recent past of the systems. This temporal gap should be taken into account in analyzingthe situation in order to consider processes in progress for improving education system performance and,therefore, the need to assure that these processes have sufficient scope and depth in order to assure fulfillmentof the goals in the next 7 years.
Universal completion of primary schooling depends, first of all, on the level of access to the education system.This may be measured by the net entry rate to first grade and by the net enrollment rate.
15
11 Information on the percentage of the urban population for Caribbean countries has not been considered in the analysis. This is because, giventhe demographic characteristics of these countries, this information cannot be treated in regard to problems of geographic dispersion anddifficulties of access to educational services as in the cases of the rest of the countries.
0
10
20
30
40
50
60
70
80
90
100
0 10 20 30 40 50 60 70 80 90 100
Percentage of urban population
Per
cen
tag
e o
f th
e p
op
ula
tio
n 1
5-24
yea
rs o
ld w
ith
at
leas
t 6
year
s o
f sc
ho
olin
g
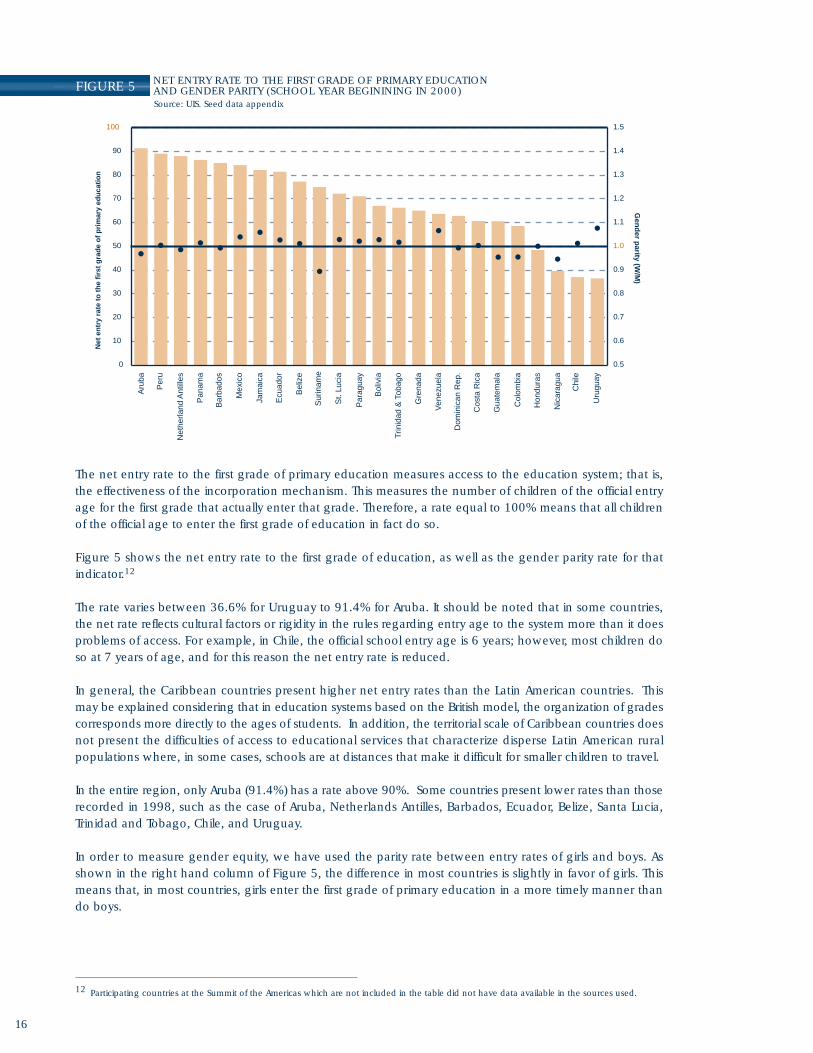
FIGURE 5 NET ENTRY RATE TO THE FIRST GRADE OF PRIMARY EDUCATIONAND GENDER PARITY (SCHOOL YEAR BEGININING IN 2000)Source: UIS. Seed data appendix
0
10
20
30
40
50
60
70
80
90
100
Aru
ba
Per
u
Net
herla
nd A
ntill
es
Pan
ama
Bar
bado
s
Mex
ico
Jam
aica
Ecu
ador
Bel
ize
Sur
inam
e
St.
Luci
a
Par
agua
y
Bol
ivia
Trin
idad
& T
obag
o
Gre
nada
Ven
ezue
la
Dom
inic
an R
ep.
Cos
ta R
ica
Gua
tem
ala
Col
ombi
a
Hon
dura
s
Nic
arag
ua
Chi
le
Uru
guay
Net
en
try
rate
to
th
e fi
rst
gra
de
of
pri
mar
y ed
uca
tio
n
0.5
0.6
0.7
0.8
0.9
1.0
1.1
1.2
1.3
1.4
1.5
Gen
der p
arity (W/M
)
The net entry rate to the first grade of primary education measures access to the education system; that is,the effectiveness of the incorporation mechanism. This measures the number of children of the official entryage for the first grade that actually enter that grade. Therefore, a rate equal to 100% means that all childrenof the official age to enter the first grade of education in fact do so.
Figure 5 shows the net entry rate to the first grade of education, as well as the gender parity rate for thatindicator.12
The rate varies between 36.6% for Uruguay to 91.4% for Aruba. It should be noted that in some countries,the net rate reflects cultural factors or rigidity in the rules regarding entry age to the system more than it doesproblems of access. For example, in Chile, the official school entry age is 6 years; however, most children doso at 7 years of age, and for this reason the net entry rate is reduced.
In general, the Caribbean countries present higher net entry rates than the Latin American countries. Thismay be explained considering that in education systems based on the British model, the organization of gradescorresponds more directly to the ages of students. In addition, the territorial scale of Caribbean countries doesnot present the difficulties of access to educational services that characterize disperse Latin American ruralpopulations where, in some cases, schools are at distances that make it difficult for smaller children to travel.
In the entire region, only Aruba (91.4%) has a rate above 90%. Some countries present lower rates than thoserecorded in 1998, such as the case of Aruba, Netherlands Antilles, Barbados, Ecuador, Belize, Santa Lucia,Trinidad and Tobago, Chile, and Uruguay.
In order to measure gender equity, we have used the parity rate between entry rates of girls and boys. Asshown in the right hand column of Figure 5, the difference in most countries is slightly in favor of girls. Thismeans that, in most countries, girls enter the first grade of primary education in a more timely manner thando boys.
16
12 Participating countries at the Summit of the Americas which are not included in the table did not have data available in the sources used.

FIGURE 6NET ENROLLMENT RATE IN PRIMARY EDUCATION AND GENDER PARITY(SCHOOL YEAR BEGINNING IN 2000)
Source: UIS. See data appendix.
0
10
20
30
40
50
60
70
80
90
100
Pan
ama
Per
u
Can
ada
St.
Luci
a
Bar
bado
s
Arg
entin
a
Mex
ico
Ecu
ador
Sur
inam
e
Bel
ize
Aru
ba
Bol
ivia
Bra
zil
US
A
Jam
aica
Dom
inic
an R
ep.
Trin
idad
& T
obag
o
Par
agua
y
Net
herla
nd a
ntill
es
Cos
ta R
ica
Uru
guay
Chi
le
Col
ombi
a
Ven
ezue
la
Hon
dura
s
Gua
tem
ala
Gre
nada
Nic
arag
ua
Net
en
rollm
ent
rate
in p
rim
ary
edu
cati
on
0.5
0.6
0.7
0.8
0.9
1.0
1.1
1.2
1.3
1.4
1.5
Gen
der p
arity (W/M
)
The net enrollment rate in primary education indicates the degree of coverage13 at this level. This relates thenumber of children enrolled in the range of official ages with the population of the same age. This is used asan indicator of universal access to primary education, since a net rate of 100% means that all children of theofficial age to be in the primary level are enrolled in this level. However, they may not be studying in the gradethat corresponds to their ages, given that the problem of age-grade gap is particularly relevant in the region.
Although the primary school level is that in which countries have invested the most effort and which, ingeneral, presents enrollment rates above 90%, in most countries in the region not all children of the age tobe in primary school are enrolled.
Panama, Peru, Canada, Santa Lucia, Barbados, Argentina, Mexico, Ecuador, Surinam, Belize, Aruba, Bolivia,and Brazil show net enrollment rates of above 90%.14 On the other hand, Nicaragua has nearly 10% of itschildren of the age to be in primary school not enrolled in schools at this level.
If we compare this information with that recorded for the 1998 school year, we see that countries haveimproved access to primary education. However, Argentina, Mexico, Belize, Aruba, Bolivia, Trinidad and Tobago,Netherlands Antilles, and Granada present indicators with values less than those recorded for that year.Furthermore, Nicaragua shows a slight improvement compared to 1998, a year in which it was above onlyGuatemala which, for its part, has increased the value of this indicator by nearly 8%.
From the perspective of gender equity, just as in the case for net entry rates to the first grade, enrollment inprimary school is quite equal in most countries in the region.
13 In order to measure coverage or the service that an education system provides to a given population, it is possible to estimate three indicators:first, the total number of people of a given population that is served by the system, without considering the grade or level of education of theindividuals. This is an indicator of total coverage and is currently used under the name “specific schooling rate by age”. Second, it is possibleto calculate the fraction of a given population that is served at an education level that corresponds to its age level. This indicator measurescoverage at level, and is currently used under the name “net enrollment rate in education level X”. Finally, it is possible to measure coverageprovided to a population in the grade that corresponds to age, or timely coverage. In this regard, see the chapter on indicators in the PRIEoverview (PRIE 2003a).
14 Note that inconsistencies between enrollment rates of the population affect the calculation of this indicator. Thus, it is possible to see in somecases values above the limit of 100%.
17

0
10
20
30
40
50
60
70
80
90
100
Chi
le
Trin
idad
& T
obag
o
Aru
ba
Pan
ama
Uru
guay
Arg
entin
a
Jam
aica
Mex
ico
Per
u
Dom
inic
a
Bol
ivia
Bel
ize
Cos
ta R
ica
Par
agua
y
Ecu
ador
Col
ombi
a
Gua
tem
ala
Nic
arag
ua
Su
rviv
al r
ate
to t
he
5th
gra
de
of
pri
mar
y ed
uca
tio
n
0.5
0.6
0.7
0.8
0.9
1.0
1.1
1.2
1.3
1.4
1.5
Gen
der p
arity (W/M
)
The survival rate to the 5th grade of primary school indicates the percentage of a cohort of children enrolledin the first grade of primary school in a given school year who manage to reach the 5th grade.15
The purpose of this indicator is to measure the internal efficiency of education systems in terms of their capacityto assure that entrants are able to reach a given academic grade.
If the established goal is that all children finish primary school, it is desirable that the survival rate be near100%, indicating a high level of efficiency of the education system. However, it is important to note that thesurvival rate refers only to the enrolled children. Thus, a survival rate of 100% indicates that all children enrolledin the 1st grade reach the 5th grade, and not necessarily all school-age children in the country. Moreover,reaching the 5th grade does not necessarily imply finishing this grade, and the 5th grade is not necessarilyequivalent to the last grade of primary school.
The rate varies from nearly 100% in Chile, Trinidad and Tobago, and Aruba to 48% in Nicaragua. Moreover,in Latin America, the rates tend to be lower than in Caribbean countries. Keep in mind that national policiesregarding grade repetition have a significant impact on survival rates. Countries in which grade promotion isassociated with age, or is “automatic”, tend to show higher survival rates than those in which grade repetitionis more marked.
It is important to note, however, that the net enrollment rate in primary education only provides us withinformation on access, often hiding inefficiencies in the system.This is because this indicator provides noinformation regarding either permanence in or completion of primary education.
18
FIGURE 7 SURVIVAL RATE TO THE FIFTH GRADE OF PRIMARY EDUCATION AND GENDER PARITY (INTER-ANNUALFLOWS CORRESPONDING SCHOOL YEARS BEGINNING IN 1999 AND 2000)Source: UIS. See data appendix.
15 This indicator is calculated using a reconstructed cohort model. For this reason, it is important to be aware of the assumptions of these models:stability in flow rates (grade promotion, grade repetition, and drop-out); no re-entries and no grade migrations. Although the indicator isconceptually very precise, verification of these assumptions and definitions used for data construction should be taken into account with particularcare when analyzing the data. Although this indicator may also be calculated for any grade, it is useful to use the indicator calculated at thefinal grade of primary education (ISCED 1); however, traditionally it has been calculated and published at the 4th and 5th grades.

From the gender equity perspective, the situation is similar to that of other indicators. Most countries do notpresent a significant gender difference, and when there is a difference, it tends to favor girls (as in the caseof Costa Rica, Paraguay, Colombia, Guatemala, and Nicaragua). The indicator is only favorable for boys inUruguay.
However, the existence of individual indicators that are “more favorable” to boys or girls should not necessarilybe interpreted as one of these being “better” than the other. Thus, as was noted in Educational Panoramaof the Americas (p. 52), the existence of indicators more favorable, for example, to girls, may co-exist withother more complex problems that hinder a definitive judgment. In fact, lower grade repetition rates for girlsmay mean that those girls who do not pass a grade have a higher probability to drop out than to repeat incomparison with boys in the same situation. That is, the girls who do not pass a grade may have lowerprobabilities of continuing their studies than boys who do not pass a grade.16
In effect, there has been much discussion about the relation between levels of education of the adult populationand the levels of wealth of countries. Thus, and as we will see later, from an economic perspective it is saidthat higher levels of education are associated with greater productivity which, therefore, may lead to greatereconomic growth.
The following figures show the relationship between access to and completion of primary education and GDPper capita (expressed in PPA17 United States dollars)
0
10
20
30
40
50
60
70
80
90
100
0 5,000 10,000 15,000 20,000 25,000 30,000 35,000
GDP per capita (dollars PPP)
Net
en
rollm
ent
rate
in p
rim
ary
edu
cati
on
19
FIGURE 8GROSS DOMESTIC PRODUCT PER CAPITA (2000, IN PPP DOLLARS) ANDENROLLMENT RATES IN PRIMARY EDUCATION (ACADEMIC YEAR 2000)
Source: UIS. and UNDP. See data appendix.
16 A more complete analysis of these interrelations between variables and their impact on gender equity may be consulted, for the Peruvian case,in ““Brechas de género en la educación peruana actual” in Guadalupe et. al (2001), La educación peruana a inicios del nuevo siglo. Ministryof Education, working document 12, MECEP. Available at http://www.minedu.gob.pe
17 PPP = purchasing power parity. This is a conversion factor that makes it possible to adjust nominal values according to the real purchasing powerof $USD in the local market. In this sense, it provides better comparisons between countries. The GDP per capita values in PPP dollars are takenfrom UNDP (2002) Human Development Report. See data appendix.

As can be noted, there is no relationship in the region between GDP per capita and the levels of access toprimary education. This clearly indicates that even countries with greater economic restrictions or relativelyless wealth have been able to advance significantly in guaranteeing access to primary education. Thus, greaterlevels of national wealth are not, in our hemisphere, a condition for assuring access to this level of education.
Although access to primary education is not associated with the average level of wealth of a country, thecompletion of such studies does show a relation, although it is not a strong one.
Access to the primary level, expressed in net entry rates to the first grade and in enrollments in primaryeducation, is not associated with urbanization levels. This indicates that the supply of primary education servicespenetrates rural areas as well.
However, this relation begins to gain importance when we look at both the progress levels in the system(through grade survival rates) and the completion of studies at a given level (as shown in Figure 4).
20
0
10
20
30
40
50
60
70
80
90
100
0 1,000 2,000 3,000 4,000 5,000 6,000 7,000 8,000 9,000 10,000 11,000
GDP per capita (dollars PPP)
Per
cen
tag
e o
f th
e p
op
ula
tio
n 1
5-24
yea
rs o
ld w
ith
at
leas
t 6
year
s o
f sc
ho
olin
gFIGURE 9 GROSS DOMESTIC PRODUCT PER CAPITA (2000, IN PPP DOLLARS) AND POPULATION 15-24 YEARS
OF AGE WITH LESS THAN 6 YEARS OF EDUCATION (CIRCA 2000)Source: CEPAL, CELADE and PNUD. see data appendix.
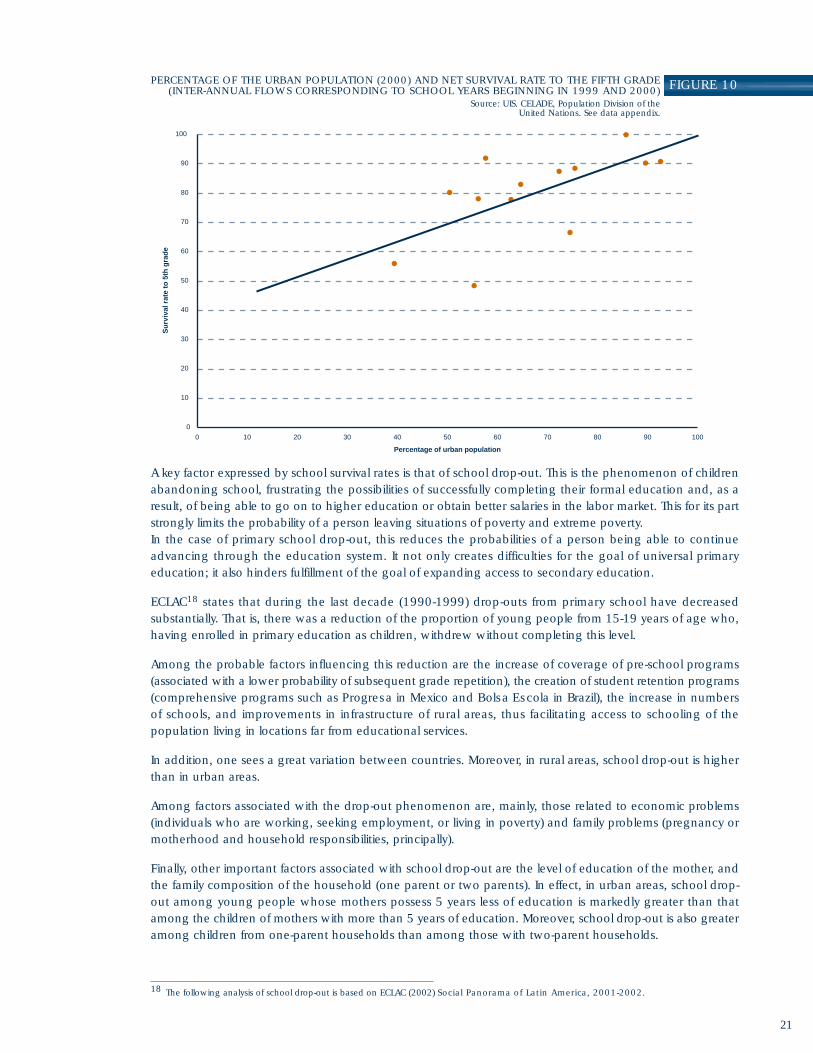
A key factor expressed by school survival rates is that of school drop-out. This is the phenomenon of childrenabandoning school, frustrating the possibilities of successfully completing their formal education and, as aresult, of being able to go on to higher education or obtain better salaries in the labor market. This for its partstrongly limits the probability of a person leaving situations of poverty and extreme poverty.In the case of primary school drop-out, this reduces the probabilities of a person being able to continueadvancing through the education system. It not only creates difficulties for the goal of universal primaryeducation; it also hinders fulfillment of the goal of expanding access to secondary education.
ECLAC18 states that during the last decade (1990-1999) drop-outs from primary school have decreasedsubstantially. That is, there was a reduction of the proportion of young people from 15-19 years of age who,having enrolled in primary education as children, withdrew without completing this level.
Among the probable factors influencing this reduction are the increase of coverage of pre-school programs(associated with a lower probability of subsequent grade repetition), the creation of student retention programs(comprehensive programs such as Progresa in Mexico and Bolsa Escola in Brazil), the increase in numbersof schools, and improvements in infrastructure of rural areas, thus facilitating access to schooling of thepopulation living in locations far from educational services.
In addition, one sees a great variation between countries. Moreover, in rural areas, school drop-out is higherthan in urban areas.
Among factors associated with the drop-out phenomenon are, mainly, those related to economic problems(individuals who are working, seeking employment, or living in poverty) and family problems (pregnancy ormotherhood and household responsibilities, principally).
Finally, other important factors associated with school drop-out are the level of education of the mother, andthe family composition of the household (one parent or two parents). In effect, in urban areas, school drop-out among young people whose mothers possess 5 years less of education is markedly greater than thatamong the children of mothers with more than 5 years of education. Moreover, school drop-out is also greateramong children from one-parent households than among those with two-parent households.
21
18 The following analysis of school drop-out is based on ECLAC (2002) Social Panorama of Latin America, 2001-2002.
0
10
20
30
40
50
60
70
80
90
100
0 10 20 30 40 50 60 70 80 90 100
Percentage of urban population
Su
rviv
al r
ate
to 5
th g
rad
e
FIGURE 10PERCENTAGE OF THE URBAN POPULATION (2000) AND NET SURVIVAL RATE TO THE FIFTH GRADE(INTER-ANNUAL FLOWS CORRESPONDING TO SCHOOL YEARS BEGINNING IN 1999 AND 2000)
Source: UIS. CELADE, Population Division of theUnited Nations. See data appendix.

THE QUALITY OF PRIMARY EDUCATION
Although high levels of access to primary education have been achieved for the entire population, this increasehas not always been accompanied by equivalent increases in quality.
Available evidence19 shows that the levels of academic achievement of students are strongly correlated withtheir social and economic conditions, and that although schools can play an important role in countering theimpact of pre-existing social conditions on student learning, this is not the norm.
In effect, the results of LLECE studies show that the performance of children living in urban areas varies betweencountries, and that there are marked differences between their achievement levels. Figure 11 shows thepercentages of students in each performance level of the language exam for urban areas. We can see thatin the region, nearly 10% of children who live in urban areas do not achieve level I and, therefore, are notable to carry out the most basic tasks. This situation varies by country. In effect, in urban areas, in Argentina,Brazil, Chile, and Cuba, there are practically no children below level I (4%,5%,5%, and 0%, respectively); whilein the Dominican Republic, nearly 30% of children are below that level. Moreover, nearly 60% of children arebelow level II; that is, they are only able to carry out basic language tasks.
The countries with the smallest percentages of children below level I (Argentina, Brazil, Chile, and Cuba) arealso those that have the largest number of children at the highest level; that is, they have a larger percentageof children who are able to carry out complex reading tasks. In these countries, around 6 of every 10 childrenare at level III, while in the rest of the countries this varies between 2 and 4 children out of 10. Cuba is anexception in the region, since practically all children (9 out of 10) are in level III – meaning that almost allchildren are able to carry out more complex tasks.
22
13 14 13 11 1211 10
9
54 5
29 32 29 29 29 28 25 23 2713 17 16
1926 23 23 24 22 21 23 19 24 20 19
6
25
29 34 35 36 38 43 4445
5859 60
92
27
0
Dom
inic
an R
ep.
Hon
dura
s
Per
u
Bol
ivia
Col
ombi
a
Ven
ezue
la
Mex
ico
Par
agua
y
LA
Bra
zil
Arg
entin
a
Chi
le
Cub
a
Below level I Level I Level II Level III
2
FIGURE 11 DISTRIBUTION OF STUDENTS BY PERFORMANCE LEVEL, URBANAREAS, LANGUAGE (1997)Source: Developed by PRIE based on information from LLECE,Technical report (2001). See data appendix.
19 In the above-cited reports of the First International Comparative Study carried out by the LLECE, Information on achievement levels may be foundin UNESCO (2001) Latin American Laboratory for Assessment of the Quality of Education. Technical Report.
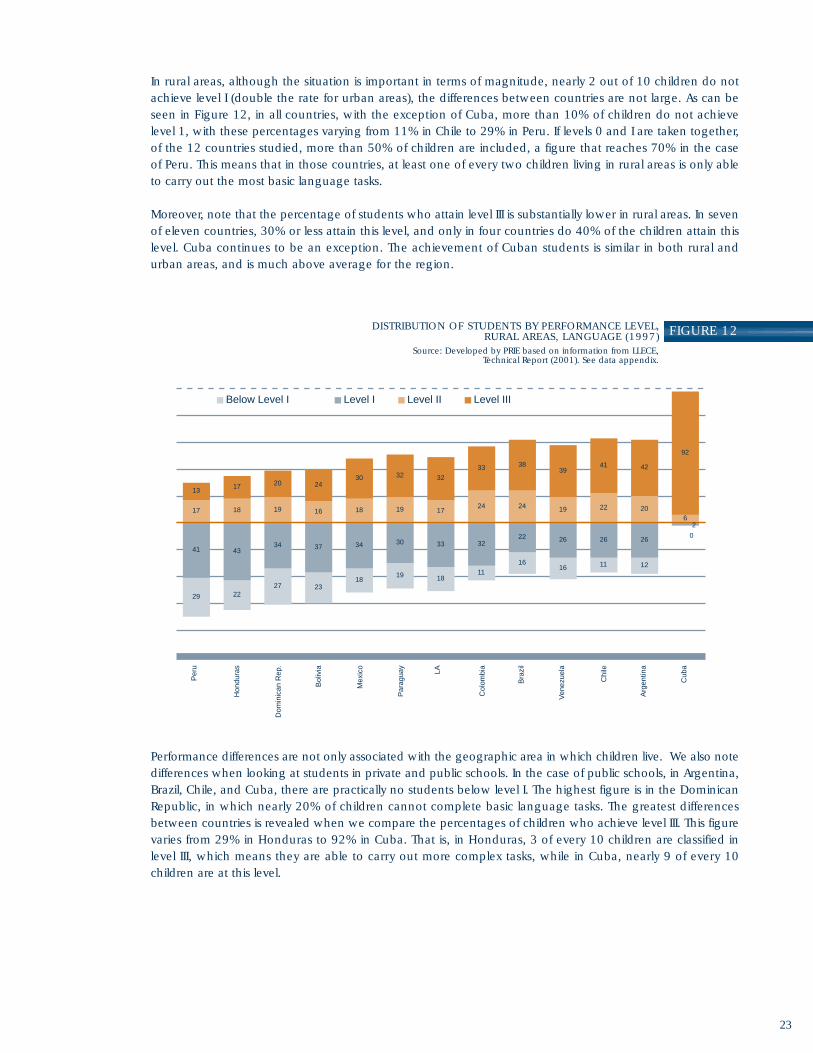
In rural areas, although the situation is important in terms of magnitude, nearly 2 out of 10 children do notachieve level I (double the rate for urban areas), the differences between countries are not large. As can beseen in Figure 12, in all countries, with the exception of Cuba, more than 10% of children do not achievelevel 1, with these percentages varying from 11% in Chile to 29% in Peru. If levels 0 and I are taken together,of the 12 countries studied, more than 50% of children are included, a figure that reaches 70% in the caseof Peru. This means that in those countries, at least one of every two children living in rural areas is only ableto carry out the most basic language tasks.
Moreover, note that the percentage of students who attain level III is substantially lower in rural areas. In sevenof eleven countries, 30% or less attain this level, and only in four countries do 40% of the children attain thislevel. Cuba continues to be an exception. The achievement of Cuban students is similar in both rural andurban areas, and is much above average for the region.
Performance differences are not only associated with the geographic area in which children live. We also notedifferences when looking at students in private and public schools. In the case of public schools, in Argentina,Brazil, Chile, and Cuba, there are practically no students below level I. The highest figure is in the DominicanRepublic, in which nearly 20% of children cannot complete basic language tasks. The greatest differencesbetween countries is revealed when we compare the percentages of children who achieve level III. This figurevaries from 29% in Honduras to 92% in Cuba. That is, in Honduras, 3 of every 10 children are classified inlevel III, which means they are able to carry out more complex tasks, while in Cuba, nearly 9 of every 10children are at this level.
23
29 2227 23
1819 18
11
1616 11 12
41 4334 37 34 30 33 32
22 26 26 26
17 18 19 16 18 19 1724 24 19 22 20
6
1317 20 24
30 32 32
33 3839
41 42
92
0
Per
u
Hon
dura
s
Dom
inic
an R
ep.
Bol
ivia
Mex
ico
Par
agua
y
LA
Col
ombi
a
Bra
zil
Ven
ezue
la
Chi
le
Arg
entin
a
Cub
a
Below Level I Level I Level II Level III
2
FIGURE 12DISTRIBUTION OF STUDENTS BY PERFORMANCE LEVEL,RURAL AREAS, LANGUAGE (1997)
Source: Developed by PRIE based on information from LLECE,Technical Report (2001). See data appendix.

In the case of private schools, in all countries, except the Dominican Republic, less than 10% of children areat level I, and in all countries, more than 40% of children are at level III. This figure reaches 78% in the caseof Argentina. This means that in private schools, many more children are at a higher performance level thanthose in public schools.
24
13 14 13 23 11 12 11 1210
7
55
32 31 3225 30 28 31 29 25 22
15 18
26 26 25 22 24 23 20 21 20 22 2620
6
29 29 3030
35 37 38 38 4549
5457
92
0
Hon
dura
s
Per
u
Bol
ivia
Dom
inic
an R
ep.
Col
ombi
a
Par
agua
y
Mex
ico
Ven
ezue
la
LA
Chi
le
Bra
zil
Arg
entin
a
Cub
a
Below Level I Level I Level II Level III
2
176 9 9
7 66
34 3
2 119 21 21 21 18 16 19 16 12 11 6
2229 24 21 21 24 20 25
19 19 2115
42
4446 49 54
5455
56 65 6772
78
Dom
inic
an R
ep.
Hon
dura
s
Bol
ivia
Ven
ezue
la
Par
agua
y
Per
u
LA
Col
ombi
a
Mex
ico
Chi
le
Bra
zil
Arg
entin
a
Below Level I Level I Level II Level III
5
FIGURE 13 DISTRIBUTION OF STUDENTS BY PERFORMANCE LEVEL,PUBLIC SCHHOLS, LANGUAGE (1997)Source: Developed by PRIE based on information from LLECE,Technical Report (2001). See data appendix.
FIGURE 14 DISTRIBUTION OF STUDENTS BY PERFORMANCE LEVELS,PRIVATE SCHOOLS, LANGUAGE (1997)Source: Developed by PRIE based on information from LLECE,Technical Report (2001). See data appendix.
Although the results show differences between the performance of students in public and in private schools,the analysis of associated factors shows that, after controlling the results by socioeconomic status of students,these differences disappear. That is, the differences in scores are due principally to the fact that a greaterproportion of students from low socioeconomic status attend public schools, and a greater proportion ofstudents from high socioeconomic status attend private schools. Thus, the differences in student performancebetween kinds of school are explained in part by the social and economic characteristics of the studentsattending these schools.
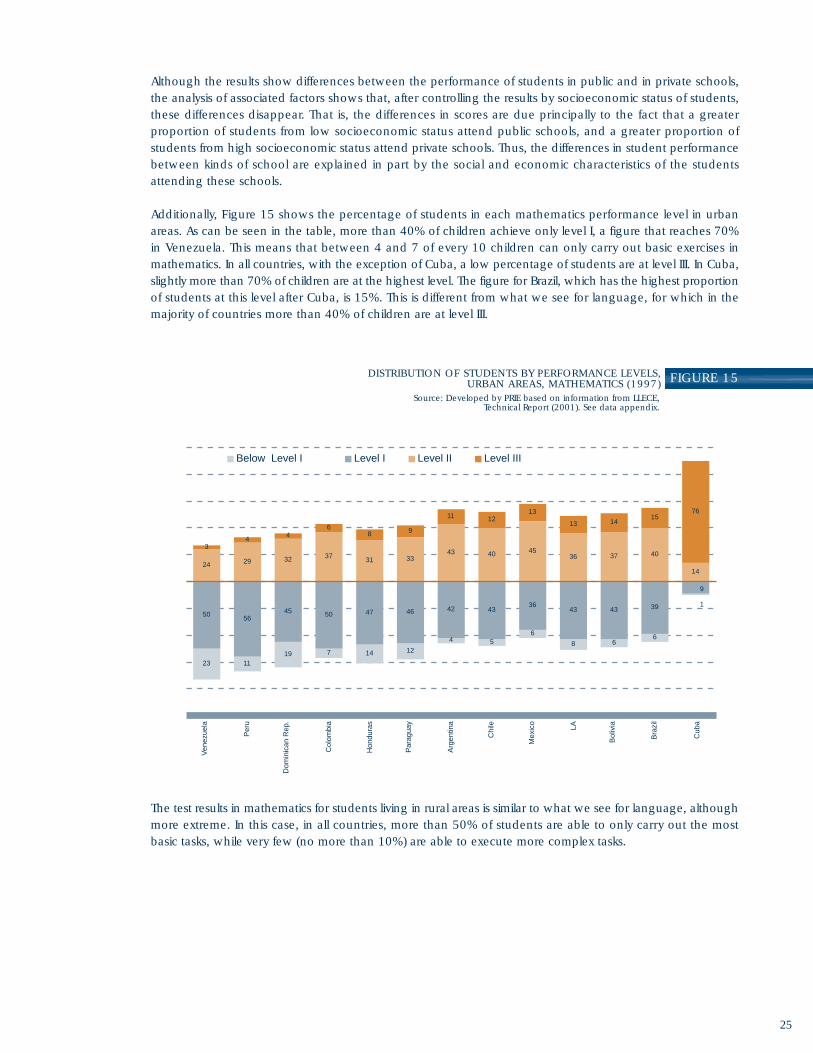
Additionally, Figure 15 shows the percentage of students in each mathematics performance level in urbanareas. As can be seen in the table, more than 40% of children achieve only level I, a figure that reaches 70%in Venezuela. This means that between 4 and 7 of every 10 children can only carry out basic exercises inmathematics. In all countries, with the exception of Cuba, a low percentage of students are at level III. In Cuba,slightly more than 70% of children are at the highest level. The figure for Brazil, which has the highest proportionof students at this level after Cuba, is 15%. This is different from what we see for language, for which in themajority of countries more than 40% of children are at level III.
The test results in mathematics for students living in rural areas is similar to what we see for language, althoughmore extreme. In this case, in all countries, more than 50% of students are able to only carry out the mostbasic tasks, while very few (no more than 10%) are able to execute more complex tasks.
25
23 1119 7 14 12
4 56
8 66
5056
45 50 47 46 42 4336
43 43 39
24 29 32 3731 33
43 40 4536 37 40
14
34
46
8 9
11 1213
13 1415
76
1
9
Ven
ezue
la
Per
u
Dom
inic
an R
ep.
Col
ombi
a
Hon
dura
s
Par
agua
y
Arg
entin
a
Chi
le
Mex
ico
LA
Bol
ivia
Bra
zil
Cub
a
Below Level I Level I Level II Level III
FIGURE 15DISTRIBUTION OF STUDENTS BY PERFORMANCE LEVELS,URBAN AREAS, MATHEMATICS (1997)
Source: Developed by PRIE based on information from LLECE,Technical Report (2001). See data appendix.
METHODOLOGICAL NOTE
This note describes the way in which this report has approached measurement of the goal regarding thecompletion of quality primary education studies. It treats the information and indicators selected, explains thereasons for their selection, and details the scope of the information used.
On the measurement of universal completion of primary education:As of this time, there is no general agreement regarding the best indicator for directly measuring universalcompletion of a given level of study.20 This situation follows from both the fact that traditionally-producedinformation on education has focused more on measuring enrollments or the internal efficiency of educationsystems than on aspects of coverage. The latter necessarily involve tying demographic information into thaton enrollments,21 and the complex methodological difficulty of measuring the completion of studies of apopulation that has not, due to its age, completed those studies.
Currently, we have indicators for access to and for performance within the system. The former measuresfractions of the population who access educational services. Thus, we have net entrance rates and netenrollment rates. Net entrance rates measure the proportion of individuals of the official age to enter the firstgrade of primary education and who effectively do so. Net enrollment rates measure the proportion ofindividuals within the officially-defined age range to study in primary school who are actually enrolled at thislevel. In both cases, one does not consider the population that may enter the system late, or study at a givenlevel while being above the official age to do so.22
Indicators of progress through the school system are usually hypothetical rather than empirical, since timeseries studies are not available. Therefore, those who effectively entered at a given time, would pass throughthe education system. That is, it does not consider information about the population that is outside the system.Nor is this remedied using access information, given the nature of such data.
PRIE has therefore proposed and adopted a way to measure education levels concluded that is based uponinformation on the population as a whole.23 In effect, it is possible to measure within the population which,given its age, has had the opportunity to conclude its studies, the proportion that has effectively been ableto conclude primary school studies.
Thus, if we observe information corresponding to the number of years of schooling achieved by the population15-19 years of age, we have a direct measure of completion of primary education as long as we know thenumber of years that correspond to the theoretical duration of this level.
In order to assure comparability between countries, it is necessary that this information be expressed in termsof the duration of primary schooling, standardized through the use of the International Standardized EducationClassification (ISCED 1997).
26
20 For a critical review of the current debate, see Guadelupe, C., and Louzano, P. (2003) Measuring Universal Primary Completion in LatinAmerica. Available at http://www.unesco.cl/siri
21 Current gross enrollment rates use population information in order to establish a relative scale for measurement of enrollments. In this sense,there is no need for correspondence between populations to which the numerators and denominators refer. Net enrollment rates, for their part,do establish this relation, but in an insufficient manner for the requirement here, as explained below.
22 In addition, there are gross, or apparent entrance and enrollment rates. Both are measures of population size - of the entering population, inthe first case, and of the enrolled population in the second, since they use as numerators the total number of people who fulfill the condition(entrants or enrollees, respectively),and as denominator a reference population of which the numerator is not, necessarily, a sub-set.
23 This proposal may be found in the PRIE overview (2003a), and was discussed at a technical meeting of the project in December, 2002. Theunderlying basis of the proposal may be found in Guadelupe, C. (2002) Cobertura, eficiencia y flujo escolar. Available at http://www.unesco.cl/siri. A similar proposal that also introduces historical trends as a mechanism for projecting the probabilities of children concluding their schoolingwas presented at the Regional Workshop on Education Statistics for Latin America of the Institute of Statistics of UNESCO (Quito, April, 2003),which received the support of all participating countries. Details of this proposal may be found in Guadelupe, C., and Louzano, P. (2003)Measuring Universal Completion in Latin America, which is available at http://www.unesco.cl/siri.

Unfortunately, the information currently available (CEPAL, Social Panorama of Latin America) is organized byyears of study attained, and not by ISCED levels. Also, it corresponds to the 15-24 age group, and not to theage range used by PRIE (15-19 years). In spite of these limitations, PRIE feels that this is the best informationavailable to directly measure, although approximately, completion of primary school studies.
Information on net enrollment rates and survival rates to the 5th grade of primary school used in this reportis intended to show the current dynamic of access into and progress through education systems.
On the measurement of the quality of primary education:The Latin American Laboratory for Assessment of the Quality of Education (LLECE) is a network of nationalsystems of Latin American countries for assessing the quality of education. It was created in 1994, and iscoordinated by UNESCO’s Regional Bureau of Education for Latin America and the Caribbean.
In 1997, the LLECE developed the First International Comparative Study of Achievement in Language,Mathematics, and Associated Factors for Children in the 3rd and 4th Years of Primary Education. This studyfocused on measuring the degree of mastery of certain curricular content in both subjects. In language, itassessed achievement in reading comprehension, meta-linguistic practice, and text production. In mathematicsit covered numeration, operating with natural numbers, common fractions, geometry, and measurement.
A total of 13 Latin American countries participated: Argentina, Bolivia, Brazil, Chile, Colombia, Costa Rica, Cuba,Honduras, Mexico, Paraguay, Peru, the Dominican Republic, and Venezuela.24
Achievement levelsIn order to analyze the results, LLECE established achievement levels, which are comparable to skills analysis,and which make it possible to identify what a student, or a group of students, can and cannot do.
For both the language and the mathematics tests, three achievement levels were established. These levelsare inclusive; i.e., if a student passes the highest level it is because he or has passed lower levels as well.Correct responses to 60% of the questions was established as the criterion for determining if a studentsuccessfully attained a given level. That is, students were required to correctly respond to 60% or more of thequestions of a level in order to classified as having mastered that achievement level.
LanguageLevel I (primary literal reading). This is the most basic and simple reading level, and involves recognizing explicitstructures on the local level: identifying the actors in a story, the key fragments of an argument, and explicitlystated relations.
Level II (literal reading in paraphrases). This level presents a higher degree of complexity of reading anddemands a translation of words, regulated by the literal meaning of the text. The questions ask the studentto describe the text in other words, without necessarily offering a profound interpretation.
Level III (inferential reading). At this level, students are required to fill empty spaces of the text, explainassumptions upon which the text is based, link propositions at the micro and macro-textual levels, and identifydifferent forms of relations implicit in the text. The questions demand relating part of the text based on a partialtheme, and recognizing textual forms.
27
24 The results for Costa Rica were not published “because they were not delivered according to the requirements of timeliness and standardizationestablished by the Laboratory (UNESCO [1998] p.12.] Note that the Republic of Cuba is not included in the rest of this report, given that itsmembership in the Organization of American States has been suspended since 1962. Nevertheless, its information has been considered as animportant part of the results of the first study of the LLECE.

MATHEMATICS
Level I (basic mathematics). Students mastering this level are able to complete habitual exercises that requiresuperficial recognition of mathematical structures. They must master elemental mathematical language andskills linked to reading and writing numbers, recognizing geometrical figures, identifying simple patterns, andcarrying out elemental operations.
Level II (recognizing the use of simple mathematical structures). Students at this level are able to recognizesimple mathematical structures. They can carry out both routine classroom exercises as well as solve simpleproblems that require mastery of the four basic mathematical operations.
Level III (recognition and use of mathematical structures). On this level are those students who are able torecognize complex mathematical structures. They are able to deal with situations that require both usual andmore complex procedures for their resolution, and can solve problems that require recognition of the structureof the decimal system and treat positional values in order to establish equivalencies.
It should be noted that the definition of achievement levels used in this study refers to the minimum curricularestablished by countries. That is, one cannot use the outcomes to make judgments about whether the bestachievement levels observed correspond or not to the needs or challenges of contemporary society. Such ajudgment would require a complementary analysis of the curricular objectives themselves. In effect, theevidence is not sufficient to allow us to state if such curricular objectives are or are not adequate for suchneeds and challenges.
28

DEFINITIONS
The Plan of Action of the Summit of the Americas states the need to not only assure universal completion ofquality primary education, but also to provide significant levels of access to and completion of quality secondaryeducation.
Thus, the second education goal of the Summit of the Americas speaks to an additional concern stemmingfrom the existence of growing evidence that people require levels of schooling that go beyond primaryeducation in order that they may have a greater probability of escaping poverty. This goal responds to evidenceof a positive relationship between higher levels of schooling and economic development, as well as of greaterprosperity.
Studies carried out by ECLAC regarding the transfer of education capital between generations show thatfinishing secondary education and studying for a minimum of 12 years significantly increase the probabilityof a person being able to escape poverty.25
The latest report of the World Education Indicators Project (WEI) showed that the economic returns of educationincrease with each level of education. In countries such as Brazil, Chile, and Paraguay, finishing secondaryschool represents an important increase in perceived income. For example, in Paraguay, a person with a lowersecondary education earns only one-fourth as much as a person who has finished secondary schooling.26
In contrast to the case of primary education, levels of access to this level of education show more variability.Therefore, this goal presents different challenges for the participating countries in the Summit of the Americas.For example, in countries with high levels of geographic dispersion of their populations, the challenge is todevelop operational modalities that make possible the increase of secondary education services. In othercountries, access to secondary education is already a given, and the concern is centered on the quality of sucheducation and the possibility for young people who enter this level to continue in it without dropping out.
These levels of schooling correspond to what is known as secondary education. The term covers refers bothto both the higher or final cycle of “basic education” (lower secondary) and the cycle of greater developmentof specialized learning (higher secondary). As in the case of assessment of the situation in regard to the firstgoal, in order to assure international comparability in substantive terms, we will here use the ISCED terms –in this case, ISCED 97 levels 2 and 3.
Thus, the goal refers to young people entering these levels of education. For the purposes of this report, weunderstand as the reference population that which constitutes the population group between the ages officiallyestablished as corresponding to these levels. Thus, this report will consider as levels of access to the portionof the population of the official age to undertake secondary studies and who are so doing. It should beremembered that, given this definition, those who do not enter secondary education are not necessarilyexcluded from the education system, since they may be undertaking studies corresponding to another level(for example, primary), given the existence of delayed progress in schooling.
29
B. SECOND GOAL:ACCESS TO QUALITY
SECONDARY EDUCATION
25 CEPAL (1997) Panorama Social de América Latina, p. 66.26 UNESCO/OECD (2003) Financing Education: Investments and Returns. Analysis of the World Education Indicators 2002.
At the same time, the goal requires verifying that the levels of completion of secondary studies are growingover time. Therefore, and similarly to the case of primary education, the measurement of completion shouldrefer to the probability of finishing studies on the part of the reference population that, given its age, hashad the opportunity to finish its studies.
Before treating the goal of universal completion of primary education, we presented some thoughts regardingthe complex and multi-dimensional character of the quality of education, emphasizing that this involvespedagogical, social, cultural, and economic questions. We also mentioned the fact that national assessmentsystems of the quality of education have worked in a way that emphasizes academic achievement of studentsin that such an emphasis reflects the central objective of education systems (to develop learning and thus,improved opportunities for people).
The analysis of the quality of secondary education presented in this report will refer to information on the 7countries in the hemisphere which have participated in the Program for International Student Assessment(PISA). This corresponds to the achievement measurements of students 15 years of age who currently studyin some grade of secondary education.
THE CURRENT SITUATION
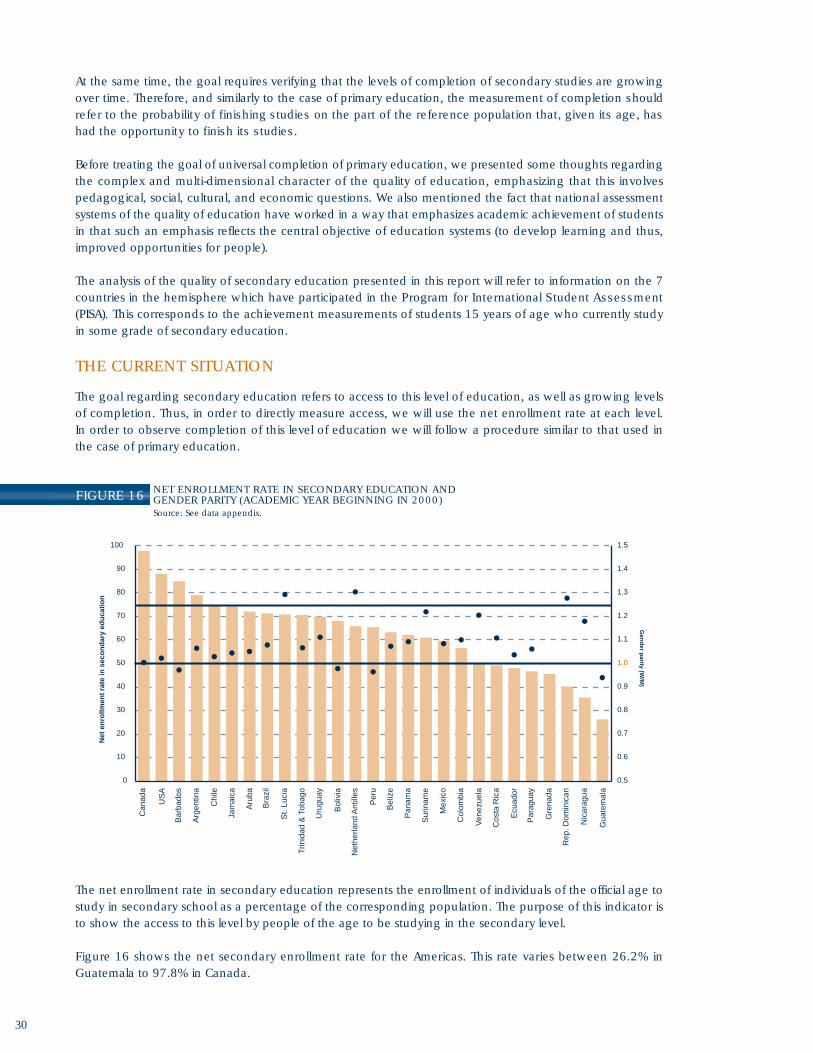
The goal regarding secondary education refers to access to this level of education, as well as growing levelsof completion. Thus, in order to directly measure access, we will use the net enrollment rate at each level.In order to observe completion of this level of education we will follow a procedure similar to that used inthe case of primary education.
0
10
20
30
40
50
60
70
80
90
100
Can
ada
US
A
Bar
bado
s
Arg
entin
a
Chi
le
Jam
aica
Aru
ba
Bra
zil
St.
Luci
a
Trin
idad
& T
obag
o
Uru
guay
Bol
ivia
Net
herla
nd A
ntill
es
Per
u
Bel
ize
Pan
ama
Sur
inam
e
Mex
ico
Col
ombi
a
Ven
ezue
la
Cos
ta R
ica
Ecu
ador
Par
agua
y
Gre
nada
Rep
. Dom
inic
an
Nic
arag
ua
Gua
tem
ala
Net
en
rollm
ent
rate
in s
eco
nd
ary
edu
cati
on
0.5
0.6
0.7
0.8
0.9
1.0
1.1
1.2
1.3
1.4
1.5
Gen
der p
arity (W/M
)
The net enrollment rate in secondary education represents the enrollment of individuals of the official age tostudy in secondary school as a percentage of the corresponding population. The purpose of this indicator isto show the access to this level by people of the age to be studying in the secondary level.
Figure 16 shows the net secondary enrollment rate for the Americas. This rate varies between 26.2% inGuatemala to 97.8% in Canada.
30
FIGURE 16 NET ENROLLMENT RATE IN SECONDARY EDUCATION ANDGENDER PARITY (ACADEMIC YEAR BEGINNING IN 2000)Source: See data appendix.
Canada, the United States, Barbados, and Argentina are the only countries that have achieved the goal of75% access. Chile, Jamaica, Aruba, Brazil, Santa Lucia, and Trinidad & Tobago are very close to this (more than70% access). On the other hand, Costa Rica, Ecuador, Paraguay, Granada, Dominican Republic, Nicaragua,and Guatemala are able to assure access to this level of education to less than half of the population of theage to be at this level.
In general, access levels tend to present differences between men and women in favor of the latter. Thesedifferences are particularly marked in Santa Lucia, Netherlands Antilles, Dominican Republic, Surinam, Venezuela,and Nicaragua. Smaller differences in favor of the male population exist in Guatemala, Peru, Bolivia, andBarbados. Note that in the case of the three Latin American countries, these are countries with large indigenousand rural populations.
Information indicates that there is currently a low level of coverage at this level, accompanied by great differencesin access between countries. This fact has strong implications for the development of the region and thepossible fulfillment of the goal set at the Summit of the Americas.
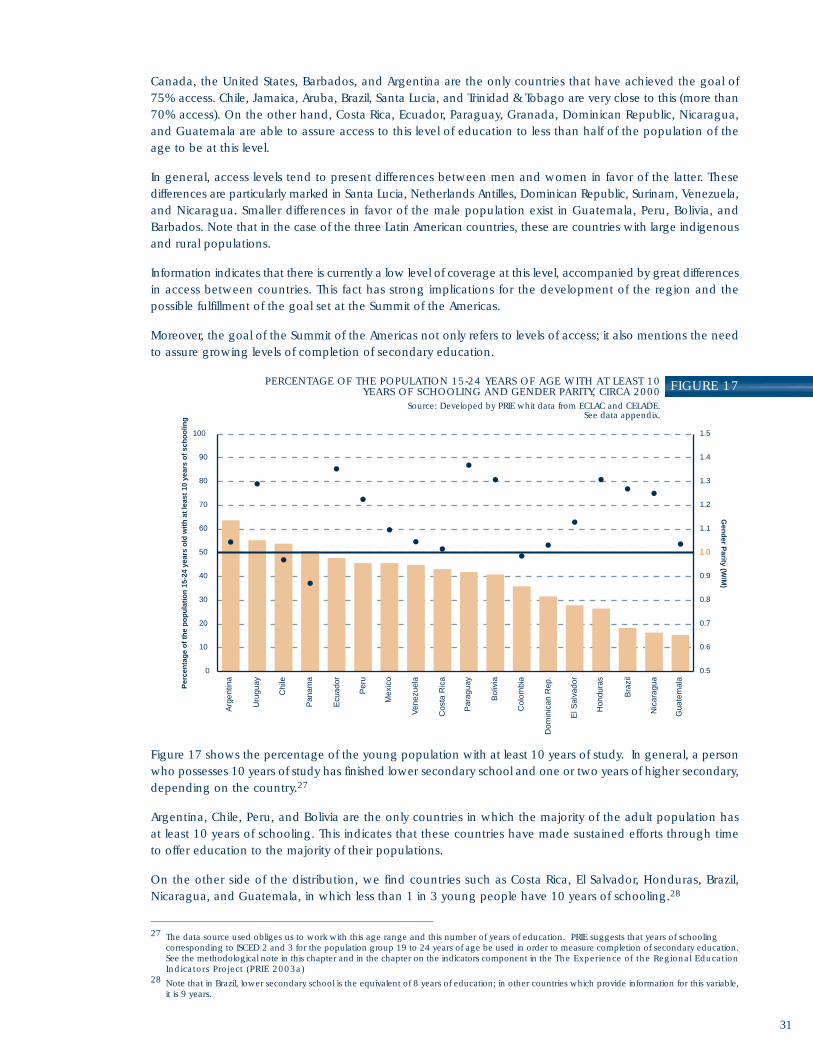
Moreover, the goal of the Summit of the Americas not only refers to levels of access; it also mentions the needto assure growing levels of completion of secondary education.
0
10
20
30
40
50
60
70
80
90
100
Arg
entin
a
Uru
guay
Chi
le
Pan
ama
Ecu
ador
Per
u
Mex
ico
Ven
ezue
la
Cos
ta R
ica
Par
agua
y
Bol
ivia
Col
ombi
a
Dom
inic
an R
ep.
El S
alva
dor
Hon
dura
s
Bra
zil
Nic
arag
ua
Gua
tem
ala
Per
cen
tag
e o
f th
e p
op
ula
tio
n 1
5-24
yea
rs o
ld w
ith
at
leas
t 10
yea
rs o
f sc
ho
olin
g
0.5
0.6
0.7
0.8
0.9
1.0
1.1
1.2
1.3
1.4
1.5
Gen
der P
arity (W/M
)
Figure 17 shows the percentage of the young population with at least 10 years of study. In general, a personwho possesses 10 years of study has finished lower secondary school and one or two years of higher secondary,depending on the country.27
Argentina, Chile, Peru, and Bolivia are the only countries in which the majority of the adult population hasat least 10 years of schooling. This indicates that these countries have made sustained efforts through timeto offer education to the majority of their populations.
On the other side of the distribution, we find countries such as Costa Rica, El Salvador, Honduras, Brazil,Nicaragua, and Guatemala, in which less than 1 in 3 young people have 10 years of schooling.28
31
27 The data source used obliges us to work with this age range and this number of years of education. PRIE suggests that years of schooling corresponding to ISCED 2 and 3 for the population group 19 to 24 years of age be used in order to measure completion of secondary education.See the methodological note in this chapter and in the chapter on the indicators component in the The Experience of the Regional EducationIndicators Project (PRIE 2003a)
28 Note that in Brazil, lower secondary school is the equivalent of 8 years of education; in other countries which provide information for this variable,it is 9 years.
FIGURE 17PERCENTAGE OF THE POPULATION 15-24 YEARS OF AGE WITH AT LEAST 10YEARS OF SCHOOLING AND GENDER PARITY, CIRCA 2000
Source: Developed by PRIE whit data from ECLAC and CELADE.See data appendix.

It is also notable that, with the exception of Peru, Bolivia, and Paraguay, all of the countries considered presentvalues that favor the female population; especially in Uruguay, Venezuela, and the Dominican Republic.
Figure 18 shows the differences between percentages of the population 15-24 years of age with at least 10years of schooling, by area of residence. It is clear that the probability of finishing lower secondary educationis markedly less in rural areas. In Chile, where this disparity is less, the proportion of young people who complete10 years of education is 1.6 times larger in urban areas, while in Guatemala the proportion is 9 times larger.
Also notable is the existence of a pattern associated with gender in regard to differences between urban andrural areas. In effect, in most of the countries observed, the adverse conditions in terms of schooling attainedassociated with rural areas more greatly affect the male population. Exceptions to this are Mexico and Ecuador,where the relation does not hold. In Peru, Bolivia, and Guatemala, the trend is reversed; that is, educationdisparities within rural areas tend to be greater in the case of females.
32
0
10
20
30
40
50
60
70
80
90
100
Chi
le
Pan
ama
Ecu
ador
Per
u
Mex
ico
Cos
ta R
ica
Par
agua
y
Bol
ivia
Col
ombi
a
Dom
inic
an R
ep.
El S
alva
dor
Hon
dura
s
Per
cen
tag
e o
f th
e p
op
ula
tio
n 1
5-24
yea
rs o
ld w
ith
at
leas
t 10
yea
rs o
f sc
ho
olin
g
0.0
0.1
0.2
0.3
0.4
0.5
0.6
0.7
0.8
0.9
1.0
Urban Rural Rural/Urban Parity
Bra
zil
Nic
arag
ua
Gua
tem
ala
Ru
ral/Urb
an P
arity
FIGURE 18 PERCENTAGE OF THE POPULATION 15-24 YEARS OF AGE WITH AT LEAST10 YEARS OF SCHOOLING, BY AREA OF RESIDENCE (CIRCA 2000)Source: Developed by PRIE whit data from ECLAC and CELADE.See data appendix.

0.0
0.1
0.2
0.3
0.4
0.5
0.6
0.7
0.8
0.9
1.0
Ru
ral/U
rban
par
ity
for
the
po
pu
lati
on
15-
24 y
ears
old
wit
h a
tle
ast
10 y
ears
of
sch
oo
ling
Men Women
Compared to what we have seen in the case of primary education, on the secondary level there is a morerobust relationship between progress toward the goals of the Summit and levels of urbanization. Countrieswith higher levels of urbanization show higher levels of access to, and especially, completion of this level ofeducation.
33
Chi
le
Pan
ama
Ecu
ador
Per
u
Mex
ico
Cos
ta R
ica
Par
agua
y
Bol
ivia
Col
ombi
a
Dom
inic
an R
ep.
El S
alva
dor
Hon
dura
s
Bra
zil
Nic
arag
ua
Gua
tem
ala
0
10
20
30
40
50
60
70
80
90
100
0 10 20 30 40 50 60 70 80 90 100
Percentage of urban population
Net
en
rollm
ent
rate
in s
eco
nd
ary
edu
cati
on
FIGURE 19RURAL/URBAN PARITY, DISAGREGGATED BY GENDER FOR THE POPULATION 15-24 YEARSOF AGE WITH AT LEAST 10 YEARS OF SCHOOLING (CIRCA 2000)
Source: Developed by PRIE whit data from ECLAC and CELADE.See data appendix.
FIGURE 20NET ENROLLMENT RATES IN SECONDARY EDUCATION,AND PERCENTAGE OF URBAN POPULATION (2000)
Source: Developed by PRIE whit data ECLACand CELADE. See data appendix.
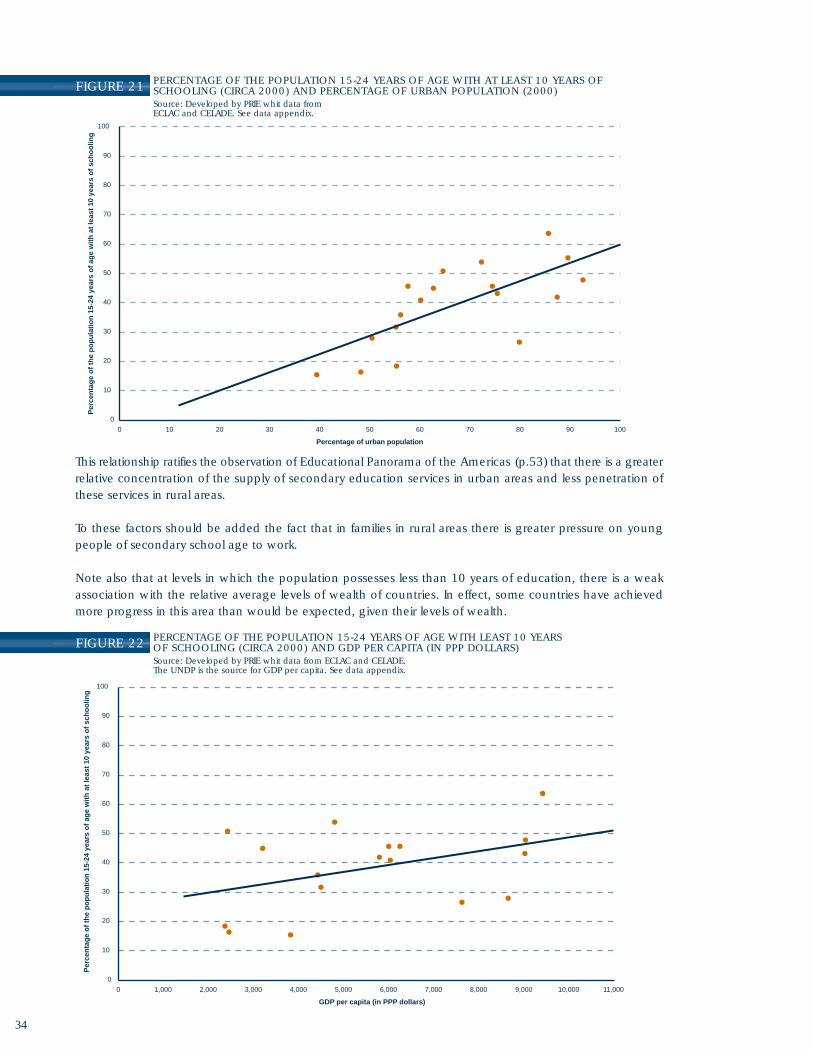
This relationship ratifies the observation of Educational Panorama of the Americas (p.53) that there is a greaterrelative concentration of the supply of secondary education services in urban areas and less penetration ofthese services in rural areas.
To these factors should be added the fact that in families in rural areas there is greater pressure on youngpeople of secondary school age to work.
Note also that at levels in which the population possesses less than 10 years of education, there is a weakassociation with the relative average levels of wealth of countries. In effect, some countries have achievedmore progress in this area than would be expected, given their levels of wealth.
34
0
10
20
30
40
50
60
70
80
90
100
0 10 20 30 40 50 60 70 80 90 100
Percentage of urban population
Per
cen
tag
e o
f th
e p
op
ula
tio
n 1
5-24
yea
rs o
f ag
e w
ith
at
leas
t 10
yea
rs o
f sc
ho
olin
g
0
10
20
30
40
50
60
70
80
90
100
0 1,000 2,000 3,000 4,000 5,000 6,000 7,000 8,000 9,000 10,000 11,000
GDP per capita (in PPP dollars)
Per
cen
tag
e o
f th
e p
op
ula
tio
n 1
5-24
yea
rs o
f ag
e w
ith
at
leas
t 10
yea
rs o
f sc
ho
olin
gFIGURE 21 PERCENTAGE OF THE POPULATION 15-24 YEARS OF AGE WITH AT LEAST 10 YEARS OF
SCHOOLING (CIRCA 2000) AND PERCENTAGE OF URBAN POPULATION (2000)Source: Developed by PRIE whit data fromECLAC and CELADE. See data appendix.
FIGURE 22 PERCENTAGE OF THE POPULATION 15-24 YEARS OF AGE WITH LEAST 10 YEARSOF SCHOOLING (CIRCA 2000) AND GDP PER CAPITA (IN PPP DOLLARS)Source: Developed by PRIE whit data from ECLAC and CELADE.The UNDP is the source for GDP per capita. See data appendix.

Current secondary school net enrollment rates hinder fulfillment of the second goal established by Heads ofState at the Summit of the Americas. This, in turn, limits the possibilities of moving toward higher secondaryschool completion rates.
Difficulties in access to and completion of secondary education are related to the number of people whoabandon schooling when they conclude their primary education, and to those who, having completed partof a secondary education course, leave before concluding it.
In analyzing the distribution of young people 15-19 years of age who abandoned the education system duringthe 1990s,29 according to the stage of education which they left, we note that in 12 of the 18 Latin Americancountries studied, more than 60% of individuals left after having completed primary school, or during secondaryschool studies. That is, almost 2 out of every 3 young people who live in urban areas dropped out of theschool system upon entering secondary school or during secondary school studies. This trend is less markedin rural areas. In only 8 of the 15 Latin American countries analyzed did more than 50% of the young peoplewho dropped out of school did so upon moving from primary to secondary education or during secondaryschooling. This is related to the limited supply of secondary education services in rural areas.
Still, drop-out rates upon the termination of primary school fell in the last decade (1990-1999), with theproportion of young people who finish primary school and continue into secondary studies having increased.
This reinforces the importance of programs that are directed at keeping people in school. As we mentionedin the section on primary education, in Latin America there are successful initiatives in this area, such as theProgresa program in Mexico, the Bolsa Escola program in Brazil, and the Liceo para Todos program in Chilewhich provides both financial aid to students and the development of pedagogical and psycho-social programsfor schools in order to improve the educational process and the conditions within which it develops.
An important element to consider is that, in spite of the decrease in drop-out rates upon completion of primaryschooling, the gap between rural and urban areas has not changed significantly. In this regard, Hondurasshows the greatest difference in these drop-out rates by urban/rural residence. These differences have to dowith the problems of access to secondary education services for geographically isolated populations. Forexample, in Paraguay, 4% of women 15-19 years of age living in urban areas drop out before completingsecondary schooling, reporting for the reason difficulties in access or distance from a school. In rural areas,however, this reason was mentioned by 20% of female school drop-outs. In all of the other countries analyzed,we also see this kind of difference, indicating that in rural areas, the problems of access are a reason for thenon-continuation of studies.
However, the most important factor appears to be economic, given that the differences between levels ofdrop-out by income quartile are marked.
Thus, the gaps observed when comparing school drop-out in urban and in rural areas could also reflect thefact that it is in rural areas that we find concentrated the greatest proportion of low income individuals - thepoor and the extremely poor.
35
29 Based on ECLAC (2002), Social Panorama of Latin America, 2001-2002.

THE QUALITY OF SECONDARY EDUCATION
While looking at the levels of access to and completion of secondary education, it is also necessary to be awareof the quality of the services offered.
Available evidence30 shows that the performance of countries in the region in a combined reading scale variesconsiderably.
Figure 23 shows the distribution of students according to performance levels. We see here that Canada andthe USA have a student distribution concentrated in levels 3 and 4. In the rest of the countries, students aremainly at levels 1 and 2, except for Peru, in which students are concentrated in lower levels (at and below1). This means that most students in Canada and the USA are able to carry out more complex reading tasksthan most students in the rest of the countries.
Upon comparing the performance of countries in the hemisphere, we see that, the percentage of studentsat level 1 ranges from 7% in Canada to 33% in Brazil, and that, with the exception of the USA, all countrieshave between 20% and 30% of their students at this level – much higher than the OECD countries (12%).
In addition, when we compare level 5, we see that for the group of OECD countries, 10% of students attainthis level. Within the region, this varies from 0% in Peru to 17% in Canada. Again, only the USA is above theOECD average, while the rest of the countries practically do not have students at this performance level (1%in Brazil, Chile, and Mexico, and 2% in Argentina).
The results also show that in all countries, girls, on average, have higher reading scores than boys.
30 See PISA (2003) Literacy Skills for the World of Tomorrow – further results from PISA 2000.
36
54
2023
1623
6 626 28 33 2821
12 12 7
15
30 28 30 26 22 21 18
5
1713
1920 29 27 28
5
3
6 9
22 21 28
9 1217
2
1
21
1
1
0
Per
u
Chi
le
Bra
zil
Mex
ico
Arg
entin
a
OE
CD
Ave
reag
e
US
A
Can
ada
Below level 1 Level 1 Level 2 Level 3 Level 4 Level 5
FIGURE 23 DISTRIBUTION OF STUDENTS BY PERFORMANCE LEVEL,COMBINED READING (PISA 2000)Fuente: PISA (2003) Véase anexo de datos.
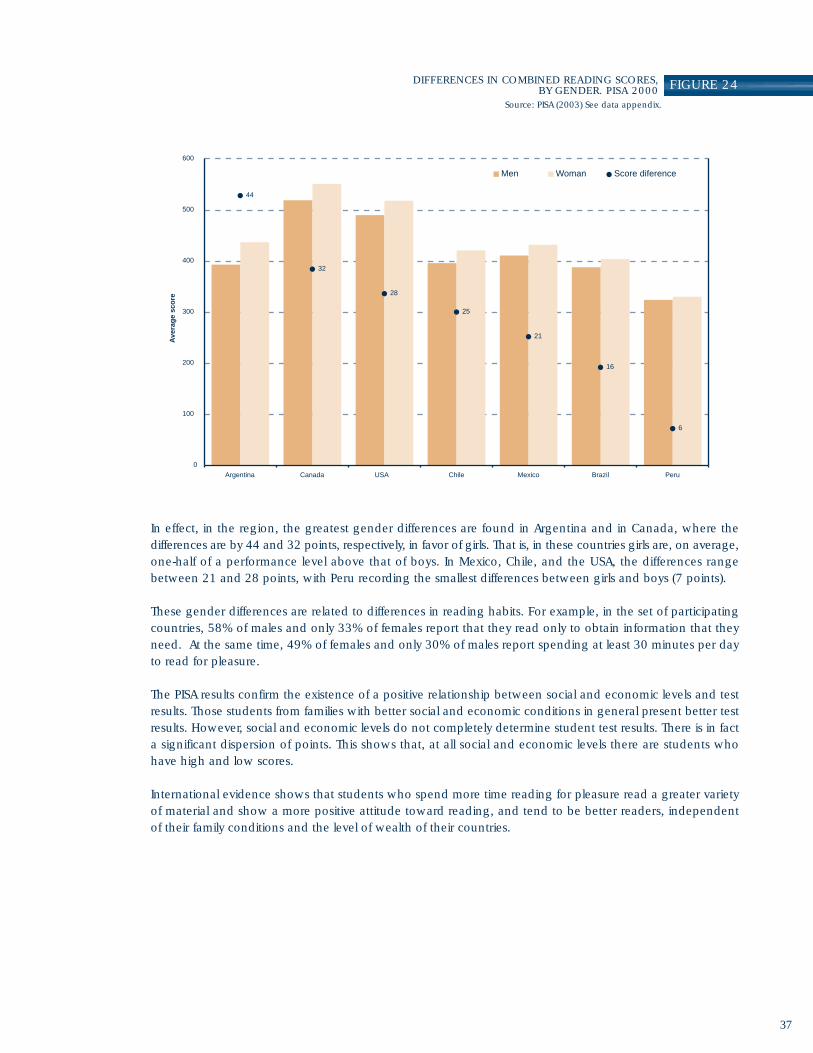
In effect, in the region, the greatest gender differences are found in Argentina and in Canada, where thedifferences are by 44 and 32 points, respectively, in favor of girls. That is, in these countries girls are, on average,one-half of a performance level above that of boys. In Mexico, Chile, and the USA, the differences rangebetween 21 and 28 points, with Peru recording the smallest differences between girls and boys (7 points).
These gender differences are related to differences in reading habits. For example, in the set of participatingcountries, 58% of males and only 33% of females report that they read only to obtain information that theyneed. At the same time, 49% of females and only 30% of males report spending at least 30 minutes per dayto read for pleasure.
The PISA results confirm the existence of a positive relationship between social and economic levels and testresults. Those students from families with better social and economic conditions in general present better testresults. However, social and economic levels do not completely determine student test results. There is in facta significant dispersion of points. This shows that, at all social and economic levels there are students whohave high and low scores.
International evidence shows that students who spend more time reading for pleasure read a greater varietyof material and show a more positive attitude toward reading, and tend to be better readers, independentof their family conditions and the level of wealth of their countries.
44
32
28
25
21
16
6
0
100
200
300
400
500
600
Argentina Canada USA Chile Mexico Brazil Peru
Ave
rag
e sc
ore
Men Woman Score diference
37
FIGURE 24DIFFERENCES IN COMBINED READING SCORES,BY GENDER. PISA 2000
Source: PISA (2003) See data appendix.

METHODOLOGICAL NOTE
This note presents in detail the way this report has approached measurement of the goal regarding accessto and completion of quality secondary education. It covers the selection of information and indicators, thereasons for such selection, and indicates the scope of the information used.
On the measurement of access to and completion of secondary education
According to the methodological considerations presented here regarding the measurement of the goals forprimary education, it is clear that the best way to measure the access of young people to secondary educationis the use of net enrollment rates at this level.
In effect, these rates show the proportion of young people of the age to be in secondary school (accordingto the age officially established for this purpose) who actually are doing so. Note, however, that those individualswho are not enrolled in secondary education are not necessarily outside the educational system, since theymay be studying at another level (such as primary school if they are “behind”, or at a higher level if they are“advanced”).
This report uses these net rates as a direct measure of access to secondary education of young people in theage group officially defined for this purpose to be at this level of schooling.
On the other hand, in order to measure completion of secondary studies, PRIE adopted the use of informationon the number of years of schooling achieved by the population 19-24 years of age, taking into account theconsiderations in regard to the same measure for primary education. This should be expressed in terms of thestandardized education levels (ISCED 97).
Unfortunately, currently available information (ECLAC, Social Panorama of Latin America) is organized byyears of study achieved, and not by ISCED levels. Also, it refers to the 15-24 year age group, and not the agerange adopted by PRIE. Therefore, this information only allows us to measure the proportion of young peoplewho have achieved at least 10 years of education (typically, 1 or 2 years more than that which correspondsto lower secondary, and 1 or 2 years less than that which corresponds to upper secondary). Using the nextavailable category (13 years of education or more) would typically refer to having concluded 1 or 2 years ofpost-secondary education. This would introduce difficulties in measurement, and therefore has not been used.
In spite of these limitations, PRIE believes that this is the best information available for directly measuring,although only approximately, the completion of a given level of schooling.
On measuring the quality of secondary education
The Program for International Student Assessment (PISA) is a joint effort among countries to establish towhat degree young people 15 years of age who are near the end of their compulsory schooling are preparedto face the challenges of contemporary society.
PISA was administered between 2000-2001 in 43 countries: the 28 member countries of the OECD31 as wellas Albania, Argentina, Brazil, Bulgaria, Chile, Hong Kong, Indonesia, Israel, Latvia, Liechtenstein, Macedonia,Peru, Romania, the Russian Federation, and Thailand.32
38
31 The member countries of the OECD are Australia, Austria, Belgium, Canada, the Czech Republic, Denmark, Finland, France, Germany, Greece, Holland, Hungary, Ireland, Iceland, Italy, the Republic of Korea, Japan, Luxemburg, Mexico, New Zealand, Norway, Poland, Portugal, Spain, Sweden, Switzerland, the United States, and the United Kingdom. However, Holland did not comply with the participation rates required; thereforeits results are not included.
32 Romania did not have its data in time; therefore, its results are not available.

The evaluation measures skills and knowledge in reading, mathematics, and science of students 15 years ofage. The purpose is to measure skills that are understood to be essential for individuals in the future and whichare necessary for successful adaptation to a changing world.
PISA was designed to be administered 3 times. The first exam, in 2000-2001, placed emphasis on reading,while future applications in 2003 and 2006 will emphasize mathematics and science, respectively.
This report has used the results from the first application corresponding to reading skills.
In PISA, the concept of reading has three dimensions: type of task; form and structure of reading material; anduse for which the text was constructed. The first of these best reveals the concept of personal skills. The typeof task is measured on three scales: information extraction, which reports on the skills of students to locateinformation in a text; text interpretation, which measures the ability to construct meanings and form conclusionsfrom written information; and reflection, which measures the ability of students to relate texts based on theirown knowledge, ideas, and experiences. The combined scale summarizes the results of these 3 scales.
Performance levels
In order to facilitate interpretation of the results, PISA established 5 performance levels for reading. These levelsare associated with certain processes and tasks with different degrees of difficulty. In order to carry out a specifictask in reading, the difficulty of the task for students ranges from the simplest (Level 1) to the most complex,diverse, and difficult (Level 5).
Below Level 1: Students who are at this level are not able to carry out the most basic tasks that PISA seeksto measure. This does not mean that they are illiterate. These students have serious difficulties in using readingas an effective tool for advancing and extending their knowledge in other areas.
Level 1: Students who are at this level are able only to complete the less complex tasks developed by PISA,such as identifying a single unit of information, identifying the principal theme of a text, or making simpleconnections with every-day knowledge.
Level 2: Students who are at this level are able to carry out basic tasks such as locating direct information,making inferences of low difficulty, finding the meaning of defined parts of a text, and using some knowledgeto understand the text.
Level 3: Students at this level are able to carry out moderately complex tasks, such as locating various unitsof information, associating different parts of a text, and relating texts with knowledge with which they arefamiliar.
Level 4: Students at this level are able to carry out more complex tasks, such as locating hidden information,constructing meaning from subtleties of language, and critically assessing a text.
Level 5: Students who are at this level are able to complete sophisticated reading tasks. They can manageinformation that is presented in texts with which they are not familiar. They can also show detailed understandingof complex texts, deduce what information is relevant for a task, and critically assess and establish hypotheseswith the ability to use specialized knowledge and concepts that may be contrary to expectations.
39

This goal looks at education as a permanent activity in the lives of human beings. In effect, from a traditionalnotion that identifies the educational experience with formal instruction in schools, we have increasingly goneto a more comprehensive view of education that is based upon the concept that human beings are, first andforemost, beings who learn.
Thus, the concept of life-long learning is a recognition of a fact inherent to the human condition which societyshould assure and guarantee.
According to the Delors report, “no one can expect today that the initial stock of knowledge developed duringyouth is sufficient for one’s entire life. For the rapid development of the world, demands a permanent updatingof knowledge”.33
It is in this spirit that the report speaks of concepts such as the educating society and permanent education.The educating society is one in which all opportunities should be used for learning and for the developmentof individual abilities. For its part, permanent education should go beyond the activities of professional leveling,skill enhancement, and promotion.34
On the other hand, Torres35 suggest that the developed countries have utilized this as a key factor withinthe context of globalization and of the knowledge society of the XXI century. However, for the developingcountries, this organizing principle means basic education. Therefore, although the words are the same, “life-long education” has a different meaning in different parts of the world.
In the industrialized countries, there is broad coverage of formal education which, in some cases, includeshigher education. For example, in the U.S.A. as well as in Canada, nearly 40% of the population between25 and 64 years of age possess some kind of higher education, and only 5% have only a primary education.36
The young people and adults of these countries, within the framework of “lifelong education”, tend to havea broad offer of non-formal education. In general, this type of education is organized into two modalities:one designed for the labor market, and the other for personal development.37
In the United States, for example, “lifelong learning” programs are not divided only into these two groups.Some of them are also in remedial education, aimed principally at immigrants whose native language is notEnglish.
In addition, in the area of education for work, programs are not only for job training. There are also skillenhancement programs for professional young people and adults. Moreover, in the area of technology anddistance education there are programs that support the use of new technologies in the workplace.38
40
C. THIRD GOAL:LIFELONG LEARNINGOPPORTUNITIES
33 Delors, J., et.al. (1996) Learning: a Treasure Within, UNESCO.34 Ibid.35 Torres, R.M. (2002) Lifelong Learning in the North, Education for All in the South in Integrating Lifelong Learning Perspectives. UNESCO
Institute for Education.36 OECD (2002) Education at a Glance37 Romijn C. (2002) Combining the World of Work with the Word of Education. In Integrating Lifelong Learning Perspectives. UNESCO Institute
for Education.38 http://www.ed.gov
The United States also possesses a range of personal development programs such as literary or cultural criticismand recreational activities. Public buildings such as libraries are used as places in which to offer guidance toyoung people and adults on how to access continuing and higher education programs, understand financialplanning and investment, raise a family, exercise rights as a citizen, as well as courses on the internet andcomputers.39
In developing countries, however, current coverage does not assure universal coverage of basic education,in some countries not even primary education. The picture is even more complex for young people and adults,given that the increase of coverage of primary education is a recent phenomenon. Therefore, in these countries,“lifelong education” carries the connotation of being remedial and compensatory, and often of even beingof lower quality than formal education.
For example, most countries in the region have, in parallel with their formal education systems, a system ofremedial education which ends up absorbing not only young people and adults who have not had educationalopportunities, but also school-age children who are behind in grade or need to work during regular schoolhours.
There are also job training programs which, in general, are part of remedial education. This corroborates thethesis of Torres that “lifelong education,” still with a job training character, tends to be identified with basiceducation programs for overage students and adults from lower socioeconomic strata.
When we add to the above the fact that providers of these educational services are diverse and of differentinstitutional natures, as diverse as the educational programs offered, and that there is no systematic sourceof information on these activities, this goal shows itself to be particularly complex and difficult to assess.Moreover, the goal does not refer exclusively to the provision of education programs for young people andadults, whether meant to fill needs not treated in a timely fashion (such as literacy training programs) or forjob training. It also refers to opportunities for personal development for those who have already achievedsignificant levels of formal education.
39 http://nces.ed.gov/pubsearch/pubsinfo
41


2chapter
WHY IS IT IMPORTANT TOACHIEVE THESE GOALS? 40
43
The fulfillment of the goals proposed in 1998during the Summit of the Americas is not only apolitical commitment assumed by the Heads of Stateof each country. It should also be a responsibilityshared by all members of society. This responsibilityfalls upon all of us, whether directly involved witheducation systems or not. That is, it is not only ofinterest to educators, students, and parents.
The above argument is based on the fact that higherand better levels of education of the population notonly benefit those who receive them; they alsobenefit society as a whole. Therefore, it will be usefulto consider the goals in the light of the impact thatthey have on different parts of society; or put inother terms, of their ability to effectively providegreater social well-being.
Thus, we may conclude that achieving universalprimary education, assuring that 75% of youngpeople have access to secondary education, andoffering life-long educational opportunities are notonly objectives in themselves. They are also meansto attain other desirable social objectives, such asincreased income, greater economic development,better income distribution, greater citizen participationin political decision-making, consolidation ofdemocratic norms and values, among others.Therefore, it is essential that we review the evidenceavailable for the region in order to gauge the socialimpact of education.
The principal objective of this chapter is to establisha framework for the debate on the social impact ofeducation. This framework is developed from theperspective of PRIE; that is, serving the need ofhaving a set of internationally comparable indicatorsthat allow us to understand the economic, social,and political impact of education.
40 This chapter makes use of the experience of PRIE in this subject,particularly that of Carlos Muñoz Izquierdo, ed.al. (2003) Desarrollode una propuesta de indicadores del impacto de la educaciónen América Latina y el Caribe developed by a team from theUniversidad Iberoamericana de México under the direction of CarlosMuñoz Izquierdo. This study was developed at the request of PRIE,and may be found at http://www.prie.cl

44
It is not easy to gauge the impact of education on society and on the quality of life of each of its members.It is not a clearly identifiable phenomenon, but rather a complex and multidimensional process upon whicha number of variables act simultaneously.
Moreover, the social impact of education is neither linear nor constant, since its magnitude and manifestationsdepend upon a large number of factors. One fundamental element is the quality of education imparted. Thatis, the benefits and results obtained through greater education will depend, on the one hand, on the relevanceand pertinence of the content imparted and, on the other, on the efficiency and equity of the educationsystem. For this reason, it is necessary to reflect upon what is understood by the “quality of education” sincethis, after all, is an explicit objective among the goals of the Summit of the Americas.
1. THE QUALITY OF EDUCATION42
The quality of education is a normative and multifaceted concept because, intervening in its definition are,in the least, dimensions involving philosophy, pedagogy, culture, society, and economics.
In effect, from a philosophical perspective, education has quality when the objectives proposed in curriculaare based upon and directed toward fostering the values that different sectors of society consider desirable.In order to assess fulfillment of this condition, one applies criteria that are known by the term relevance.
From a pedagogical perspective, education has quality when the various objectives proposed in the curricula,plans, and education programs are achieved. Assessment of this condition is carried out through the criterionof efficacy.
From a cultural perspective, education has quality when its contents and methods stem from the conditions,possibilities, and aspirations of each of the social groups toward which it is directed. One assesses the fulfillmentof this condition by applying the criterion of pertinence.
From a social point of view, education has quality when the opportunities to receive it (as well as to participatein the social benefits derived from it) are distributed equally among different sectors of society. From thisperspective, assessment is carried out through the application of the criterion of equity.
Finally, in the area of economics, education has quality when the resources used to impart it are utilized inthe best manner possible, and upon doing so, the existing relationship between benefits derived and costssustained are optimized. To assess the fulfillment of this condition, one applies the criterion of efficiency.
In summary, education is considered to have quality when it is directed at satisfying the aspirations of all sectorsof the society. Also if, upon doing so, it effectively achieves the goals that it seeks. And, if it is generated throughculturally pertinent processes, making optimum use of the resources necessary to impart it, assuring that theopportunities to receive it, and the social and economic benefits derived there from, are distributed in anequitable manner among the different sectors of the society.
A. ANALYTIC MODEL41
41 Based on Carlos Muñoz Izquierdo, ed.al. (2003) Desarrollo de una propuesta de indicadores del impacto de la educación en AméricaLatina y el Caribe
42 Taken from Carlos Muñoz Izquierdo, ed.al. (2003) Desarrollo de una propuesta de indicadores del impacto de la educación en AméricaLatina y el Caribe

45
2. INTRINSIC AND EXTRINSIC DIMENSIONS OF THE QUALITY OF EDUCATION43
In assessing the quality of education, it is necessary to keep in mind that the outcomes of education systemsmanifest themselves in two directions – one intrinsic, and the other extrinsic to the education system. The firstdimension refers to that which is inherent to the education system – knowledge, skills, attitudes, values, andall other objectives contained in the respective plans and programs of studies imparted within schools. Thesecond dimension refers to the impact that these results produce within the society in which the educationsystem operates. That is, once these individuals who possess greater human capital enter society, they generateimpacts that are at the same time economic, social, and political.
In order to express operationally the intrinsic dimension of the outcomes of education systems, it is necessaryto resort to the sciences of education. Moreover, in order to analyze the extrinsic dimension, it is necessary toresort to knowledge generated in various areas of the social sciences, since this dimension refers to the extentto which education fulfills the various functions assigned to the various levels and modalities within which itis imparted.
Thus, for example, the intrinsic dimension of the efficiency of education systems may be estimated by examiningrationality in the use of the resources assigned to education (cost effectiveness). For its part, the extrinsicdimension of these outcomes refers to the optimization of costs and benefits created by education. Thisdimension is assessed, then, through application of cost/benefit analysis, considering the impact that theknowledge acquired by students has on the productivity of economic systems and on the employability andincome of those who acquire it.
For its part, the intrinsic dimension of efficacy refers to the extent to which the above-mentioned curricularobjectives are attained. The extrinsic dimension of efficacy is related to the capacity of the knowledge, skills,and values acquired by people to improve their own quality of life.
In addition, the intrinsic dimension of equity may be gauged through analysis of the distribution of educationopportunities, while the extrinsic dimension of this criterion is gauged through the effects that learning hason the distribution of income, social mobility, and, in general, on the distribution of social opportunities.
Thus, the social impact of education is placed on the extrinsic dimension of the education system, defined asthe impact that knowledge, skills, and values have on society and its members.
43 Taken from Carlos Muñoz Izquierdo, ed.al. (2003) Desarrollo de una propuesta de indicadores del impacto de la educación en AméricaLatina y el Caribe.
46
3. AREAS OF THE SOCIAL IMPACT OF EDUCATION
We shall present below a summary of the relations that the available literature has identified between educationand each social area that it affects. The following section offers empirical evidence regarding these relationsin the case of the Americas.
3.1. IMPACT IN THE ECONOMIC AREA
The growing necessity to explain and predict the economic benefits of increasing the education level of thepopulation has led to the appearance of a number of theories which approach the theme from differentperspectives.
3.1.1. THE INDIVIDUAL AND FAMILY LEVEL
Human capital theory seeks to explain salary differences existing within an economy. It postulates that thesedifferences are due to the different productivity of workers; that is, to different abilities to generate goods andservices. For its part, this productivity is produced by the accumulation of human capital, defined as theknowledge and skills acquired by workers through education, training, and experience.
Based upon the above, education is viewed as an investment, the returns to it are manifested by higher salaries,which in turn allows us to conclude that the investment in human capital is a profitable and attractivealternative.44
It has been shown that education makes it possible to increase the probability of obtaining quality employment,seek higher salaries, and increase the quality of members of the household who participate in the labor market.These elements contribute to integration of families into the labor market and into society.
For its part, the relationship between education and poverty has been analyzed in a number of studies.Theydemonstrate that the probability of being among the poorest sectors or of escaping from poverty variesaccording to level of education achieved.45
3.1.2. THE LEVEL OF THE COMMUNITY
Education increases the productivity of workers, which not only translates into higher salaries, but in greatereconomic growth as well. 46
However, the greatest contribution that education makes to economic growth comes not only from the increasein productivity of the labor force, but also from the ability of education to encourage technological changesand improvements in the economy. It is in this area where education and scientific research appear to befundamental for economic growth. Education not only encourages innovation and facilitates the incorporationof new technologies into the productive process of each industry; it also generates positive externalities forthe rest of the economy. That is, if the innovations developed enter into the storehouse of knowledge of society,so that everyone can benefit from them and use them, one generates a social benefit greater than the privatebenefit obtained by the person who is educated or by the industry that produces the innovation.47
The implication of this is that “ideas” are a “unending source” of economic growth. For this reason, highereducation, and especially doctoral programs, play a fundamental role, since it is at these levels of educationwhere it is possible to expand the frontiers of knowledge.
44 This can be seen in OECD, (2002), Education at a Glance, which analyzes member countries of this organization and concludes that in themajority of them, the rate of return to tertiary education is in the range of 10%-15% above the real interest rate. The return to education iscompared with the real interest rate, since the latter represents the alternative cost of the funds invested. If the return (benefit) is greater thanthe alternative (cost), then the “project” is profitable.
45 Juan Guillermo Espinosa (2001), Economia Neoliberal vs. Economia Social en América Latina, p. 184.46 Evidence of this may be found in the study of Nonnenman and Vanhoudt (1996) Educational Attainment in the OECD, which affirms the
important effect of human capital on economic growth rates.47 In this sense, Nonnenman and Vanhoudt (1996) in A further augmentation of the solow model and the empirics of economic growth
for OECD countries confirm the importance of research as a determinant of economic growth. In doing so, they use indicators of speningon research and development as a percentage of GDP.

47
3.2. IMPACT IN THE SOCIAL POLITICAL AREAS
3.2.1. SOCIAL CAPITAL
Education not only makes people more productive; it also reproduces values and norms that allow people tolive better in community. In this way, human capital contributes to the construction of social capital.48
A number of researchers argue that the creation of social capital is fundamental for overcoming poverty, sinceit strengthens the ability of people to help each other and themselves and to overcome difficulties together.
For its part, greater levels of social capital facilitate the acquisition of greater levels of human capital, whetherby providing a proper environment for learning, or for placing at the disposition of society financial and materialresources that would otherwise not be available.
3.2.2. INTERGENERATIONAL EDUCATIONAL MOBILITY
The educational level of parents strongly influences the quality and quantity of education acquired by theirchildren. For this reason, there is a synergy in educational mobility at the intergenerational level. This can workagainst new generations, when the educational level of their parents is low.
On the other hand, once a high level of education is achieved, this level tends to perpetuate itself and to betransmitted to the following generation.
3.2.3. STRENGTHENING OF DEMOCRATIC INSTITUTIONS
Education contributes to values training and in the development of student attitudes. It can play a role in thereproduction of values and in the creation of attitudes that contribute to the strengthening of democraticinstitutions.
Research that studies the link between schooling and political culture distinguishes at least three dimensionsin which education contributes to the creation of a democratic and participatory political culture: the cognitive,the affective, and the evaluative. The first of these dimensions refers to knowledge and concepts related tothe functioning of the political system. The second refers to attitudes in the face of particular stimuli and theidentification of individuals with particular institutions. Finally, the third dimension refers to the critical abilitythat individuals have to assess different dimensions of politics, such as the functioning of the system, thebehavior of political parties, and public policies in general.
3.2.4. FERTILITY AND BIRTH RATES
Fertility decreases when the level of schooling of women increases. Evidence shows that, the probability ofentering the labor market under favorable conditions, induces women to have fewer children.
Schooling also induces women to delay the time when they begin their reproductive life, which also resultsin a decrease in their fertility.
48 Although there is no single definition for this concept, it may be summarized as a “network of human relations or set of shared values and normsthat facilitate cooperation among the members of a community” OECD (2001) Well-being of Nations.
48
3.2.5. INFANT MORTALITY AND PREVENTION
When mothers have a higher level of education (especially beginning with secondary schooling), they increasetheir abilities and their knowledge of how to care for the health of their children. This knowledge result inimproved hygiene, nutrition, and encourages preventive medicine, among other impacts.
At the same income levels, infant mortality decreases when female schooling rates increase. It should be notedthat the expansion of primary education produces a weaker effect than does the expansion of secondaryeducation.49
Moreover, education is fundamental in the prevention of disease and in combating rapidly expanding epidemicsand contagion. This fact is corroborated by the joint United Nations program on HIV/AIDS (ONUSIDA).50
3.3. EQUITY
Equity is a cross-cutting point of analysis. It is not only inherent to the economic area, but to the social andpolitical spheres as well. Therefore, when analyzing the social impact of education, one should assess itscontribution in constructing equality of opportunities.
Education allows people to develop their potential, increasing life’s opportunities and possibilities. For example,in the economic sphere, education makes possible greater access to income generation.
Empirical evidence demonstrates that trained workers not only obtain greater income in absolute terms thanuntrained workers, but in relative terms as well, resulting in an increase in salary gaps.51
49 McMahon (2000). The impact of human capital on non-market outcomes and feedback on economic development, cited in CarlosMuñoz Izquierdo et. al. (2003) Desarrollo de una propuesta de indicadores del impacto social de la educación en América Latina yel Caribe.
50 By analyzing existing publications on the theme, this program concludes that of 53 studies that assess the effect of sex education in schools, 27do not find evidence either in favor or against this kind of education; 22 argue that such education programs decrease unplanned pregnanciesand the number of infections of STDs. Only 3 studies find to the contrary. See www.jornada.unam.mx/2002/oct02/021003/ls-jovenes.htlm
51 In the United States in 1976, people with a higher education degree earned, on average, 55% more than those with only a secondary schooldiploma. Moreover, in 1994, people with a university degree earned 84% more than those people holding only a secondary education degree.Gregory Mankiw A(1998) Principios de Economia.
In addition, OECD studies show that, in countries such as Finland, Hungary, and Portugual, people with higher education earn up to 80% morethan those with only a secondary education. OECD (2002) Education at a Glance.
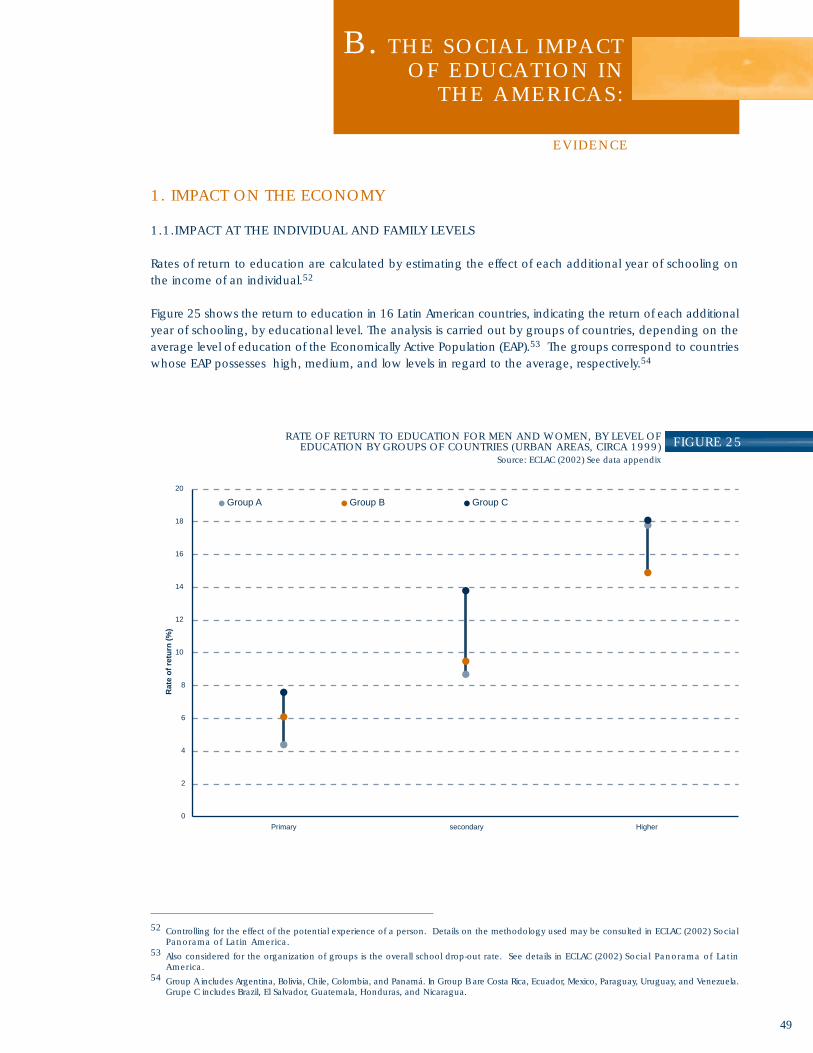
49
1. IMPACT ON THE ECONOMY
1.1.IMPACT AT THE INDIVIDUAL AND FAMILY LEVELS
Rates of return to education are calculated by estimating the effect of each additional year of schooling onthe income of an individual.52
Figure 25 shows the return to education in 16 Latin American countries, indicating the return of each additionalyear of schooling, by educational level. The analysis is carried out by groups of countries, depending on theaverage level of education of the Economically Active Population (EAP).53 The groups correspond to countrieswhose EAP possesses high, medium, and low levels in regard to the average, respectively.54
0
2
4
6
8
10
12
14
16
18
20
Primary secondary Higher
Rat
e o
f re
turn
(%
)
Group A Group B Group C
EVIDENCE
B. THE SOCIAL IMPACTOF EDUCATION IN
THE AMERICAS:
FIGURE 25RATE OF RETURN TO EDUCATION FOR MEN AND WOMEN, BY LEVEL OFEDUCATION BY GROUPS OF COUNTRIES (URBAN AREAS, CIRCA 1999)
Source: ECLAC (2002) See data appendix
52 Controlling for the effect of the potential experience of a person. Details on the methodology used may be consulted in ECLAC (2002) SocialPanorama of Latin America.
53 Also considered for the organization of groups is the overall school drop-out rate. See details in ECLAC (2002) Social Panorama of LatinAmerica.
54 Group A includes Argentina, Bolivia, Chile, Colombia, and Panamá. In Group B are Costa Rica, Ecuador, Mexico, Paraguay, Uruguay, and Venezuela.Grupe C includes Brazil, El Salvador, Guatemala, Honduras, and Nicaragua.

50
We may conclude from this information that, first, the returns to education increase according to advancementfrom one educational level to another. This has implications on the existence of differentiated salaries, sincethe greatest benefits of education are obtained with higher levels of schooling, exactly those to which themajority of the population do not have access.
Second, when the average level of education of the EAP increases, the return to education decreases forprimary and secondary education. That is, the greater the number of people who enjoy a higher level ofeducation, the lower is the “prize” for additional years of education at these levels. In this sense, the highereducation level represents a special case since here the phenomenon is not clear.
An important element to be considered when analyzing the evidence is that the educational level of individualsmay be better represented using information on years of education achieved expressed in terms of the levelsof education completed. This is important in carrying out international comparisons. PRIE opts in all caseswhen possible, in favor of using the International Standardized Classification of Education (ISCED 1997),55
which is defined in function of the contents of educational programs, and thus assuring equivalence insubstantive terms.
0.0
0.5
1.0
1.5
2.0
2.5
3.0
3.5
4.0
Uru
guay
Arg
entin
a
Per
u
Bra
zil
Chi
le
Par
agua
y
Lev
el o
f in
com
e in
rel
atio
n t
o u
pp
er s
eco
nd
ary
No schooling Primary Lower secondary Higher
FIGURE 26a INCOME DIFFERENTIALS BY EDUCATION LEVEL ATTAINED(MEN FROM 25-64 YEARS OF AGE, 1999)56
Source: UNESCO/OECD (2003). See data appendix.
55 UNESCO (1997) International Standardized Classification of Education.56 Graphs 28a and 28b do not include information from the United States, Canada, and Mexico, since available information for these countries is
classified in a different form than that used for the others. See the data appendix.

51
FIGURE 26bINCOME DIFFERENTIALS BY EDUCATION LEVEL ATTAINED(WOMEN FROM 25-64 YEARS OF AGE, 1999)
Source: UNESCO/OECD (2003).See data appendix.
0.0
0.5
1.0
1.5
2.0
2.5
3.0
3.5
4.0
Uru
guay
Arg
entin
a
Per
u
Par
agua
y
Chi
le
Bra
zil
Lev
el o
f in
com
e in
rel
atio
n t
o u
pp
er s
eco
nd
ary
No schooling Primary Lower secondary Higher
Figure 26 presents evidence of the effect of education on salaries, utilizing ISCED 1997. Here we see incomedifferential by educational level attained in comparative terms for people who have only concluded highersecondary education.57
This information corroborates the “premium” that the market grants to those who complete higher education.This effect is especially important in Paraguay, where men with higher education obtain salaries almost 4 timesgreater than those with only secondary education.
In this sense, men in the United States and in Canada have returns (relative to upper secondary education)that are lower for higher education than all of the countries in Latin America. In fact, the income differentialsrelative to upper secondary education are 1.9 and 1.6, respectively. This means that, while in Latin Americancountries, men with a higher education obtain income of at least two times that of those who have a secondaryeducation, in the United States and Canada, this difference is less than two times as much. In the case ofwomen, the evidence is similar to that of men, with the exception of Uruguay, which shows rates similar tothose of the countries in the northern hemisphere. This would seem to reaffirm the evidence that, the moreaverage years of education obtained by the population, the less is the return for additional years of schooling.
Education also has effects on incentives to participate in the labor market. Given that education increases thesalary that a person is able to earn, the incentive to be economically active also increases. Therefore, the moreeducation a person has, the greater the possibility that he or she will participate in the labor market.
57 For the effects of comparison, the values corresponding to upper secondary are equivalent to 1.
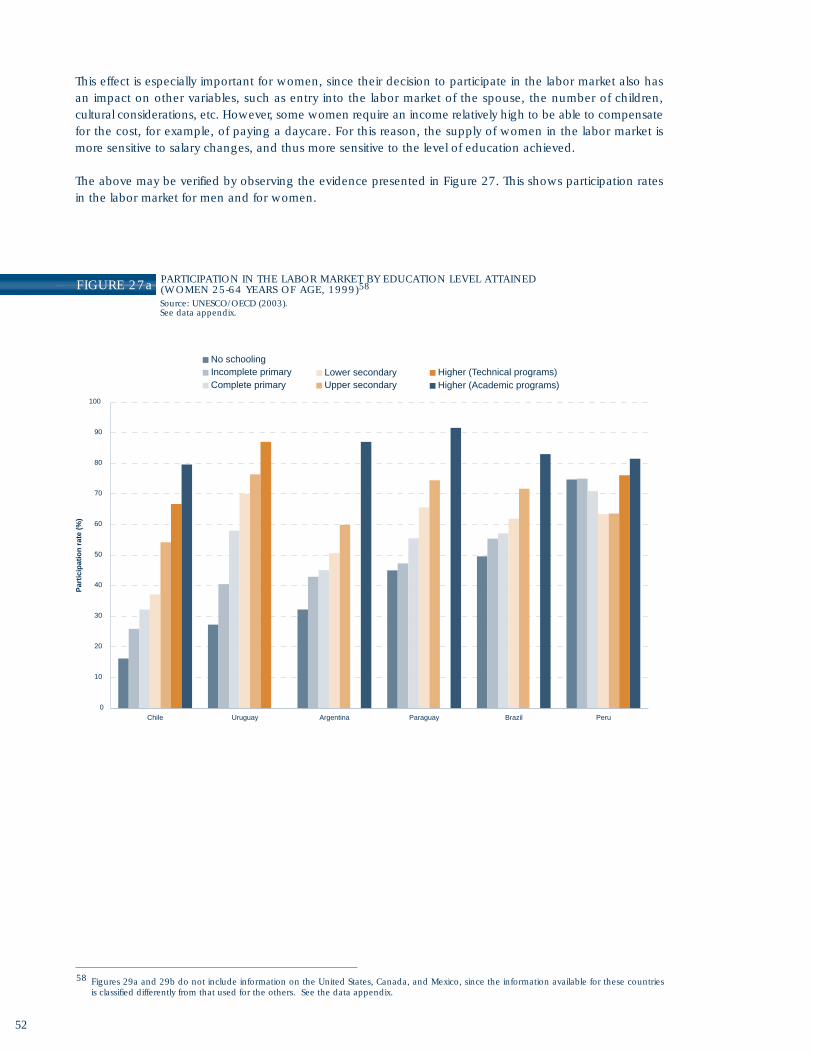
52
This effect is especially important for women, since their decision to participate in the labor market also hasan impact on other variables, such as entry into the labor market of the spouse, the number of children,cultural considerations, etc. However, some women require an income relatively high to be able to compensatefor the cost, for example, of paying a daycare. For this reason, the supply of women in the labor market ismore sensitive to salary changes, and thus more sensitive to the level of education achieved.
The above may be verified by observing the evidence presented in Figure 27. This shows participation ratesin the labor market for men and for women.
FIGURE 27a PARTICIPATION IN THE LABOR MARKET BY EDUCATION LEVEL ATTAINED(WOMEN 25-64 YEARS OF AGE, 1999)58
Source: UNESCO/OECD (2003).See data appendix.
0
10
20
30
40
50
60
70
80
90
100
Chile Uruguay Argentina Paraguay Brazil Peru
Par
tici
pat
ion
rat
e (%
)
No schoolingIncomplete primaryComplete primary
Lower secondaryUpper secondary
Higher (Technical programs)Higher (Academic programs)
58 Figures 29a and 29b do not include information on the United States, Canada, and Mexico, since the information available for these countriesis classified differently from that used for the others. See the data appendix.

53
FIGURA 27bPARTICIPATION IN THE LABOR MARKET BY EDUCATION LEVEL ATTAINED(MEN 25-64 YEARS OF AGE, 1999)
It can be seen that the greater the level of education, the higher the participation rate in the labor market,for both men and women. However, one notes in the case of women that this tendency is much more strong.An extreme case is that of Chile, where the probability that a women who has completed higher educationto participate in the labor market is more than four times higher than that corresponding to those womenwho only have completed primary school (79.6% vs. 16.2%).
In Mexico, the participation in the labor market of women who have a higher education (academically oriented)is markedly less than that of other countries. While most countries show female labor participation rates of80%, in Mexico this figure is 70%. Similarly, in the case of men, one sees a significant difference in laborparticipation rates observed in Latin American countries and those in the United States and Canada. Whilein the former, the labor participation rates of men with complete secondary or higher education (academicallyoriented) are above 92% and 93%, respectively, in the countries in the northern hemisphere, these rates arebelow 88% and 92%, respectively.
Finally, education also has an impact on the unemployment rate. Although one would expect to observelower unemployment as the level of education of the individual increases, this relationship is not always foundin reality.
0
10
20
30
40
50
60
70
80
90
100
Argentina Brazil Chile Paraguay Peru Uruguay
Par
tici
pat
ion
rat
e (%
)
Source: UNESCO/OECD (2003).See data appendix.
No schoolingIncomplete primaryComplete primary
Lower secondaryUpper secondary
Higher (Technical programs)Higher (Academic programs)

54
FIGURE 28 OPEN UNEMPLOYMENT RATES, BY YEARS OF SCHOOLING ATTAINED(URBAN AREAS, CIRCA 2000)Source: ECLAC (2000). See data appendix.
0
5
10
15
20
25A
rgen
tina
Bol
ivia
Bra
zil
Chi
le
Col
ombi
a
Cos
ta R
ica
Ecu
ador
El S
alva
dor
Hon
dura
s
Mex
ico
Nic
arag
ua
Pan
ama
Per
u
Dom
inic
an R
ep.
Uru
guay
Ven
ezue
la
Op
en u
nem
plo
ymen
t ra
te (
%)
0-5 years 6-9 years 10-12 years 13 and more years
The evidence presented shows that the highest rates of unemployment are found among those individualswith medium levels of education, while people with low and high levels present lower unemployment rates.In general, however, one may state that with increasing years of schooling, beginning with 10 to 12 yearsof schooling, there is an inverse relationship between education and unemployment. In some cases, this isobserved around 6 to 9 years of schooling.
This relationship may be due to the fact that the unemployment of individuals with medium levels of educationis related to a greater search for employment compared to those without schooling. That is, the former preferto seek employment during a longer period of time in order to find a better job, whereas those with littleschooling simply accept the “first job” offered, since their options are more limited.
Another explanation stems from the existence of greater structural unemployment in certain levels of education– in this case, in the middle levels. That is, there may be a certain incompatibility between the skills that workerspossess and those required by businesses.In conclusion, greater levels of education increase the salary obtained in the labor market, increase the numberof income earners within households (greater labor market participation), and diminish unemployment at theindividual level. All of these elements contribute to helping families escape poverty.
In this sense, numerous studies show that in Latin America, a person with less than 5 years of education hasan 80% probability of being in the 20% poorest sector of the population. On the other hand, a person withmore than 13 years of education has only a 5% probability to be in the same income group.59
In addition, ECLAC has shown that completing the secondary level of education and having a minimum of12 years of schooling assure, with more than an 80% probability, that a person will be above the povertyline.60
59 Juan Guillermo Espinosa (2001), Economía Neoliberal vs. Economía Social en América Latina, p. 18460 ECLAC (1997) Social Panorama of Latin America.

55
FIGURE 29PERCENTAGE OF THE POPULATION BELOW THE POBERTY LINE AND AVERAGE SCHOOLINGOF THE POPULATION 25-59 YEARS OF AGE (URBAN AREAS, CIRCA 2000)
Source: ECLAC (2000). See data appendix.
FIGURA 30PERCENTAGE OF THE POPULATION BELOW THE LINE OF EXTREME POVERTY AND AVERAGESCHOOLING OF THE POPULATION 25-59 YEARS OF AGE (URBAN AREAS, CIRCA 2000)
Source: ECLAC (2000). See data appendix.
Figure 29 shows the relationship, in urban areas, between average years of schooling of the population 25to 59 years of age and the percentage of households below the poverty line.One sees a decreasing trend in the proportion of households below the poverty line, with the increase in theaverage schooling of the population.
Figure 30 shows the relationship, in urban areas, between the percentage of households in extreme povertyand the average level of schooling of the population 25 to 59 years of age. Note that higher levels of educationare related to smaller proportions of extreme poverty households.
0
10
20
30
40
50
60
70
80
6 7 8 9 10 11 12
Average years of schooling (population 25-59 years of age)
Po
pu
lati
on
bel
ow
th
e p
ove
rty
line
(%)
0
10
20
30
40
50
6 7 8 9 10 11 12
Average years of schooling (population 25-59 years of age)
Po
pu
lati
on
bel
ow
th
e lin
e o
f ex
trem
e p
ove
rty
(%)
56
In both cases, these are not strong relationships, which indicates that poverty and extreme poverty are alsoassociated with other factors. Thus, it is not enough to increase the average schooling level of the populationin order to eradicate poverty and extreme poverty. It is necessary to strengthen the quality of social policiesaimed at improving entry into the labor market and into society for underprivileged groups.
It is also important to keep in mind that, in spite of the population having more years of schooling, the qualityof education received by different sectors of society is not uniform, and is inequitable in many cases. This limitsthe ability of education to be a tool to eradicate poverty.
1.2. IMPACT AT THE COMMUNITY LEVEL
A recent study61 carried out by countries who are part of the World Education Indicators Project (WEI),62
analyzes the relationship between human capital and economic growth for a period of two decades (1970-1980 and 1980-1990).63
This study confirms the strong relationship existing between human capital and economic growth. In the WEIcountries, the increase in human capital provided, on average, one-half of a percentage point in annualgrowth rates during the two decades analyzed.64 This means, for example, if the economy of a country growsby 3.0% annually during a period, 0.5% was generated by the increase in education and 2.5% by otherfactors such as investment in physical capital, expansion of foreign trade, etc.
The evidence is even stronger for the sub-set of countries of the region that participated in WEI. For all, withoutexception, the contribution of human capital to economic growth rates was above 0.5%. This impact isespecially strong in the cases of Argentina, Chile, Jamaica, Peru, and Paraguay.
In summary, one may conclude that investment in human capital has high social profitability in the long run.The increase in the productivity of workers, greater innovation, the capacity to assimilate better productiontechnologies, and other positive externalities are determinant in the generation of high rates of economicgrowth which, finally, results in greater social well-being and a better quality of life for the population.
2. IMPACT ON SOCIETY AND POLITICS
Following, we present empirical evidence for the Americas that reflects the influence of education onintergenerational educational mobility, the strengthening of democratic institutions, fertility, birth rates, andinfant mortality.
It is worth noting that it is difficult to present empirical evidence on the relation between human and socialcapital, due to the methodological difficulty involved. Social capital is a concept that has to do with the intensityand specific characteristics of the networks formed and contacts existing within communities. There is currentlyno extensive survey of this type of information in the region. This makes comparison difficult between someexisting initiatives to measure this social phenomenon.
2.1. INTERGENERATIONAL EDUCATION MOBILITY
The education of parents is determinant in the educational level achieved by their children. This intergenerationalrelationship is shown in Figure 31, where we can see the proportion of children from 20 to 24 years of agewho attain at least 12 years of education, by the education levels of their parents.
61 UNESCO/OECD (2003) Financing Education- Investment and Returns.62 The countries of the region that participate in the project WEI (World Education Indicators) are: Argentina, Brazil, Chile, Jamaica, Paraguay, Peru,
and Uruguay. The WEI project brings together 19 medium income countries, which account for approximately 70% of the world population.63 It uses, to the extent possible, information from primary sources, collected directly through national census studies and/or WEI project questionnaires.
In addition, it uses as an indicator of human capital the average number of years of education for the population 15 to 64 years of age.64 UNESCO/OCDE (2003) Financing Education- Investment and Returns. p 21-33.

57
FIGURE 31PROPORTION OF CHILDREN FROM 20-24 YEARS OF AGE WHO ATTAIN AT LEAST 12 YEARS OFEDUCATION, BY THE EDUCATION LEVELS OF THEIR PARENTS (URBAN AREAS, CIRCA 1994)
Source: ECLAC (1997). See data appendix.
0
10
20
30
40
50
60
70
80
90
100
Brazil Chile Colombia Costa Rica Honduras Panama Paraguay Uruguay Venezuela Average
Ch
ildre
n w
ho
att
ain
at
leas
t 12
yea
rs o
f ed
uca
tio
n (
%)
0-5 years. 6-9 years. 10-12 years. 13 and more years
We can see that the greater the educational level of parents, the greater the proportion of children who attain12 years of schooling. This pattern is observed in each of the nine countries for which information is available.The most extreme situation is seen in Brazil, where only 7% of the children of parents with 0 to 5 years ofschooling completed at least 12 years of study. At the same time, in Brazil, all of the children of parents with13 or more years of education attained at least 12 years of education. That is, the educational gap betweenparents has an impact on current generations, perpetuating educational inequalities.
It is important that the educational system reverses these trends and diminishes the impact that the educationlevel of parents has on their children in low education households. In this sense, Chile shows the smallestgap for children of parents at different education levels, in spite of presenting high levels of inequality.
2.2. STRENGTHENING DEMOCRATIC INSTITUTIONS
In order to gauge the impact of education on the creation of a democratic and participatory political culture,numerous studies resort to the use of opinion surveys. Through these, they construct different indicators thatare linked to the issue of governability.
In effect, in order to measure governability, scales have been constructed that bring together informationregarding the dimensions of freedom of expression and its impact on public policies, political instability andviolence, government effectiveness, regulatory excess, applicability of the law, and corruption.65
65 Kaufmann, Kraay y Zoido-Lobaton (1999). “Aggregating Governance Indicators” World Bank, citado en Carlos Muñoz Izquierdo et. al. (2002)Desarrollo de una propuesta de indicadores del impacto social de la educación en América Latina y el Caribe. pg 26.

58
Information on the Americas shows that the phenomena observed ratify the hypotheses advanced. In effect,the indicators of electoral participation, freedom of expression, and their impact on public policies, politicalinstability and violence, applicability of the law, and corruption vary according to levels of schooling of theadult population, both in countries that have higher levels of schooling and in those which have lower levels.66
2.3. FERTILITY AND BIRTH RATESFigure 32 shows the relationship between years of schooling of the female population over 15 years of age,and fertility rates. We note the existence of an inverse relation between these variables. This shows the influenceof years of schooling on the number of children a woman has.
Fertility rates show the number of children that on average a woman has during her fertile period. This variesbetween 4 in Haiti, where the female population has on average 2.1 years of schooling, and 1.5 in Barbadosand Trinidad and Tobago, where the female population has on average 8.6 and 7.9 years of schooling,respectively.
FIGURE 32 FERTILITY RATES (2000-20005) AND AVERAGE SCHOOLINGOF THE FEMALE POPULATION OVER 15 YEARS OF AGESource: ECLAC estimates (2000) and Barro and Lee (2000).See data appendix.
66 Carlos Muñoz Izquierdo et. al. (2003) Desarrollo de una propuesta de indicadores del impacto social de la educación en AméricaLatina y el Caribe
0
1
2
3
4
5
2 3 4 5 6 7 8 9 10
Years of schooling
Fer
tilit
y ra
tes
(%)
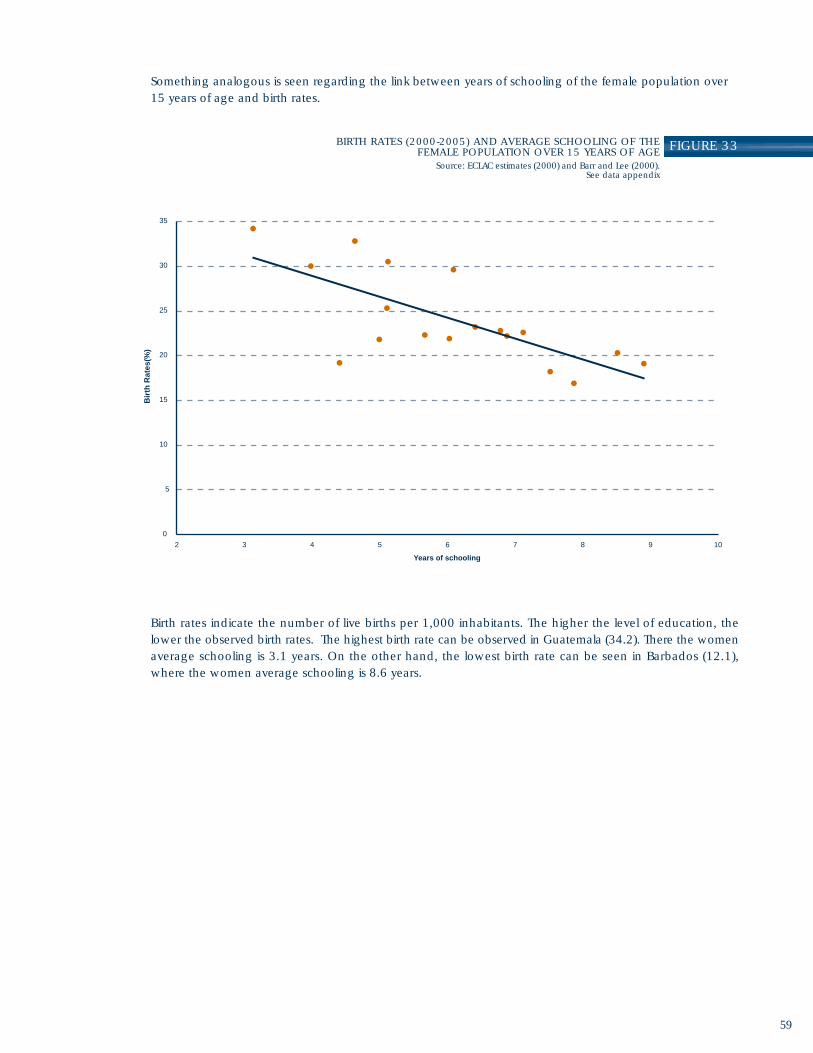
59
Something analogous is seen regarding the link between years of schooling of the female population over15 years of age and birth rates.
FIGURE 33BIRTH RATES (2000-2005) AND AVERAGE SCHOOLING OF THEFEMALE POPULATION OVER 15 YEARS OF AGE
Source: ECLAC estimates (2000) and Barr and Lee (2000).See data appendix
Birth rates indicate the number of live births per 1,000 inhabitants. The higher the level of education, thelower the observed birth rates. The highest birth rate can be observed in Guatemala (34.2). There the womenaverage schooling is 3.1 years. On the other hand, the lowest birth rate can be seen in Barbados (12.1),where the women average schooling is 8.6 years.
0
5
10
15
20
25
30
35
2 3 4 5 6 7 8 9 10
Years of schooling
Bir
th R
ates
(%)

60
2.4. INFANT MORTALITY AND PREVENTION
The acquisition of knowledge on hygiene, nutrition, and preventive medicine makes possible an improvementin the health of children, and reduce the risk of death at an early age.
Figure 34 shows the relationship between average schooling of women over 15 years of age and the infantmortality rate. This table shows the number of deaths of children (below 1 year of age) per 1,000 live birthsin each year.
FIGURE 34 INFANT MORTALITY RATES (2000-2005) AND AVERAGE SCHOOLINGOF THE FEMALE POPULATION OVER 15 YEARS OF AGE (1999)Source: ECLAC estimates (2000) and Barro and Lee (2000).See data appendix.
It can be observed that the higher the levels of schooling, the lower the infant mortality rates. This shows theimpact of the education of mothers on the health of their children. The infant mortality rate varies from 10.9in Costa Rica, where women have an average of 6 years of schooling, to 59.1 in Haiti, where the femalepopulation has an average of 2.1 years of schooling.
0
10
20
30
40
50
60
70
80
2 3 4 5 6 7 8 9 10
Years of schooling
Infa
nt
mo
rtal
ity
rate
s (%
)

61
CONCLUSIONS
The fulfillment of the goals set at the Summit of the Americas is essential for the development of our countriesand populations. Achieving universal primary education, improving access to secondary education, andproviding life-long educational opportunities are duties of all members of society. The quality of life of currentand future generations rely on the fulfillment of these goals. However, available information shows that muchremains to be done if we want to move, in the next seven years, towards reaching the Summit goals.
In the case of primary education, only a few countries have over 90% of its population with 6 or more yearsof schooling. Moreover, although there are no observed gender differences, the difference in years of schoolingare primarily geographic (urban versus rural). In this manner, while in urban areas, on average 90% of thepopulation between the ages of 15 and 24 has attained 6 years of schooling, in rural areas, the rates reachonly 65%. This highlights the importance of recognizing the geographic realities in each region when designingand implementing different educational policies.
At the same time, access is marked by geographic differences. Thus, higher access to primary education canbe observed in urban areas. It is worth noting that, in effect, access to primary education has attained significantlevels of expansion with the use of teaching methods with lower unitary costs, such as multi-grade schools.
Similarly, available evidence on levels of academic achievement make it clear that there are marked inequalitiesin what education systems offer to children from different socioeconomic backgrounds. In effect, educationsystems are not effectively fighting pre-existing social differences.
In the case of secondary education, these limitations are even more marked. The fact that, around 60% ofthe official-age youth are enrolled at secondary education jeopardizes achieving the goal of 75% enrollmentat this level. Moreover, levels of access and completion are associated with the countries’ wealth and benefitmainly urban populations. In fact, while in urban areas, on average 50% of the population between the agesof 15 and 24 has attained 10 years of schooling, in rural areas, the rates reach only 20%. Nevertheless, somecountries have developed forms of open or distance education (tele-secondary), making possible to havegreater levels of access to secondary education among dispersed populations than those possible throughin-class methods. In this sense, the new communication and information technologies have to be moreexploited.
Evidence on skill levels achieved by the population 15 years of age shows that, with exceptions, such asCanada and the United States, young people in the Americas are in a precarious position for successfully facingthe challenges of contemporary society.
All of the above argues for the need of more effective education policies that emphasize equity in access andcompletion, as well as in student achievement.

In this sense, education policies should focus on assuring that education systems provide learning for allchildren, allowing for them to overcome the adverse conditions they inherit. Thus, they may be better preparedto face the challenges of contemporary society.
Individuals with higher levels of human capital are able to attain a better quality of life because they have moreopportunities available to them. For this reason, education must be a permanent activity for all individuals andgo well beyond formal education. Providing lifelong learning opportunities recognizes an inherent humancondition. Consequently, social organizations must be willing to safeguard and readily provide these opportunities.Unfortunately, there is no empirical evidence regarding the regional progress in the provision of lifelong learningopportunities, which makes it very difficult to monitor the attainment of this third goal.
Finally it is important to remember that education is a basic human right. Its benefits are not limited to thosewho receive it directly, but rather touch upon the entire community. It has been shown that education hasa strong impact on the economic, social and political areas of the society. In addition, evidence analyzed hereshows that these effects are also present in the Americas. Education allows people to earn higher salaries, facelower unemployment rates, contributes to the creation of social networks, strengthens democratic institutions,improves the health of the population, and decreases the proportion of household living in poverty.Consequently, we must work together as a society to ensure that these goals become a reality that drives thework in our region and successfully catapults it into the realm of information and knowledge societies.
62

appendices
63

64
1998/1999 1999/2000 2000/2001Country Total M F Total M F Total M FAnguilla n.d. n.d. n.d. n.d. n.d. n.d. n.d. n.d. n.d.
Antigua & Barbuda n.d. n.d. n.d. n.d. n.d. n.d. n.d. n.d. n.d.
Netherland Antilles 95.8 95.7 96.0 89.8 87.7 92.1 88.1 88.7 87.5Argentina n.d. n.d. n.d. 92.2 92.1 92.3 n.d. n.d. n.d.
Aruba 94.8 95.7 93.8 85.9 80.6 91.5 91.4 92.8 89.9Bahamas 82.8 84.0 81.6 80.1 80.9 79.3 n.d. n.d. n.d.
Barbados 87.4 86.6 88.1 81.5 80.0 83.0 85.2 85.5 84.9
Belice 86.2 87.7 84.5 84.3 86.3 82.1 77.3 76.8 77.7Bermuda n.d. n.d. n.d. n.d. n.d. n.d. n.d. n.d. n.d.
Bolivia 65.0 64.8 65.3 68.0 67.7 68.4 67.1 66.2 68.0
Brazil n.d. n.d. n.d. n.d. n.d. n.d. n.d. n.d. n.d.
Canada n.d. n.d. n.d. n.d. n.d. n.d. n.d. n.d. n.d.
Chile 37.7 37.3 38.1 37.1 36.7 37.4 37.1 36.8 37.3Colombia 55.8 n.d. n.d. 57.3 58.1 56.3 58.7 60.0 57.3Costa Rica n.d. n.d. n.d. 59.1 58.2 60.1 60.7 60.6 60.8
Dominica n.d. n.d. n.d. n.d. n.d. n.d. n.d. n.d. n.d.
Dominican Rep. 60.9 60.7 61.0 62.6 62.8 62.4 62.9 63.1 62.7Ecuador 82.3 81.9 82.9 81.7 81.2 82.2 81.5 80.5 82.6El Salvador n.d. n.d. n.d. n.d. n.d. n.d. n.d. n.d. n.d.
Grenada n.d. n.d. n.d. n.d. n.d. n.d. 65.1 n.d. n.d.
Guatemala n.d. n.d. n.d. 56.2 57.8 54.5 60.7 62.0 59.2
Guyana 92.0 90.9 93.1 90.1 91.6 88.6 n.d. n.d. n.d.
Haiti n.d. n.d. n.d. n.d. n.d. n.d. n.d. n.d. n.d.
Honduras n.d. n.d. n.d. n.d. n.d. n.d. 48.5 48.5 48.6
Cayman Island n.d. n.d. n.d. n.d. n.d. n.d. n.d. n.d. n.d.
British Virgin Island n.d. n.d. n.d. n.d. n.d. n.d. n.d. n.d. n.d.
Jamaica n.d. n.d. n.d. 82.2 80.1 84.3 82.2 79.9 84.6Mexico n.d. n.d. n.d. n.d. n.d. n.d. 84.3 82.6 85.9Montserrat n.d. n.d. n.d. n.d. n.d. n.d. n.d. n.d. n.d.
Nicaragua n.d. n.d. n.d. 39.8 40.8 38.7 39.7 40.8 38.6
Panama n.d. n.d. n.d. 85.5 85.1 86.0 86.5 85.9 87.1Paraguay 70.8 69.7 71.9 68.7 67.4 70.0 71.2 70.4 71.9Peru n.d. n.d. n.d. 84.7 84.7 84.7 89.1 88.9 89.3St. Vicent & Grenadines n.d. n.d. n.d. n.d. n.d. n.d. n.d. n.d. n.d.
St. kitts and Nevis n.d. n.d. n.d. n.d. n.d. n.d. n.d. n.d. n.d.
St. Lucia 80.4 80.2 80.6 77.7 76.9 78.6 72.2 71.3 73.3
Suriname n.d. n.d. n.d. n.d. n.d. n.d. 75.1 79.1 70.8Trinidad & Tobago 69.1 68.9 69.4 67.7 68.3 67.1 66.3 65.8 66.9Turcos & Caicos n.d. n.d. n.d. n.d. n.d. n.d. n.d. n.d. n.d.
Uruguay 49.2 49.2 49.2 44.9 44.5 45.4 36.6 35.3 38.0USA n.d. n.d. n.d. n.d. n.d. n.d. n.d. n.d. n.d.
Venezuela n.d. n.d. n.d. 63.5 63.0 64.0 63.8 61.8 65.9
UIS estimationSource: UIS database (www.uis.unesco.org)The data corresponds to the academic years started in 1998, 1999 and 2000 finishing at thefollowing or the same year according to the respective academic calendarPrimary education is equivalent to ISCED 1
Table1:Net intake rate to first grade of primary education (1998-2000)

65
1998/1999 1999/2000 2000/2001Country Total M F Total M F Total M FAnguilla n.d. n.d. n.d. n.d. n.d. n.d. n.d. n.d. n.d.
Antigua & Barbuda n.d. n.d. n.d. n.d. n.d. n.d. n.d. n.d. n.d.
Netherland Antilles 96.2 95.7 96.7 95.0 94.6 95.5 91.2 96.2 86.1
Argentina 100.0 100.0 100.0 99.9 100.0 99.8 99.7 100.0 99.4Aruba 97.8 97.4 98.1 99.6 100.0 99.2 97.0 97.5 96.4
Bahamas 87.8 87.8 87.8 82.8 86.0 79.5 n.d. n.d. n.d.
Barbados 99.6 100.0 99.2 99.7 99.4 100.0 99.7 99.4 100.0
Belize 99.9 100.0 99.7 99.8 100.0 99.6 98.2 96.4 100.0Bermuda n.d. n.d. n.d. n.d. n.d. n.d. n.d. n.d. n.d.
Bolivia 97.6 97.8 97.4 97.9 98.0 97.8 96.9 96.8 97.1Brazil n.d. n.d. n.d. 96.5 99.8 93.2 96.7 100.0 93.3
Canada 97.2 97.1 97.2 98.6 98.5 98.8 99.8 99.7 99.9Chile 87.9 88.4 87.4 88.9 89.4 88.4 88.8 89.4 88.3
Colombia 86.7 n.d. n.d. 88.1 88.2 88.1 88.5 88.7 88.3Costa Rica n.d. n.d. n.d. 91.3 91.4 91.1 91.1 91.1 91.1
Dominica n.d. n.d. n.d. n.d. n.d. n.d. n.d. n.d. n.d.
Dominican Rep. 88.2 87.4 89.1 90.6 89.8 91.4 92.5 91.7 93.3Ecuador 96.7 96.2 97.2 97.7 97.4 98.0 99.3 98.8 99.8
El Salvador 80.6 74.3 87.2 80.9 74.5 87.5 n.d. n.d. n.d.
Grenada 98.1 n.d. n.d. 73.4 n.d. n.d. 84.2 n.d. n.d.
Guatemala 76.5 79.1 73.9 81.1 83.7 78.4 84.3 86.4 82.1
Guyana 97.2 100.0 94.3 97.9 99.2 96.7 n.d. n.d. n.d.
Haiti n.d. n.d. n.d. n.d. n.d. n.d. n.d. n.d. n.d.
Honduras n.d. n.d. n.d. n.d. n.d. n.d. 87.6 86.8 88.4
Cayman Island n.d. n.d. n.d. n.d. n.d. n.d. n.d. n.d. n.d.
British Virgin Island n.d. n.d. n.d. n.d. n.d. n.d. n.d. n.d. n.d.
Jamaica 90.2 90.1 90.3 94.2 94.3 94.1 94.9 94.9 95.0
Mexico 99.6 99.1 100.0 99.5 99.0 100.0 99.4 98.8 100.0
Montserrat n.d. n.d. n.d. n.d. n.d. n.d. n.d. n.d. n.d.
Nicaragua 77.9 76.9 79.0 79.4 79.0 79.8 80.7 80.3 81.2
Panama 98.0 98.1 97.9 98.0 98.1 97.9 99.9 99.8 100.0
Paraguay 91.7 91.3 92.0 91.5 91.3 91.7 92.1 91.8 92.5
Peru 99.7 100.0 99.4 99.8 100.0 99.6 99.9 100.0 99.7
St. Kitts and Nevis n.d. n.d. n.d. n.d. n.d. n.d. n.d. n.d. n.d.
St. Vicent & Grenadinas n.d. n.d. n.d. n.d. n.d. n.d. n.d. n.d. n.d.
St. Lucia 96.5 96.6 96.4 99.7 99.8 99.5 99.7 99.5 100.0
Suriname n.d. n.d. n.d. n.d. n.d. n.d. 98.4 97.0 100.0Trinidad & Tobago 92.8 92.8 92.9 92.9 93.1 92.8 92.4 92.5 92.4
Turks & Caicos n.d. n.d. n.d. n.d. n.d. n.d. n.d. n.d. n.d.
Uruguay n.d. n.d. n.d. n.d. n.d. n.d. 90.4 90.0 90.8USA 94.3 94.3 94.2 94.6 94.7 94.6 94.9 94.3 95.6
Venezuela 86.1 85.6 86.6 88.0 87.5 88.5 88.0 87.1 88.9
Table 2:Net enrollment rate to primary education (1998-2000)
UIS estimationNational estimationSource: UIS database (www.uis.unesco.org)The data corresponds to the academic years started in 1998, 1999 and 2000 finishing at thefollowing or the same year according to the respective academic calendarPrimary education is equivalent to ISCED 1
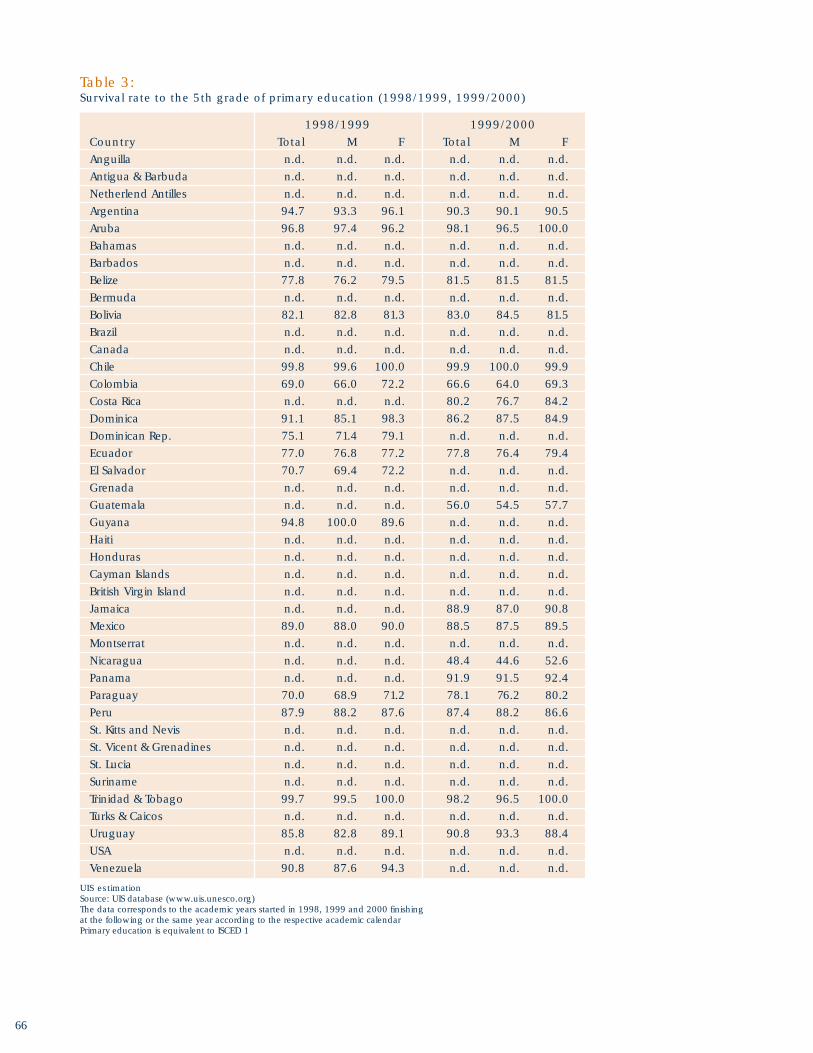
66
UIS estimationSource: UIS database (www.uis.unesco.org)The data corresponds to the academic years started in 1998, 1999 and 2000 finishingat the following or the same year according to the respective academic calendarPrimary education is equivalent to ISCED 1
Table 3:Survival rate to the 5th grade of primary education (1998/1999, 1999/2000)
1998/1999 1999/2000Country Total M F Total M FAnguilla n.d. n.d. n.d. n.d. n.d. n.d.
Antigua & Barbuda n.d. n.d. n.d. n.d. n.d. n.d.
Netherlend Antilles n.d. n.d. n.d. n.d. n.d. n.d.
Argentina 94.7 93.3 96.1 90.3 90.1 90.5
Aruba 96.8 97.4 96.2 98.1 96.5 100.0
Bahamas n.d. n.d. n.d. n.d. n.d. n.d.
Barbados n.d. n.d. n.d. n.d. n.d. n.d.
Belize 77.8 76.2 79.5 81.5 81.5 81.5
Bermuda n.d. n.d. n.d. n.d. n.d. n.d.
Bolivia 82.1 82.8 81.3 83.0 84.5 81.5Brazil n.d. n.d. n.d. n.d. n.d. n.d.
Canada n.d. n.d. n.d. n.d. n.d. n.d.
Chile 99.8 99.6 100.0 99.9 100.0 99.9
Colombia 69.0 66.0 72.2 66.6 64.0 69.3
Costa Rica n.d. n.d. n.d. 80.2 76.7 84.2
Dominica 91.1 85.1 98.3 86.2 87.5 84.9
Dominican Rep. 75.1 71.4 79.1 n.d. n.d. n.d.
Ecuador 77.0 76.8 77.2 77.8 76.4 79.4
El Salvador 70.7 69.4 72.2 n.d. n.d. n.d.
Grenada n.d. n.d. n.d. n.d. n.d. n.d.
Guatemala n.d. n.d. n.d. 56.0 54.5 57.7
Guyana 94.8 100.0 89.6 n.d. n.d. n.d.
Haiti n.d. n.d. n.d. n.d. n.d. n.d.
Honduras n.d. n.d. n.d. n.d. n.d. n.d.
Cayman Islands n.d. n.d. n.d. n.d. n.d. n.d.
British Virgin Island n.d. n.d. n.d. n.d. n.d. n.d.
Jamaica n.d. n.d. n.d. 88.9 87.0 90.8
Mexico 89.0 88.0 90.0 88.5 87.5 89.5
Montserrat n.d. n.d. n.d. n.d. n.d. n.d.
Nicaragua n.d. n.d. n.d. 48.4 44.6 52.6
Panama n.d. n.d. n.d. 91.9 91.5 92.4
Paraguay 70.0 68.9 71.2 78.1 76.2 80.2Peru 87.9 88.2 87.6 87.4 88.2 86.6
St. Kitts and Nevis n.d. n.d. n.d. n.d. n.d. n.d.
St. Vicent & Grenadines n.d. n.d. n.d. n.d. n.d. n.d.
St. Lucia n.d. n.d. n.d. n.d. n.d. n.d.
Suriname n.d. n.d. n.d. n.d. n.d. n.d.
Trinidad & Tobago 99.7 99.5 100.0 98.2 96.5 100.0
Turks & Caicos n.d. n.d. n.d. n.d. n.d. n.d.
Uruguay 85.8 82.8 89.1 90.8 93.3 88.4
USA n.d. n.d. n.d. n.d. n.d. n.d.
Venezuela 90.8 87.6 94.3 n.d. n.d. n.d.

67
1998/1999 1999/2000 2000/2001Country Total M F Total M F Total M FAnguilla n.d. n.d. n.d. n.d. n.d. n.d. n.d. n.d. n.d.
Antigua & Barbuda n.d. n.d. n.d. n.d. n.d. n.d. n.d. n.d. n.d.
Netherland Antilles 78.3 71.9 84.7 67.9 62.5 73.4 65.8 57.2 74.6
Argentina 73.7 71.1 76.3 76.0 72.9 79.2 79.1 76.6 81.6Aruba 79.3 76.5 82.1 80.0 78.2 81.7 72.1 70.3 73.8
Bahamas n.d. n.d. n.d. 86.0 85.1 86.9 n.d. n.d. n.d.
Barbados 88.3 86.3 90.3 89.7 90.2 89.2 85.0 86.1 83.7
Belize n.d. n.d. n.d. 61.9 59.7 64.2 63.3 61.1 65.5
Bermuda n.d. n.d. n.d. n.d. n.d. n.d. n.d. n.d. n.d.
Bolivia 61.6 63.8 59.3 n.d. n.d. n.d. 68.1 68.9 67.4Brazil n.d. n.d. n.d. 68.5 65.7 71.3 71.3 68.7 74.0
Canada 94.0 94.3 93.7 97.9 97.6 98.2 97.8 97.6 98.0Chile 70.3 68.8 71.9 n.d. n.d. n.d. 74.5 73.5 75.6
Colombia n.d. n.d. n.d. 54.3 51.5 57.1 56.5 53.9 59.3Costa Rica n.d. n.d. n.d. 43.4 40.8 46.0 49.2 46.8 51.8
Dominica n.d. n.d. n.d. n.d. n.d. n.d. n.d. n.d. n.d.
Dominican Rep. 39.5 34.6 44.6 40.0 35.2 45.0 40.2 35.4 45.2Ecuador 45.9 45.2 46.7 46.9 46.2 47.6 48.1 47.2 48.9
El Salvador 39.3 39.5 39.0 n.d. n.d. n.d. n.d. n.d. n.d.
Grenada 46.7 n.d. n.d. n.d. n.d. n.d. 45.5 n.d. n.d.
Guatemala 21.3 21.8 20.8 23.0 24.4 21.6 26.2 27.0 25.4Guyana 73.3 70.4 76.2 86.4 84.3 88.6 n.d. n.d. n.d.
Haiti n.d. n.d. n.d. n.d. n.d. n.d. n.d. n.d. n.d.
Honduras n.d. n.d. n.d. n.d. n.d. n.d. n.d. n.d. n.d.
Cayman Island n.d. n.d. n.d. n.d. n.d. n.d. n.d. n.d. n.d.
British Virgin Island n.d. n.d. n.d. n.d. n.d. n.d. n.d. n.d. n.d.
Jamaica 73.9 73.4 74.5 74.7 73.1 76.3 74.4 72.8 76.0
Mexico 56.0 56.1 56.0 57.4 57.2 57.6 59.7 57.3 62.1Montserrat n.d. n.d. n.d. n.d. n.d. n.d. n.d. n.d. n.d.
Nicaragua n.d. n.d. n.d. n.d. n.d. n.d. 35.5 32.6 38.5
Panama 61.7 59.8 63.7 60.9 58.2 63.7 62.2 59.5 65.0Paraguay 42.1 40.7 43.4 45.0 43.8 46.3 46.7 45.3 48.1Peru 61.5 62.2 60.7 n.d. n.d. n.d. 65.4 66.6 64.2St. Kitts and Nevis n.d. n.d. n.d. n.d. n.d. n.d. n.d. n.d. n.d.
St. Vicent & Grenadines n.d. n.d. n.d. n.d. n.d. n.d. n.d. n.d. n.d.
Santa Lucia n.d. n.d. n.d. 67.4 61.8 72.9 70.8 61.7 79.7
Suriname n.d. n.d. n.d. n.d. n.d. n.d. 61.0 55.1 67.2Trinidad & Tobago 72.5 70.0 75.0 65.8 64.4 67.2 70.7 68.4 73.0
Turks & Caicos n.d. n.d. n.d. n.d. n.d. n.d. n.d. n.d. n.d.
Uruguay n.d. n.d. n.d. n.d. n.d. n.d. 69.9 66.3 73.7USA 86.9 n.d. n.d. 87.4 86.5 88.4 88.1 87.2 89.1
Venezuela 48.1 43.1 53.3 50.4 45.9 55.0 50.4 45.8 55.1
UIS estimationNational estimationSource: UIS database (www.uis.unesco.org)The data corresponds to the academic years started in 1998, 1999 and 2000 finishing at the followingor the same year according to the respective academic calendarSecondary education is equivalent to ISCED 2 and 3
Table 4:Net enrollment rate to secondary education (1998-2000)

68
Country Urban RuralAnguilla 12.0 88.0
Antigua & Barbuda 36.8 63.2
Netherland Antilles 70.4 29.6
Argentina 89.6 10.4
Aruba n.d. n.d.
Bahamas 88.5 11.5
Barbados 50.0 50.0
Belize 54.2 45.8
Bermuda 100.0 0.0
Bolivia 64.6 35.4
Brazil 79.9 20.1
Canada n.d. n.d.
Chile 85.7 14.3
Colombia 74.5 25.5
Costa Rica 50.4 49.6
Dominica 71.0 29.0
Dominican Rep. 60.2 39.8
Ecuador 62.7 37.3
El Salvador 55.2 44.8
Grenada 37.9 62.1
Guatemala 39.4 60.6
Guyana 38.2 61.8
Haiti 38.1 61.9
Honduras 48.2 51.8
Cayman Island 100.0 0.0
British Virgin Island 61.1 38.9
Jamaica 56.1 43.9
Mexico 75.4 24.6
Montserrat 18.4 81.6
Nicaragua 55.3 44.7
Panama 57.6 42.4
Paraguay 56.1 43.9
Peru 72.3 27.7
St. Kitts and Nevis 34.1 65.9
St. Vincent & Grenadines 54.8 45.2
St. Lucia 37.8 62.2
Suriname 74.2 25.8
Trinidad & Tobago 74.1 25.9
Turks and Caicos 45.2 54.8
Uruguay 92.6 7.4
USA n.d. n.d.
Venezuela 87.4 12.6
Table 5:Distribution of the population byarea of residence (2000). In percentage.
Source: United Nations Population Division, WorldUrbanization Prospects: The 1999 Revision for the CaribbeanCELADE. Boletín demográfico 63 (January 1999) for Latin America
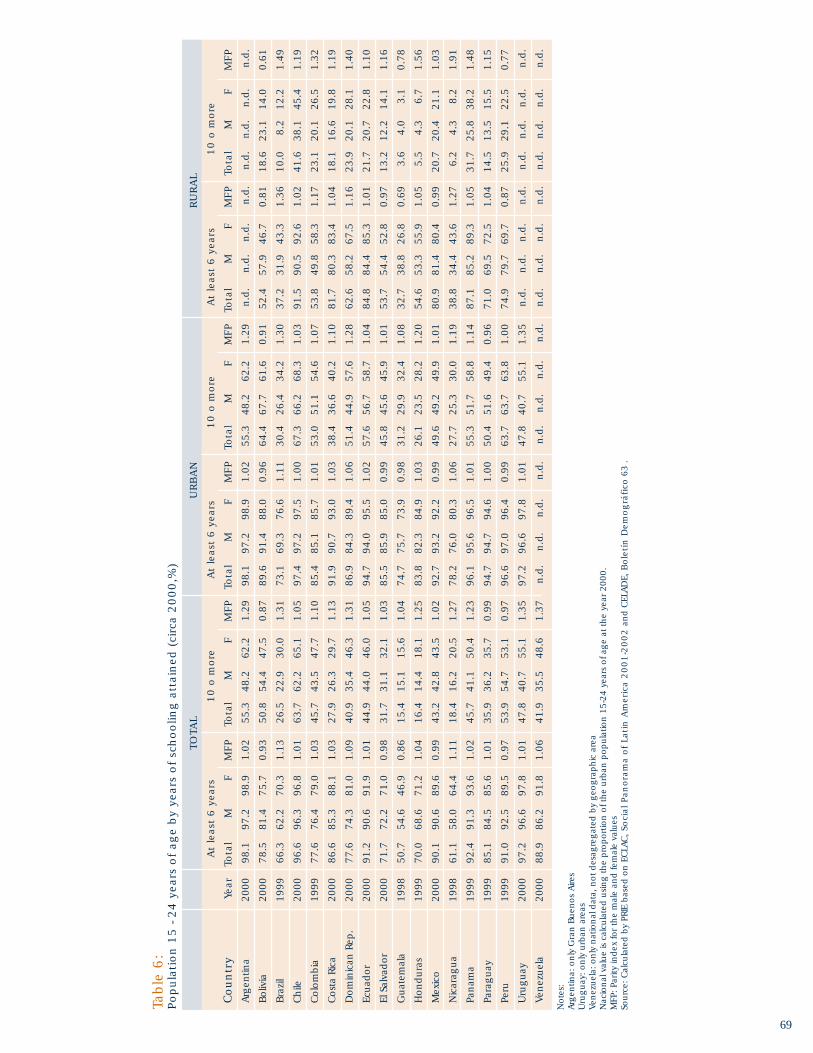
69
Country Urban RuralAnguilla 12.0 88.0
Antigua & Barbuda 36.8 63.2
Netherland Antilles 70.4 29.6
Argentina 89.6 10.4
Aruba n.d. n.d.
Bahamas 88.5 11.5
Barbados 50.0 50.0
Belize 54.2 45.8
Bermuda 100.0 0.0
Bolivia 64.6 35.4
Brazil 79.9 20.1
Canada n.d. n.d.
Chile 85.7 14.3
Colombia 74.5 25.5
Costa Rica 50.4 49.6
Dominica 71.0 29.0
Dominican Rep. 60.2 39.8
Ecuador 62.7 37.3
El Salvador 55.2 44.8
Grenada 37.9 62.1
Guatemala 39.4 60.6
Guyana 38.2 61.8
Haiti 38.1 61.9
Honduras 48.2 51.8
Cayman Island 100.0 0.0
British Virgin Island 61.1 38.9
Jamaica 56.1 43.9
Mexico 75.4 24.6
Montserrat 18.4 81.6
Nicaragua 55.3 44.7
Panama 57.6 42.4
Paraguay 56.1 43.9
Peru 72.3 27.7
St. Kitts and Nevis 34.1 65.9
St. Vincent & Grenadines 54.8 45.2
St. Lucia 37.8 62.2
Suriname 74.2 25.8
Trinidad & Tobago 74.1 25.9
Turks and Caicos 45.2 54.8
Uruguay 92.6 7.4
USA n.d. n.d.
Venezuela 87.4 12.6
No
tes:
Arg
entin
a: o
nly
Gra
n B
uen
os
Aire
sU
rug
uay
: on
ly u
rban
are
as
Ven
ezu
ela:
on
ly n
atio
nal
dat
a, n
ot
des
agre
gat
ed b
y g
eog
rap
hic
are
aN
acio
nal
val
ue
is c
alcu
late
d u
sin
g t
he
pro
po
rtio
n o
f th
e u
rban
po
pu
latio
n 1
5-24
yea
rs o
f ag
e at
th
e ye
ar 2
000.
M
FP: P
arity
ind
ex fo
r th
e m
ale
and
fem
ale
valu
esSo
urc
e: C
alcu
late
d b
y PR
IE b
ased
on
EC
LAC
, Soci
al P
anora
ma
of
Lati
n A
mer
ica
20
01
-20
02
an
d C
ELA
DE,
Bole
tín
Dem
og
ráfico
63
.
Table
6:
Popula
tion
15
- 2
4 y
ears
of
age
by
year
s of
sch
oolin
g a
ttai
ned
(ci
rca
20
00
,%)
TOTA
LU
RB
AN
RU
RA
L
At
leas
t 6
yea
rs1
0 o
more
At
leas
t 6
yea
rs
10
o m
ore
At
leas
t 6
yea
rs
10
o m
ore
Coun
try
Year
Tota
lM
FM
FPTo
tal
MF
MFP
Tota
lM
FM
FPTo
tal
MF
MFP
Tota
lM
FM
FPTo
tal
MF
MFP
Arg
entin
a20
0098
.197
.298
.91.
0255
.348
.262
.21.
2998
.197
.298
.91.
0255
.348
.262
.21.
29n
.d.
n.d
.n
.d.
n.d
.n
.d.
n.d
.n
.d.
n.d
.
Bo
livia
2000
78.5
81.4
75.7
0.93
50.8
54.4
47.5
0.87
89.6
91.4
88.0
0.96
64.4
67.7
61.6
0.91
52.4
57.9
46.7
0.81
18.6
23.1
14.0
0.61
Bra
zil
1999
66.3
62.2
70.3
1.13
26.5
22.9
30.0
1.31
73.1
69.3
76.6
1.11
30.4
26.4
34.2
1.30
37.2
31.9
43.3
1.36
10.0
8.2
12.2
1.49
Ch
ile20
0096
.696
.396
.81.
0163
.762
.265
.11.
0597
.497
.297
.51.
0067
.366
.268
.31.
0391
.590
.592
.61.
0241
.638
.145
.41.
19
Co
lom
bia
1999
77.6
76.4
79.0
1.03
45.7
43.5
47.7
1.10
85.4
85.1
85.7
1.01
53.0
51.1
54.6
1.07
53.8
49.8
58.3
1.17
23.1
20.1
26.5
1.32
Co
sta
Rica
2000
86.6
85.3
88.1
1.03
27.9
26.3
29.7
1.13
91.9
90.7
93.0
1.03
38.4
36.6
40.2
1.10
81.7
80.3
83.4
1.04
18.1
16.6
19.8
1.19
Do
min
ican
Rep
.20
0077
.674
.381
.01.
0940
.935
.446
.31.
3186
.984
.389
.41.
0651
.444
.957
.61.
2862
.658
.267
.51.
1623
.920
.128
.11.
40
Ecu
ado
r20
0091
.290
.691
.91.
0144
.944
.046
.01.
0594
.794
.095
.51.
0257
.656
.758
.71.
0484
.884
.485
.31.
0121
.720
.722
.81.
10
El S
alva
do
r20
0071
.772
.271
.00.
9831
.731
.132
.11.
0385
.585
.985
.00.
9945
.845
.645
.91.
0153
.754
.452
.80.
9713
.212
.214
.11.
16
Gu
atem
ala
1998
50.7
54.6
46.9
0.86
15.4
15.1
15.6
1.04
74.7
75.7
73.9
0.98
31.2
29.9
32.4
1.08
32.7
38.8
26.8
0.69
3.6
4.0
3.1
0.78
Ho
nd
ura
s19
9970
.068
.671
.21.
0416
.414
.418
.11.
2583
.882
.384
.91.
0326
.123
.528
.21.
2054
.653
.355
.91.
055.
54.
36.
71.
56
Mex
ico
2000
90.1
90.6
89.6
0.99
43.2
42.8
43.5
1.02
92.7
93.2
92.2
0.99
49.6
49.2
49.9
1.01
80.9
81.4
80.4
0.99
20.7
20.4
21.1
1.03
Nic
arag
ua
1998
61.1
58.0
64.4
1.11
18.4
16.2
20.5
1.27
78.2
76.0
80.3
1.06
27.7
25.3
30.0
1.19
38.8
34.4
43.6
1.27
6.2
4.3
8.2
1.91
Pan
ama
1999
92.4
91.3
93.6
1.02
45.7
41.1
50.4
1.23
96.1
95.6
96.5
1.01
55.3
51.7
58.8
1.14
87.1
85.2
89.3
1.05
31.7
25.8
38.2
1.48
Para
gu
ay19
9985
.184
.585
.61.
0135
.936
.235
.70.
9994
.794
.794
.61.
0050
.451
.649
.40.
9671
.069
.572
.51.
0414
.513
.515
.51.
15
Peru
1999
91.0
92.5
89.5
0.97
53.9
54.7
53.1
0.97
96.6
97.0
96.4
0.99
63.7
63.7
63.8
1.00
74.9
79.7
69.7
0.87
25.9
29.1
22.5
0.77
Uru
gu
ay20
0097
.296
.697
.81.
0147
.840
.755
.11.
3597
.296
.697
.81.
0147
.840
.755
.11.
35n
.d.
n.d
.n
.d.
n.d
.n
.d.
n.d
.n
.d.
n.d
.
Ven
ezu
ela
2000
88.9
86.2
91.8
1.06
41.9
35.5
48.6
1.37
n.d
.n
.d.
n.d
.n
.d.
n.d
.n
.d.
n.d
.n
.d.
n.d
.n
.d.
n.d
.n
.d.
n.d
.n
.d.
n.d
.n
.d.
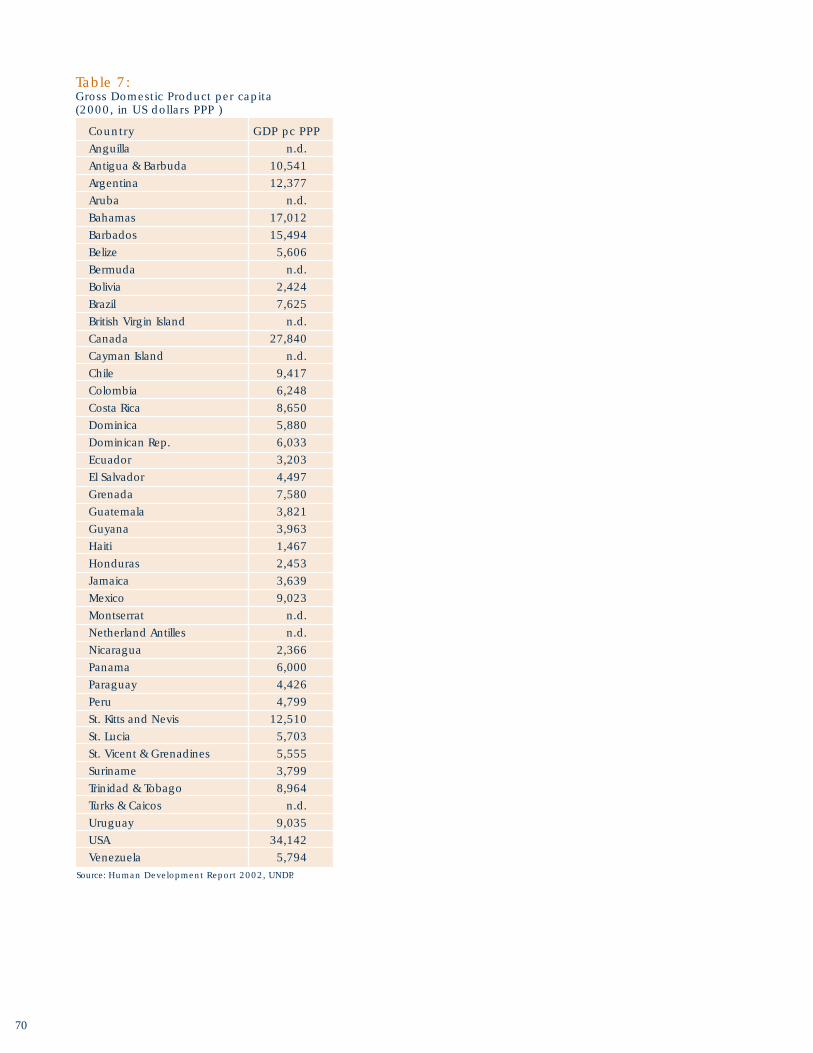
70
Country GDP pc PPPAnguilla n.d.
Antigua & Barbuda 10,541
Argentina 12,377
Aruba n.d.
Bahamas 17,012
Barbados 15,494
Belize 5,606
Bermuda n.d.
Bolivia 2,424
Brazil 7,625
British Virgin Island n.d.
Canada 27,840
Cayman Island n.d.
Chile 9,417
Colombia 6,248
Costa Rica 8,650
Dominica 5,880
Dominican Rep. 6,033
Ecuador 3,203
El Salvador 4,497
Grenada 7,580
Guatemala 3,821
Guyana 3,963
Haiti 1,467
Honduras 2,453
Jamaica 3,639
Mexico 9,023
Montserrat n.d.
Netherland Antilles n.d.
Nicaragua 2,366
Panama 6,000
Paraguay 4,426
Peru 4,799
St. Kitts and Nevis 12,510
St. Lucia 5,703
St. Vicent & Grenadines 5,555
Suriname 3,799
Trinidad & Tobago 8,964
Turks & Caicos n.d.
Uruguay 9,035
USA 34,142
Venezuela 5,794
Table 7:Gross Domestic Product per capita(2000, in US dollars PPP )
Source: Human Development Report 2002, UNDP.

71
Table 8:Percentage of students who reach each performance level bysubject matter and disaggregations. LLECE 1997.
LENGUAJE
Public Private Megacity Urban Rural
Country Level I Level II Level III Level I Level II Level III Level I Level II Level III Level I Level II Level III Level I Level II Level III
Argentina 95 77 57 99 93 78 96 85 72 96 79 59 88 62 42
Bolivia 87 55 30 91 70 46 90 66 39 87 58 35 77 40 24
Brazil 95 80 54 98 93 72 96 88 62 95 82 58 84 62 38
Chile 93 71 49 97 86 67 94 76 53 95 79 60 89 63 41
Colombia 89 59 35 97 81 56 96 79 53 89 60 36 89 57 33
Cuba 100 98 92 n.a. n.a. n.a. 100 99 93 100 98 92 100 98 92
Dominican Rep. 77 52 30 83 64 42 84 65 42 73 44 25 73 39 20
Honduras 87 55 29 94 73 44 92 67 38 87 55 29 78 35 17
Mexico 89 58 38 96 84 65 94 70 50 89 64 43 82 48 30
Paraguay 88 60 37 93 75 54 n.a. n.a. n.a. 90 67 44 81 51 32
Peru 86 55 29 94 78 54 92 70 43 86 57 34 71 30 13
Venezuela 88 59 38 91 70 49 91 68 48 88 60 38 84 58 39
MATHEMATICS
Public Private Megacity Urban Rural
Country Level I Level II Level III Level I Level II Level III Level I Level II Level III Level I Level II Level III Level I Level II Level III
Argentina 96 54 12 98 71 23 98 70 26 96 54 11 94 43 6
Bolivia 93 43 9 96 59 18 95 49 12 94 51 14 89 36 8
Brazil 93 52 12 97 67 26 96 58 17 94 55 15 84 40 7
Chile 92 46 7 97 57 15 94 49 10 95 52 12 87 38 6
Colombia 93 42 5 97 55 10 97 53 8 93 43 6 92 50 12
Cuba 100 92 79 n.a. n.a. n.a. 100 95 82 99 90 76 99 89 72
Dominican Rep. 82 37 4 86 43 7 86 42 6 81 36 4 79 38 7
Honduras 84 36 7 93 39 5 87 35 3 86 39 8 78 23 13
Mexico 94 55 10 98 69 20 97 62 13 94 58 13 90 46 10
Paraguay 87 29 2 90 49 12 n.a. n.a. n.a. 88 42 9 82 34 8
Peru 87 29 2 94 54 11 88 43 8 89 33 4 78 23 2
Venezuela 76 25 2 76 33 5 75 26 3 77 27 3 68 22 2
Source: UNESCO (2001) Technical Report of the First International Comparative Study. August 2001. Accessible at www.unesco.cl

72
Table 9:Percentage of students by achievement levels in the reading combined scale PISA 2000.
Source: PISA (2003) Literacy skills for the world of tomorrow - further results from PISA 2000.
Country Level V Level IV Level III Level II Level I Below level IArgentina 2 9 20 26 21 23
Brazil 1 3 13 28 33 23
Canada 17 28 28 18 7 2
Chile 1 5 17 30 28 20
Mexico 1 6 19 30 28 16
Peru 0 1 5 15 26 54
USA 12 21 27 21 12 6
OECD Average 9 22 29 22 12 6
Table 10:Average score by gender and differencein the reading combined scale PISA 2000.
Source: PISA (2003) Literacy skills for the worldof tomorrow - further results from PISA 2000.
Country Dif M FArgentina 44 393 437
Brazil 16 388 404
Canada 32 519 551
Chile 25 396 421
Mexico 21 411 432
Peru 6 324 330
USA 28 490 518
Table 11:Rate of return to education byeducational level, urban areas (1999)
Source: Social Panorama of Latin America. ECLAC (2002)Group A: Argentina, Bolivia, Chile, Colombia and PanamaGroup B: Costa Rica, Ecuador, Mexico, Paraguay, Uruguay and VenezuelaGroup C: Brazil, El Salvador, Guatemala, Honduras and Nicaragua.
Group of Countries Primary education Secondary education Higher education
Group A 4.4 8.7 17.8
Group B 6.1 9.5 14.9
Group C 7.6 13.8 18.1
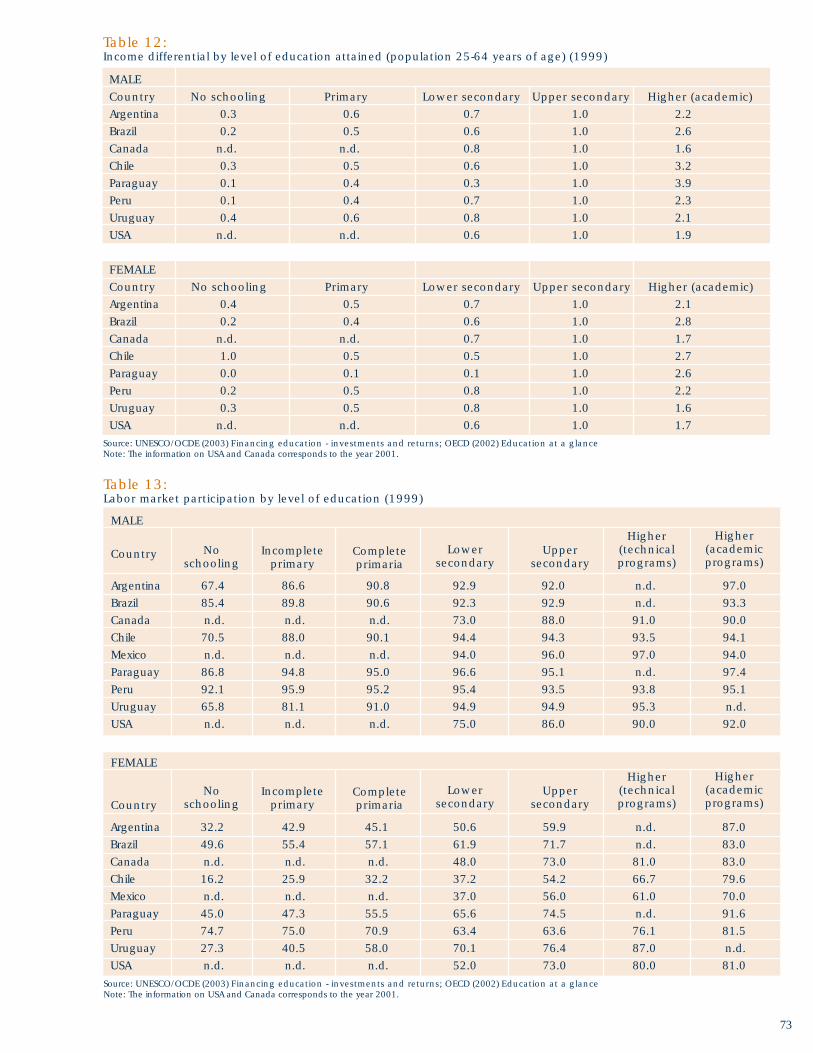
73
Table 12:Income differential by level of education attained (population 25-64 years of age) (1999)
Source: UNESCO/OCDE (2003) Financing education - investments and returns; OECD (2002) Education at a glanceNote: The information on USA and Canada corresponds to the year 2001.
MALECountry No schooling Primary Lower secondary Upper secondary Higher (academic)Argentina 0.3 0.6 0.7 1.0 2.2
Brazil 0.2 0.5 0.6 1.0 2.6
Canada n.d. n.d. 0.8 1.0 1.6
Chile 0.3 0.5 0.6 1.0 3.2
Paraguay 0.1 0.4 0.3 1.0 3.9
Peru 0.1 0.4 0.7 1.0 2.3
Uruguay 0.4 0.6 0.8 1.0 2.1
USA n.d. n.d. 0.6 1.0 1.9
FEMALECountry No schooling Primary Lower secondary Upper secondary Higher (academic)Argentina 0.4 0.5 0.7 1.0 2.1
Brazil 0.2 0.4 0.6 1.0 2.8
Canada n.d. n.d. 0.7 1.0 1.7
Chile 1.0 0.5 0.5 1.0 2.7
Paraguay 0.0 0.1 0.1 1.0 2.6
Peru 0.2 0.5 0.8 1.0 2.2
Uruguay 0.3 0.5 0.8 1.0 1.6
USA n.d. n.d. 0.6 1.0 1.7
Table 13:Labor market participation by level of education (1999)
Source: UNESCO/OCDE (2003) Financing education - investments and returns; OECD (2002) Education at a glanceNote: The information on USA and Canada corresponds to the year 2001.
Argentina 32.2 42.9 45.1 50.6 59.9 n.d. 87.0
Brazil 49.6 55.4 57.1 61.9 71.7 n.d. 83.0
Canada n.d. n.d. n.d. 48.0 73.0 81.0 83.0
Chile 16.2 25.9 32.2 37.2 54.2 66.7 79.6
Mexico n.d. n.d. n.d. 37.0 56.0 61.0 70.0
Paraguay 45.0 47.3 55.5 65.6 74.5 n.d. 91.6
Peru 74.7 75.0 70.9 63.4 63.6 76.1 81.5
Uruguay 27.3 40.5 58.0 70.1 76.4 87.0 n.d.
USA n.d. n.d. n.d. 52.0 73.0 80.0 81.0
Country
FEMALE
Argentina 67.4 86.6 90.8 92.9 92.0 n.d. 97.0
Brazil 85.4 89.8 90.6 92.3 92.9 n.d. 93.3
Canada n.d. n.d. n.d. 73.0 88.0 91.0 90.0
Chile 70.5 88.0 90.1 94.4 94.3 93.5 94.1
Mexico n.d. n.d. n.d. 94.0 96.0 97.0 94.0
Paraguay 86.8 94.8 95.0 96.6 95.1 n.d. 97.4
Peru 92.1 95.9 95.2 95.4 93.5 93.8 95.1
Uruguay 65.8 81.1 91.0 94.9 94.9 95.3 n.d.
USA n.d. n.d. n.d. 75.0 86.0 90.0 92.0
Country
Higher(academicprograms)
Higher(technicalprograms)
Uppersecondary
Lowersecondary
Completeprimaria
Incompleteprimary
Noschooling
MALE
Higher(academicprograms)
Higher(technicalprograms)
Uppersecondary
Lowersecondary
Completeprimaria
Incompleteprimary
Noschooling

74
Table 15:Percentage of the poor or extremely poor populations and averageyears of schooling for the 25-59 age-group (circa 2000, urban areas)
Argentina 10.2 23.7 6.7
Bolivia 9.6 48.7 19.8
Brazil 7.0 32.9 9.3
Colombia 8.6 50.6 21.9
Costa Rica 9.1 18.1 5.4
Chile 10.8 20.1 5.3
Dominican Rep. 8.9 35.6 11.8
Ecuador 9.8 63.6 31.3
El Salvador 8.3 38.7 13.0
Guatemala 6.5 46.0 17.2
Honduras 7.3 71.7 42.9
Mexico 9.0 32.3 6.6
Nicaragua 7.0 57.0 33.9
Panama 10.4 25.8 8.1
Paraguay 9.3 49.0 17.4
Peru 10.1 36.1 9.3
Uruguay 9.2 9.4 1.8
Notes:Argentina: Great Buenos Aires onlyParaguay: Asunción onlySource: ECLAC (2002) Sociol Panorama of Latin America 2001-2002.
Country
Averageyears of
schooling
Populationbelow poverty
line
Populationbelow line of
extreme poverty
MALECountry No schooling Primary Lower secondary Upper secondary Higher (academic)Argentina 0.3 0.6 0.7 1.0 2.2
Brazil 0.2 0.5 0.6 1.0 2.6
Canada n.d. n.d. 0.8 1.0 1.6
Chile 0.3 0.5 0.6 1.0 3.2
Paraguay 0.1 0.4 0.3 1.0 3.9
Peru 0.1 0.4 0.7 1.0 2.3
Uruguay 0.4 0.6 0.8 1.0 2.1
USA n.d. n.d. 0.6 1.0 1.9
FEMALECountry No schooling Primary Lower secondary Upper secondary Higher (academic)Argentina 0.4 0.5 0.7 1.0 2.1
Brazil 0.2 0.4 0.6 1.0 2.8
Canada n.d. n.d. 0.7 1.0 1.7
Chile 1.0 0.5 0.5 1.0 2.7
Paraguay 0.0 0.1 0.1 1.0 2.6
Peru 0.2 0.5 0.8 1.0 2.2
Uruguay 0.3 0.5 0.8 1.0 1.6
USA n.d. n.d. 0.6 1.0 1.7
Table 14:Unemployment rates by years of schooling, urban areas (circa 2000)
Notes:Argentina: Great Buenos Aires onlyParaguay: Asunción onlySource: ECLAC (2002) Social Panorama of Latin America 2001-2002.
YEARS OF SCHOOLINGCountry 0-5 years 6-9 years 10-12 years 13 and more Argentina 18.0 18.0 16.2 7.8
Bolivia 5.6 8.8 8.7 5.5
Brazil 9.9 15.6 12.2 5.2
Chile 12.4 13.2 11.4 6.6
Colombia 15.3 23.2 23.2 14.1
Costa Rica 7.3 6.6 5.0 1.9
Dominican Rep. 12.0 13.5 16.4 12.9
Ecuador 6.0 7.5 12.4 8.4
El Salvador 5.5 6.1 9.8 4.7
Honduras 4.8 6.3 4.3 4.0
Mexico 1.2 2.2 2.9 2.1
Nicaragua 11.8 14.2 18.5 12.4
Panama 7.2 14.2 16.2 9.6
Peru 4.9 10.0 7.1 7.7
Uruguay 12.3 15.6 13.0 8.8
Venezuela 10.7 13.4 15.6 12.4

75
Table 16:Percentage of young people who reach at least 12 years of schooling by educationalattainment of their parents, urban areas (circa 1994)
AÑOS DE ESCOLARIDADCountry 0-5 years 6-9 years 10-12 years 13 and moreBrazil 7.0 33.0 59.0 100.0
Chile 50.0 67.0 88.0 100.0
Colombia 22.0 58.0 86.0 100.0
Costa Rica 22.0 43.0 71.0 100.0
Honduras 21.0 56.0 88.0 100.0
Panama 34.0 62.0 90.0 100.0
Paraguay 30.0 73.0 100.0 100.0
Uruguay 25.0 39.0 82.0 100.0
Venezuela 14.0 38.0 68.0 100.0
Average 25.0 52.1 81.3 100.0
Source: ECLAC (2002) Sociol Panorama of Latin America 2001-2002.
Sources:Schooling: Barro & Lee (2000). Internacional Data on Educational Attainment: Updates and Implications (1999 information)cited by Carlos Muñoz Izquierdo et. al. (2003) Desarrollo de una propuesta de indicadores del impacto social de la educación en AméricaLatina y el CaribeFertility: Estimations from ECLAC (2000) Anuario Estadistico de America Latina y el Caribe. (2000-2005)Birth: Estimations from ECLAC (2000) Anuario Estadistico de America Latina y el Caribe. (2000-2005)Infant mortality: Easterly Mirvat (2001). Global Development Network Growth Database 1950-1999. (1997 information)
Table 17:Average years of schooling of the female population olderthan 15 years of age and fertility, birth and mortality rates
Argentina 8.9 2.4 19.1 22.0
Barbados 8.6 1.5 n.d. 14.0
Bolivia 5.1 3.9 30.5 66.0
Brazil 4.4 2.1 19.2 34.0
Colombia 5.7 2.6 22.3 24.0
Costa Rica 6.0 2.7 21.9 12.0
Chile 7.5 2.4 18.2 11.0
Dominican Rep. 5.0 2.6 21.8 40.0
Ecuador 6.4 2.8 23.2 33.1
El Salvador 5.1 2.9 25.3 32.0
Guatemala 3.1 4.4 34.2 43.0
Guyana 6.3 2.1 n.d. 58.0
Haiti 2.1 4.0 n.d. 71.1
Honduras 4.0 3.7 30.0 36.0
Jamaica 5.6 2.3 n.d. 11.6
Mexico 6.9 2.5 22.2 31.0
Nicaragua 4.6 3.9 32.8 43.0
Panama 8.5 2.4 20.3 21.0
Paraguay 6.1 3.8 29.6 23.0
Peru 7.1 2.6 22.6 40.0
Trinidad & Tobago 8.0 1.5 n.d. 12.0
Uruguay 7.9 2.3 16.9 16.4
Venezuela 6.8 2.7 22.8 21.0
Country
Averageschooling ofthe femalepopulation
Fertilityrate
Birthrate
Infantmortality
rate


