27
2017 Annual Results Announcement Sun Hung Kai & Co

2017 Annual Results Announcement
Sun Hung Kai & Co
Important - Disclaimer
By attending or viewing this Presentation you are agreeing to be bound by the terms and restrictions set out below. The information contained in this presentation and the accompanying slides and materials (the “Presentation”) is confidential. You must not re-distribute, reproduce or publish this Presentation in whole or in part whether in Hong Kong or otherwise. Any failure to comply with this prohibition may result in a breach of securities laws and regulations. This Presentation is not an offer or invitation to purchase or subscribe for any securities in Sun Hung Kai & Co (“Company”) or any of its affiliated companies (referred to as the “Group”).
The information contained in this Presentation has not been independently verified. Neither any Group member nor any of their directors, officers, employees and representatives makes any representation or warranty whatsoever, whether it is express or implied, and assumes no responsibility or liability whatsoever (in negligence or otherwise) in connection with the contents of this Presentation being fair, accurate, complete or reasonable. It is not intended that this Presentation be an exhaustive analysis of the Group’s financial or trading position or prospects. This Presentation may not contain all the information which you may consider material. The information and the opinions contained in this Presentation are provided as at the date of this Presentation and may change without notice to you. Under no circumstances is any Group member or any of their directors, officers, employees and representatives liable for any direct, indirect or consequential loss or damage, howsoever caused (including in negligence or otherwise), that you or any other party may sustain from any use of the information in this Presentation or otherwise in connection with this Presentation.
The Group’s past performance is not necessarily indicative of its future performance. This Presentation also contains certain forward looking statements regarding the Group’s opinions of and expectation of the future. These statements are neither necessarily indicative of the Group’s future performance nor are they guarantees of future performance. Forward looking statements, by their nature, are based on assumptions and factors that may be beyond the control of the Group. As such, actual future performance and results may materially and adversely differ from those expressed or implied in this Presentation. The Group assumes no obligation to update or correct any forward looking statement. The Group has not adopted any forward looking statements made by third parties and as such the Group will not be responsible for third party statements.
2
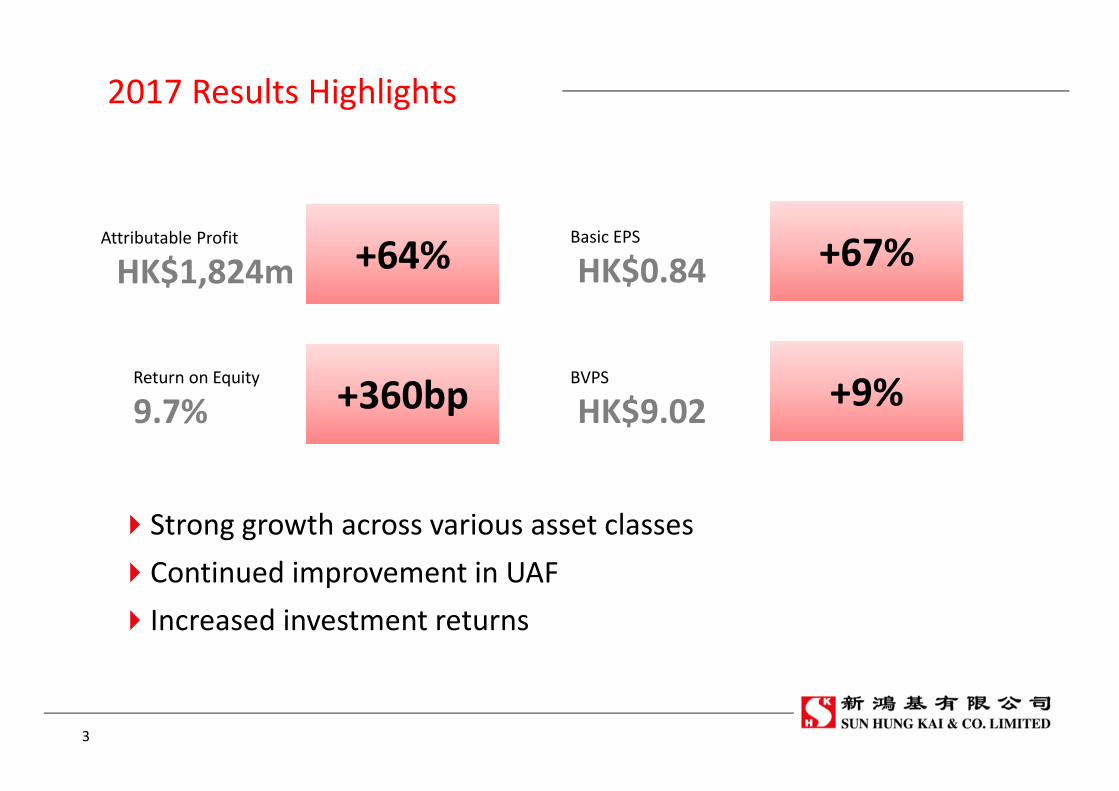
2017 Results Highlights
�Strong growth across various asset classes
�Continued improvement in UAF
�Increased investment returns
Attributable Profit
HK$1,824mBasic EPS
HK$0.84
Return on Equity
9.7%BVPS
HK$9.02
+64% +67%
+360bp +9%
3

Segments Assets and Contribution (HK$m)
• UA Finance (58%) - unsecured lending in HK, China, individual consumers
• Market leader in HKConsumer Finance
• Leverage on our know-how and network
• Equity, debt and real estate portfolio
• Strategic and liquidity management portfolio
Principal Investments
• EBSHK(30%) – Wealth Mgmt, HK
• LSS Leasing (40%) – Car leasing in China
• Other financial services firms
Financial Services
• SHK Credit - mortgage and home equity loans in HK, home owners and buyers
Mortgage Loans
• Cost of funding charged to investments
• Other unallocated assets and expenses
Group Management and Support
Assets
Pre-tax
Profit Change
16,032 1,445 +99%
15,937 1,082 +129%
2,483 119 -35%
2,185 35 +1844%
785 (72)
37,422 2,609 +74%Group Total
4
9,164
3,276
3,155
8,652
2,120
19,427
2,911
13,451
1,646
3,267 3,972
1,709 2,096
Assets by Category Assets $37.4B Liabilities and Equity $37.4B
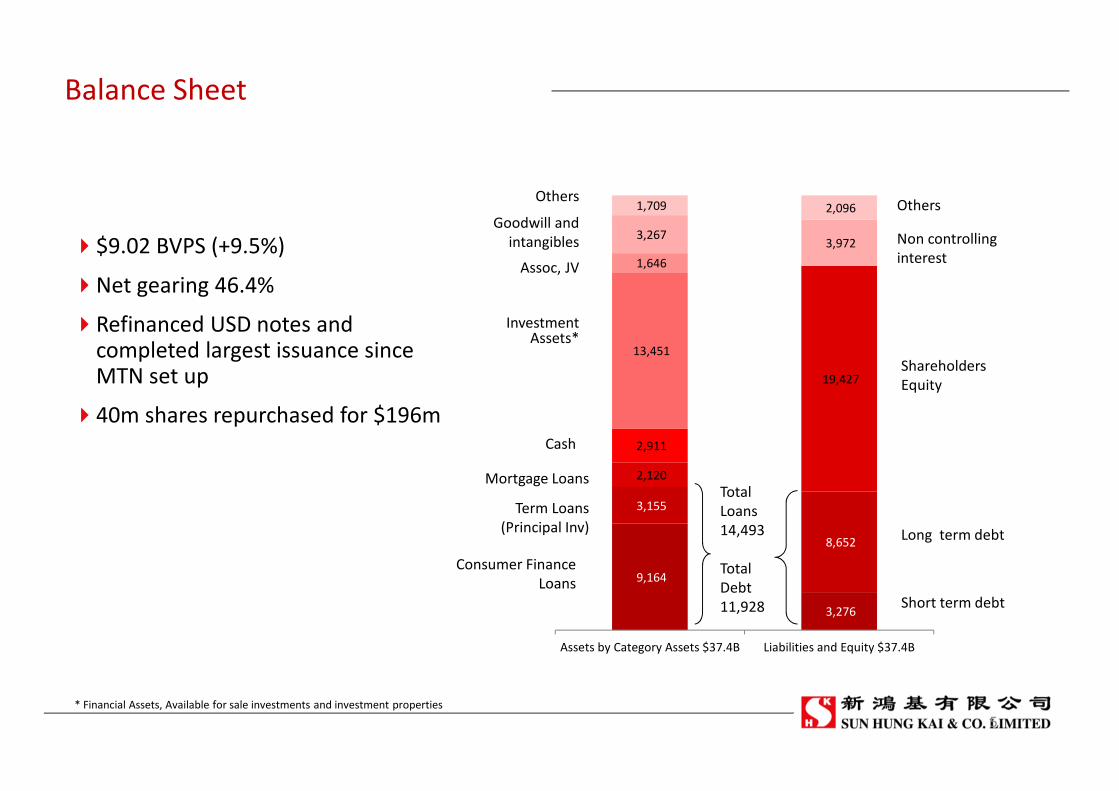
Balance Sheet
Cash
Term Loans
(Principal Inv)
Goodwill and
intangibles
Short term debt
Long term debt
Others
Shareholders
Equity
Others
Non controlling
interest
InvestmentAssets*
Total
Loans
14,493
Total
Debt
11,928
Mortgage Loans
Consumer Finance
Loans
Assoc, JV
�$9.02 BVPS (+9.5%)
�Net gearing 46.4%
�Refinanced USD notes and completed largest issuance since MTN set up
�40m shares repurchased for $196m
* Financial Assets, Available for sale investments and investment properties
5

Capital Structure and Funding (HK$m)
67% 63%
33%37%
2016 2017
Total Assets and Leverage
Total Equity Total Liabilities
32,561
4.15.8
2016 2017
Interest Cover37,422
4,810 3,797
5,312 8,131
2016 2017
Funding Structure
Banks and other borrowings Notes
10,122
11,928
20.3%
46.4%
2016 2017
Net Gearing
6

Business Segments
7
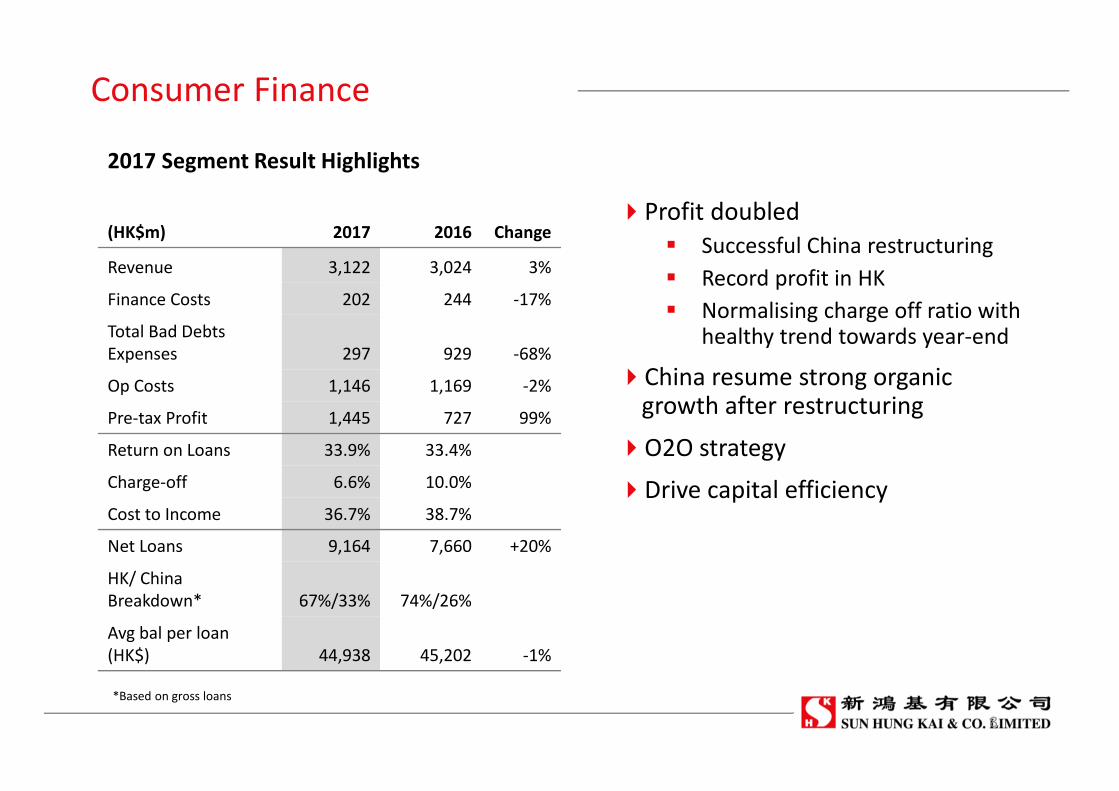
Consumer Finance
�Profit doubled
� Successful China restructuring
� Record profit in HK
� Normalising charge off ratio with healthy trend towards year-end
�China resume strong organic growth after restructuring
�O2O strategy
�Drive capital efficiency
(HK$m) 2017 2016 Change
Revenue 3,122 3,024 3%
Finance Costs 202 244 -17%
Total Bad Debts
Expenses 297 929 -68%
Op Costs 1,146 1,169 -2%
Pre-tax Profit 1,445 727 99%
Return on Loans 33.9% 33.4%
Charge-off 6.6% 10.0%
Cost to Income 36.7% 38.7%
Net Loans 9,164 7,660 +20%
HK/ China
Breakdown* 67%/33% 74%/26%
Avg bal per loan
(HK$) 44,938 45,202 -1%
2017 Segment Result Highlights
*Based on gross loans
8

Performance since 2015
0
1000
2000
3000
4000
5000
1H2015 2H2015 1H2016 2H2016 1H2017 2H2017
Gross Loans – China (HK$m)
9.4%
13.2% 12.7%
7.9% 7.6%6.2%
1H2015 2H2015 1H2016 2H2016 1H2017 2H2017
Charge-off Ratio
35.9%
38.3%
40.1%
37.2%36.1%
37.2%
1H2015 2H2015 1H2016 2H2016 1H2017 2H2017
Cost-to-income Ratio
Series 1
471
139 187
540623
822
1H2015 2H2015 1H2016 2H2016 1H2017 2H2017
Pre-tax contribution (HK$m)
9
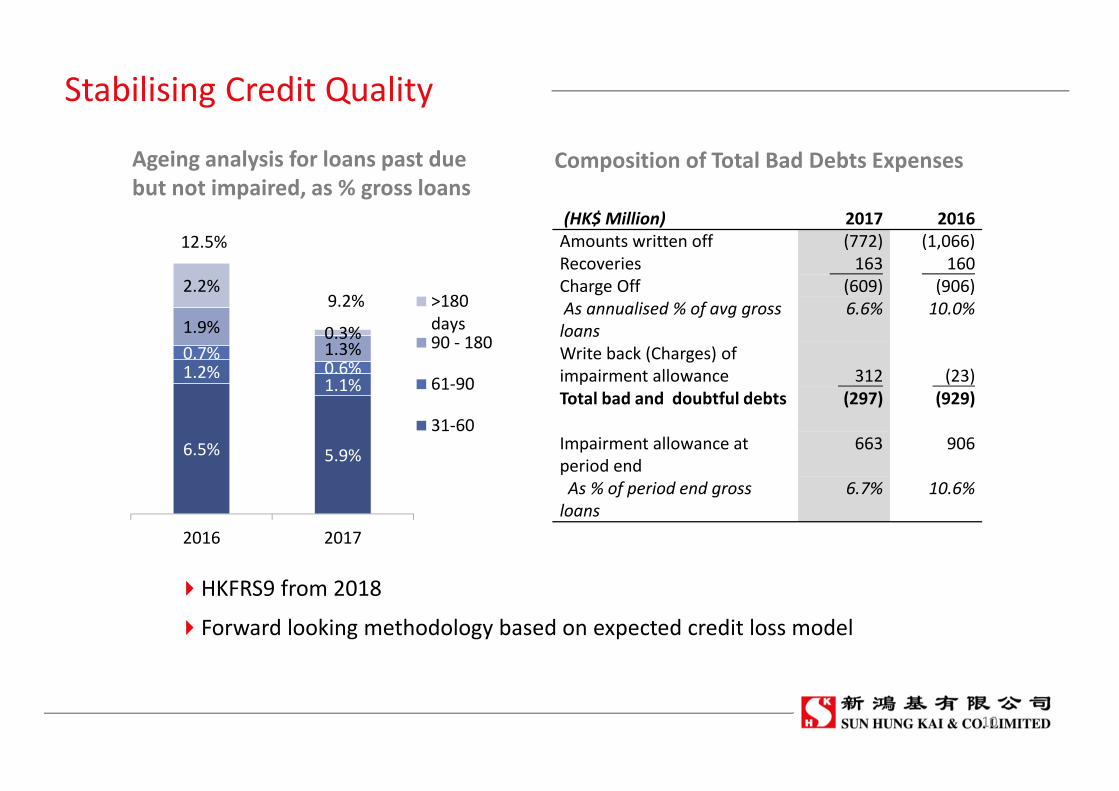
Stabilising Credit Quality
(HK$ Million) 2017 2016
Amounts written off (772) (1,066)
Recoveries 163 160
Charge Off (609) (906)
As annualised % of avg gross
loans
6.6% 10.0%
Write back (Charges) of
impairment allowance 312 (23)
Total bad and doubtful debts (297) (929)
Impairment allowance at
period end
663 906
As % of period end gross
loans
6.7% 10.6%
Composition of Total Bad Debts ExpensesAgeing analysis for loans past due
but not impaired, as % gross loans
�HKFRS9 from 2018
�Forward looking methodology based on expected credit loss model
6.5% 5.9%
1.2%1.1%
0.7%0.6%
1.9%
1.3%
2.2%
0.3%
2016 2017
>180
days90 - 180
61-90
31-60
9.2%
12.5%
10

UAF - Hong Kong
�Continued improvement in market share both by value and customer share
�Still very benign market with low unemployment
�Gross loans + 3%
�Record profit
2017 2016
Return on Loans 32.9% 31.8%
Charge-off 4.8% 5.6%
Gross Loans (HK$m) 6,544 6,374
Avg balance per loan(HK$) 53,126 54,654
Operation Highlights
“Let go of your worries. Yes, UA”
11
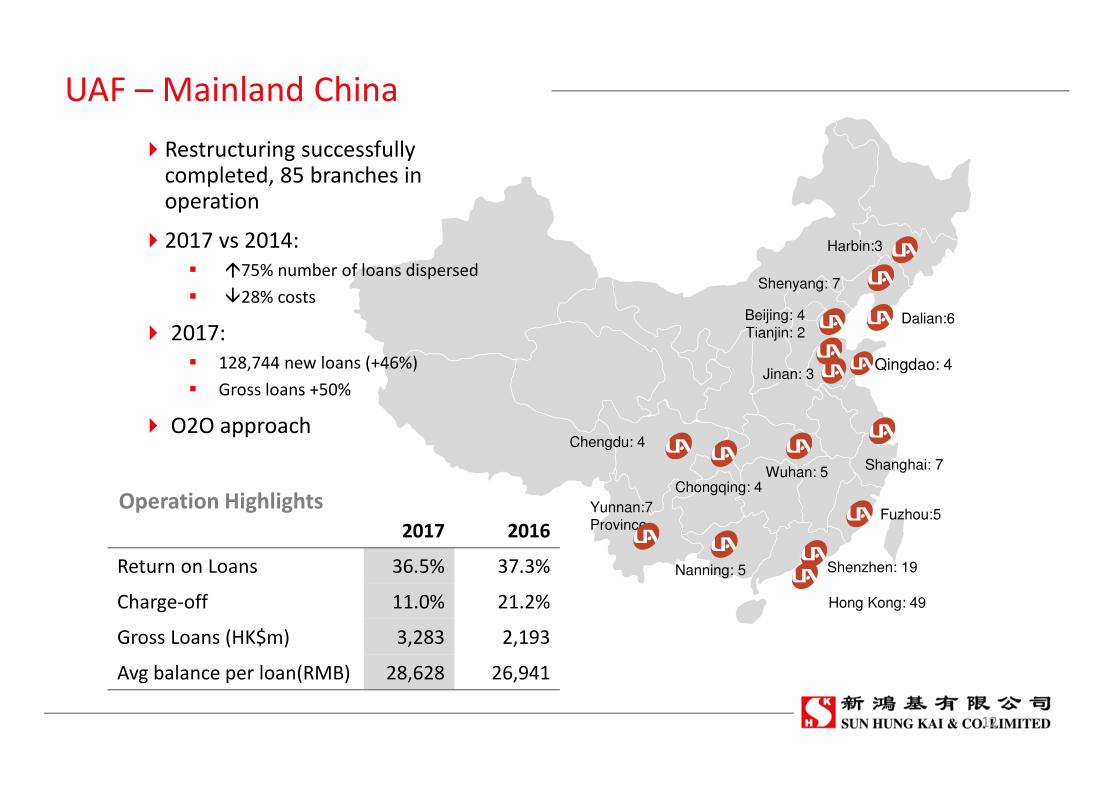
UAF – Mainland China
Chongqing: 4
Beijing: 4Tianjin: 2
Shenyang: 7
Hong Kong: 49
Shenzhen: 19
Chengdu: 4
Dalian:6
Yunnan:7Province
Jinan: 3
Wuhan: 5Shanghai: 7
Harbin:3
Fuzhou:5
Nanning: 5
Qingdao: 4
�Restructuring successfully completed, 85 branches in operation
�2017 vs 2014:
� �75% number of loans dispersed
� �28% costs
� 2017:
� 128,744 new loans (+46%)
� Gross loans +50%
� O2O approach
2017 2016
Return on Loans 36.5% 37.3%
Charge-off 11.0% 21.2%
Gross Loans (HK$m) 3,283 2,193
Avg balance per loan(RMB) 28,628 26,941
Operation Highlights
12
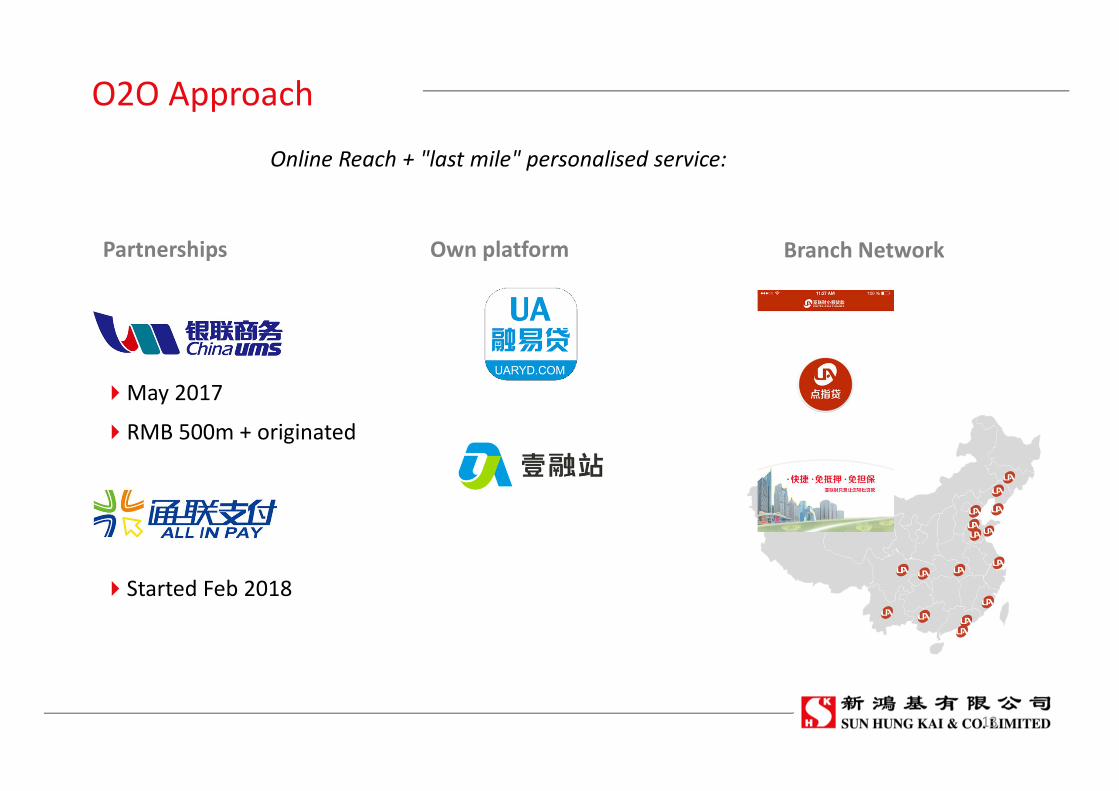
O2O Approach
�May 2017
�RMB 500m + originated
�Started Feb 2018
Partnerships Own platform Branch Network
Online Reach + "last mile" personalised service:
13

Principal Investments
�2017 Investment return:
� Public Equity 7.8% (blended^)
� Private Equity 19.8%
� Public Debt 3.8% (blended^)
� Private Debt 13.4%
� Real Estate 7.5%
�HK$1,082m (+129%) after operation
and capital cost allocation
^including strategic investment impairment in public equities,
liquidity management products in public debt
Equity
4,392 Public
2,768
-
Private
4,323
Credit
4,705
Public
3,513 -
Private
3,223
Real Estate
1,633
2,110
-
3,000
6,000
9,000
12,000
15,000
18,000
2016 2017
Principal Investments Portfolio
10,731
15,937
14

Public Equities
�16.6% return excluding PPDai strategic investment portion
�Focused strategy on global medium and large cap positions
�Emphasis on Greater China, Australia, North America
�Satisfactory YTD trend
�PPDai Strategic Investment:
� Classified as Available for Sale Investment
� Impairment reflects market reaction to sudden tightening of online lending regulation
� Fairly regulated market a plus for the Group and PPDai
17% of total portfolio, HK$2,768m
15

Private Equity
27% of total portfolio, HK$4,323m
�19.8% investment return
�Successful co-investment strategy
�Focused on increasing exposures to our strategic competencies: financials, fintech, health care, tech etc
�2017 new investments in financials and fintech in North America
�Using our consumer finance expertise and expanded globally with Fairstone investment
�Geography:
Greater China 38%
North America 18%
16

Public Credit
�5.5% return excluding liquidity management products
�Multi strategy long/short approach
�Identify mispriced/ undervalued fixed income opportunities
�Global portfolio for corporate and sovereign bonds
�Sectors: property, financials, oil and gas, metals and mining
�Since 2017 included Group liquidity management products
22% of total portfolio, HK$3,513m
17

Private Credit
�13.4% return
�11% growth in term loans
�Interest income +26% to HK$425m
�Provision ~2.8% of portfolio� Likelihood of future recovery; helping one of the borrowers on
business restructuring
�To focus on fee income via collaboration with affiliates and partners
20% of total, HK$3,223m
18

Real Estate
�7.5% return
�Focus:Legacy Hong Kong commercial real estate
Minority interest in two residential development projects (HK,Australia)
Global special situation investments (prime commercial, hospitality)
�Strong metrics and underlying performance of assets
�Forex hedging reduced short term return performance but to be reversed upon future asset sale
�New for 2017: contemporary hostel chain and prime London asset
�Open to explore future interests through credit structures if risk/reward justifies
13% of total, HK$2,110m
19

Mortgage Loans
(HK$m) 2017 2016
Revenue 124.4 55.7
Operating Costs (43.9) (38.6)
Cost to Income (% Rev) 35.3% 69.3%
Finance costs (42.3) (12.3)
Bad and doubtful debts (3.2) (3.0)
Pre-tax Contribution 35.0 1.8
Net Loans 2,120 613
Results Summary
�Passed $2B mark in 2nd full year of operation
�Top ranked non-bank 1st
mortgage provider (no. of new loans)
�Partnerships with mid-tier HK developers and real estate agents working well
�To focus on driving greater scale and improving efficiency
20
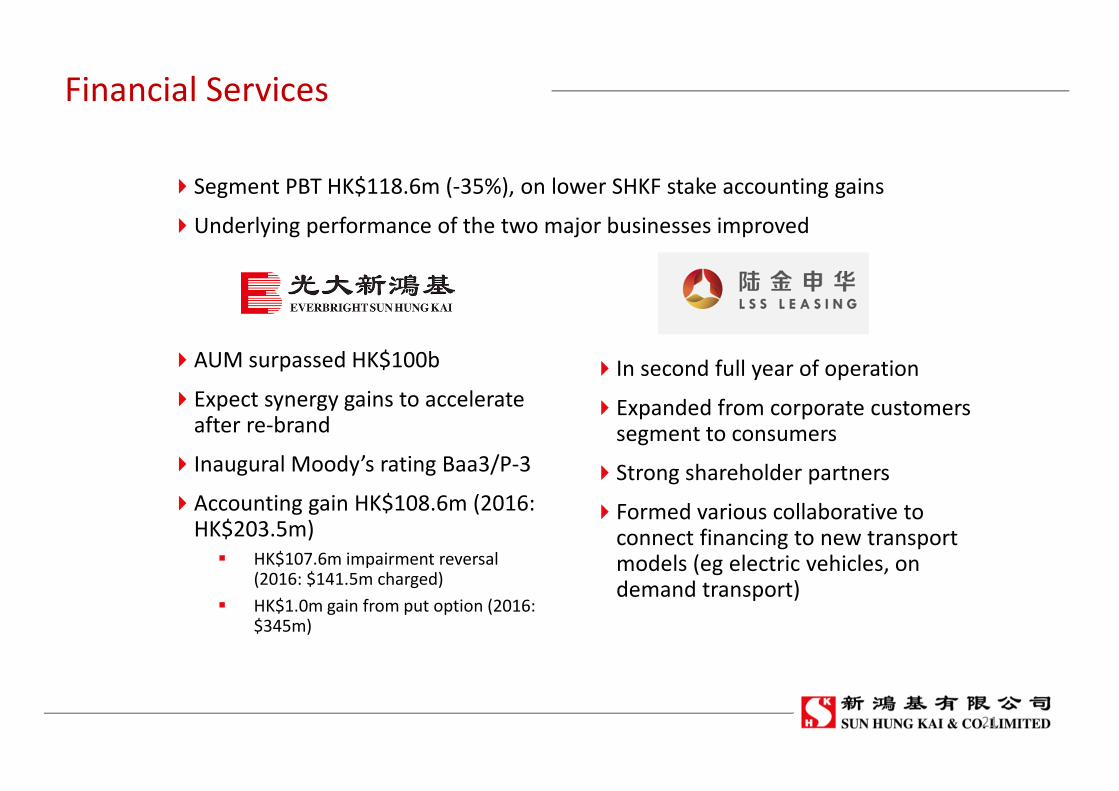
�Segment PBT HK$118.6m (-35%), on lower SHKF stake accounting gains
�Underlying performance of the two major businesses improved
Financial Services
�AUM surpassed HK$100b
�Expect synergy gains to accelerate after re-brand
�Inaugural Moody’s rating Baa3/P-3
�Accounting gain HK$108.6m (2016: HK$203.5m)
� HK$107.6m impairment reversal (2016: $141.5m charged)
� HK$1.0m gain from put option (2016: $345m)
�In second full year of operation
�Expanded from corporate customers segment to consumers
�Strong shareholder partners
�Formed various collaborative to connect financing to new transport models (eg electric vehicles, on demand transport)
21
Strategy and Outlook
22

Full Fledged Investment Platform
Up to 2006
Stock Broker
2007 – 2015
Consumer Finance
Leading independent WM platform
From 2015
Asset platform that combines our heritage, network and financial strength
Financials as core + global investments
HK$37.4B total assets
Committed to generate long term
capital growth for shareholders
23

Track Record of Capital Return (HK$m)
-
200
400
600
800
1,000
2007 2008 2009 2010 2011 2012 2013 2014 2015 2016 2017
Buybacks Dividends
2010: HK$4.04b
distributionHK$9.9 billion returned to shareholders through
distribution and share buybacks
24

Value Accretion
$ 5.43
$9.02
0
50
100
150
200
250
-
2
4
6
8
10
12
2006 2007 2008 2009 2010 2011 2012 2013 2014 2015 2016 2017
BVPS (HK$, LHS) DPS (HK cents, RHS)
11.6% IRR to shareholders
including DPS and cumulative BVPS
increase
25

�Loan businesses (consumer finance, mortgage loans) positive barring any disruptive market developments. Growth in loan balances toward year end strengthens revenue base
�Investments well positioned with sufficient liquidity
�Continue to improve capital efficiency
Outlook
26


