SEC Number File Number SUN LIFE FINANCIAL INC. ______________________________________________ (Company’s Full Name) 150 King Street West, Toronto, Canada ______________________________________________ (Company’s Address) (416) 979-4800 _______________________________________ _______ (Telephone Number) December 31 ________________________ (Fiscal Year Ending) (month & day) To comply with SRC Rule 17 in lieu of SEC Form 17-Q _______________________________________ _______ Form Type N/A ________________________________ Amendment Designation (If applicable) 4 June 30, 201 ___________________Period Ended Date N/A ________________________________ (Secondary License Type and File Number) The attached document is being filed with stock exchanges and securities regulators in Canada and the United States. As agreed with the Philippines Securities and Exchang e Commission (the “PSEC”) and the Philippines Stock Exchange (the “PSE”), continuous disclosure documents filed by Sun Life Financial Inc. in the Philippines will be fil ed in accordance with the requirements of Canadian securities regulators as to contents, format and reporting periods. Documents filed with the PSEC and the PSE will include a cover page identifying the SEC form that would otherwise be required to be filed under the Philippines Securities Regulation Code.
150 King Street West, Toronto, Canada ______________________________________________
(Company’s Address)
(416) 979-4800
______________________________________________
(Telephone Number)
December 31
________________________(Fiscal Year Ending)
(month & day)
To comply with SRC Rule 17 in lieu of SEC Form 17-Q
______________________________________________
Form Type
N/A
________________________________
Amendment Designation
(If applicable)
4 June 30, 201 ___________________
Period Ended Date
N/A
________________________________
(Secondary License Type and File Number)
The attached document is being filed with stock exchanges and securities regulators in Canada and the
United States. As agreed with the Philippines Securities and Exchange Commission (the “PSEC”) and the
Philippines Stock Exchange (the “PSE”), continuous disclosure documents filed by Sun Life Financial Inc.
in the Philippines will be filed in accordance with the requirements of Canadian securities regulators as to
contents, format and reporting periods. Documents filed with the PSEC and the PSE will include a cover page identifying the SEC form that would otherwise be required to be filed under the Philippines Securities
In May 2014, IFRS 15 Revenue from Contracts with Customers (“IFRS 15”) was issued, which replaces IAS 11 Construction
Contracts, IAS 18 Revenue and various interpretations. IFRS 15 establishes principles about the nature, amount, timing anduncertainty of revenue arising from contracts with customers. The standard requires entities to recognize revenue to reflect thetransfer of goods or services to customers measured at the amounts an entity expects to be entitled to in exchange for those goodsor services. IFRS 15 is effective for annual periods beginning on or after January 1, 2017. Insurance and investment contracts arenot in scope of this standard. We are currently assessing the impact the adoption of this standard will have on our ConsolidatedFinancial Statements.
In July 2014, the final version of IFRS 9 Financial Instruments (“IFRS 9”) was issued, which replaces IAS 39 Financial Instruments:
Recognition and Measurement . IFRS 9 includes guidance on the classification and measurement of financial instruments,
impairment of financial assets, and hedge accounting. Financial asset classification is based on the cash flow characteristics andthe business model in which an asset is held. The classification determines how a financial instrument is accounted for andmeasured. IFRS 9 also introduces an impairment model for financial instruments not measured at fair value through profit or lossthat requires recognition of expected losses at initial recognition of a financial instrument and the recognition of full lifetime expectedlosses if certain criteria are met. A new model for hedge accounting aligns hedge accounting with risk management activities.IFRS 9 is effective for annual periods beginning on or after January 1, 2018. We are currently assessing the impact the adoption of this standard will have on our Consolidated Financial Statements.
3. Acquisition and Held for Sale Classification and DiscontinuedOperation
3.A Acquisition
On April 12, 2013, in connection with a strategic partnership between Sun Life Assurance and Khazanah Nasional Berhad(“Khazanah”), Sun Life Assurance acquired 49% of each of CIMB Aviva Assurance Berhad, a Malaysian insurance company andCIMB Aviva Takaful Berhad, a Malaysian takaful company (together, “CIMB Aviva”) from Aviva International Holdings Limited and,subsequently, Khazanah acquired 49% of CIMB Aviva from CIMB Group Holdings Berhad (“CIMB Group”). CIMB Group retained atwo percent share in CIMB Aviva. The transaction included an exclusive right to distribute insurance products of CIMB Aviva,including takaful products, through CIMB Bank’s network across Malaysia. Sun Life Assurance’s contribution to the transaction wasvalued at $301. In the third quarter of 2013, the companies acquired were renamed Sun Life Malaysia Assurance Berhad and SunLife Malaysia Takaful Berhad (together, “Sun Life Malaysia”). Our investment in Sun Life Malaysia is accounted for using the equitymethod of accounting.
3.B Held for Sale Classification and Discontinued Operation
Effective August 1, 2013, we completed the sale of our U.S. Annuities business and certain of our U.S. life insurance businesses
(“the U.S. Annuity Business”) to Delaware Life Holdings, LLC. The transaction consisted primarily of the sale of 100% of the sharesof Sun Life Assurance Company of Canada (U.S.), which included U.S. domestic variable annuity, fixed annuity and fixed indexedannuity products, corporate and bank-owned life insurance products and variable life insurance products. The sale included thetransfer of certain related operating assets, systems and employees that supported these businesses. The assets and liabilities of the U.S. Annuity Business were separately presented as assets and liabilities classified as held for sale, respectively, in our Consolidated Statements of Financial Position for 2013 prior to the closing of the sale. In the first quarter of 2014, the purchaseprice adjustment was finalized, which resulted in no change to the loss on sale of $695 recorded in Common shareholders’ netincome (loss) from discontinued operation in our 2013 Annual Consolidated Financial Statements.
Discontinued Operation
The results of operations relating to our U.S. Annuity Business in Sun Life Financial United States (“SLF U.S.”) are reflected as adiscontinued operation in our Interim Consolidated Statements of Operations.
40 Sun Life Financial Inc. Second Quarter 2014 CONDENSED NOTES TO THE INTERIM CONSOLIDATED FINANCIAL STATEMENTS (UNAUDITED)
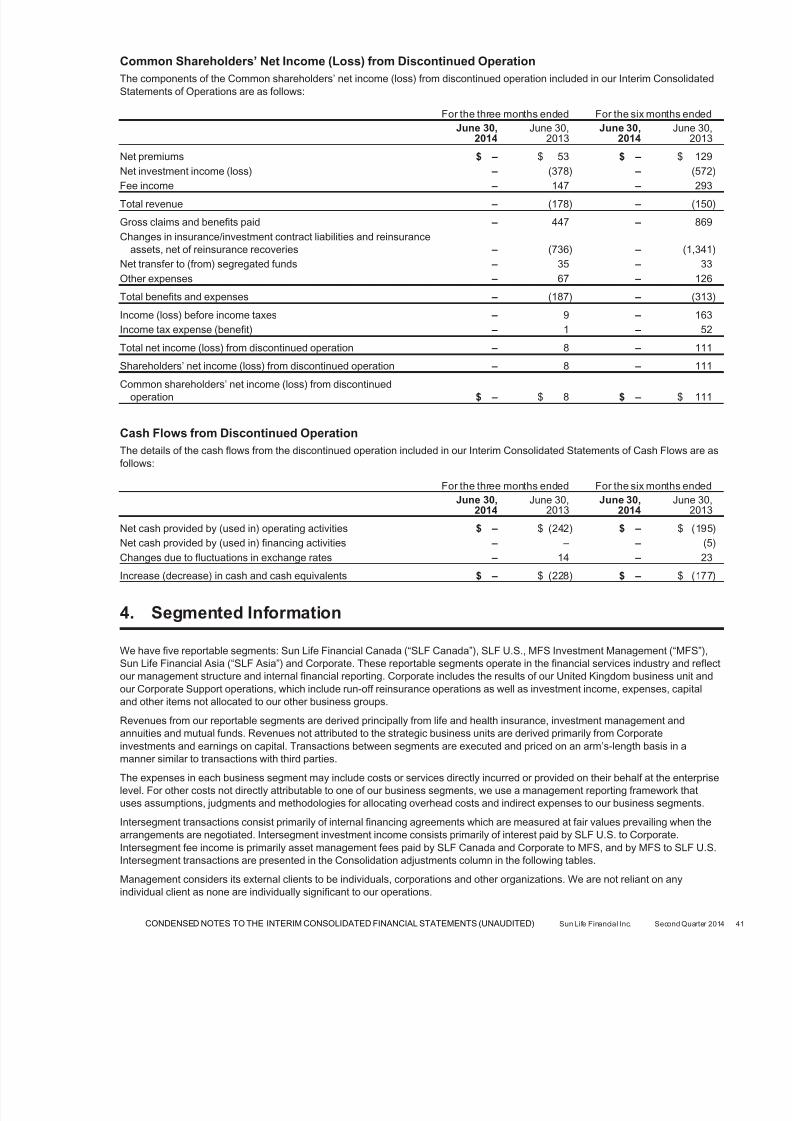
Common Shareholders’ Net Income (Loss) from Discontinued Operation
The components of the Common shareholders’ net income (loss) from discontinued operation included in our Interim ConsolidatedStatements of Operations are as follows:
For the three months ended For the six months ended
June 30,2014
June 30,2013
June 30,2014
June 30,2013
Net premiums $ – $ 53 $ – $ 129
Net investment income (loss) – (378) – (572)
Fee income – 147 – 293
Total revenue – (178) – (150)
Gross claims and benefits paid – 447 – 869
Changes in insurance/investment contract liabilities and reinsuranceassets, net of reinsurance recoveries – (736) – (1,341)
Net transfer to (from) segregated funds – 35 – 33
Other expenses – 67 – 126
Total benefits and expenses – (187) – (313)
Income (loss) before income taxes – 9 – 163
Income tax expense (benefit) – 1 – 52
Total net income (loss) from discontinued operation – 8 – 111
Shareholders’ net income (loss) from discontinued operation – 8 – 111Common shareholders’ net income (loss) from discontinued
operation $ – $ 8 $ – $ 111
Cash Flows from Discontinued Operation
The details of the cash flows from the discontinued operation included in our Interim Consolidated Statements of Cash Flows are asfollows:
For the three months ended For the six months ended
June 30,2014
June 30,2013
June 30,2014
June 30,2013
Net cash provided by (used in) operating activities $ – $ (242) $ – $ (195)
Net cash provided by (used in) financing activities – – – (5)
Changes due to fluctuations in exchange rates – 14 – 23
Increase (decrease) in cash and cash equivalents $ – $ (228) $ – $ (177)
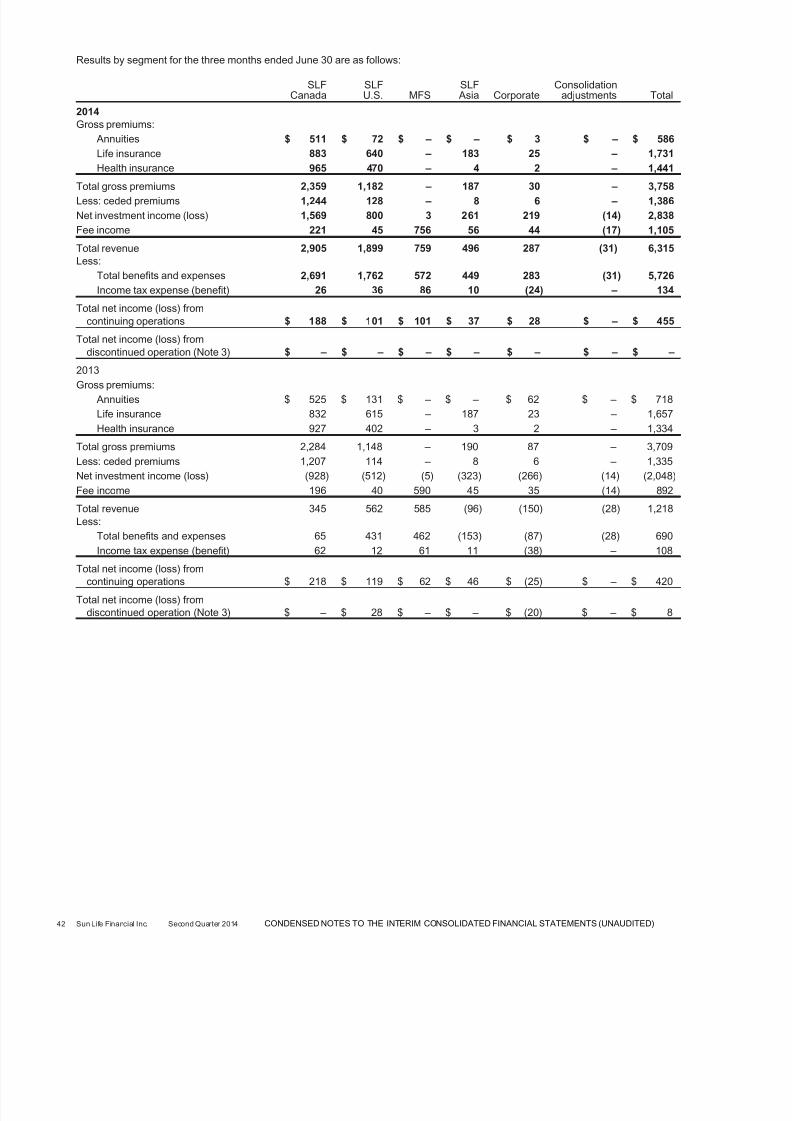
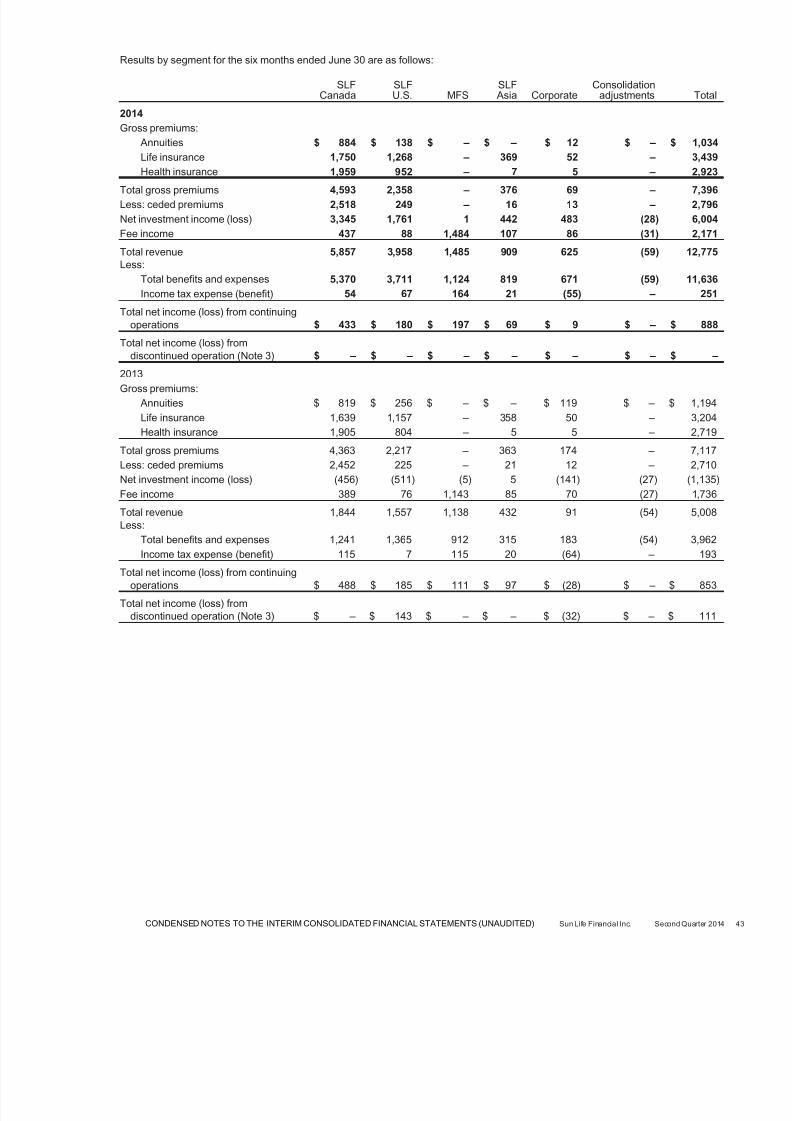
4. Segmented Information
We have five reportable segments: Sun Life Financial Canada (“SLF Canada”), SLF U.S., MFS Investment Management (“MFS”),Sun Life Financial Asia (“SLF Asia”) and Corporate. These reportable segments operate in the financial services industry and reflectour management structure and internal financial reporting. Corporate includes the results of our United Kingdom business unit andour Corporate Support operations, which include run-off reinsurance operations as well as investment income, expenses, capitaland other items not allocated to our other business groups.
Revenues from our reportable segments are derived principally from life and health insurance, investment management andannuities and mutual funds. Revenues not attributed to the strategic business units are derived primarily from Corporate
investments and earnings on capital. Transactions between segments are executed and priced on an arm’s-length basis in amanner similar to transactions with third parties.
The expenses in each business segment may include costs or services directly incurred or provided on their behalf at the enterpriselevel. For other costs not directly attributable to one of our business segments, we use a management reporting framework thatuses assumptions, judgments and methodologies for allocating overhead costs and indirect expenses to our business segments.
Intersegment transactions consist primarily of internal financing agreements which are measured at fair values prevailing when thearrangements are negotiated. Intersegment investment income consists primarily of interest paid by SLF U.S. to Corporate.Intersegment fee income is primarily asset management fees paid by SLF Canada and Corporate to MFS, and by MFS to SLF U.S.Intersegment transactions are presented in the Consolidation adjustments column in the following tables.
Management considers its external clients to be individuals, corporations and other organizations. We are not reliant on anyindividual client as none are individually significant to our operations.
CONDENSED NOTES TO THE INTERIM CONSOLIDATED FINANCIAL STATEMENTS (UNAUDITED) Sun Life Financial Inc. Second Quarter 2014
5. Total Invested Assets and Related Net Investment Income
5.A Asset Classification
The carrying values of our debt securities, equity securities and other invested assets presented in our Interim ConsolidatedStatements of Financial Position consist of the following:
As at
Fair valuethrough profit
or loss Available-
for-sale Other (1) Total
June 30, 2014
Debt securities $ 48,438 $ 12,575 $ – $ 61,013
Equity securities $ 4,225 $ 856 $ – $ 5,081
Other invested assets $ 1,115 $ 112 $ 828 $ 2,055
December 31, 2013
Debt securities $ 43,662 $ 11,151 $ – $ 54,813
Equity securities $ 4,342 $ 852 $ – $ 5,194
Other invested assets $ 1,034 $ 105 $ 716 $ 1,855(1) Other consists primarily of investments accounted for using the equity method of accounting.
5.B Change in Fair Value Through Profit or Loss Assets and Liabilities
Change in fair value through profit or loss assets and liabilities recorded to net income consists of the following:
For the three months ended For the six months ended
Total change in fair value through profit or loss assetsand liabilities $ 1,814 $ (3,356) $ 3,434 $ (3,704)
5.C Impairment of Available-For-Sale Assets
We recognized impairment losses on available-for-sale assets of $1 and $15 during the three and six months ended June 30, 2014,respectively ($2 and $8 for the three and six months ended June 30, 2013).
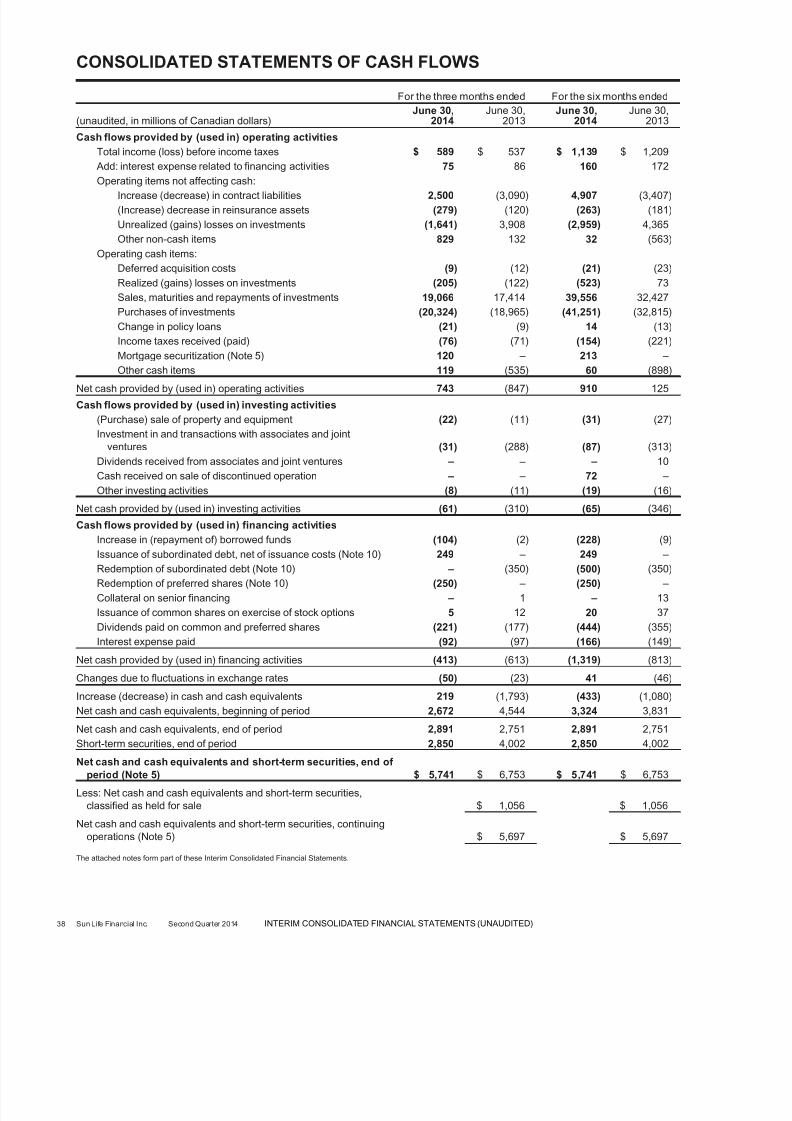
5.D Cash, Cash Equivalents and Short-Term Securities
Cash, cash equivalents and short-term securities presented in our Interim Consolidated Statements of Financial Position and Netcash, cash equivalents and short-term securities presented in our Interim Consolidated Statements of Cash Flows consist of thefollowing:
Cash, cash equivalents and short-term securities 5,816 7,636 6,090
Less: Bank overdraft, recorded in Other liabilities 75 46 393
Net cash, cash equivalents and short-term securities $ 5,741 $ 7,590 $ 5,697
5.E Mortgage Securitization
We securitize certain insured fixed rate commercial mortgages through the creation of mortgage-backed securities under theNational Housing Act Mortgage-Backed Securities (“NHA MBS”) Program sponsored by the Canada Mortgage and Housing
44 Sun Life Financial Inc. Second Quarter 2014 CONDENSED NOTES TO THE INTERIM CONSOLIDATED FINANCIAL STATEMENTS (UNAUDITED)
Corporation (“CMHC”). The NHA MBS are then sold to Canada Housing Trust, a government-sponsored security trust that issuessecurities to third-party investors under the Canadian Mortgage Bond (“CMB”) Program. The securitization of these assets does notqualify for derecognition as we have not transferred substantially all of the risks and rewards of ownership. Specifically, we continueto be exposed to pre-payment and interest rate risk associated with these assets. There are no expected credit losses on thesecuritized mortgages as the mortgages were already insured by the CMHC prior to securitization. These assets continue to berecognized as Mortgages and loans in our Interim Consolidated Statements of Financial Position. Proceeds from securitizationtransactions are recognized as secured borrowings and included in Other liabilities in our Interim Consolidated Statements of Financial Position.
Receipts of principal on the securitized mortgages are deposited into a principal reinvestment account (“PRA”) to meet our
repayment obligation upon maturity under the CMB program. The assets in the PRA are typically comprised of cash and cashequivalents and certain asset-backed securities. We are exposed to reinvestment risk due to the amortizing nature of the securitizedmortgages relative to our repayment obligation for the full principal amount due at maturity. We mitigate the reinvestment risk usinginterest rate swaps.
The carrying value and fair value of the securitized mortgages as at June 30, 2014 are $270 and $277, respectively ($55 and $55 asat December 31, 2013). The carrying value and fair value of the associated liabilities as at June 30, 2014 are $268 and $275,respectively ($55 and $55 as at December 31, 2013).
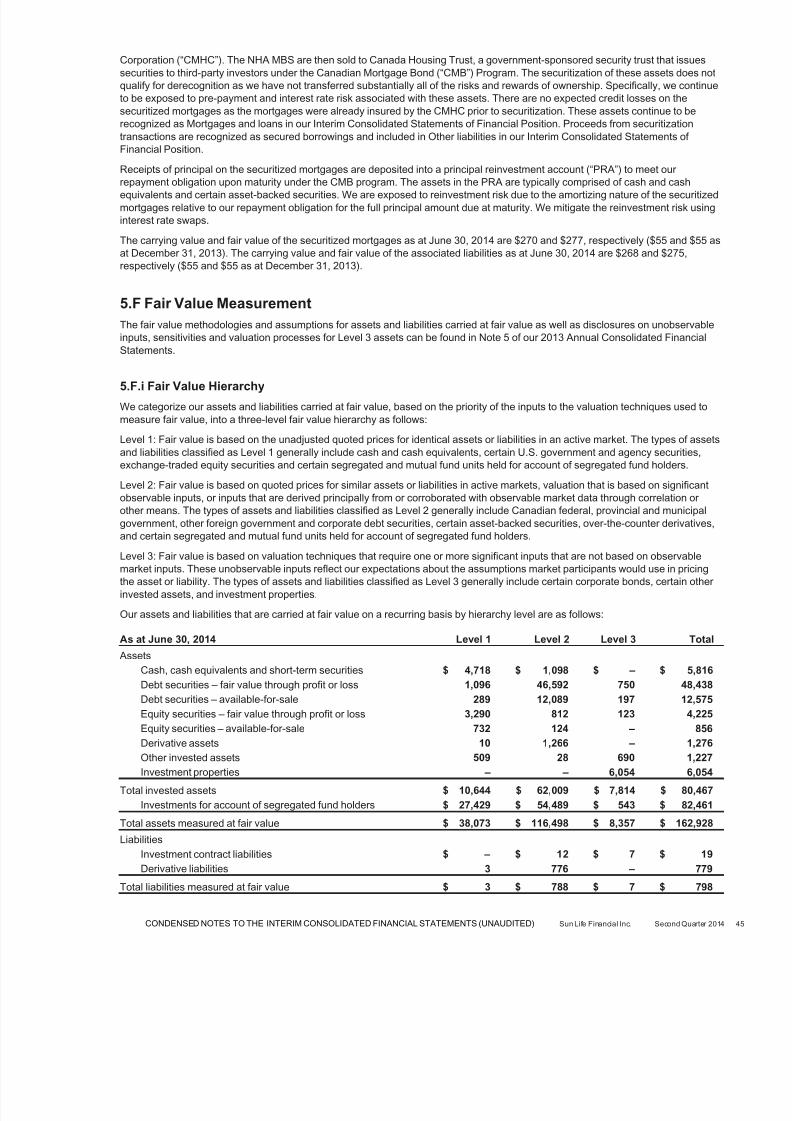
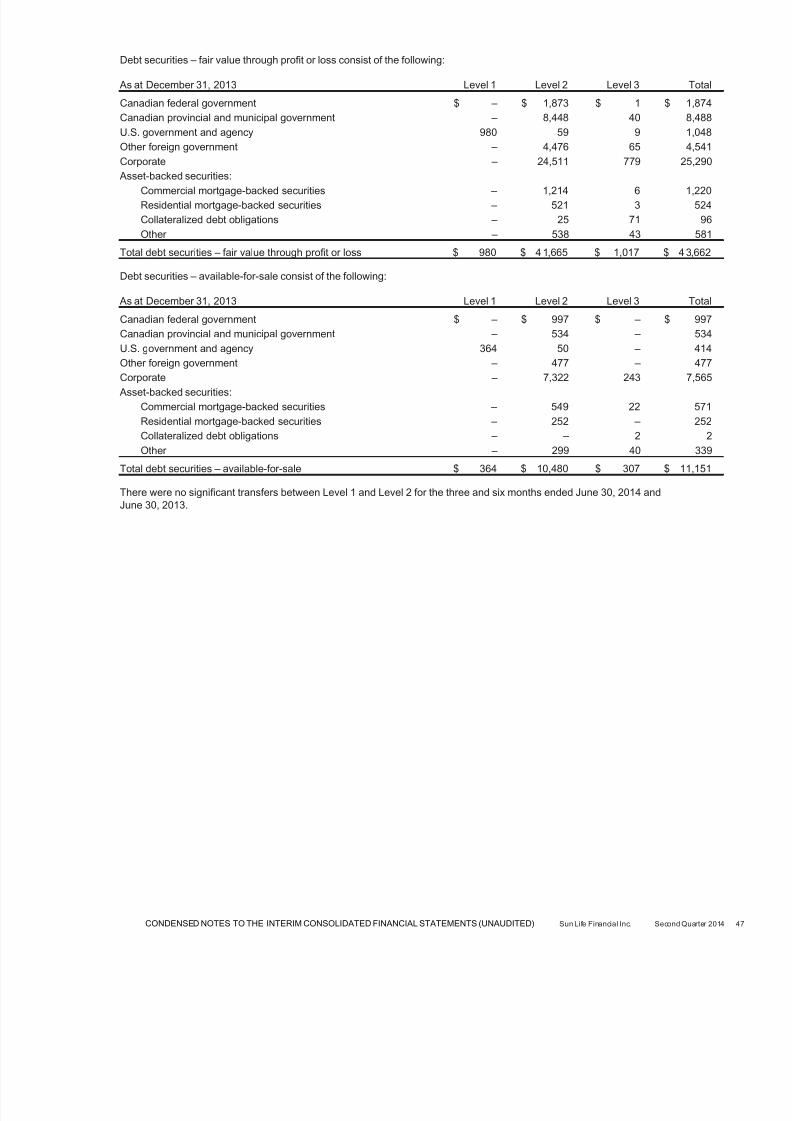
5.F Fair Value Measurement
The fair value methodologies and assumptions for assets and liabilities carried at fair value as well as disclosures on unobservableinputs, sensitivities and valuation processes for Level 3 assets can be found in Note 5 of our 2013 Annual Consolidated FinancialStatements.
5.F.i Fair Value Hierarchy
We categorize our assets and liabilities carried at fair value, based on the priority of the inputs to the valuation techniques used tomeasure fair value, into a three-level fair value hierarchy as follows:
Level 1: Fair value is based on the unadjusted quoted prices for identical assets or liabilities in an active market. The types of assetsand liabilities classified as Level 1 generally include cash and cash equivalents, certain U.S. government and agency securities,exchange-traded equity securities and certain segregated and mutual fund units held for account of segregated fund holders.
Level 2: Fair value is based on quoted prices for similar assets or liabilities in active markets, valuation that is based on significantobservable inputs, or inputs that are derived principally from or corroborated with observable market data through correlation or other means. The types of assets and liabilities classified as Level 2 generally include Canadian federal, provincial and municipalgovernment, other foreign government and corporate debt securities, certain asset-backed securities, over-the-counter derivatives,and certain segregated and mutual fund units held for account of segregated fund holders.
Level 3: Fair value is based on valuation techniques that require one or more significant inputs that are not based on observablemarket inputs. These unobservable inputs reflect our expectations about the assumptions market participants would use in pricingthe asset or liability. The types of assets and liabilities classified as Level 3 generally include certain corporate bonds, certain other invested assets, and investment properties.
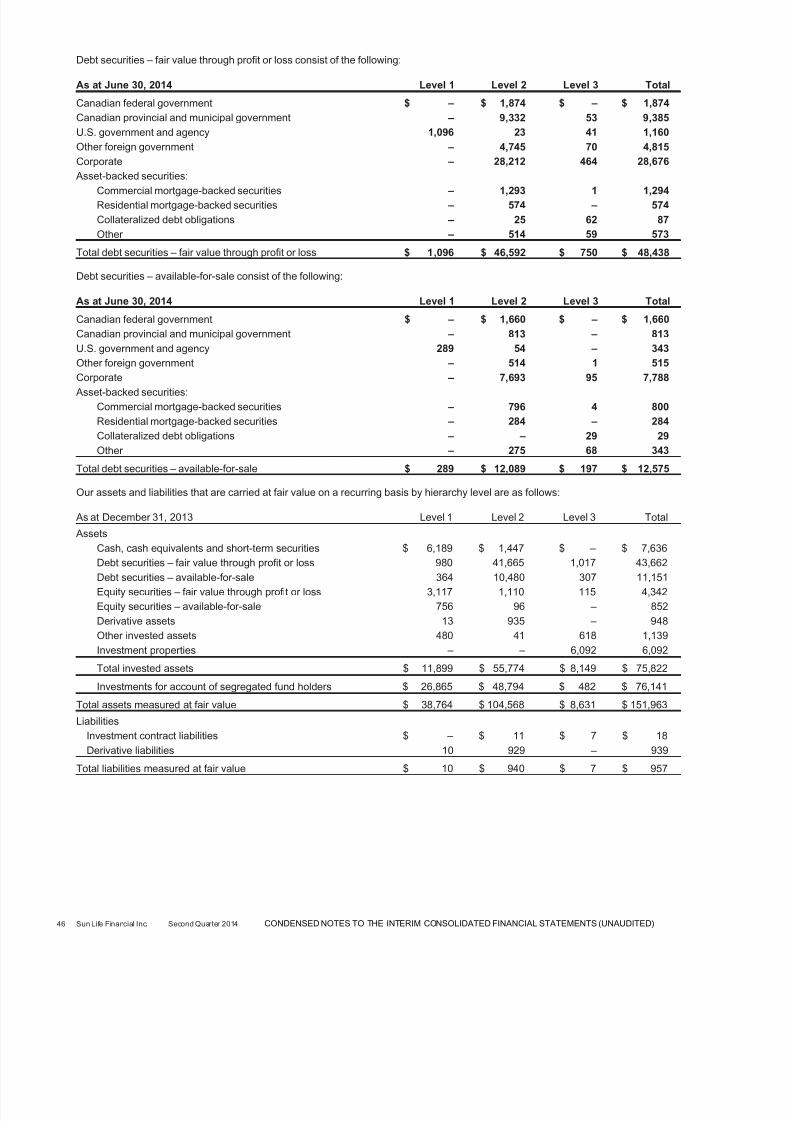
Our assets and liabilities that are carried at fair value on a recurring basis by hierarchy level are as follows:
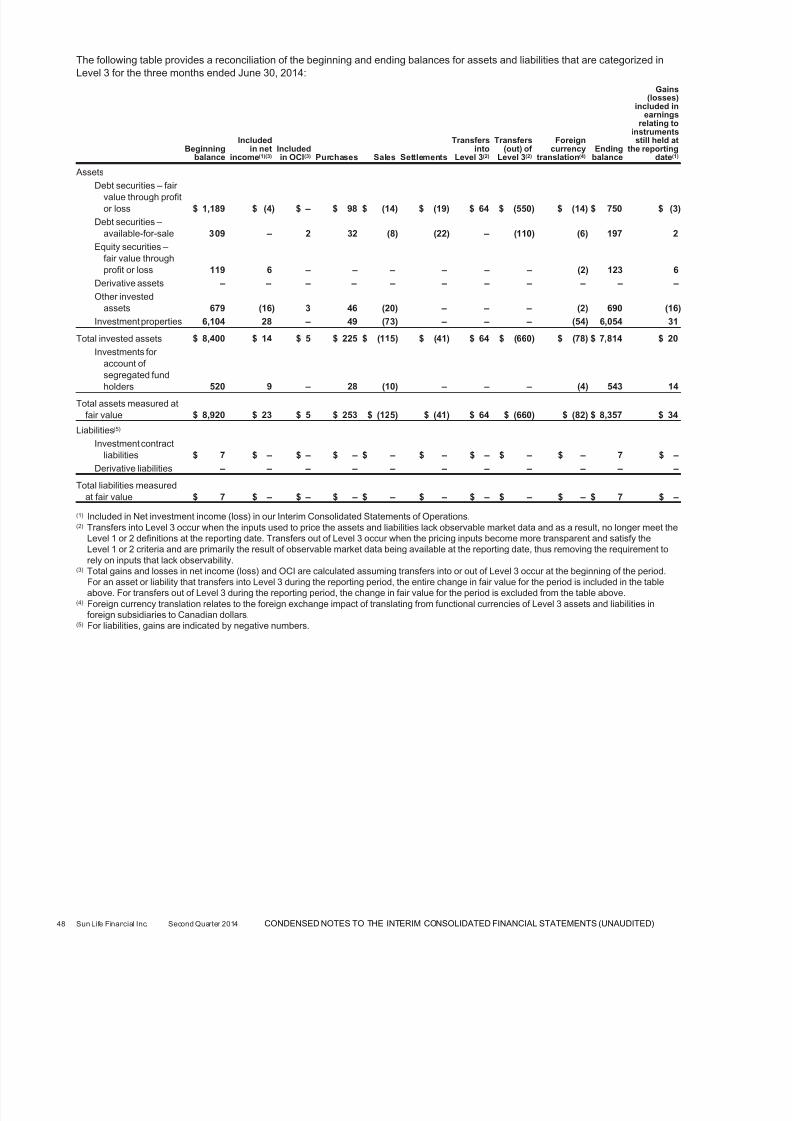
The following table provides a reconciliation of the beginning and ending balances for assets and liabilities that are categorized inLevel 3 for the three months ended June 30, 2014:
(1) Included in Net investment income (loss) in our Interim Consolidated Statements of Operations.(2) Transfers into Level 3 occur when the inputs used to price the assets and liabilities lack observable market data and as a result, no longer meet the
Level 1 or 2 definitions at the reporting date. Transfers out of Level 3 occur when the pricing inputs become more transparent and satisfy theLevel 1 or 2 criteria and are primarily the result of observable market data being available at the reporting date, thus removing the requirement torely on inputs that lack observability.
(3) Total gains and losses in net income (loss) and OCI are calculated assuming transfers into or out of Level 3 occur at the beginning of the period.For an asset or liability that transfers into Level 3 during the reporting period, the entire change in fair value for the period is included in the tableabove. For transfers out of Level 3 during the reporting period, the change in fair value for the period is excluded from the table above.
(4) Foreign currency translation relates to the foreign exchange impact of translating from functional currencies of Level 3 assets and liabilities inforeign subsidiaries to Canadian dollars.
(5) For liabilities, gains are indicated by negative numbers.
48 Sun Life Financial Inc. Second Quarter 2014 CONDENSED NOTES TO THE INTERIM CONSOLIDATED FINANCIAL STATEMENTS (UNAUDITED)
The following table provides a reconciliation of the beginning and ending balances for assets and liabilities that are categorized inLevel 3 for the six months ended June 30, 2014:
(1) Included in Net investment income (loss) in our Interim Consolidated Statements of Operations.(2) Transfers into Level 3 occur when the inputs used to price the assets and liabilities lack observable market data and as a result, no longer meet the
Level 1 or 2 definitions at the reporting date. Transfers out of Level 3 occur when the pricing inputs become more transparent and satisfy theLevel 1 or 2 criteria and are primarily the result of observable market data being available at the reporting date, thus removing the requirement to
rely on inputs that lack observability.(3) Total gains and losses in net income (loss) and OCI are calculated assuming transfers into or out of Level 3 occur at the beginning of the period.
For an asset or liability that transfers into Level 3 during the reporting period, the entire change in fair value for the period is included in the tableabove. For transfers out of Level 3 during the reporting period, the change in fair value for the period is excluded from the table above.
(4) Foreign currency translation relates to the foreign exchange impact of translating from functional currencies of Level 3 assets and liabilities inforeign subsidiaries to Canadian dollars.
(5) For liabilities, gains are indicated by negative numbers.
CONDENSED NOTES TO THE INTERIM CONSOLIDATED FINANCIAL STATEMENTS (UNAUDITED) Sun Life Financial Inc. Second Quarter 2014
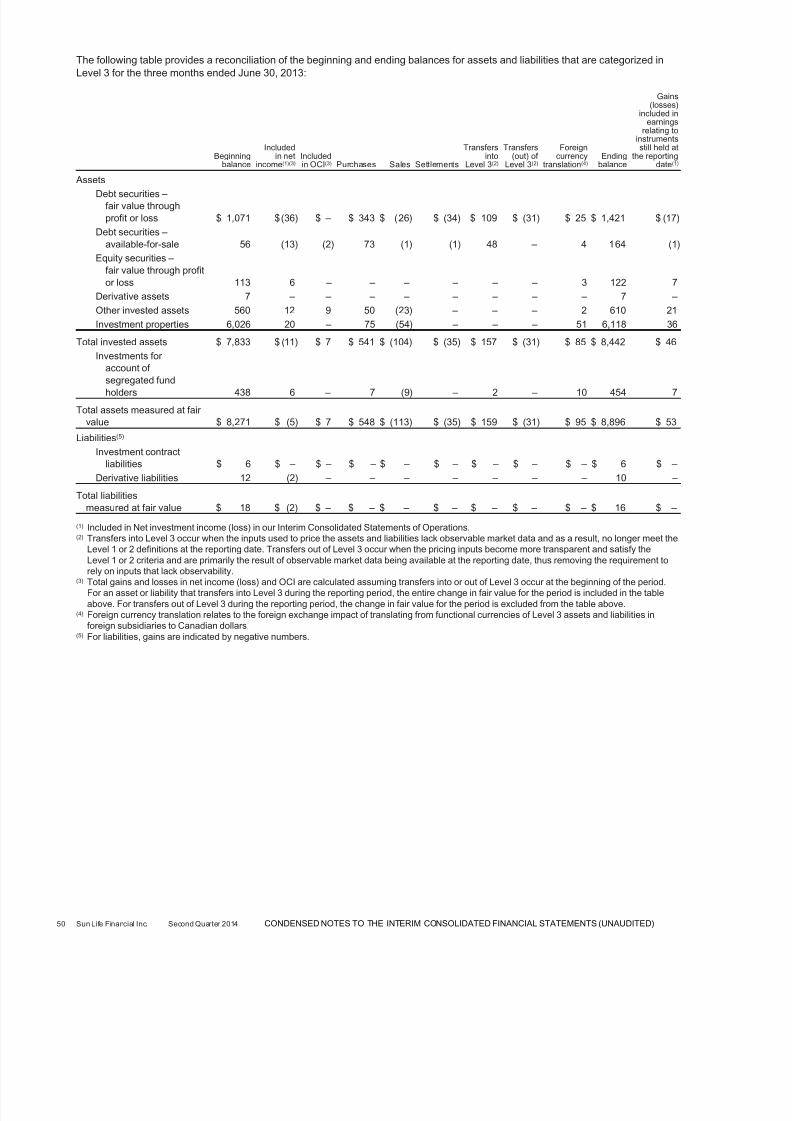
The following table provides a reconciliation of the beginning and ending balances for assets and liabilities that are categorized inLevel 3 for the three months ended June 30, 2013:
(1) Included in Net investment income (loss) in our Interim Consolidated Statements of Operations.(2) Transfers into Level 3 occur when the inputs used to price the assets and liabilities lack observable market data and as a result, no longer meet the
Level 1 or 2 definitions at the reporting date. Transfers out of Level 3 occur when the pricing inputs become more transparent and satisfy theLevel 1 or 2 criteria and are primarily the result of observable market data being available at the reporting date, thus removing the requirement torely on inputs that lack observability.
(3) Total gains and losses in net income (loss) and OCI are calculated assuming transfers into or out of Level 3 occur at the beginning of the period.For an asset or liability that transfers into Level 3 during the reporting period, the entire change in fair value for the period is included in the tableabove. For transfers out of Level 3 during the reporting period, the change in fair value for the period is excluded from the table above.
(4) Foreign currency translation relates to the foreign exchange impact of translating from functional currencies of Level 3 assets and liabilities inforeign subsidiaries to Canadian dollars.
(5) For liabilities, gains are indicated by negative numbers.
50 Sun Life Financial Inc. Second Quarter 2014 CONDENSED NOTES TO THE INTERIM CONSOLIDATED FINANCIAL STATEMENTS (UNAUDITED)
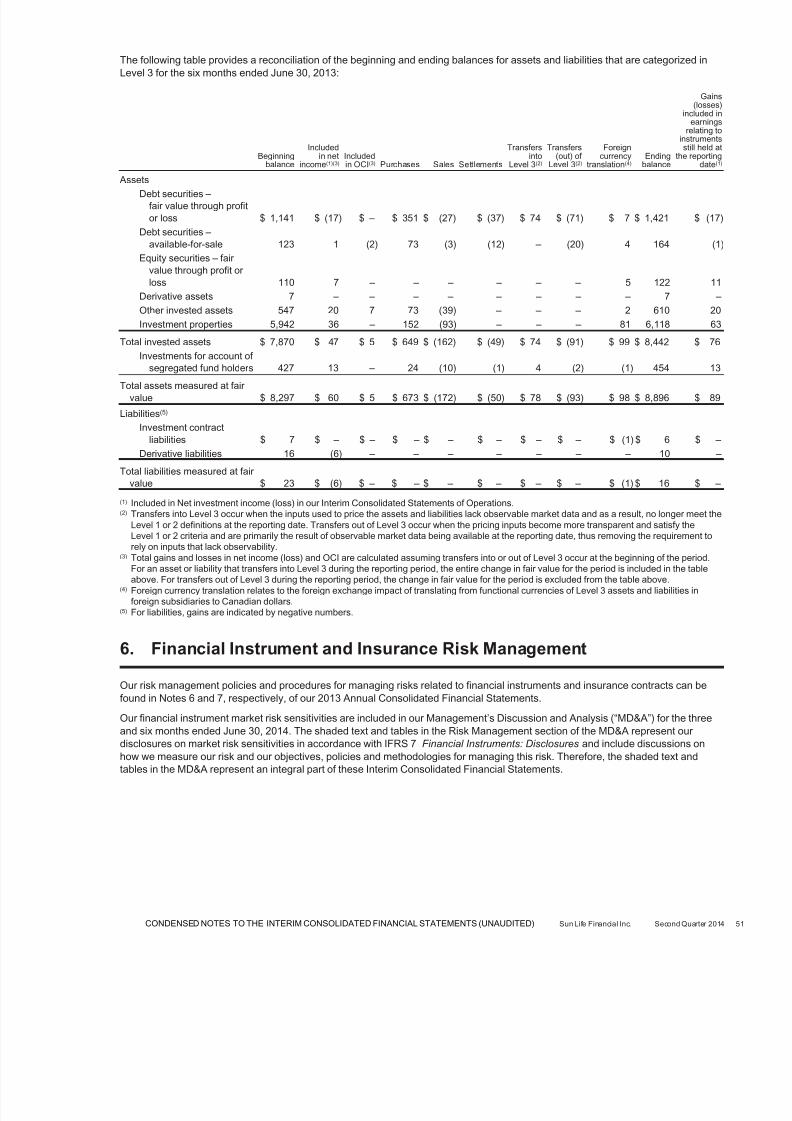
The following table provides a reconciliation of the beginning and ending balances for assets and liabilities that are categorized inLevel 3 for the six months ended June 30, 2013:
Total liabilities measured at fair value $ 23 $ (6) $ – $ – $ – $ – $ – $ – $ (1) $ 16 $ –
(1) Included in Net investment income (loss) in our Interim Consolidated Statements of Operations.(2) Transfers into Level 3 occur when the inputs used to price the assets and liabilities lack observable market data and as a result, no longer meet the
Level 1 or 2 definitions at the reporting date. Transfers out of Level 3 occur when the pricing inputs become more transparent and satisfy theLevel 1 or 2 criteria and are primarily the result of observable market data being available at the reporting date, thus removing the requirement torely on inputs that lack observability.
(3) Total gains and losses in net income (loss) and OCI are calculated assuming transfers into or out of Level 3 occur at the beginning of the period.For an asset or liability that transfers into Level 3 during the reporting period, the entire change in fair value for the period is included in the tableabove. For transfers out of Level 3 during the reporting period, the change in fair value for the period is excluded from the table above.
(4) Foreign currency translation relates to the foreign exchange impact of translating from functional currencies of Level 3 assets and liabilities inforeign subsidiaries to Canadian dollars.
(5) For liabilities, gains are indicated by negative numbers.
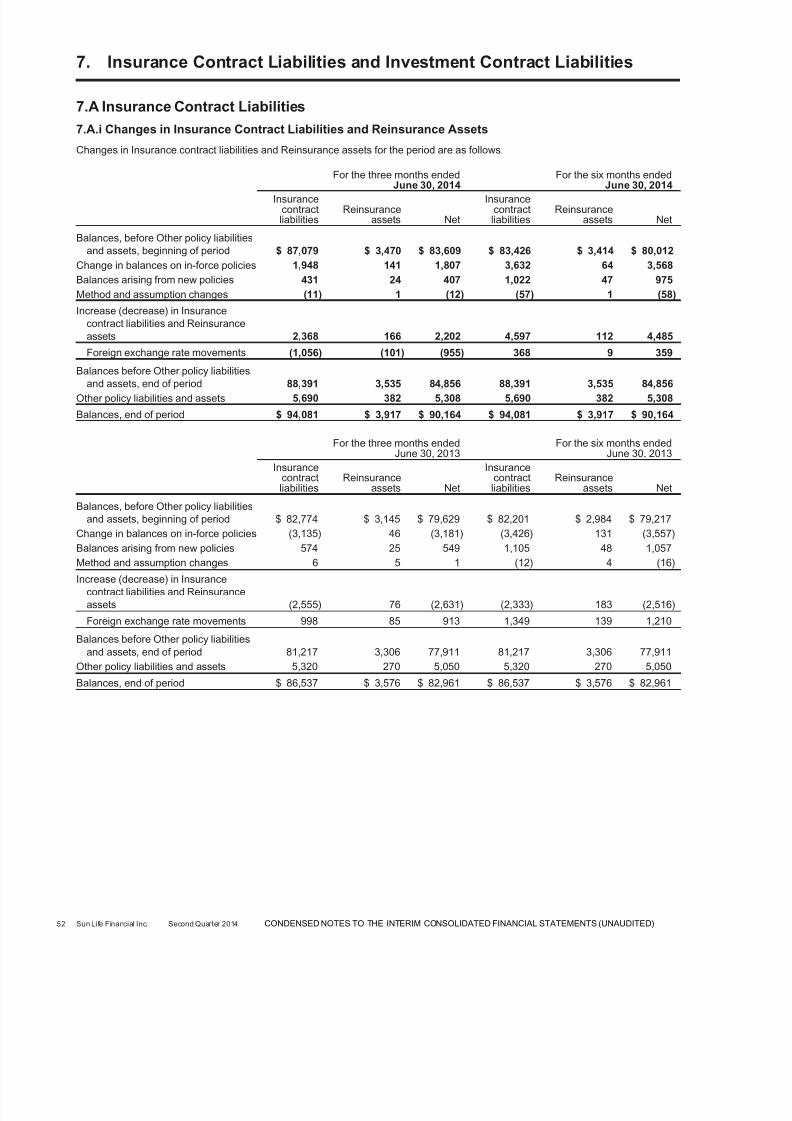
6. Financial Instrument and Insurance Risk Management
Our risk management policies and procedures for managing risks related to financial instruments and insurance contracts can befound in Notes 6 and 7, respectively, of our 2013 Annual Consolidated Financial Statements.
Our financial instrument market risk sensitivities are included in our Management’s Discussion and Analysis (“MD&A”) for the threeand six months ended June 30, 2014. The shaded text and tables in the Risk Management section of the MD&A represent our
disclosures on market risk sensitivities in accordance with IFRS 7 Financial Instruments: Disclosures and include discussions onhow we measure our risk and our objectives, policies and methodologies for managing this risk. Therefore, the shaded text andtables in the MD&A represent an integral part of these Interim Consolidated Financial Statements.
CONDENSED NOTES TO THE INTERIM CONSOLIDATED FINANCIAL STATEMENTS (UNAUDITED) Sun Life Financial Inc. Second Quarter 2014
Adjustments in respect of prior periods,including resolution of tax disputes (7) (1.2) (5) (0.9) (17) (1.5) (1) (0.1)
Other 1 0.2 (2) (0.3) 1 0.1 (5) (0.4)
Total tax expense (benefit) and effectiveincome tax rate $ 134 22.8 $ 108 20.5 $ 251 22 $ 193 18.5
Our statutory income tax rate in Canada is 26.5% (26.5% in 2013). Statutory income tax rates in other jurisdictions in which weconduct business range from 0% to 35% which creates a tax rate differential and corresponding tax provision difference comparedto the Canadian federal and provincial statutory rate when applied to foreign income not subject to tax in Canada. These differencesare reported in the line Higher (lower) effective rates on income subject to taxation in foreign jurisdictions.
Higher (lower) effective rates on income subject to taxation in foreign jurisdictions for the three and six months ended June 30, 2014reflects the impact of higher earnings in higher tax rate jurisdictions, predominantly in the U.S. The benefit reported in thecomparative periods in 2013 resulted from higher earnings in lower tax rate jurisdictions.
The benefit of lower taxes on investment income reported for the three and six months ended June 30, 2014 amounted to $32 and$77, respectively ($12 and $51 for the three and six months ended June 30, 2013) and reflects the impact of higher tax-exemptinvestment income in 2014, compared to 2013.
Adjustments in respect of prior periods, including resolution of tax disputes for the three and six months ended June 30, 2014,reflects a number of adjustments in various tax jurisdictions in relation to final settlement and closure of taxation years, finalizationof prior years’ income tax returns and successful resolution of tax audits.
54 Sun Life Financial Inc. Second Quarter 2014 CONDENSED NOTES TO THE INTERIM CONSOLIDATED FINANCIAL STATEMENTS (UNAUDITED)
10.A CapitalOur capital base is structured to exceed minimum regulatory and internal capital targets and maintain strong credit and financialstrength ratings while maintaining a capital efficient structure. We strive to achieve an optimal capital structure by balancing the useof debt and equity financing. Capital is managed both on a consolidated basis under principles that consider all the risks associatedwith the business as well as at the business group level under the principles appropriate to the jurisdiction in which each operates.We manage the capital for all of our international subsidiaries on a local statutory basis in a manner commensurate with their
individual risk profiles. Further details on our capital and how it is managed are included in Note 22 of our 2013 AnnualConsolidated Financial Statements.
Sun Life Assurance is subject to the Minimum Continuing Capital and Surplus Requirements (“MCCSR”) of the Office of theSuperintendent of Financial Institutions, Canada (“OSFI”). Sun Life Assurance’s MCCSR ratio as at June 30, 2014 was above theminimum levels that would require any regulatory or corrective action. In the U.S., Sun Life Assurance operates through a branchwhich is subject to U.S. regulatory supervision and it exceeded the levels under which regulatory action would be required as atJune 30, 2014. In addition, other subsidiaries of SLF Inc. that must comply with local capital or solvency requirements in the
jurisdiction in which they operate maintained capital levels above minimum local requirements as at June 30, 2014.
As of January 1, 2013, Sun Life Assurance elected the phase-in of the impact on available capital of adopting the revisions toIAS 19 Employee Benefits relating to cumulative changes in liabilities for defined benefit plans, as per OSFI’s 2013 MCCSRGuideline. Sun Life Assurance is phasing in a reduction of approximately $155 to its available capital over eight quarters, ending inthe fourth quarter of 2014.
Our capital base consists mainly of common shareholders’ equity, participating policyholders’ equity, preferred shareholders’ equityand certain other capital securities that qualify as regulatory capital.
10.B Significant Capital Transactions
10.B.i Subordinated Debt
On March 31, 2014, SLF Inc. redeemed all of the outstanding $500 principal amount of Series 2009-1 Subordinated Unsecured7.90% Fixed/Floating Debentures due 2019, at a redemption price equal to the principal amount together with accrued and unpaidinterest.
On May 13, 2014, SLF Inc. issued $250 principal amount of Series 2014-1 Subordinated Unsecured 2.77% Fixed/FloatingDebentures due 2024 (the “Debentures”). The net proceeds of $249 were used for general corporate purposes. The Debenturesbear interest at a fixed rate of 2.77% per annum payable in equal semi-annual instalments to, but excluding May 13, 2019, and,from May 13, 2019 to but excluding the maturity date, May 13, 2024, at a variable rate equal to the Canadian Dealer Offered Rate
plus 0.75% per annum payable in quarterly instalments. At SLF Inc.’s option, and subject to prior approval of OSFI, SLF Inc. mayredeem the Debentures, in whole or in part, on or after May 13, 2019 at a redemption price equal to par, together with accrued andunpaid interest to, but excluding, the date fixed for redemption. The Debentures are direct, unsecured subordinated obligations of SLF Inc. and rank equally and rateably with all other subordinated unsecured indebtedness of SLF Inc. The Debentures qualify ascapital for Canadian regulatory purposes.
10.B.ii Preferred Shares
On June 30, 2014, SLF Inc. redeemed all of its $250 Class A Non-Cumulative 5-Year Rate Reset Preferred Shares Series 6R at aredemption price of $25.00 per share, together with all declared and unpaid dividends. At redemption, we recorded $246 toPreferred shares and $4 to Retained earnings in our Interim Consolidated Statement of Changes in Equity.
10.B.iii Dividend Reinvestment and Share Purchase Plan
In the first two quarters of 2014, under the Dividend Reinvestment and Share Purchase Plan, SLF Inc. issued 1.2 million commonshares from treasury with no discount for dividend reinvestments (4.6 million common shares in the first two quarters of 2013 wereissued at a discount of 2% to the average market price). SLF Inc. also issued an insignificant number of common shares fromtreasury at no discount for optional cash purchases.
CONDENSED NOTES TO THE INTERIM CONSOLIDATED FINANCIAL STATEMENTS (UNAUDITED) Sun Life Financial Inc. Second Quarter 2014
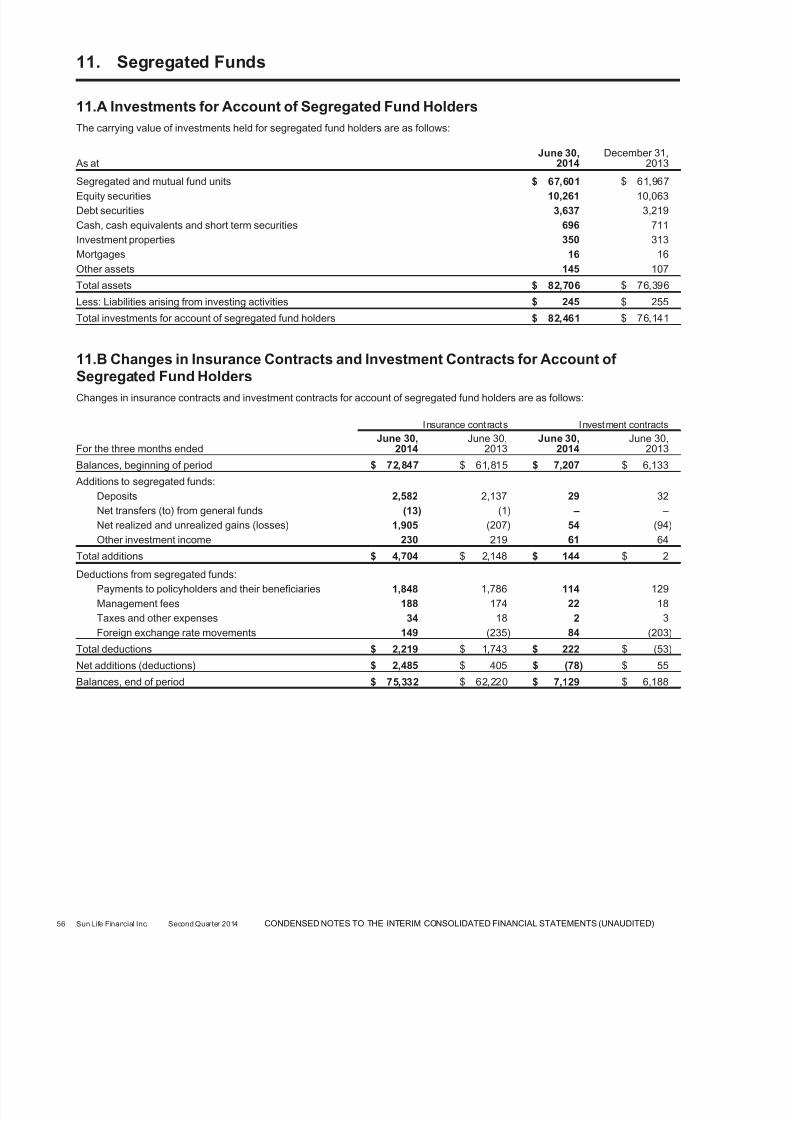
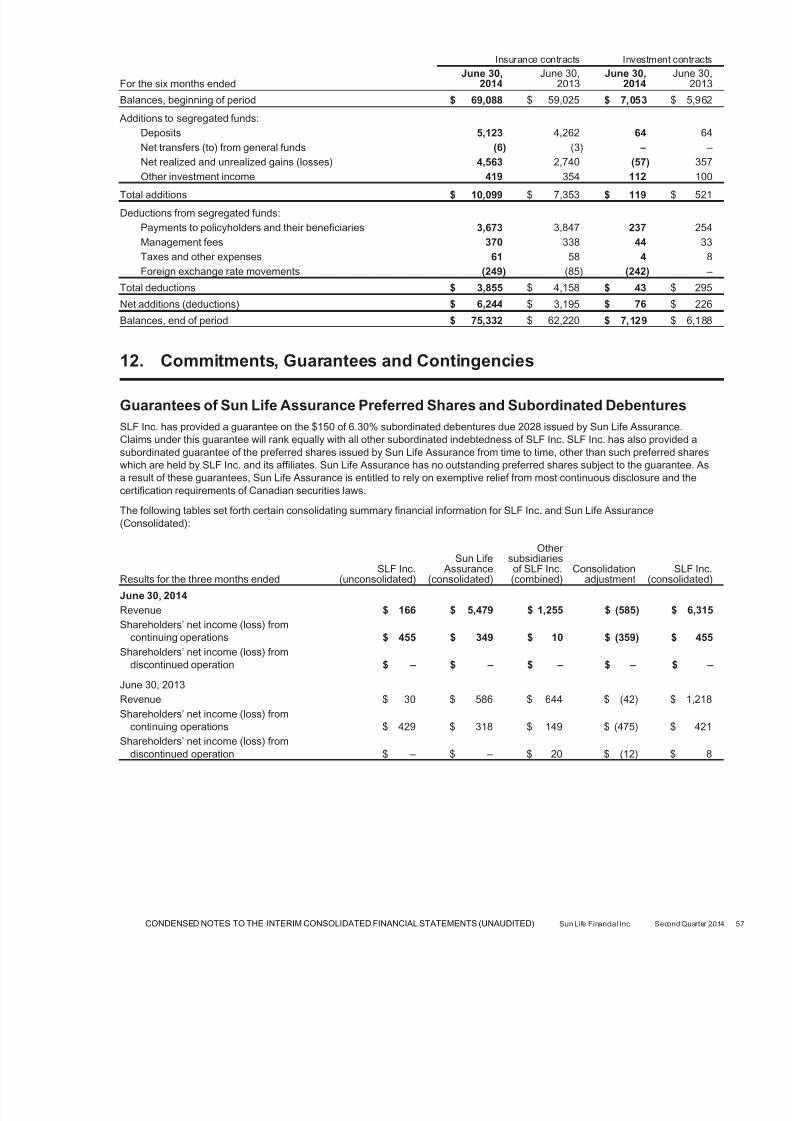
Balances, end of period $ 75,332 $ 62,220 $ 7,129 $ 6,188
12. Commitments, Guarantees and Contingencies
Guarantees of Sun Life Assurance Preferred Shares and Subordinated Debentures
SLF Inc. has provided a guarantee on the $150 of 6.30% subordinated debentures due 2028 issued by Sun Life Assurance.Claims under this guarantee will rank equally with all other subordinated indebtedness of SLF Inc. SLF Inc. has also provided asubordinated guarantee of the preferred shares issued by Sun Life Assurance from time to time, other than such preferred shareswhich are held by SLF Inc. and its affiliates. Sun Life Assurance has no outstanding preferred shares subject to the guarantee. Asa result of these guarantees, Sun Life Assurance is entitled to rely on exemptive relief from most continuous disclosure and thecertification requirements of Canadian securities laws.
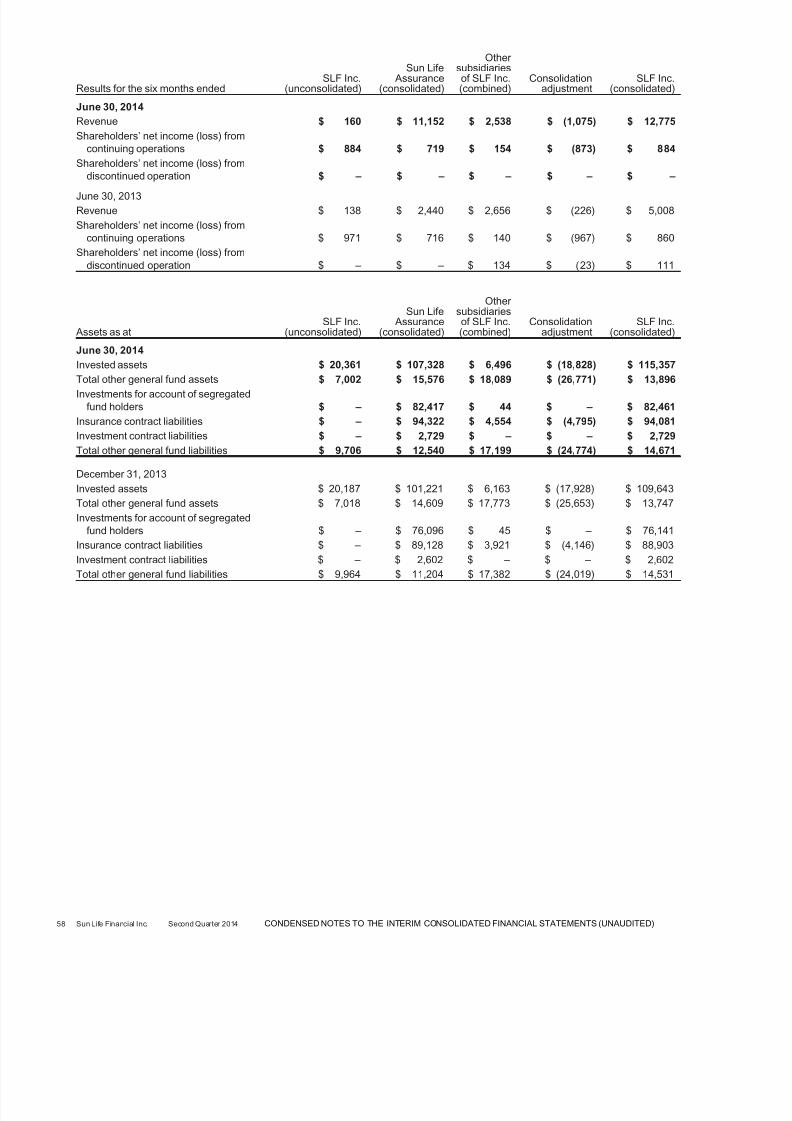
The following tables set forth certain consolidating summary financial information for SLF Inc. and Sun Life Assurance(Consolidated):
Results for the three months endedSLF Inc.
(unconsolidated)
Sun Life Assurance
(consolidated)
Other subsidiaries
of SLF Inc.(combined)
Consolidationadjustment
SLF Inc.(consolidated)
June 30, 2014
Revenue $ 166 $ 5,479 $ 1,255 $ (585) $ 6,315
Shareholders’ net income (loss) fromcontinuing operations $ 455 $ 349 $ 10 $ (359) $ 455
Shareholders’ net income (loss) fromdiscontinued operation $ – $ – $ – $ – $ –
June 30, 2013
Revenue $ 30 $ 586 $ 644 $ (42) $ 1,218
Shareholders’ net income (loss) fromcontinuing operations $ 429 $ 318 $ 149 $ (475) $ 421
Shareholders’ net income (loss) fromdiscontinued operation $ – $ – $ 20 $ (12) $ 8
CONDENSED NOTES TO THE INTERIM CONSOLIDATED FINANCIAL STATEMENTS (UNAUDITED) Sun Life Financial Inc. Second Quarter 2014
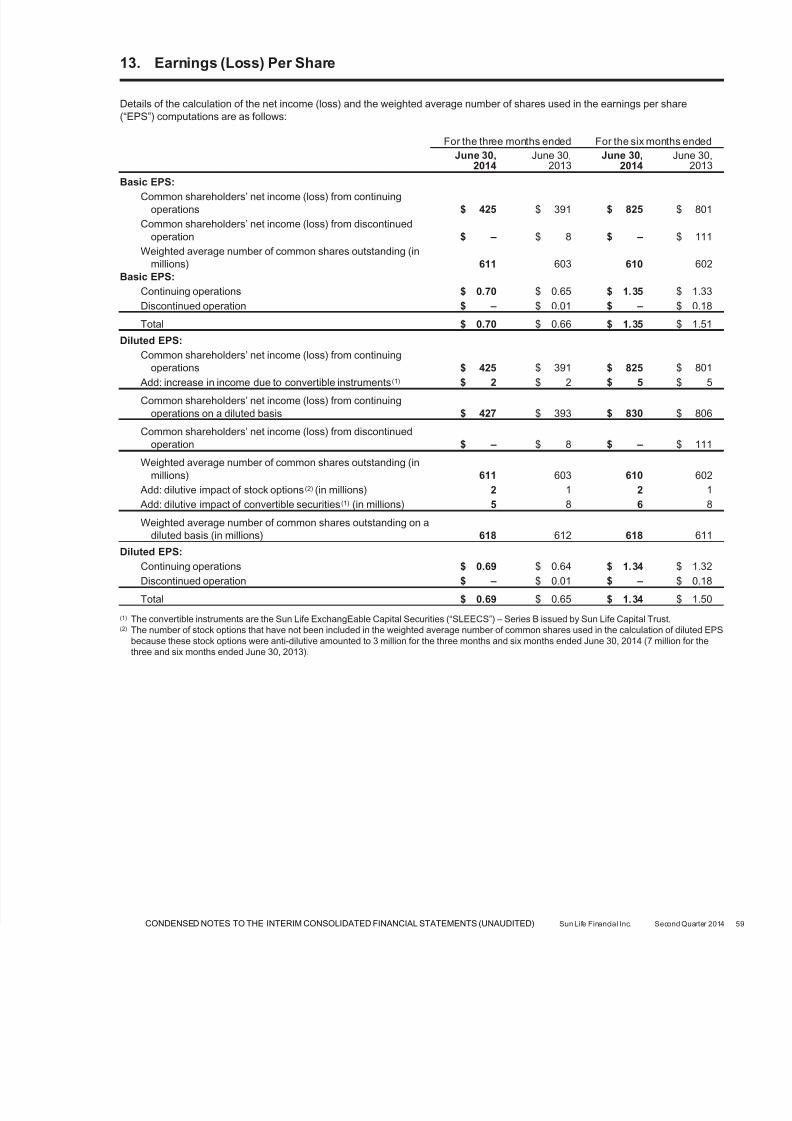
Details of the calculation of the net income (loss) and the weighted average number of shares used in the earnings per share(“EPS”) computations are as follows:
For the three months ended For the six months ended
June 30,2014
June 30,2013
June 30,2014
June 30,2013
Basic EPS:Common shareholders’ net income (loss) from continuing
operations $ 425 $ 391 $ 825 $ 801
Common shareholders’ net income (loss) from discontinuedoperation $ – $ 8 $ – $ 111
Weighted average number of common shares outstanding (inmillions) 611 603 610 602
(1) The convertible instruments are the Sun Life ExchangEable Capital Securities (“SLEECS”) – Series B issued by Sun Life Capital Trust.(2) The number of stock options that have not been included in the weighted average number of common shares used in the calculation of diluted EPS
because these stock options were anti-dilutive amounted to 3 million for the three months and six months ended June 30, 2014 (7 million for thethree and six months ended June 30, 2013).