16
1 Sundaram Equity Multiplier June 2015 Mutual Fund Investments are subject to market risks, read all scheme related documents carefully
| Date post: | 12-Jun-2018 |
| Category: |
Documents |
| Upload: | dangnguyet |
| View: | 218 times |
| Download: | 1 times |

1
Sundaram Equity Multiplier June 2015
Mutual Fund Investments are subject to market risks, read all scheme related documents carefully

2
Fund Strategy at launch
• Identify attractive opportunities and take concentrated exposures
• Invest across sectors and market-cap category
• Adopt a stock-specific approach rather than sector-specific approach
• Select stocks with at least one-to-two years perspective
• Make strategic sector calls and tactical stock calls; Active cash calls
• Deploy up to 35 per cent in cash equivalents if market conditions warrant
• Participate in wealth creation, if any, through tax-free dividend & tax-free capital gains
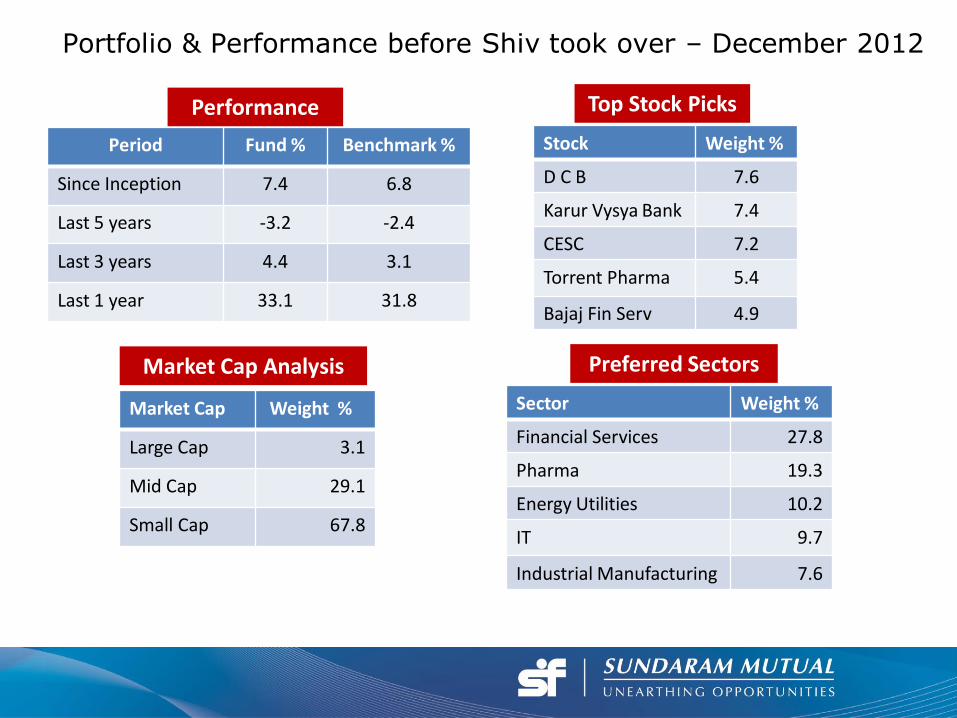
Portfolio & Performance before Shiv took over – December 2012
3
Period Fund % Benchmark %
Since Inception 7.4 6.8
Last 5 years -3.2 -2.4
Last 3 years 4.4 3.1
Last 1 year 33.1 31.8
Stock Weight %
D C B 7.6
Karur Vysya Bank 7.4
CESC 7.2
Torrent Pharma 5.4
Bajaj Fin Serv 4.9
Market Cap Weight %
Large Cap 3.1
Mid Cap 29.1
Small Cap 67.8
Sector Weight %
Financial Services 27.8
Pharma 19.3
Energy Utilities 10.2
IT 9.7
Industrial Manufacturing 7.6
Performance Top Stock Picks
Market Cap Analysis Preferred Sectors

4
Once Shiv took over - Jan 2013

5
Fund Strategy
The fund manager will also use 10-20% of the AUM to tactically invest in derivatives. These investments will act as a hedge during periods of market weakness.
Asset Allocation
• Large Caps: 50-55%
• Mid Caps: 45-50%
Large Cap Segment
•Combination of top down & bottom up approach with alpha generation from two key sources:
•Aggressive sector positioning vis-a-vis benchmark
• Selective contra bets at stock level
Mid and Small Cap Segment
•Allocation across domestic and MNCs with strong balance sheets , good corporate governance & good management
•Gillette India Ltd (held for over 15 months) and Elantas Beck India Ltd (held for over 2 months)

Case Study: Infosys Ltd
• Infosys have been beleaguered due to lack of leadership and performance lagged peers
• Consequently, there have a significant de-rating of the stock with Infosys trading at a steep 30% discount
to its peer TCS
• However, appointment of new CEO, Dr. Vishal Sikka in May 2014 brought in confidence amongst
investors
• Consequently, the stock has got re-rated by 20% in last 1 year with discount to TCS reducing from 30% to
10%
• Further re-rating would be dependent upon the delivery of new leadership team
6

7
Market Cap Analysis
Weighted Average Market Cap Rs. 96,595 crore Median Market Cap Rs. 22,861 crore
Source: In house calculations as on June 30, 2015
Market Cap Trend – Last two years As on June 30, 2015

Portfolio changes in 2013
Stocks
Feb-2013 Elantas Beck
July-2013 Hindustan Unilever
Jan-2013 United Phosphorous
May-2013 O N G C
July-2013 Gujarat Ambuja
8
Stocks
July-2013 Jet Airways
Apr-2013 PVR
May-2013 Crompton Greaves
Apr-2013 GlenMark
Feb-2013 Titan
Top Entrants
Top Exits

Contributors to performance in 2013
9
Repco Home Finance
Tech Mahindra
Vatech Wabag
NCC
Britania Industries
Sectors
Top 3 Contributors
IT
Financials
Industrials
Bottom 3 Contributors
Consumer Discretionary
Healthcare
Telecom
Top 5 Stock
Contributors
Karur Vysya Bank
IVRCL
Bajaj Finserv
Shasun Pharma
Vascon Engineering
Bottom 5 Stock
Detractors
10
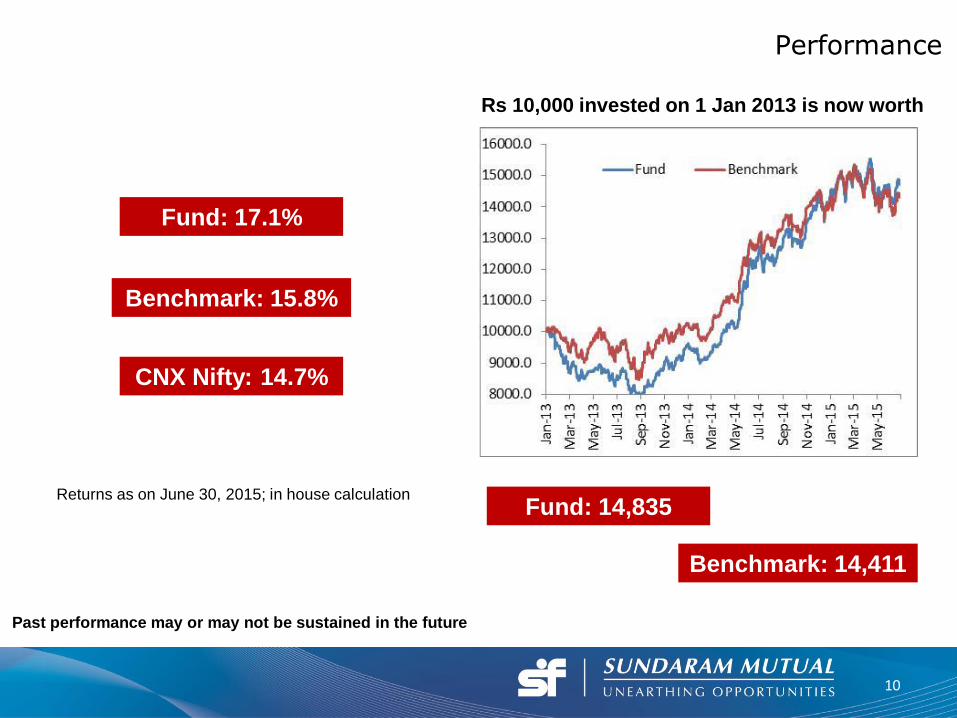
Past performance may or may not be sustained in the future
Performance
Returns as on June 30, 2015; in house calculation
Fund: 14,448 Benchmark: 14,102
Rs 10,000 invested on 1 Jan 2013 is now worth
Fund: 17.1%
Benchmark: 15.8%
CNX Nifty: 14.7%
Fund: 14,835
Benchmark: 14,411
11
Current Portfolio

12
Top 25 Stocks
Stock Market Cap Weight (%)
Reliance Industries LC 4.2
HDFC Bank LC 4.0
Infosys LC 3.7
State Bank Of India LC 3.6
Larsen & Toubro LC 3.4
ICICI Bank LC 3.3
T C S SC 2.9
Wipro SC 2.5
GIC Housing Finance LC 2.3
ICRA MC 2.2
TATA Communications LC 2.2
Eicher Motor SC 2.1
Ashoka Buildcon SC 2.0
VRL Logistics Ltd SC 2.0
Gillette India SC 1.7
SKF Bearings LC 1.7
Britannia Industries SC 1.7
ITC SC 1.7
Source: In house calculations as on April 30, 2015
Stock Market Cap Weight (%)
Elantas Beck India LC 1.6
Procter & Gamble SC 1.5
Chennai Petroleum LC 1.5
Torrent Pharma MC 1.5
Maruti MC 1.4
Sun Pharma LC 1.3
Punjab National Bank MC 1.3
Equity 87.6
Cash & Cash Equivalents
12.4
AUM (Rs Crore) 128

13
Past performance may or may not be sustained in the future
Fund Benchmark Nifty
Since Launch 10.4 9.5 9.6
Last 7 Years 12.5 11.6 11.0
Last 5 Years 10.9 9.3 9.5
Last 3 Years 21.4 18.3 16.6
Last 2 Years 32.4 23.7 19.7
Last 1 Year 18.6 11.7 9.9
Consistent outperformance in the long run
Returns as on June 30, 2015; in house calculation
Fund: 22,753
Benchmark: 21,395 Nifty: 21,491
Rs 10,000 invested at launch is now worth

Risk-Return Metrics
14
Past performance may or may not be sustained in the future
Parameter Fund Benchmark
Average Annual Mean 13.5 12.2
Standard Deviation 27.1 27.1
Beta 0.9 1.0
Sharpe Ratio 0.2 0.2
Sortino Ratio 0.3 0.2
Treynor Ratio 5.8 4.1
Benchmark: CNX 500
Risk-Return Metrics are based on month end NAVs since launch and have been annualised
The risk free rate considered for analysis is 8.0907% per annum (10 year T-Bill)
Parameter Fund
Alpha 1.5
Correlation 0.9
Tracking Error 9.5
Information Ratio 0.1
Turnover 90%
14
Data Source: In house calculations as on June 2015

15
Allotment Date February 2007
NAV (June 30, 2015) Regular Growth: Rs 22.7530 Regular Dividend: Rs 17.0854
Direct Growth: Rs 23.1322 Direct Dividend: Rs 17.3545
Objective
The objective of the scheme would be to seek capital appreciation by investing in equity & equity related instruments.
Asset allocation
Equity instruments (small & mid-cap stocks) (including derivatives): 65 – 100%
Debt Securities including securitised debt, Money market instruments: 0-35%.
Investment in overseas securities: Upto 35%
Investment in derivatives: upto 50%
Securitised debt: up to 30%.
Plans Regular & Direct
Options Growth, Dividend (Pay Out, Reinvestment & Sweep); Default Option: Growth; Default Sub-Option: Dividend Sweep
Load Structure Terms Of Offer: NAV; Exit Load: Redeemed within 12 months: 1 % ;
Redeemed after 12 months: NIL
Minimum Subscription Amount
First Investment: Rs 5000 Subsequent Purchase: Rs 500
SIP: Rs 1000 per week, Rs 250 per month, Rs 750 per quarter
Weekly SIP will be processed on Wednesdays
Fund Facts
15

General Disclaimer: This document is issued by Sundaram Asset Management; an investment manager registered with the Securities and Exchange Board of India in India and is produced for information purposes only. It is not a prospectus, scheme information document, offer document, offer and solicitation, to name a few, to buy any securities or other investment. Information and opinion contained in this document are published for the assistance of the recipient only; they are not to be relied upon as authoritative or taken as a substitution for exercise of judgment by any recipient. They are subject to change without any notice and not intended to provide the sole basis of any evaluation of the instrument discussed or offer to buy. It is neither a solicitation to sell nor shall it form the basis of or be relied upon in connection with any contract or commitment whatsoever or be taken as investment advice. The information and opinions contained in this communication have been obtained from sources that Sundaram Asset Management believes to be reliable; no representation or warranty, express or implied, is made that such information is accurate or complete and it should not be relied upon as such. Sundaram Asset Management neither guarantees its accuracy and/or completeness nor does it guarantee to update the information from time to time. This communication is for private circulation only and for the exclusive and confidential use of the intended recipient(s) only. Any other distribution, use or reproduction of this communication in its entirety or any part thereof is unauthorized and strictly prohibited. By accepting this document you agree to be bound by the foregoing limitations. This communication is for general information only without regard to specific objectives, financial situations and needs of any particular person who may receive it and Sundaram Asset Management is not soliciting any action based on this document. Sundaram Asset Management in the discharge of its functions, may use any of the data presented in this document for its decision-making purpose and is not bound to disclose the same. Copies of the Statement of Additional Information, Scheme Information Document and application form with key information memorandum may be obtained from the offices of Sundaram Mutual offices and its authorized distributors or downloaded from www.sundarammutual.com For scheme specific risk factors, asset allocation, load structure, fund facts and taxation aspects please refer scheme information documents available online and at branches/Investor Service Centres; also at www.sundarammutual.com , Statutory: Mutual Fund: Sundaram Mutual Fund is a trust under Indian Trusts Act, 1882 Sponsors. Liability for sponsors is limited to Rs 1 lakh. Sponsors: Sundaram Finance Ltd. Investment Manager: Sundaram Asset Management Company Ltd. Trustee: Sundaram Trustee Company Ltd.
Disclosures
Disclaimer


