Suhas Harinarayanan Arun Aggarwal (91-22) 6766 3404 (91-22) 6766 3440 suhas.hari@religare.in arun.aggarwal@religare.in RCML: Winner of LIPPER-STARMINE broker award for “Earnings Estimates in Midcap Research 2008” | “Honourable Mention” in Institutional Investor 2009 | Voted amongst Top 5 most improved brokerages by Asia Money Poll 2009 | RCML Research is also available on Bloomberg FTIS <GO> and Thomson First Call Initiating Coverage 02 December 2010 Financial highlights (Rs mn) FY10 FY11E FY12E FY13E Revenue 284 1,629 14,246 22,417 Growth (%) 37.9 473.5 774.7 57.4 Adj net income 62 639 5,961 7,951 Growth (%) (64.2) 937.8 832.3 33.4 FDEPS (Rs) 1.0 10.2 94.7 126.3 Growth (%) (93.2) 937.8 832.3 33.4 Profitability and return ratios (%) FY10 FY11E FY12E FY13E EBITDA margin 37.9 57.5 63.9 54.0 EBIT margin 33.8 56.6 63.7 53.9 Adj PAT margin 21.7 39.3 41.8 35.5 ROE 1.5 10.1 62.8 49.2 ROIC 0.8 5.9 50.8 93.9 ROCE 0.9 5.9 43.3 39.1 Sunteck Realty Ltd Asset-light model with high cash flow visibility We initiate coverage on Sunteck Realty (SRL) with a BUY rating and a target price of Rs 800 (implied P/BV of 2x on FY13E), offering a 23% upside. SRL is one of the best plays on Mumbai’s super-luxury segment, with 67% of its land bank located in and around the city. We like SRL for: (1) its asset-light model through JVs and joint development agreements (JDA) with landowners, resulting in low land cost of Rs 409psf and high IRRs of 50–55%; (2) its three key super-luxury residential projects in BKC-Mumbai (a commercial hub), which form 25% of our GAV (Rs 285/sh) and are likely to generate net cash of Rs 30bn+ (pre-tax) over FY11- FY13; and (3) its strong financials with a adjusted D/E ratio of 0.4x and high operating cash flow visibility of Rs 6.7bn and Rs 17.5bn in FY12 and FY13 respectively. We estimate a sales/EPS CAGR of 326%/400% over FY10-FY13. Key risks are timely execution, approval delays and an economic slowdown. Asset-light business model: SRL holds 77% of its saleable area through JV/JDAs with landowners and the balance through slum rehabilitation schemes (SRA), redevelopment projects and land buyouts. We believe the JV/JDA model helps the company build a capital-efficient business by stripping away the investment on land purchase and allowing a greater focus on value addition. It also supports efficient capacity utilisation and higher IRR (50–55%). The cost of land via JDA/JVs is Rs 48/Rs 130psf for SRL, significantly lower than that of outright land buyouts. Cash flows to strengthen: SRL is currently developing three super-luxury residential projects in Mumbai’s BKC district. These projects form 25% of our gross annual value for the company and are likely to generate cash of Rs 30bn (pre-tax) over FY11-FY13 (in comparison, the company’s current market cap is ~Rs 39bn). We expect residential absorption of 4.0msf (FY11: 0.8msf; FY12: 1.7msf; FY13: 1.5msf) including the above projects, which will aid further cash generation during FY11-FY13. Operating cash flows during FY12 and FY13 are estimated at Rs 6.7bn and Rs 17.5bn respectively, which will likely be utilised for further land acquisition. SRL’s adjusted D/E ratio of 0.4x could decline further, in our view. Improving revenue and margin profile: Since SRL follows the project completion method, a bulk of the revenue from ongoing projects is expected in FY12 and FY13. The company’s EBITDA margin is also likely to improve from 38% in FY10 to 54% in FY13 as high end luxury projects get recognised. Initiate with BUY: We value SRL at a 20% discount to NAV, translating to a target price of Rs 800. Key risks to our estimates are execution risk, rules and regulations in newer territories which may delay projects, and a slowdown in the economy. CMP TARGET RATING RISK Rs 615 Rs 800 BUY HIGH BSE NSE BLOOMBERG 512179 SUNTECK SRL IN Company data Market cap (Rs mn / US$ mn) 38,726/850 Outstanding equity shares (mn) 63 Free float (%) 16.9 Dividend yield (%) - 52-week high/low (Rs) 714 / 480 2-month average daily volume 112,665 Stock performance Returns (%) CMP 1-mth 3-mth 6-mth SRL (8.4) (1.1) 0.9 (8.4) BSE REAL 1.8 18.3 21.4 1.8 Sensex (3.1) 7.8 15.1 (3.1) Valuation matrix (x) FY10 FY11E FY12E FY13E P/E @ CMP 629.5 60.7 6.5 4.9 P/E @ Target 786.9 75.8 8.1 6.1 EV/EBITDA @ CMP 404.7 46.5 4.8 3.6
Transcript
Sunteck Realty Ltd Initiating Coverage 02 December 2010
RCML: Winner of LIPPER-STARMINE broker award for “Earnings Estimates in Midcap Research 2008” | “Honourable Mention” in Institutional Investor 2009 | Voted amongst Top 5 most improved brokerages by
Asia Money Poll 2009 | RCML Research is also available on Bloomberg FTIS <GO> and Thomson First Call
Initiating Coverage 02 December 2010
Financial highlights
(Rs mn) FY10 FY11E FY12E FY13E
Revenue 284 1,629 14,246 22,417
Growth (%) 37.9 473.5 774.7 57.4
Adj net income 62 639 5,961 7,951
Growth (%) (64.2) 937.8 832.3 33.4
FDEPS (Rs) 1.0 10.2 94.7 126.3
Growth (%) (93.2) 937.8 832.3 33.4
Profitability and return ratios
(%) FY10 FY11E FY12E FY13E
EBITDA margin 37.9 57.5 63.9 54.0
EBIT margin 33.8 56.6 63.7 53.9
Adj PAT margin 21.7 39.3 41.8 35.5
ROE 1.5 10.1 62.8 49.2
ROIC 0.8 5.9 50.8 93.9
ROCE 0.9 5.9 43.3 39.1
Sunteck Realty Ltd Asset-light model with high cash flow visibility
We initiate coverage on Sunteck Realty (SRL) with a BUY rating and a target price of Rs 800 (implied P/BV of 2x on FY13E), offering a 23% upside. SRL is one of the best plays on Mumbai’s super-luxury segment, with 67% of its land bank located in and around the city. We like SRL for: (1) its asset-light model through JVs and joint development agreements (JDA) with landowners, resulting in low land cost of Rs 409psf and high IRRs of 50–55%; (2) its three key super-luxury residential projects in BKC-Mumbai (a commercial hub), which form 25% of our GAV (Rs 285/sh) and are likely to generate net cash of Rs 30bn+ (pre-tax) over FY11-FY13; and (3) its strong financials with a adjusted D/E ratio of 0.4x and high operating cash flow visibility of Rs 6.7bn and Rs 17.5bn in FY12 and FY13 respectively. We estimate a sales/EPS CAGR of 326%/400% over FY10-FY13. Key risks are timely execution, approval delays and an economic slowdown.
Asset-light business model: SRL holds 77% of its saleable area through JV/JDAs with landowners and the balance through slum rehabilitation schemes (SRA), redevelopment projects and land buyouts. We believe the JV/JDA model helps the company build a capital-efficient business by stripping away the investment on land purchase and allowing a greater focus on value addition. It also supports efficient capacity utilisation and higher IRR (50–55%). The cost of land via JDA/JVs is Rs 48/Rs 130psf for SRL, significantly lower than that of outright land buyouts.
Cash flows to strengthen: SRL is currently developing three super-luxury residential projects in Mumbai’s BKC district. These projects form 25% of our gross annual value for the company and are likely to generate cash of Rs 30bn (pre-tax) over FY11-FY13 (in comparison, the company’s current market cap is ~Rs 39bn). We expect residential absorption of 4.0msf (FY11: 0.8msf; FY12: 1.7msf; FY13: 1.5msf) including the above projects, which will aid further cash generation during FY11-FY13. Operating cash flows during FY12 and FY13 are estimated at Rs 6.7bn and Rs 17.5bn respectively, which will likely be utilised for further land acquisition. SRL’s adjusted D/E ratio of 0.4x could decline further, in our view.
Improving revenue and margin profile: Since SRL follows the project completion method, a bulk of the revenue from ongoing projects is expected in FY12 and FY13. The company’s EBITDA margin is also likely to improve from 38% in FY10 to 54% in FY13 as high end luxury projects get recognised.
Initiate with BUY: We value SRL at a 20% discount to NAV, translating to a target price of Rs 800. Key risks to our estimates are execution risk, rules and regulations in newer territories which may delay projects, and a slowdown in the economy.
CMP TARGET RATING RISK
Rs 615 Rs 800 BUY HIGH
BSE NSE BLOOMBERG
512179 SUNTECK SRL IN
Company data
Market cap (Rs mn / US$ mn) 38,726/850
Outstanding equity shares (mn) 63
Free float (%) 16.9
Dividend yield (%) -
52-week high/low (Rs) 714 / 480
2-month average daily volume 112,665
Stock performance
Returns (%) CMP 1-mth 3-mth 6-mth
SRL (8.4) (1.1) 0.9 (8.4)
BSE REAL 1.8 18.3 21.4 1.8
Sensex (3.1) 7.8 15.1 (3.1)
Valuation matrix
(x) FY10 FY11E FY12E FY13E
P/E @ CMP 629.5 60.7 6.5 4.9
P/E @ Target 786.9 75.8 8.1 6.1
EV/EBITDA @ CMP 404.7 46.5 4.8 3.6
Sunteck Realty Ltd Initiating Coverage 02 December 2010
2
Investment rationale
Unique strategy minimises capital commitment SRL has acquired 77% of its land bank through joint ventures and joint development agreements with landowners. This model reduces the early capital commitment for the company as it is spared the heavy land acquisition costs. Moreover, apart from JV/JDAs, SRL has certain projects under slum rehabilitation and redevelopment schemes, which require lower capital commitments. The company has thus incurred a significantly lower cost (per sq ft) for these assets as compared to the direct purchase or buyout of land. Moreover, all the land acquisitions through JVs/JDAs and buyouts have been evenly spread out over earlier years (Fig-2).
Fig 1 - Model-wise land cost
Model Total area (msf)
Eco Interest (msf)
Total cost (Rs psf)
SRL cost (Rs psf)
Total (Rs psf)
SRL(Rs psf)
JV 4.4 4.4 1,268 577 285 130
JDA 20.5 13.5 1,282 641 63 48
Redevelopment 0.2 0.2 243 243 1,398 1,398
SRA 2.8 2.4 443 443 159 187
Buyout 4.1 4.1 13,218 8,149 3,186 1,964
Total 32.0 25.0 16,455 10,052
Source: Company, RCML Research
Fig 2 - Land acquisition evenly distributed
Sunteck Center Sunteck Samruddha
Signature Island
Signia Woods
Signia Poonam
Sunteck Grandeur
Sunteck Kanaka
Sunteck Crest
Signia Skys
Oman Villas
Signia Isles I
Signia Gardens
Signia Star
Sunteck Classic
Signia City (Jaipur)
Signia City (Thane)
Nagpur Ent. City
Signia Oceans
Signia City (Mulund)
Signia Pearl
Sunteck City
Signia Dadar
Signia Mahalaxmi
Sunteck Kalina
Signia Andheri (W)
In Pipeline 2
In Pipeline 3
0
2
4
6
8
10
2005 2006 2007 2008 2009 2010
New
Pro
ject
s
Year Acquired
Project Accretion
0.2 Mn sqft
1.1 Mn sqft
2.2 Mn sqft
23.1 Mn sqft
0.3 Mn sqft
5.4 Mn sqft
Signia, N. MumbaiIndia REIT Investment in S Island
Kotak REF investment in Sunteck
Debenture issued to Kotak REF-Signia Isles
CY
Source: Company
Strong cash flow from launch pipeline SRL has projects covering over 2.5msf under construction and is likely to launch a further 3.5msf in FY11. We expect residential absorption of 4msf over FY11-FY13. We believe the resultant cash flows would be utilised for self-financing of residential projects and for land acquisition. A bulk of these flows (Rs 30bn+) is likely to come from three residential properties: Signature Island and Signia Isle-I in FY11 and FY12 respectively, followed by Signia Pearl in FY13—these projects cumulatively account for 25% of our GAV (Fig-4). Moreover SRL has 0.22 msf of leased assets which contributes over Rs 150 mn pa .We expect operational cash flows of Rs 6.7 and Rs 17.5bn in FY12 and FY13 respectively.
JV/JDA model frees up capital for
further land acquisition
3 BKC projects alone could contribute
cash flows in excess of Rs 30bn by FY13
Sunteck Realty Ltd Initiating Coverage 02 December 2010
3
Fig 3 - Projects under construction
Project Location Segment Area (msf) Stake % Sold
Signature Island BKC, Mumbai Residential 0.71 87.5% 36%
Sunteck Grandeur Andheri, Mumbai Commercial 0.08 100% Not launched
Sunteck Kanaka Goa Commercial 0.12 50% Not launched
Total 2.5
Source: Company, RCML Research
Fig 4 - 3 key residential projects in BKC, Mumbai
Source: Company
MMR forms 67% of land bank; spreading wings in key cities SRL has 67% of its land bank in and around Mumbai, covering 21.6msf (in 14 of 26 projects, both ongoing and planned). Of this, it has ~7msf between Andheri and Mahalaxmi which command premium realisations. Moreover, SRL’s land cost for Mumbai is low at Rs 916psf; this together with its ability to command premium realisations (by way of strong brand equity) will bolster margins. Apart from Mumbai, SRL has forayed into Goa, Nagpur, Jaipur and Karnataka, where it has maintained its unique land acquisition strategy.
Low land cost of Rs 916psf in booming
Mumbai market
Sunteck Realty Ltd Initiating Coverage 02 December 2010
4
Fig 5 - MMR project map
Source: Company
Low-leverage business SRL’s D/E ratio for FY10 is comfortable at 0.6x. This leaves plenty of room to raise further debt in order to meet working capital needs in the event that surplus cash flows from new launches are deployed for land acquisition. Moreover, of the FY10 consolidated debt of Rs 3.9bn on its books, SRL’s share is Rs 2.4bn (Net D/E of 0.4x) (Fig-6).
Fig 6 - SRL’s share of debt
(Rs mn) Consolidated Debt Sunteck Liability
Consolidated unsecured loan 4,577 2,439
Less : Intercorporate deposits (PSRPL to SSPL) (2,222) (1,111)
Unsecured debt as on 31st Mar on balance sheet 2,356 1,328
Secured Loan
Consolidated secured loan 1610 1110
Total debt 3,966 2,438
Source: RCML Research
Strong branding supports premium realisations We believe that a strong, recognisable brand is a key differentiator in the real estate industry as this strongly influences customer buying decisions. SRL brands its high-end residential properties as Signature and Signia and commercial properties as Sunteck. Most of its projects are in JV with the Ajay Piramal group, which further creates brand recognition. We believe the quality of construction and brand recall enables the company to quote a premium in comparison to other builders (Fig-7).
Adjusted D/E is at 0.4x
Sunteck Realty Ltd Initiating Coverage 02 December 2010
5
Fig 7 - SRL commands a selling price premium to other developers
SN Project name Developer Location Sale Price(Rs psf)
A Mayfair Meridian Mayfair Housing SV Road, Andheri (W) 14,820
Raheja Plaza K Raheja Universal Andheri (W) 15,960
E Turning Point- Comm Trimurti Colonizer Bani Park 7,500
Govind Enclave-Comm Unique Dream Builders Bani Park 7,500
Signia City -Comm Sunteck Realty Bani Park 8,500
F Hirannadani Heritage Hiranandani Borivali-Mumbai 11,000
Kanakia Space Kanakia Borivali-Mumbai 10,500
Signia High Sunteck Realty Borivali-Mumbai 12,000
Source: RCML Research
Financial overview
Revenues to surge in FY13 We assume FY11/FY12/FY13 residential absorption levels of 0.8/1.7/1.5msf. Considering the recent increase in property prices, we do not assume property price rise in FY12 across various projects. The company follows the project completion method for revenue recognition, and we therefore expect substantial revenues during FY12 and FY13 (Rs 37bn) when its ongoing projects are likely to be complete.
Fig 8 - Absorption estimates
(msf) FY11E FY12E FY13E
Absorption
Residential 0.8 1.7 1.5
Commercial 0.5 0.2 0.1
Total 1.3 1.9 1.7
Source: RCML Research
Luxury Brand helps SRL garner
premium realisations
Project completion to lead the revenue
growth in FY13
Sunteck Realty Ltd Initiating Coverage 02 December 2010
6
EBITDA margin set to expand SRL’s EBITDA margin is likely to improve from 38% in FY10 to 53% in FY13 on account high-end luxury projects. In the long run, we believe the company should maintain a gross margin in the range of 55–60% led by its JV/JDA model and focus on the super-luxury segment.
Fig 9 - Margin improving going forward
38
58
64
53
76
70 68
55
30
40
50
60
70
80
FY10 FY11E FY12E FY13E
EBIDTA margin Gross margin(%)
Source: Company ,RCML Research
Strong balance sheet SRL’s balance sheet is likely to be further strengthened as its D/E ratio remains below 1x and the company generates estimated cash from operations of Rs 6.7bn and Rs 17.5bn in FY12 and FY13 respectively. This may be utilised for land acquisition.
Moreover, Sunteck’s portion of debt (excluding minority shareholder’s share) is further low (Fig 6)
Fig 10 - Cash position
FY10 FY11E FY12E FY13E
Total cash 344 339.8 6,545.2 24,328.9
Gross Debt 3966 4,866.6 4,366.6 4,866.6
Net Cash (3622) (4,526.8) 2,178.6 19,462.2
Source: RCML Research
Valuation
Initiate with BUY We have a target price of Rs 800 for the stock, valuing SRL’s total saleable land bank of 32msf at a 20% discount to NAV. We initiate coverage with a BUY rating given the potential 30% upside from current levels. Momentum in new launches would be a key trigger for the stock.
Fig 11 - Key assumption s
Assumption
RFR (%) 8
Beta (x) 1.2
WACC (%) 12.5
CoE (%) 14
CoD (%) 15
Source: RCML Research
EBITDA margin likely to expand from
38% in FY10 to 53% in FY13
Sales and Profit estimates
(Rs mn) FY10 FY11E FY12E FY13E
Sales 284.0 1628.7 14246.3 22131.0
EBITDA 108 937 9102 11821
EBITDA margin (%)
38% 58% 64% 53%
EPS (Rs) 1 10 95 123
Source: RCML Research
We value SRL at 20% discount to NAV
Sunteck Realty Ltd Initiating Coverage 02 December 2010
7
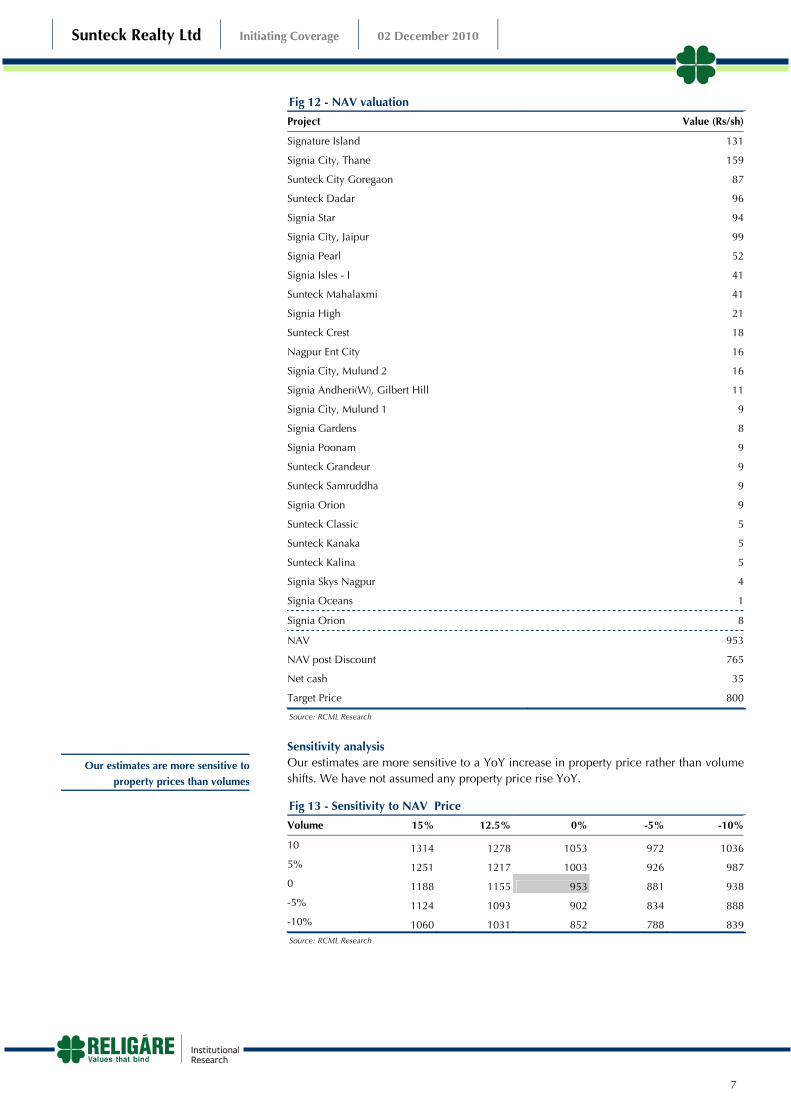
Fig 12 - NAV valuation
Project Value (Rs/sh)
Signature Island 131
Signia City, Thane 159
Sunteck City Goregaon 87
Sunteck Dadar 96
Signia Star 94
Signia City, Jaipur 99
Signia Pearl 52
Signia Isles - I 41
Sunteck Mahalaxmi 41
Signia High 21
Sunteck Crest 18
Nagpur Ent City 16
Signia City, Mulund 2 16
Signia Andheri(W), Gilbert Hill 11
Signia City, Mulund 1 9
Signia Gardens 8
Signia Poonam 9
Sunteck Grandeur 9
Sunteck Samruddha 9
Signia Orion 9
Sunteck Classic 5
Sunteck Kanaka 5
Sunteck Kalina 5
Signia Skys Nagpur 4
Signia Oceans 1
Signia Orion 8
NAV 953
NAV post Discount 765
Net cash 35
Target Price 800
Source: RCML Research
Sensitivity analysis Our estimates are more sensitive to a YoY increase in property price rather than volume shifts. We have not assumed any property price rise YoY.
Fig 13 - Sensitivity to NAV Price
Volume 15% 12.5% 0% -5% -10%
10 1314 1278 1053 972 1036
5% 1251 1217 1003 926 987
0 1188 1155 953 881 938
-5% 1124 1093 902 834 888
-10% 1060 1031 852 788 839Source: RCML Research
Our estimates are more sensitive to
property prices than volumes
Sunteck Realty Ltd Initiating Coverage 02 December 2010
8
Fig 14 - Cash flow
FY10 FY11E FY12E FY13E
Sales Inflow 227.69 1396.78 11826.48 24534.96
Other inflow 23.70 32.10 34.10 37.10
Outflow
Construction Costs (3753.64) (3491.35) 888.54 (6111.43)
Other (Admin Costs) (104.50) (200.13) (569.85) (269.00)
Tax payment (29.06) (58.47) (314.95) (2936.16)
Interest payments 0.00 0.00 (218.33) (243.33)
Debt payments 2780.82 900.61 (500.00) 500.00
Land purchase
Capex (1151.48) (29.76) (36.98) (44.52)
Dividend payment (11.04) (15.06) (36.84) (221.01)Change in debtors / loan and advances (3332.56) 1682.59 (4866.78) 2537.10
Investments 1334.18 131.33 0.00 0.00
Changes in Equity 4352.34 (352.92) 0.00 0.00
Total outflow 85.08 (1433.16) (5655.18) (6788.37)
Net Cash Flow 336.47 (4.29) 6205.40 17783.70
Cash at beginning of year 7.74 343.88 339.83 6545.23
Cash at end of year 343.88 339.83 6545.23 24328.87
Net Cash Flow 336.14 (4.05) 6205.40 17783.64Source: RCML Research
Key concerns
Execution the biggest risk So far, SRL has delivered only 0.22msf till FY10 whereas we expect 32msf over the next 7–8 years. Execution is thus one of the key risks to our estimates. At the same time, we note that the company has appointed prominent contractors on various projects.
Sensitive to property prices Our NAV is more sensitive to prices in comparison to volumes. Any decline in property prices may thus significantly affect our valuation.
Economic slowdown A slowdown in the economy may lead to a fall in property prices and absorption, in turn impacting SRL’s business.
Execution a key risk to our estimates
Sunteck Realty Ltd Initiating Coverage 02 December 2010
9
Company background
SRL was incorporated in 1981 but commenced real estate operations only in the year 2000. In 1985, the company was rechristened from Insul Electronic to Sunteck Realty and Infrastructure, and later to Sunteck Realty in 2007. The real estate business was founded by Kamal Khetan and Manish Khetan (promoters), who have several years of experience in the market. SRL has attracted investment from Kotak private equity fund and led to a JV with the Ajay Piramal group.
SRL is developing a number of its ongoing and planned projects jointly with the Piramal group and we believe this partnership enables it to reduce its capital commitment and forge a stronger brand image. Over the past decade, the company has acquired land in the heart of Mumbai (BKC), which is likely to add significant value in the next couple of years.
SRL’s real estate portfolio consists of 26 projects covering 32msf of saleable area across residential (18.9msf), commercial (13.2msf) and retail development. In addition, it has 219,350sq ft of prime commercial assets in the established business districts of BKC, Vile Parle and Andheri, Mumbai. The company has delivered 0.22msf so far in the commercial segment and has 2.5msf under construction.
Fig 15 - Organisation structure
Piramal Sunteck Other Projects via JVs/JDAs/Owned Land & Business Centers
Sunteck Realty
Sunteck Creast, Sion(33%)
Signia City, Mulund(50%)
Signia Isles BKC
Signia Pearl BKC
Signia City, Mulund(68%)
Signia & Sunteck City, Thane(75%)
Signia Nagpur
Signia City, Jaipur(62.5%)
Signia Oceans, New Mumbai
Madinat Al llam – Villas, Oman (50%)
Nagpur Entertainment City(55%)
Signature Island, BKC(80%)
Signia Gardens, Vile Parle (W)
Sunteck Center, Vile Parle (W)(50%)
Sunteck Grandeur, Andheri (W)
Signia High, Borivali (E)(62.5%)
Sunteck Poonam, Andheri
Sunteck Centrako, BKC
Sunteck Certainty, BKC(80%)
Signia & Sunteck Star, Ghatkoper (84.18%)
Sunteck Classic, Andheri (50%)
Sunteck Amenity & Magenta, Andheri (W)
Sunteck Kanaka, Goa(50%)
Promoters Others
34.68%65.32%
50%
50%
Sunteck, Andheri (W)Sunteck City,
GoregaonSignia Dadar
(50%)Signia Mahalaxmi
(50%)
Signia Orion,New Mumbai
Sunteck Kalina(56.5%)
FII & others institutions
@15%
Source: Company
Sunteck Realty Ltd Initiating Coverage 02 December 2010
10
Residential segment SRL has 18 residential projects covering 18.9msf, of which 2.2msf is under construction. Its properties are marketed under the brand names of Signature and Signia. The Signature brand comprises high-end, luxury residences and is aimed at high-net worth individuals. These developments are in prime city locations and have apartments sized above 6,000sq ft. Signia comprises premium and mid-level residences in select areas. Apartments under this brand are generally between 1,200sq ft and 5,000sq ft.
Fig 16 - Residential projects
Project name Location Saleable area Effective Stake
Signature Island Plot No. R1.2 & 1.3, BKC 0.71 100.00%
Signia Isles - I Plot No. R1.4, BKC 0.43 100.00%
Signia Pearl Plot No. R1.1, BKC 0.43 100.00%
Signia Star Ghatkopar 1.30 100.00%
Signia City, Jaipur Bani Park, Jaipur 4.29 100.00%
Signia Andheri(W),Gillbert Hill Andheri 0.10 100.00%
Signia Orion Airoli Sec-10 0.29 100.00%
Total 18.9
Source: company, RCML research
Commercial segment SRL has 11 commercial projects covering 13.2msf, of which 0.3msf is under construction. The company markets its properties under the brand name Sunteck. Apart from the above commercial assets, the company has 0.22msf of leased assets which contribute rent over~Rs 150mn per year.
Fig 17 - Commercial Projects – Under Construction
Project name Location Saleable area Effective Stake
Signia Star Ghatkopar 1.3 100.00%
Signia City, Jaipur Bani Park, Jaipur 4.3 100.00%
Signia City, Thane Thane 4.0 100.00%
Signia Poonam Andheri 0.1 100.00%
Sunteck Crest Sion 1.6 33.00%
Sunteck Classic Andheri 0.1 50.00%
Sunteck Granduer Andheri 0.1 100.00%
Nagpur Ent City Nagpur 1.1 55.00%
Sunteck Samruddha Hubli 0.4 26.00%
Sunteck Kanaka Goa 0.1 50.00%
Sunteck Kalina Bandra 0.1 100.00%
Total 13.2
Source: Company, RCML Research
2.2msf of residential projects under
construction
0.3msf of commercial space under
construction
Sunteck Realty Ltd Initiating Coverage 02 December 2010
11
Fig 18 - Commercial Projects – Completed
Leased Projects Location Saleable Area (msf) Effective Stake (%)
SRL was incorporated in 1981 but commenced real estate
operations only in the year 2000. In 1985, the company was
rechristened from Insul Electronic to Sunteck Realty and
Infrastructure, and later to Sunteck Realty in 2007.SRL is a Mumbai-
based realty player focussed on the super-luxury and luxury
residential segments. It has a 32msf land bank of which 67% is in
the MMR.
Shareholding pattern
(%) Mar-10 Jun-10 Sep-10
Promoters 65.3 65.3 65.3
FIIs 5.3 5.6 5.6
Banks & FIs - - -
Public 29.4 29.1 29.1
Recommendation history
Date Event Reco price Tgt price Reco
02-Dec-10 Initiating Coverage 615 800 Buy
Stock performance
590
610
630
650
670
690
710
Jul-10 Aug-10 Sep-10 Oct-10 Nov-10 Dec-10
Buy
Sunteck Realty Ltd Initiating Coverage 02 December 2010
14
Coverage Profile
By recommendation By market cap (US$)
31
9
60
0
20
40
60
80
Buy Hold Sell
(%)
69
29
20
20
40
60
80
> $1bn $200mn - $1bn < $200mn
(%)
Recommendation interpretation
Recommendation Expected absolute returns (%) over 12 months
Buy More than 15%
Hold Between 15% and –5%
Sell Less than –5%
Recommendation structure changed with effect from March 1, 2009
Expected absolute returns are based on share price at market close unless otherwise stated. Stock recommendations are based on absolute upside (downside) and have a 12-month horizon. Our target price represents the fair value of the stock based upon the analyst’s discretion. We note that future price fluctuations could lead to a temporary
mismatch between upside/downside for a stock and our recommendation.
This document is NOT addressed to or intended for distribution to retail clients (as defined by the FSA). This document is issued by Religare Capital Markets plc (“RCM”) in the UK, which is authorised and regulated by the Financial Services Authority in connection with its UK distribution. RCM is a member of the London Stock Exchange.
This material should not be construed as an offer or recommendation to buy or sell or solicitation of any offer to buy any security or other financial instrument, nor shall it, or the fact of its distribution, form the basis of, or be relied upon in connection with, any contract relating to such action or any other matter. The material in this report is based on information that we consider reliable and accurate at, and share prices are given as at close of business on, the date of this report but we do not warrant or represent (expressly or impliedly) that it is accurate, complete, not misleading or as to its fitness for the purpose intended and it should not be relied upon as such. Any opinion expressed (including estimates and forecasts) is given as of the date of this report and may be subject to change without notice.
RCM, and any of its connected or affiliated companies or their directors or employees, may have a position in any of the securities or may have provided corporate finance advice, other investment services in relation to any of the securities or related investments referred to in this document. Our asset management area, our proprietary trading desks and investing businesses may make investment decisions that are inconsistent with the recommendations or views expressed in this briefing note.
RCM accepts no liability whatsoever for any direct, indirect or consequential loss or damage of any kind arising out of the use of or reliance upon all or any of this material howsoever arising. Investors should make their own investment decisions based upon their own financial objectives and financial resources and it should be noted that investment involves risk, including the risk of capital loss.
This document is confidential and is supplied to you for information purposes only. It may not (directly or indirectly) be reproduced, further distributed to any person or published, in whole or in part, for any purpose whatsoever. Neither this document, nor any copy of it, may be taken or transmitted into the United States, Canada, Australia, Ireland, South Africa or Japan or into any jurisdiction where it would be unlawful to do so. Any failure to comply with this restriction may constitute a violation of relevant local securities laws. If you have received this document in error please telephone Nicholas Malins-Smith on +44 (0) 20 7382 4479.