28
Finn Casey Winnie Chin Jonathan Faulk Schuyler O’Reilly AMN Healthcare Services Inc. Strategic Discussion Materials April 1 st , 2016
| Date post: | 22-Jan-2018 |
| Category: |
Economy & Finance |
| Upload: | schuyler-oreilly |
| View: | 166 times |
| Download: | 0 times |

Finn Casey
Winnie Chin
Jonathan Faulk
Schuyler O’Reilly
AMN Healthcare Services Inc. Strategic Discussion Materials
April 1st, 2016

Our Team
Finn Casey
• Indiana University, Kelley School of Business, 2019
• Majors: Finance & Accounting
• Naperville, IL
Winnie Chin
• Indiana University, Kelley School of Business, 2019
• Majors: Accounting, Business Analytics, Finance
• Taipei, Taiwan
Jonathan Faulk
• Indiana University, Kelley School of Business, 2019
• Majors: Finance & Economic Consulting
• Fort Lauderdale, FL
Schuyler O’Reilly
• Indiana University, Kelley School of Business, 2019
• Majors: Finance & Accounting
• Fishers, IN
2
Table of Contents
3
I. Executive Summary 4
II. Company Overviews 6
III. Industry Overview 9
IV. Strategic Opportunities 11
V. Valuation Analysis 15
VI. Pro Forma Capital Structure 22
VII. Appendix 25

Executive SummarySECTION I
4
Executive Summary
5
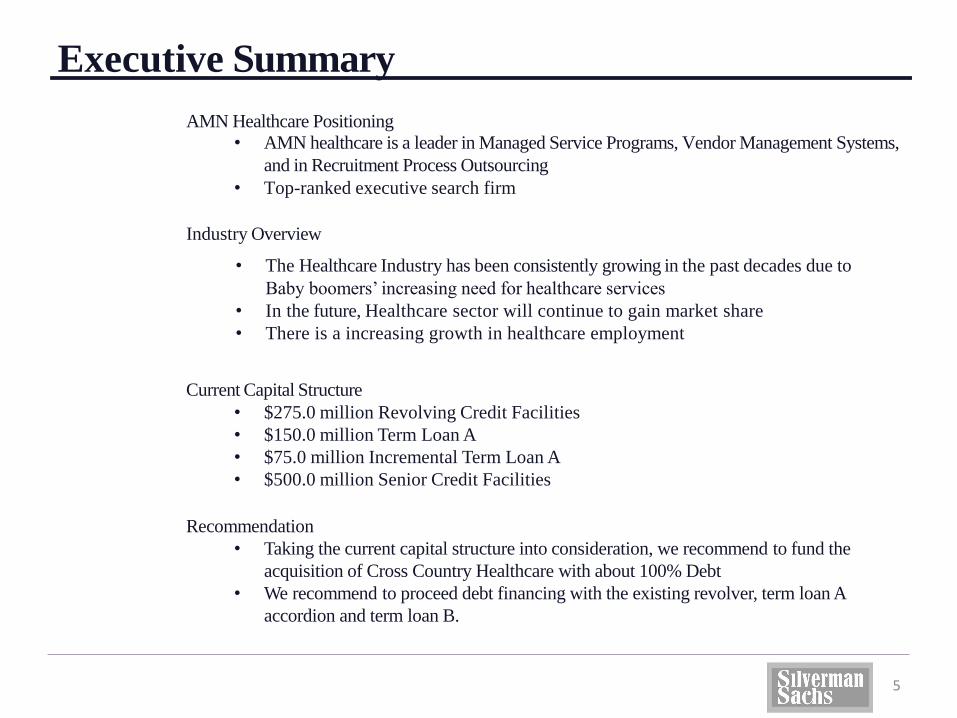
AMN Healthcare Positioning
• AMN healthcare is a leader in Managed Service Programs, Vendor Management Systems,
and in Recruitment Process Outsourcing
• Top-ranked executive search firm
Industry Overview
• The Healthcare Industry has been consistently growing in the past decades due to
Baby boomers’ increasing need for healthcare services
• In the future, Healthcare sector will continue to gain market share
• There is a increasing growth in healthcare employment
Current Capital Structure
• $275.0 million Revolving Credit Facilities
• $150.0 million Term Loan A
• $75.0 million Incremental Term Loan A
• $500.0 million Senior Credit Facilities
Recommendation
• Taking the current capital structure into consideration, we recommend to fund the
acquisition of Cross Country Healthcare with about 100% Debt
• We recommend to proceed debt financing with the existing revolver, term loan A
accordion and term loan B.

Company OverviewSECTION II
6
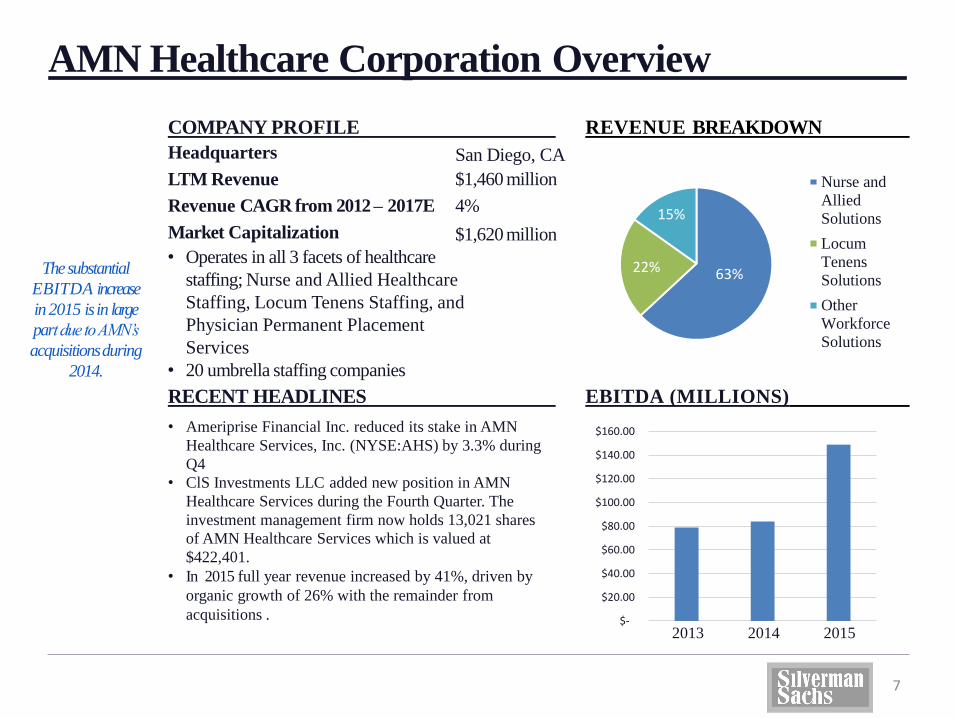
COMPANY PROFILE
Headquarters
LTM Revenue
Revenue CAGR from 2012 – 2017E
Market Capitalization
San Diego, CA
$1,460 million
4%
$1,620 million
AMN Healthcare Corporation Overview
• Operates in all 3 facets of healthcare
staffing; Nurse and Allied Healthcare
Staffing, Locum Tenens Staffing, and
Physician Permanent Placement
Services
• 20 umbrella staffing companies
The substantial
EBITDA increase
in 2015 is in large
part due to AMN’s
acquisitions during
2014.
• Ameriprise Financial Inc. reduced its stake in AMN
Healthcare Services, Inc. (NYSE:AHS) by 3.3% during
Q4
• ClS Investments LLC added new position in AMN
Healthcare Services during the Fourth Quarter. The
investment management firm now holds 13,021 shares
of AMN Healthcare Services which is valued at
$422,401.
• In 2015 full year revenue increased by 41%, driven by
organic growth of 26% with the remainder from
acquisitions .
REVENUE BREAKDOWN
7
RECENT HEADLINES EBITDA (MILLIONS)
63%22%
15%
Nurse and
Allied
Solutions
Locum
Tenens
Solutions
Other
Workforce
Solutions
$-
$20.00
$40.00
$60.00
$80.00
$100.00
$120.00
$140.00
$160.00
2013 2014 2015
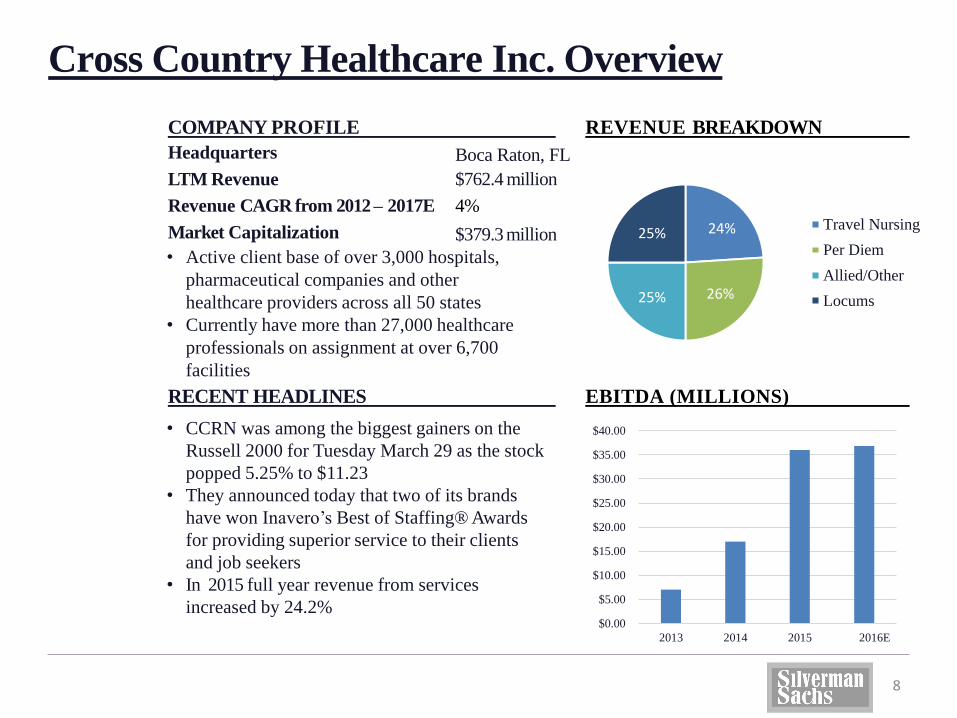
COMPANY PROFILE
Headquarters
LTM Revenue
Revenue CAGR from 2012 – 2017E
Market Capitalization
Boca Raton, FL
$762.4 million
4%
$379.3 million
Cross Country Healthcare Inc. Overview
• CCRN was among the biggest gainers on the
Russell 2000 for Tuesday March 29 as the stock
popped 5.25% to $11.23
• They announced today that two of its brands
have won Inavero’s Best of Staffing® Awards
for providing superior service to their clients
and job seekers
• In 2015 full year revenue from services
increased by 24.2%
REVENUE BREAKDOWN
8
RECENT HEADLINES EBITDA (MILLIONS)
$0.00
$5.00
$10.00
$15.00
$20.00
$25.00
$30.00
$35.00
$40.00
2013 2014 2015 2016E
• Active client base of over 3,000 hospitals,
pharmaceutical companies and other
healthcare providers across all 50 states
• Currently have more than 27,000 healthcare
professionals on assignment at over 6,700
facilities
24%
26%25%
25%Travel Nursing
Per Diem
Allied/Other
Locums

Industry OverviewSECTION III
9
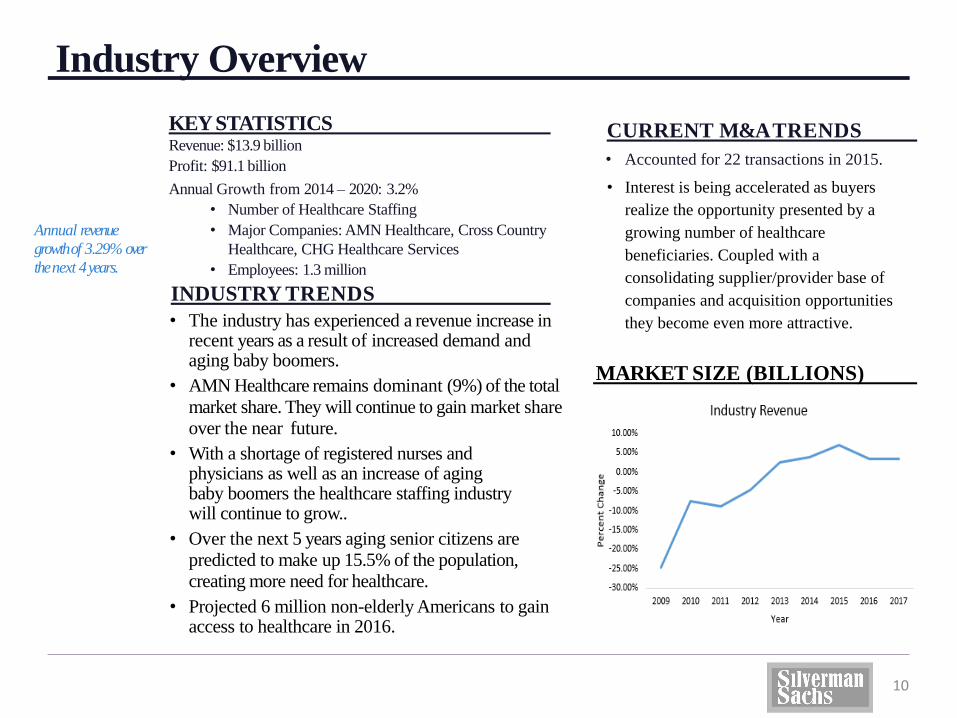
KEYSTATISTICSRevenue: $13.9 billion
Profit: $91.1 billion
Annual Growth from 2014 – 2020: 3.2%
• Number of Healthcare Staffing
• Major Companies: AMN Healthcare, Cross Country
Healthcare, CHG Healthcare Services
• Employees: 1.3 million
Industry Overview
CURRENT M&ATRENDS
• Accounted for 22 transactions in 2015.
• Interest is being accelerated as buyers
realize the opportunity presented by a
growing number of healthcare
beneficiaries. Coupled with a
consolidating supplier/provider base of
companies and acquisition opportunities
they become even more attractive.
INDUSTRY TRENDS
• The industry has experienced a revenue increase in recent years as a result of increased demand and aging baby boomers.
• AMN Healthcare remains dominant (9%) of the total
market share. They will continue to gain market share
over the near future.
• With a shortage of registered nurses and physicians as well as an increase of aging baby boomers the healthcare staffing industry will continue to grow..
• Over the next 5 years aging senior citizens are
predicted to make up 15.5% of the population,
creating more need for healthcare.
• Projected 6 million non-elderly Americans to gain access to healthcare in 2016.
Annual revenue
growth of 3.29% over
the next 4years.
10
MARKET SIZE (BILLIONS)

Strategic OpportunitiesSECTION IV
11
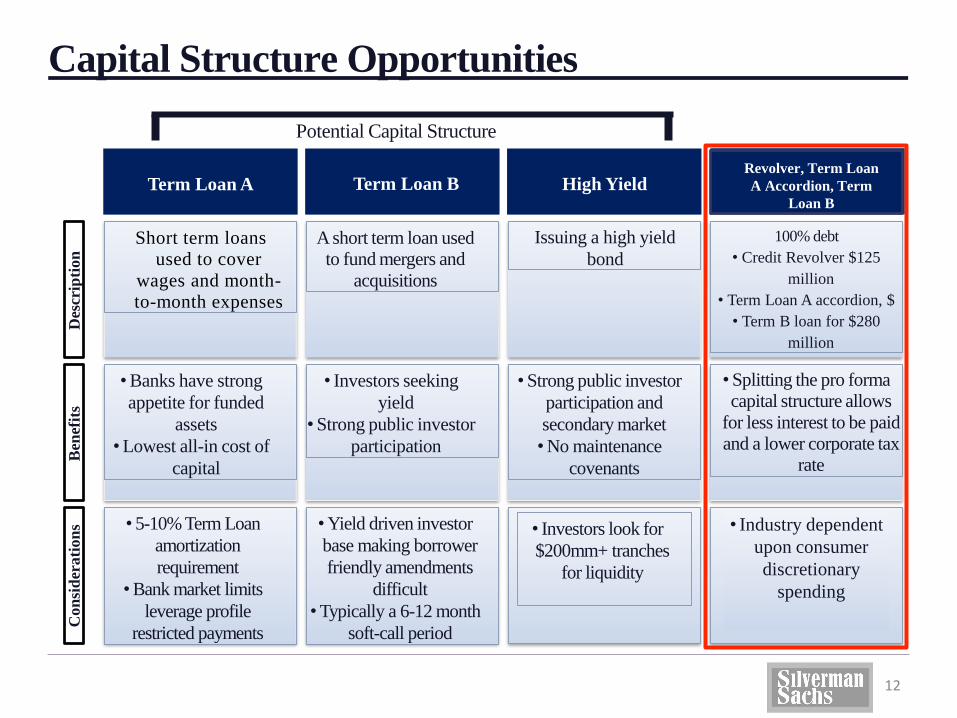
Capital Structure OpportunitiesD
escr
ipti
on
Ben
efit
sC
on
sid
erati
on
s
100% debt
• Credit Revolver $125
million
• Term Loan A accordion, $
• Term B loan for $280
million
•Splitting the pro forma
capital structure allows
for less interest to be paid
and a lower corporate tax
rate
• Industry dependent
upon consumer
discretionary
spending
Short term loans
used to cover
wages and month-
to-month expenses
•Banks have strong
appetite for funded
assets
•Lowest all-in cost of
capital
• 5-10% Term Loan
amortization
requirement
•Bank market limits
leverage profile
restricted payments
A short term loan used
to fund mergers and
acquisitions
• Investors seeking
yield
•Strong public investor
participation
•Yield driven investor
base making borrower
friendly amendments
difficult
•Typically a 6-12 month
soft-call period
Issuing a high yield
bond
•Strong public investor
participation and
secondary market
•No maintenance
covenants
• Investors look for
$200mm+ tranches
for liquidity
Potential Capital Structure
12
Term Loan A Term Loan B High YieldRevolver, Term Loan
A Accordion, Term
Loan B
Geographic
Diversity
Acquisition
Opportunities
Company
Growth
13
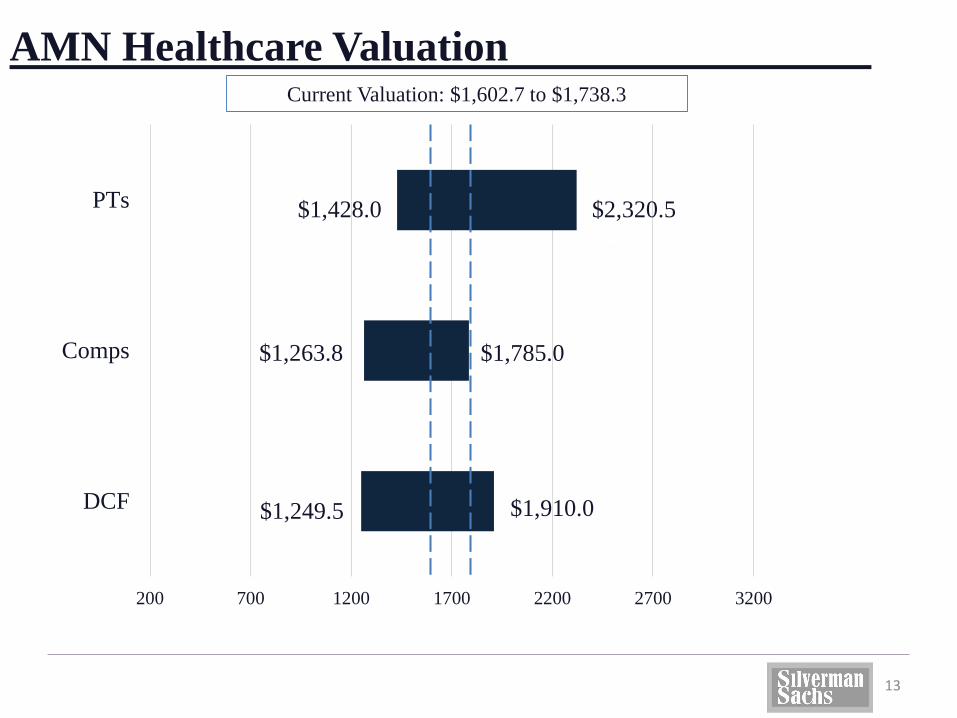
200 700 1200 1700 2200 2700 3200
DCF
Comps
PTs
AMN Healthcare Valuation
$1,249.5
$1,263.8
$1,428.0
$1,910.0
$1,785.0
$2,320.5
Current Valuation: $1,602.7 to $1,738.3
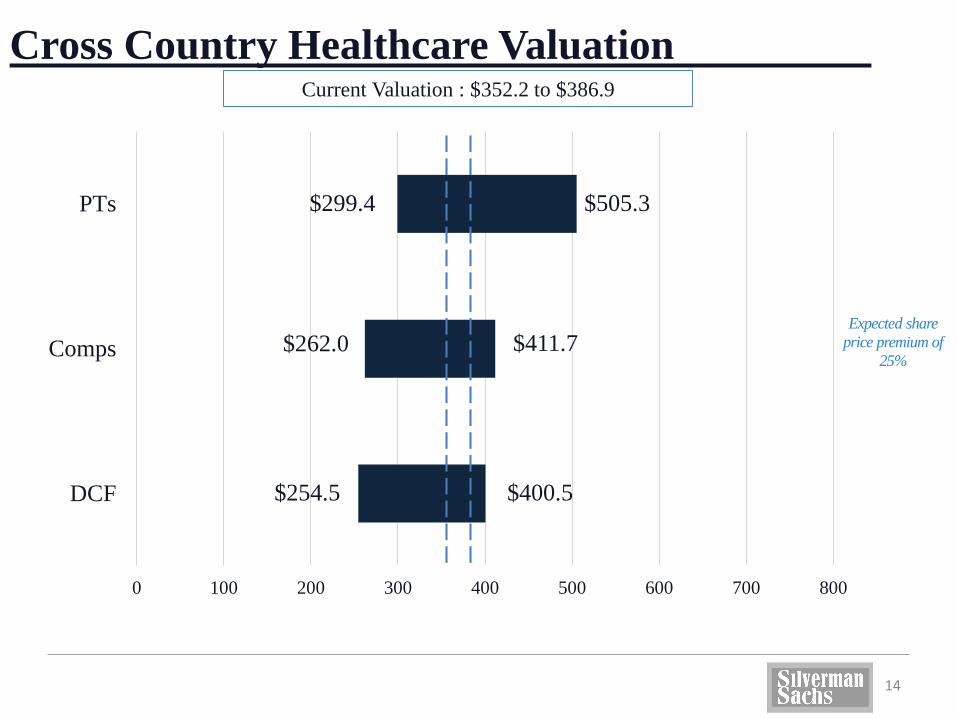
0 100 200 300 400 500 600 700 800
DCF
Comps
PTs
Cross Country Healthcare Valuation
$299.4
$262.0
$505.3
$254.5
$411.7
$400.5
Current Valuation : $352.2 to $386.9
14
Expected share
price premium of
25%

Valuation AnalysisSECTION V
15
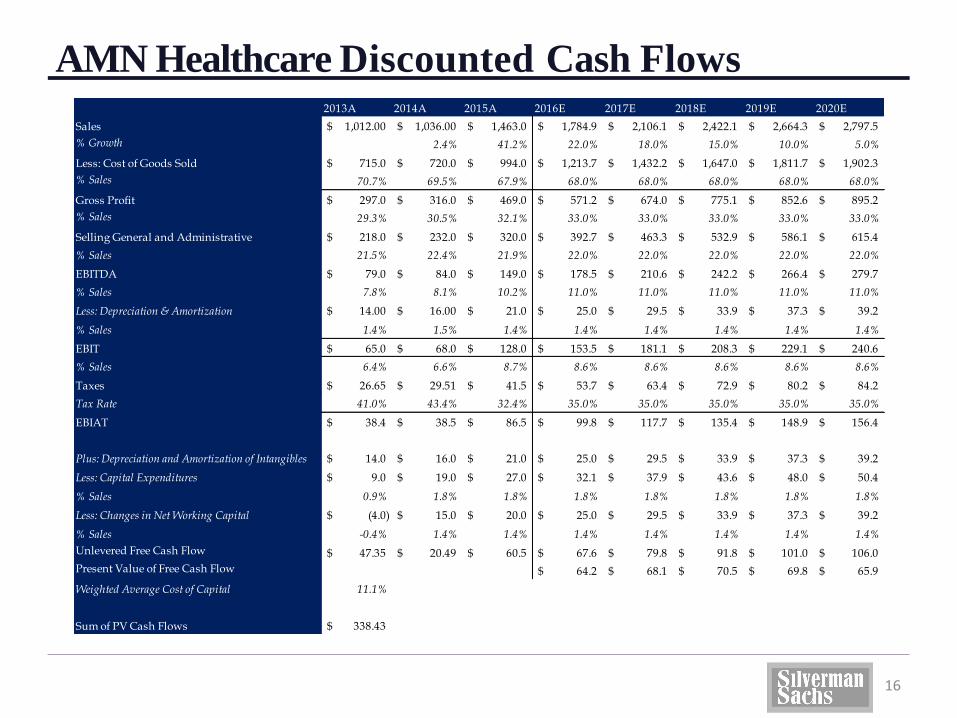
AMN Healthcare Discounted Cash Flows
16
2013A 2014A 2015A 2016E 2017E 2018E 2019E 2020E
Sales 1,012.00$ 1,036.00$ 1,463.0$ 1,784.9$ 2,106.1$ 2,422.1$ 2,664.3$ 2,797.5$
% Growth 2.4% 41.2% 22.0% 18.0% 15.0% 10.0% 5.0%
Less: Cost of Goods Sold 715.0$ 720.0$ 994.0$ 1,213.7$ 1,432.2$ 1,647.0$ 1,811.7$ 1,902.3$
% Sales 70.7% 69.5% 67.9% 68.0% 68.0% 68.0% 68.0% 68.0%
Gross Profit 297.0$ 316.0$ 469.0$ 571.2$ 674.0$ 775.1$ 852.6$ 895.2$
% Sales 29.3% 30.5% 32.1% 33.0% 33.0% 33.0% 33.0% 33.0%
Selling General and Administrative 218.0$ 232.0$ 320.0$ 392.7$ 463.3$ 532.9$ 586.1$ 615.4$
% Sales 21.5% 22.4% 21.9% 22.0% 22.0% 22.0% 22.0% 22.0%
EBITDA 79.0$ 84.0$ 149.0$ 178.5$ 210.6$ 242.2$ 266.4$ 279.7$
% Sales 7.8% 8.1% 10.2% 11.0% 11.0% 11.0% 11.0% 11.0%
Less: Depreciation & Amortization 14.00$ 16.00$ 21.0$ 25.0$ 29.5$ 33.9$ 37.3$ 39.2$
% Sales 1.4% 1.5% 1.4% 1.4% 1.4% 1.4% 1.4% 1.4%
EBIT 65.0$ 68.0$ 128.0$ 153.5$ 181.1$ 208.3$ 229.1$ 240.6$
% Sales 6.4% 6.6% 8.7% 8.6% 8.6% 8.6% 8.6% 8.6%
Taxes 26.65$ 29.51$ 41.5$ 53.7$ 63.4$ 72.9$ 80.2$ 84.2$
Tax Rate 41.0% 43.4% 32.4% 35.0% 35.0% 35.0% 35.0% 35.0%
EBIAT 38.4$ 38.5$ 86.5$ 99.8$ 117.7$ 135.4$ 148.9$ 156.4$
Plus: Depreciation and Amortization of Intangibles 14.0$ 16.0$ 21.0$ 25.0$ 29.5$ 33.9$ 37.3$ 39.2$
Less: Capital Expenditures 9.0$ 19.0$ 27.0$ 32.1$ 37.9$ 43.6$ 48.0$ 50.4$
% Sales 0.9% 1.8% 1.8% 1.8% 1.8% 1.8% 1.8% 1.8%
Less: Changes in Net Working Capital (4.0)$ 15.0$ 20.0$ 25.0$ 29.5$ 33.9$ 37.3$ 39.2$
% Sales -0.4% 1.4% 1.4% 1.4% 1.4% 1.4% 1.4% 1.4%
Unlevered Free Cash Flow 47.35$ 20.49$ 60.5$ 67.6$ 79.8$ 91.8$ 101.0$ 106.0$
Present Value of Free Cash Flow 64.2$ 68.1$ 70.5$ 69.8$ 65.9$
Weighted Average Cost of Capital 11.1%
Sum of PV Cash Flows 338.43$
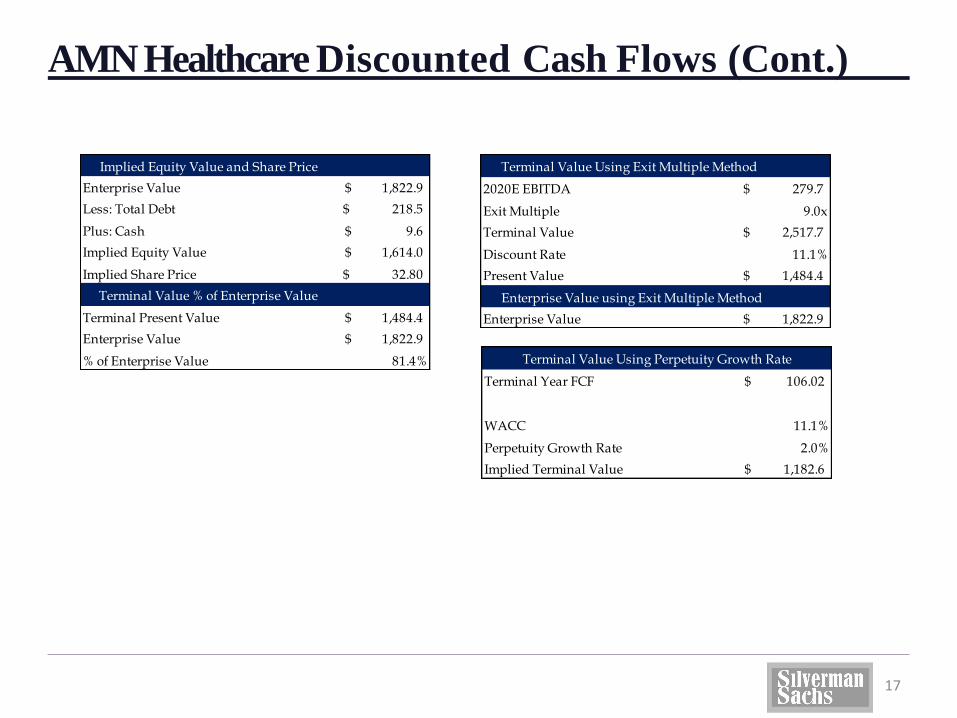
AMN Healthcare Discounted Cash Flows (Cont.)
17
Implied Equity Value and Share Price
Enterprise Value 1,822.9$
Less: Total Debt 218.5$
Plus: Cash 9.6$
Implied Equity Value 1,614.0$
Implied Share Price 32.80$
Terminal Value % of Enterprise Value
Terminal Present Value 1,484.4$
Enterprise Value 1,822.9$
% of Enterprise Value 81.4%
Terminal Value Using Exit Multiple Method
2020E EBITDA 279.7$
Exit Multiple 9.0x
Terminal Value 2,517.7$
Discount Rate 11.1%
Present Value 1,484.4$
Enterprise Value using Exit Multiple Method
Enterprise Value 1,822.9$
Terminal Year FCF 106.02$
WACC 11.1%
Perpetuity Growth Rate 2.0%
Implied Terminal Value 1,182.6$
Terminal Value Using Perpetuity Growth Rate
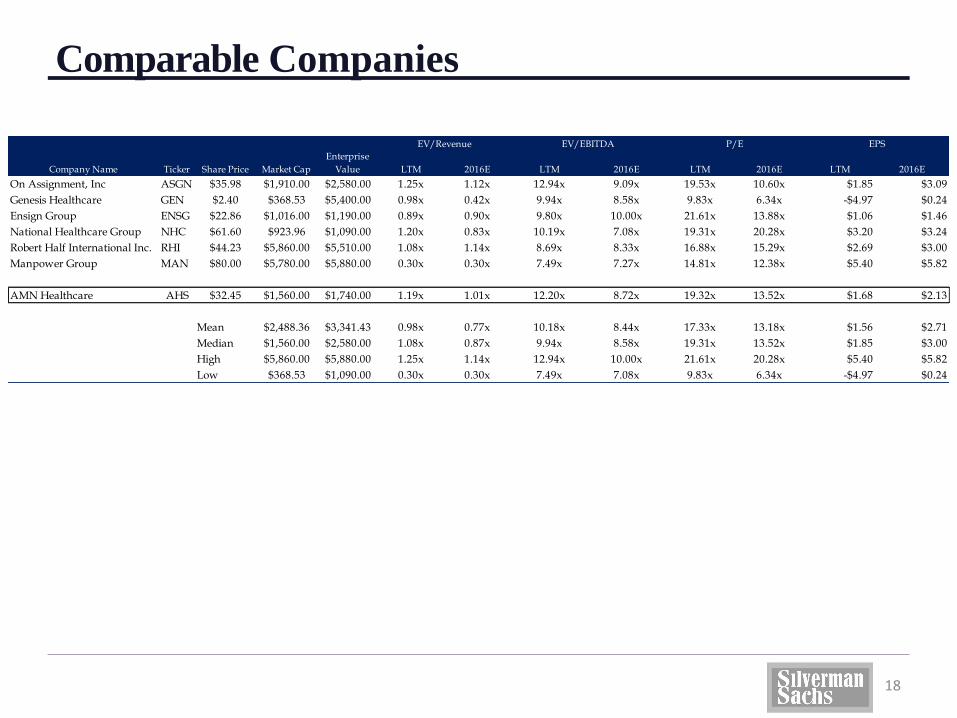
Comparable Companies
18
Company Name Ticker Share Price Market Cap
Enterprise
Value LTM 2016E LTM 2016E LTM 2016E LTM 2016E
On Assignment, Inc ASGN $35.98 $1,910.00 $2,580.00 1.25x 1.12x 12.94x 9.09x 19.53x 10.60x $1.85 $3.09
Genesis Healthcare GEN $2.40 $368.53 $5,400.00 0.98x 0.42x 9.94x 8.58x 9.83x 6.34x -$4.97 $0.24
Ensign Group ENSG $22.86 $1,016.00 $1,190.00 0.89x 0.90x 9.80x 10.00x 21.61x 13.88x $1.06 $1.46
National Healthcare Group NHC $61.60 $923.96 $1,090.00 1.20x 0.83x 10.19x 7.08x 19.31x 20.28x $3.20 $3.24
Robert Half International Inc. RHI $44.23 $5,860.00 $5,510.00 1.08x 1.14x 8.69x 8.33x 16.88x 15.29x $2.69 $3.00
Manpower Group MAN $80.00 $5,780.00 $5,880.00 0.30x 0.30x 7.49x 7.27x 14.81x 12.38x $5.40 $5.82
AMN Healthcare AHS $32.45 $1,560.00 $1,740.00 1.19x 1.01x 12.20x 8.72x 19.32x 13.52x $1.68 $2.13
Mean $2,488.36 $3,341.43 0.98x 0.77x 10.18x 8.44x 17.33x 13.18x $1.56 $2.71
Median $1,560.00 $2,580.00 1.08x 0.87x 9.94x 8.58x 19.31x 13.52x $1.85 $3.00
High $5,860.00 $5,880.00 1.25x 1.14x 12.94x 10.00x 21.61x 20.28x $5.40 $5.82
Low $368.53 $1,090.00 0.30x 0.30x 7.49x 7.08x 9.83x 6.34x -$4.97 $0.24
EV/Revenue EV/EBITDA P/E EPS
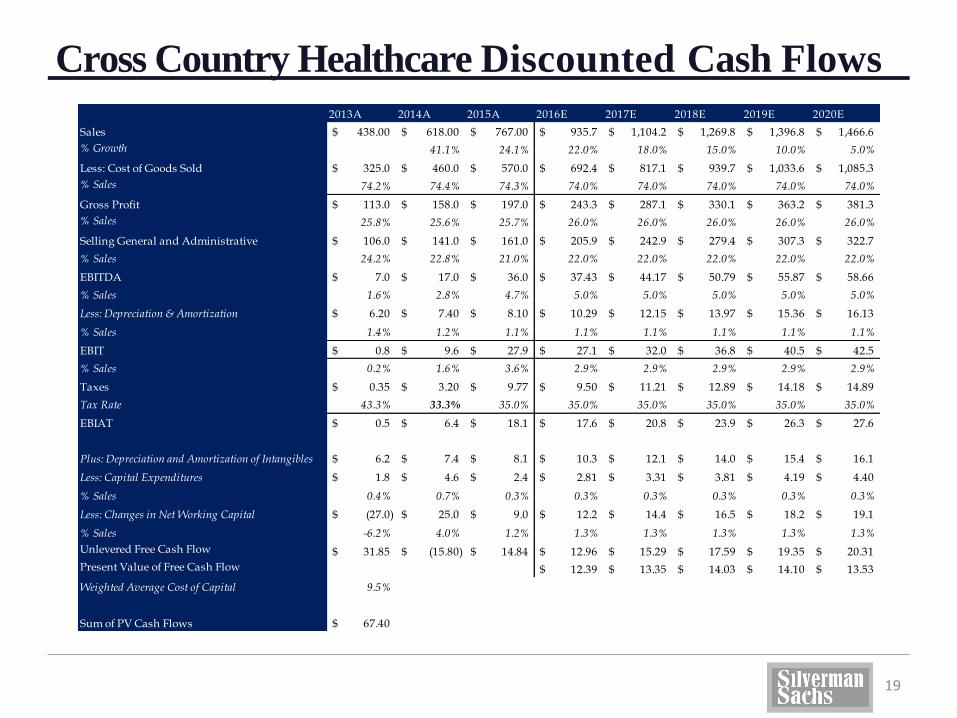
Cross Country Healthcare Discounted Cash Flows
2 0 1 3 A
19
2 0 1 4 A 2 0 1 5 A 2 0 1 6 E 2 0 1 7 E 2 0 1 8 E 2 0 1 9 E 2 0 2 0 E
2013A 2014A 2015A 2016E 2017E 2018E 2019E 2020E
Sales 438.00$ 618.00$ 767.00$ 935.7$ 1,104.2$ 1,269.8$ 1,396.8$ 1,466.6$
% Growth 41.1% 24.1% 22.0% 18.0% 15.0% 10.0% 5.0%
Less: Cost of Goods Sold 325.0$ 460.0$ 570.0$ 692.4$ 817.1$ 939.7$ 1,033.6$ 1,085.3$
% Sales 74.2% 74.4% 74.3% 74.0% 74.0% 74.0% 74.0% 74.0%
Gross Profit 113.0$ 158.0$ 197.0$ 243.3$ 287.1$ 330.1$ 363.2$ 381.3$
% Sales 25.8% 25.6% 25.7% 26.0% 26.0% 26.0% 26.0% 26.0%
Selling General and Administrative 106.0$ 141.0$ 161.0$ 205.9$ 242.9$ 279.4$ 307.3$ 322.7$
% Sales 24.2% 22.8% 21.0% 22.0% 22.0% 22.0% 22.0% 22.0%
EBITDA 7.0$ 17.0$ 36.0$ 37.43$ 44.17$ 50.79$ 55.87$ 58.66$
% Sales 1.6% 2.8% 4.7% 5.0% 5.0% 5.0% 5.0% 5.0%
Less: Depreciation & Amortization 6.20$ 7.40$ 8.10$ 10.29$ 12.15$ 13.97$ 15.36$ 16.13$
% Sales 1.4% 1.2% 1.1% 1.1% 1.1% 1.1% 1.1% 1.1%
EBIT 0.8$ 9.6$ 27.9$ 27.1$ 32.0$ 36.8$ 40.5$ 42.5$
% Sales 0.2% 1.6% 3.6% 2.9% 2.9% 2.9% 2.9% 2.9%
Taxes 0.35$ 3.20$ 9.77$ 9.50$ 11.21$ 12.89$ 14.18$ 14.89$
Tax Rate 43.3% 33.3% 35.0% 35.0% 35.0% 35.0% 35.0% 35.0%
EBIAT 0.5$ 6.4$ 18.1$ 17.6$ 20.8$ 23.9$ 26.3$ 27.6$
Plus: Depreciation and Amortization of Intangibles 6.2$ 7.4$ 8.1$ 10.3$ 12.1$ 14.0$ 15.4$ 16.1$
Less: Capital Expenditures 1.8$ 4.6$ 2.4$ 2.81$ 3.31$ 3.81$ 4.19$ 4.40$
% Sales 0.4% 0.7% 0.3% 0.3% 0.3% 0.3% 0.3% 0.3%
Less: Changes in Net Working Capital (27.0)$ 25.0$ 9.0$ 12.2$ 14.4$ 16.5$ 18.2$ 19.1$
% Sales -6.2% 4.0% 1.2% 1.3% 1.3% 1.3% 1.3% 1.3%
Unlevered Free Cash Flow 31.85$ (15.80)$ 14.84$ 12.96$ 15.29$ 17.59$ 19.35$ 20.31$
Present Value of Free Cash Flow 12.39$ 13.35$ 14.03$ 14.10$ 13.53$
Weighted Average Cost of Capital 9.5%
Sum of PV Cash Flows 67.40$
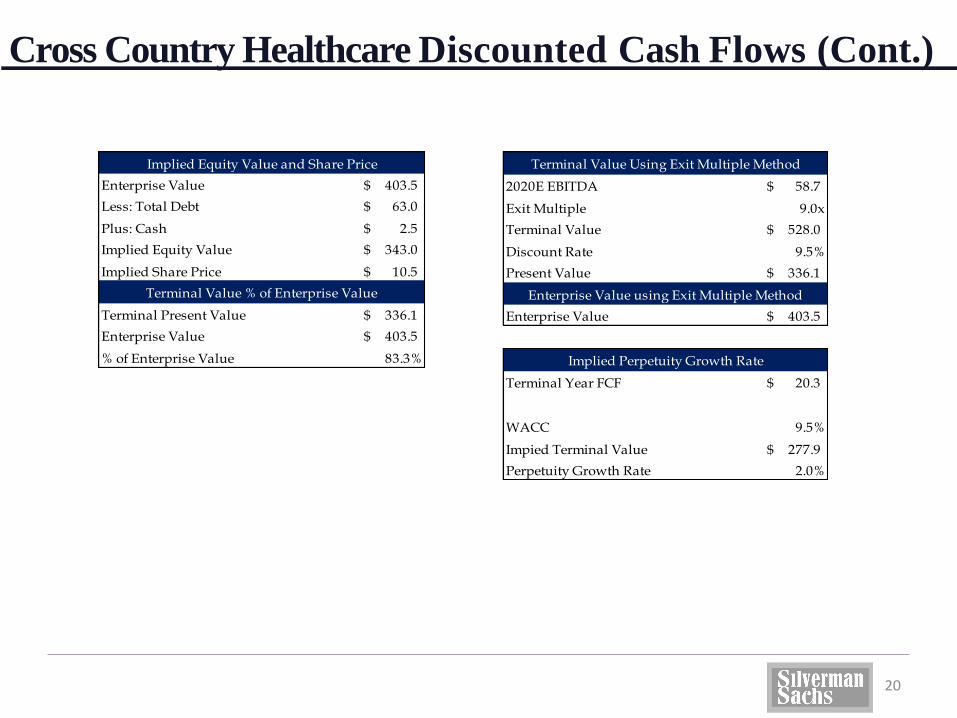
Cross Country Healthcare Discounted Cash Flows (Cont.)
20
Enterprise Value 403.5$
Less: Total Debt 63.0$
Plus: Cash 2.5$
Implied Equity Value 343.0$
Implied Share Price 10.5$
Terminal Present Value 336.1$
Enterprise Value 403.5$
% of Enterprise Value 83.3%
Terminal Value % of Enterprise Value
Implied Equity Value and Share Price
2020E EBITDA 58.7$
Exit Multiple 9.0x
Terminal Value 528.0$
Discount Rate 9.5%
Present Value 336.1$
Enterprise Value 403.5$
Terminal Value Using Exit Multiple Method
Enterprise Value using Exit Multiple Method
Terminal Year FCF 20.3$
WACC 9.5%
Impied Terminal Value 277.9$
Perpetuity Growth Rate 2.0%
Implied Perpetuity Growth Rate
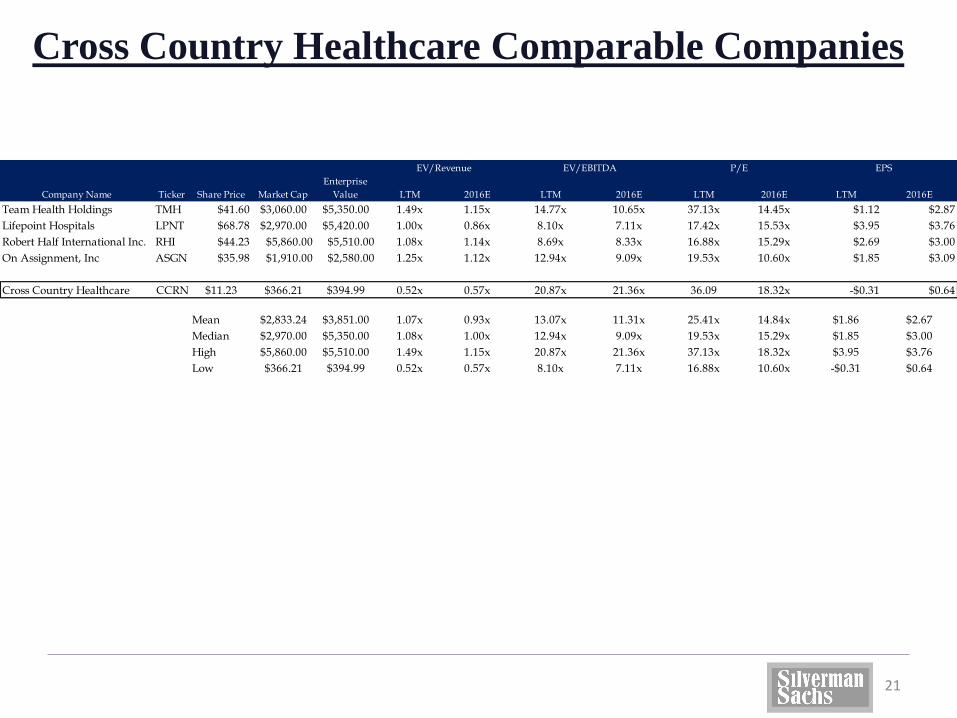
Cross Country Healthcare Comparable Companies
Company Name Ticker Share Price Market Cap
Enterprise
Value LTM 2016E LTM 2016E LTM 2016E LTM 2016E
Team Health Holdings TMH $41.60 $3,060.00 $5,350.00 1.49x 1.15x 14.77x 10.65x 37.13x 14.45x $1.12 $2.87
Lifepoint Hospitals LPNT $68.78 $2,970.00 $5,420.00 1.00x 0.86x 8.10x 7.11x 17.42x 15.53x $3.95 $3.76
Robert Half International Inc. RHI $44.23 $5,860.00 $5,510.00 1.08x 1.14x 8.69x 8.33x 16.88x 15.29x $2.69 $3.00
On Assignment, Inc ASGN $35.98 $1,910.00 $2,580.00 1.25x 1.12x 12.94x 9.09x 19.53x 10.60x $1.85 $3.09
Cross Country Healthcare CCRN $11.23 $366.21 $394.99 0.52x 0.57x 20.87x 21.36x 36.09 18.32x -$0.31 $0.64
Mean $2,833.24 $3,851.00 1.07x 0.93x 13.07x 11.31x 25.41x 14.84x $1.86 $2.67
Median $2,970.00 $5,350.00 1.08x 1.00x 12.94x 9.09x 19.53x 15.29x $1.85 $3.00
High $5,860.00 $5,510.00 1.49x 1.15x 20.87x 21.36x 37.13x 18.32x $3.95 $3.76
Low $366.21 $394.99 0.52x 0.57x 8.10x 7.11x 16.88x 10.60x -$0.31 $0.64
EV/Revenue EV/EBITDA P/E EPS
21

Pro Forma Capital StructureSECTION VI
22
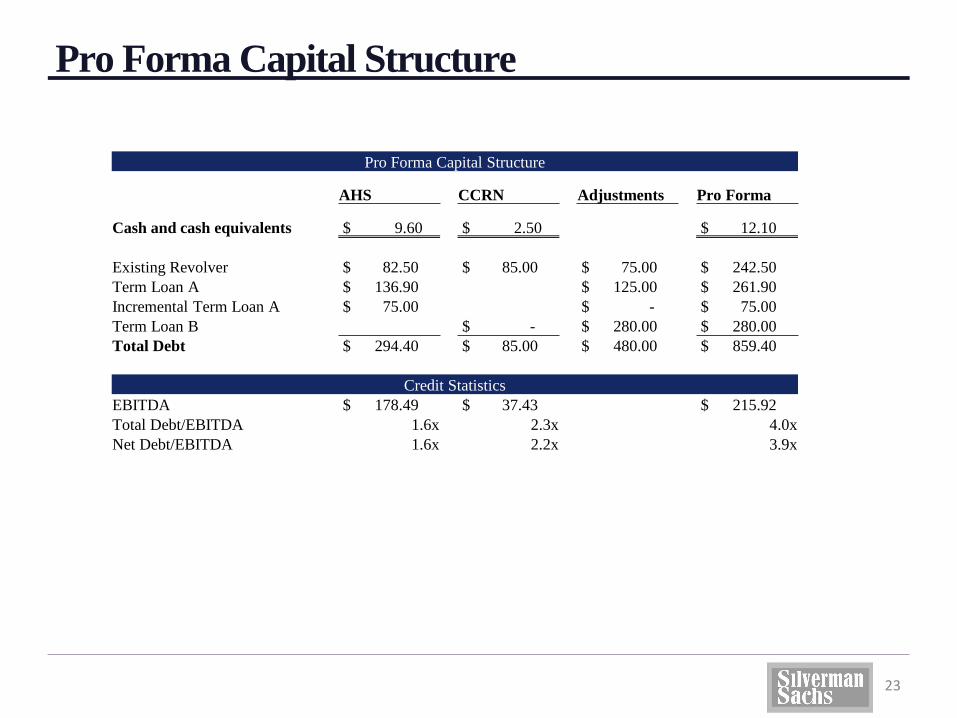
Pro Forma Capital Structure
23
Pro Forma Capital Structure
AHS CCRN Adjustments Pro Forma
Cash and cash equivalents $ 9.60 $ 2.50 $ 12.10
Existing Revolver $ 82.50 $ 85.00 $ 75.00 $ 242.50
Term Loan A $ 136.90 $ 125.00 $ 261.90
Incremental Term Loan A $ 75.00 $ - $ 75.00
Term Loan B $ - $ 280.00 $ 280.00
Total Debt $ 294.40 $ 85.00 $ 480.00 $ 859.40
Credit Statistics
EBITDA $ 178.49 $ 37.43 $ 215.92
Total Debt/EBITDA 1.6x 2.3x 4.0x
Net Debt/EBITDA 1.6x 2.2x 3.9x
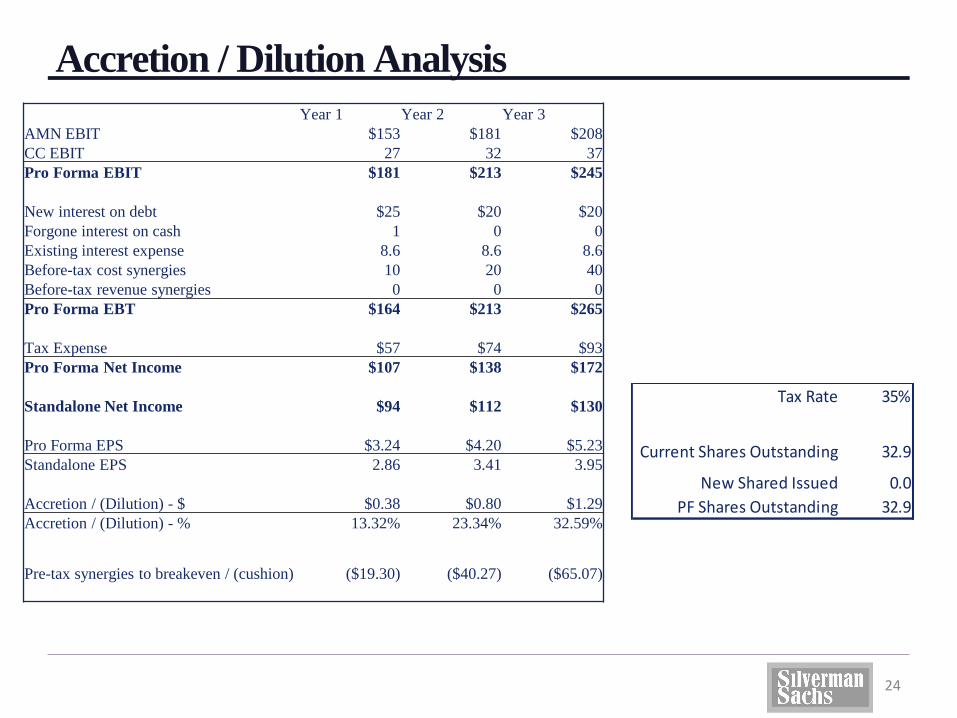
Accretion / Dilution Analysis
24
Year 1 Year 2 Year 3
AMN EBIT $153 $181 $208
CC EBIT 27 32 37
Pro Forma EBIT $181 $213 $245
New interest on debt $25 $20 $20
Forgone interest on cash 1 0 0
Existing interest expense 8.6 8.6 8.6
Before-tax cost synergies 10 20 40
Before-tax revenue synergies 0 0 0
Pro Forma EBT $164 $213 $265
Tax Expense $57 $74 $93
Pro Forma Net Income $107 $138 $172
Standalone Net Income $94 $112 $130
Pro Forma EPS $3.24 $4.20 $5.23
Standalone EPS 2.86 3.41 3.95
Accretion / (Dilution) - $ $0.38 $0.80 $1.29
Accretion / (Dilution) - % 13.32% 23.34% 32.59%
Pre-tax synergies to breakeven / (cushion) ($19.30) ($40.27) ($65.07)
Tax Rate 35%
Current Shares Outstanding 32.9
New Shared Issued 0.0
PF Shares Outstanding 32.9
AppendixSECTION VII
25
26
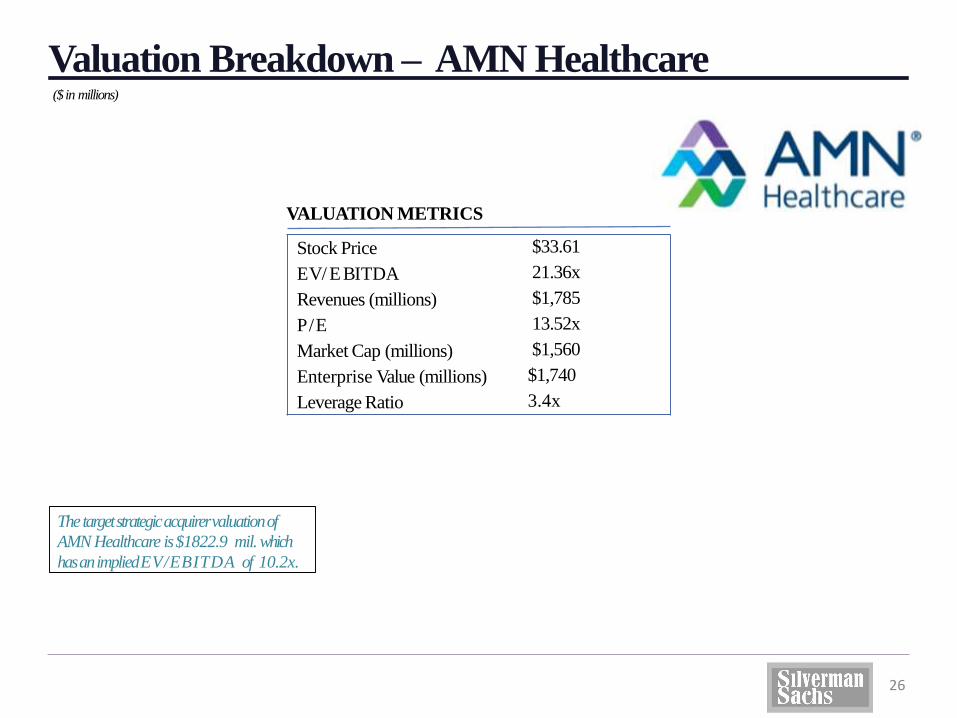
Valuation Breakdown – AMN Healthcare($ in millions)
The target strategic acquirer valuation of
AMN Healthcare is $1822.9 mil. which
has an implied EV/EBITDA of 10.2x.
Stock Price
EV/ EBITDA
Revenues (millions)
P/E
Market Cap (millions)
Enterprise Value (millions)
Leverage Ratio
$33.61
21.36x
$1,785
13.52x
$1,560
$1,740
3.4x
VALUATION METRICS
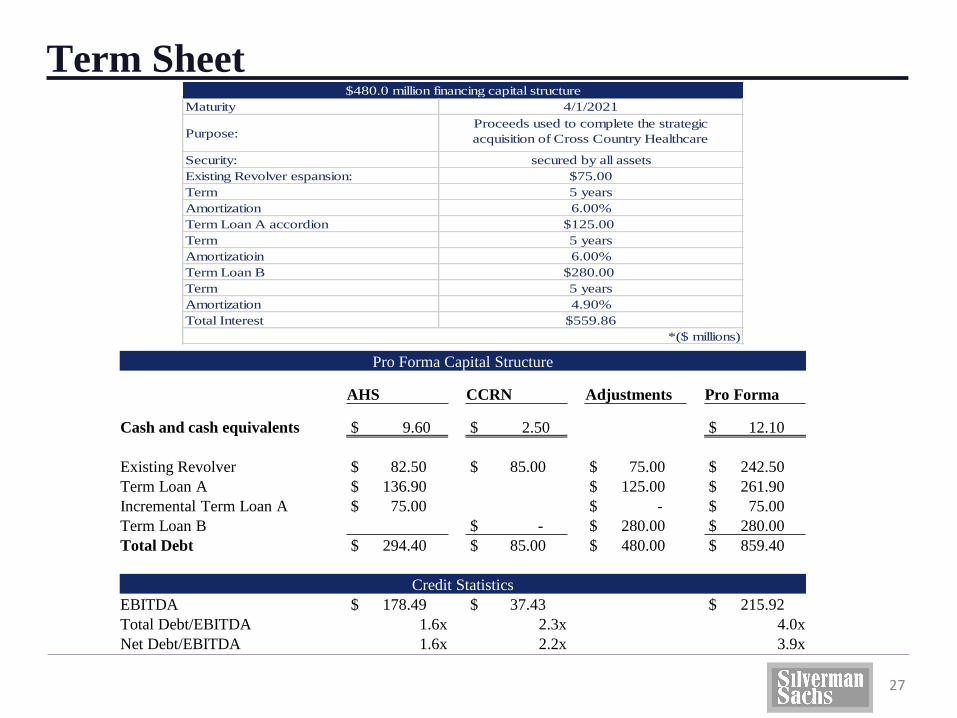
Term Sheet
27
Pro Forma Capital Structure
AHS CCRN Adjustments Pro Forma
Cash and cash equivalents $ 9.60 $ 2.50 $ 12.10
Existing Revolver $ 82.50 $ 85.00 $ 75.00 $ 242.50
Term Loan A $ 136.90 $ 125.00 $ 261.90
Incremental Term Loan A $ 75.00 $ - $ 75.00
Term Loan B $ - $ 280.00 $ 280.00
Total Debt $ 294.40 $ 85.00 $ 480.00 $ 859.40
Credit Statistics
EBITDA $ 178.49 $ 37.43 $ 215.92
Total Debt/EBITDA 1.6x 2.3x 4.0x
Net Debt/EBITDA 1.6x 2.2x 3.9x
Maturity
Purpose:
Security:
Existing Revolver espansion:
Term
Amortization
Term Loan A accordion
Term
Amortizatioin
Term Loan B
Term
Amortization
Total Interest
4.90%
$559.86
*($ millions)
6.00%
$125.00
5 years
6.00%
$280.00
5 years
Proceeds used to complete the strategic
acquisition of Cross Country Healthcare
$480.0 million financing capital structure
4/1/2021
secured by all assets
$75.00
5 years
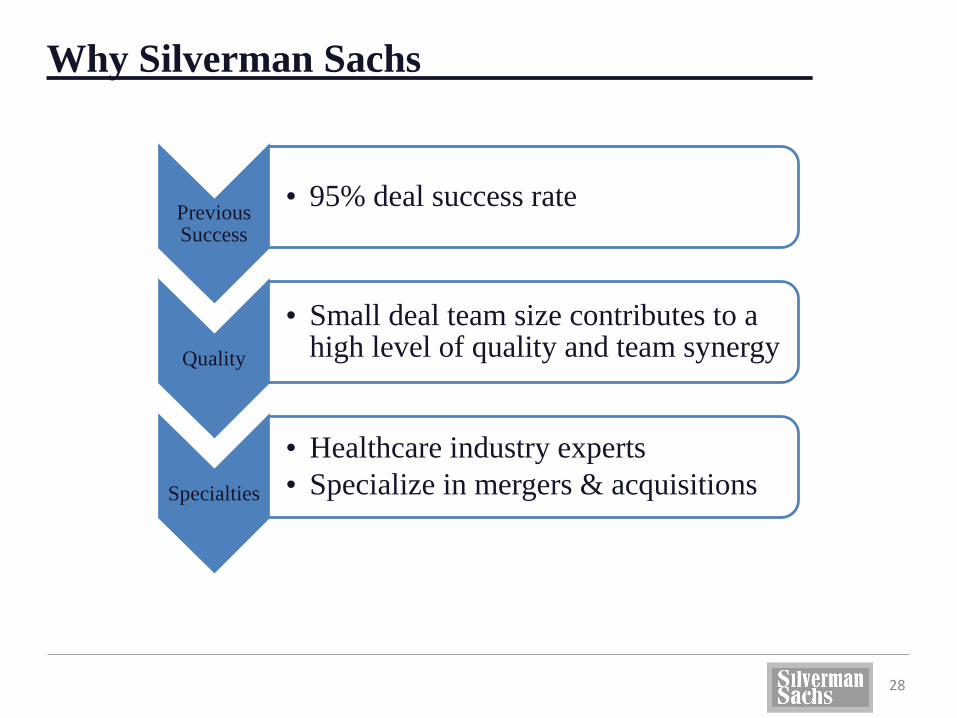
Why Silverman Sachs
Previous Success
• 95% deal success rate
Quality
• Small deal team size contributes to a high level of quality and team synergy
Specialties
• Healthcare industry experts
• Specialize in mergers & acquisitions
28


