56
Superfund 2017 Cleanup Accomplishments and the Challenges Ahead Katherine N. Probst

Superfund 2017Cleanup Accomplishments and the Challenges Ahead
Katherine N. Probst

Superfund 2017Cleanup Accomplishments and the Challenges Ahead
Katherine N. Probst
© 2017 Katherine N. Probst
All rights reserved. No part of this publication may be reproduced by any means, either electronic or mechanical, without permission in writing from the author.
Katherine Probst is an independent consultant who has written widely on the Superfund program. Ms. Probst is the sole author of this paper and was guaranteed complete independence in all aspects of the work by the funders. The analysis, conclusions, and language in this paper are solely those of the author. Funding for this paper was provided by ACEC.
www.kateprobstconsulting.com
ACEC, CDM Smith, CH2M, Ecology & Environment, EQM, HDR, Nobis Engineering, PWT, SCST, TechLaw, Tetra Tech, and Weston Solutions supported this study.
iii
List of Figures �����������������������������������������������������������������������������������������������������������������������������iv
Acknowledgments������������������������������������������������������������������������������������������������������������������������v
Executive Summary ��������������������������������������������������������������������������������������������������������������������vii
Superfund Snapshot ������������������������������������������������������������������������������������������������������������viiConclusions ������������������������������������������������������������������������������������������������������������������������ viiiRecommendations �������������������������������������������������������������������������������������������������������������� xiii
Superfund 2017: Cleanup Accomplishments and the Challenges Ahead ����������������������������������� 1
Introduction �������������������������������������������������������������������������������������������������������������������������� 1Superfund Remedial Program Overview ��������������������������������������������������������������������������������� 3Superfund Snapshot: Status of Non-Federal NPL Sites at the End of FY 2016 �������������������������� 6Trends in NPL Listing �������������������������������������������������������������������������������������������������������������� 9Cleanup Progress Over Time ������������������������������������������������������������������������������������������������15Funding Over Time ���������������������������������������������������������������������������������������������������������������20Conclusions and Recommendations ������������������������������������������������������������������������������������26
Appendix A: Deflator Source and Factors Used to Convert Nominal 1999 Through 2015 Dollars to Constant 2016 Dollars 35
Appendix B: U�S� EPA Matrix of Site Type Categories ������������������������������������������������������������������36
Appendix C: Comparison of Different Types of Manufacturing Sites Added to the NPL Over Time by Percentage of Sites Listed �����������������������������������������������������������������37
Appendix D: Non-Federal Sites Added to the NPL by Type: Comparison Over Time, by Percentage ������������������������������������������������������������������������������������������������������38
Contents
iv
List of Figures
Figure ES-1. Cumulative Status of Non-Federal NPL Sites, FY 2000–FY 2016 ����������������������������� viii
Figure ES-2. Superfund Appropriations and Remedial Program Budget in Constant and Nominal Dollars, FY 2000–FY 2016 ������������������������������������������������������������������������� ix
Figure ES-3. Actual EPA Remedial Expenditures vs� RFF Estimated Expenditures in Constant 2016 Dollars, FY 2000–FY 2009 ������������������������������������������������������������x
Figure ES-4. Number of Non-Federal NPL Sites Construction Complete and Deleted Each Year, FY 2000–FY 2016 ���������������������������������������������������������������������������������������������������xi
Figure ES-5. Number of Non-Federal Sites Added to the NPL by Year, FY 2000–FY 2016 �������������� xii
Figure ES-6. Number of Non-Federal Sites Added to the NPL by Type: Comparison Over Time ������� xiii
Figure 1. Site Status of 1,555 Non-Federal NPL Sites at the End of FY 2016, Showing the Least Advanced and Most Advanced Operable Units (OUs) ���������������������������������� 6
Figure 2. Human Exposure and Groundwater Migration Under Control at Non-Federal NPL Sites, End of FY 2016 ���������������������������������������������������������������������������������������� 8
Figure 3. Number of Non-Federal Sites Added to the NPL by Year, FY 2000–FY 2016 �������������10
Figure 4. Non-Federal Sites Added to the NPL by Type (121 sites), FY 2010–FY 2016 ������������12
Figure 5. Number of Non-Federal Sites Added to the NPL by Type: Comparison Over Time �������13
Figure 6. Percentage of Remedial Action Project Starts at Non-Federal NPL Sites that Were PRP and EPA Lead, FY 2000–FY 2016 ����������������������������������������������������15
Figure 7. Number of Non-Federal NPL Sites Construction Complete and Deleted Each Year, FY 2000–FY 2016 �������������������������������������������������������������������������������������������������16
Figure 8. Average Number of Operable Units (OUs) at Non-Federal NPL Sites at Different Stages in the Cleanup Process��������������������������������������������������������������17
Figure 9. Number of Remedial Action Project Starts at Non-Federal NPL Sites: EPA and PRP Lead, FY 2000–FY 2016 ��������������������������������������������������������������������18
Figure 10. Cumulative Status of Non-Federal NPL Sites, FY 2000–FY 2016 �����������������������������19
Figure 11. Superfund Appropriations in Constant and Nominal Dollars, FY 2000–FY 2016 ������20
Figure 12. Superfund Remedial Program Budget in Constant and Nominal Dollars, FY 2002–FY 2016 �������������������������������������������������������������������������������������������������21
Figure 13. Impact of American Recovery and Reinvestment Act (ARRA) Funds on Remedial Expenditures in Constant 2016 Dollars, FY 2009–FY 2013 �����������������22
Figure 14. Number and Associated Cost of Unfunded Remedial Action Starts at Non-Federal NPL Sites in Constant 2016 Dollars, FY 2000–FY 2016 ����������������������23
Figure 15. Actual EPA Remedial Expenditures vs� RFF Estimated Expenditures in Constant 2016 Dollars, FY 2000–FY 2009 ���������������������������������������������������������25
Figure 16. Non-Federal NPL Sites Reaching Construction Complete: Actual EPA vs� RFF Predicted, FY 2000–FY 2009 ����������������������������������������������������26
v
Acknowledgments
This paper was commissioned by the American Council of Engineering Companies (ACEC). In the summer of 2016, members of the ACEC Superfund Study Work Group decided that they wanted to fund an independent white paper on the status of the Superfund remedial program and contacted me to see if I would be willing to undertake such a project. By contract, I was assured that I would have complete independence regarding the paper. I greatly appreciate the support of the members of the ACEC Superfund Study Work Group and their adherence to the terms of the contract. The analysis, conclusions, and recommendations in the paper are mine, and mine alone, and do not represent the views of ACEC nor of any other organization.
The analysis in this paper would not have been possible without the help of staff and management in EPA’s Office of Superfund Remediation and Technology Innovation, who provided historical and current data about the Superfund program. My thanks to all of them for their help, and for answering what must have seemed like endless questions about the data and many aspects of the remedial program.
Thanks are due as well to those individuals who reviewed a confidential draft of the paper for accuracy and structure: ACEC Superfund Study Work Group members, Amy Brittain with the Association of State and Territorial Solid Waste Management Officials (ASTSWMO) Superfund CERCLA and Brownfields Subcommittee, David Lennett of the Natural Resources Defense Council, Walter Mugdan of EPA Region II, John Pendergrass of the Environmental Law Institute, Jennifer Roberts with the ASTSWMO Superfund CERCLA and Brownfields Subcommittee, Dania Rodriguez, ASTSWMO, Lawrence Schnapf, and Lenny Siegel of the Center for Public Environmental Oversight.
I would also like to thank those ACEC staff who worked with me on this project for their help and support.
Finally, any errors or omissions are those of the author.
Kate Probst

vii
Executive Summary
The Comprehensive Environmental Response, Compensation, and Liability Act (CERCLA), better known as “Superfund,” is now in its 37th year. At the start of a new presidential administration it is timely, once again, to review the progress of the Superfund remedial program aimed at cleaning up sites on the National Priorities List (NPL). The NPL is the list of sites where federal funds can be used to pay for remedial actions or more colloquially, what are referred to as long-term cleanups. The NPL has become synonymous with those sites that are the highest priority in the country: contaminated areas warranting federal funding, federal enforcement action, or both.
The purpose of this paper is to provide information on the overall progress of the remedial program, looking at both the number and types of sites added to the NPL since FY 2000 as well as at key measures of program success. Program funding is also examined as one of the questions that has plagued the program for many years is whether Congress is appropriating adequate funds to ensure the timely cleanup of sites. This paper focuses on sites on the NPL that are not owned or operated by federal agencies (referred to as “non- federal” NPL sites) from FY 2000 through FY 2016; proposed NPL sites, federal facilities, and Superfund al-ternative sites are not addressed. Where appropriate, actual EPA expenditures and accomplishments are compared with the estimates that were presented in a 2001 Report to Congress, Superfund’s Future: What Will It Cost?, published by Resources for the Future (RFF).1 All dollar amounts are in constant 2016 dollars unless other-wise noted.
It is hoped that the information presented here will lead to a more informed debate about the future of the Superfund remedial program.
Superfund Snapshot
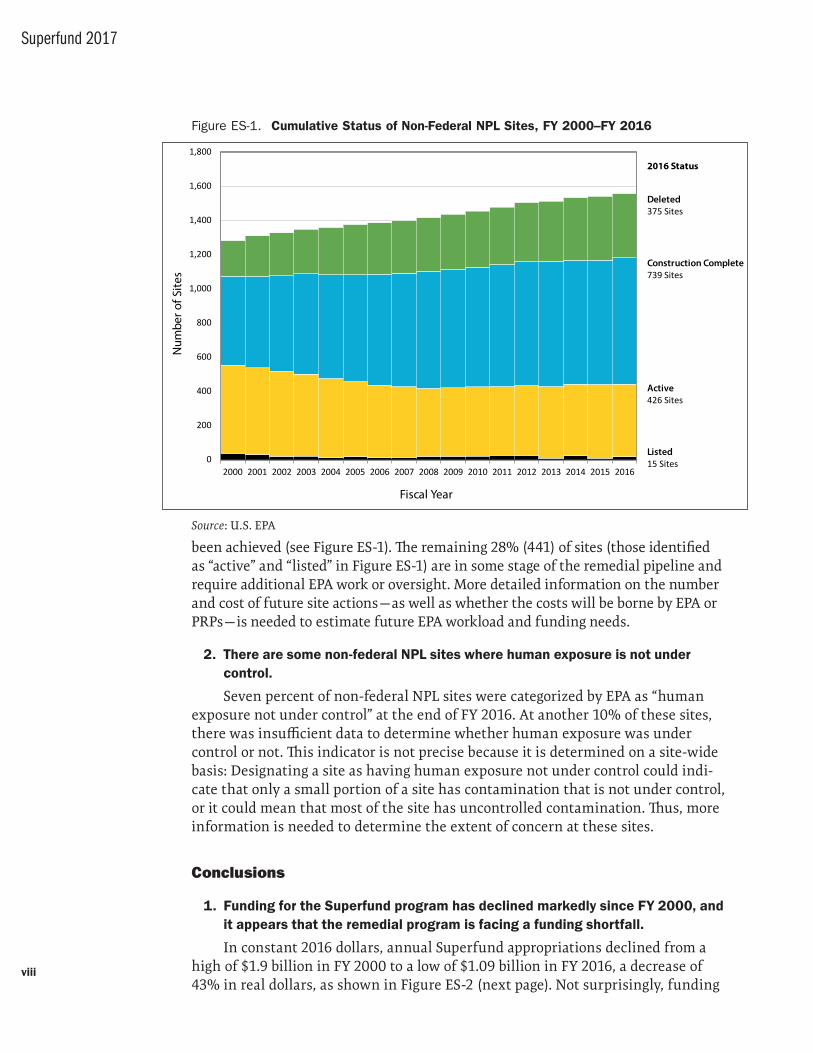
1. Over two-thirds of the 1,555 non-federal sites on the NPL at the end of FY 2016 either have been deleted from the NPL (meaning that all response actions are complete and all cleanup goals have been achieved) or are con-struction complete (meaning all remedies have been constructed).
As of the end of FY 2016, 24% (375) of non-federal NPL sites had been deleted from the NPL and another 48% (739) were construction complete but not deleted, meaning that all remedies have been constructed but all cleanup objectives have not
1. Superfund’s Future: What Will It Cost? A Report to Congress, Katherine Probst et al., Resources for
the Future, 2001, Washington, DC.
viii
Superfund 2017
been achieved (see Figure ES-1). The remaining 28% (441) of sites (those identified as “active” and “listed” in Figure ES-1) are in some stage of the remedial pipeline and require additional EPA work or oversight. More detailed information on the number and cost of future site actions — as well as whether the costs will be borne by EPA or PRPs — is needed to estimate future EPA workload and funding needs.
2. There are some non-federal NPL sites where human exposure is not under control.
Seven percent of non-federal NPL sites were categorized by EPA as “human exposure not under control” at the end of FY 2016. At another 10% of these sites, there was insufficient data to determine whether human exposure was under control or not. This indicator is not precise because it is determined on a site-wide basis: Designating a site as having human exposure not under control could indi-cate that only a small portion of a site has contamination that is not under control, or it could mean that most of the site has uncontrolled contamination. Thus, more information is needed to determine the extent of concern at these sites.
Conclusions
1. Funding for the Superfund program has declined markedly since FY 2000, and it appears that the remedial program is facing a funding shortfall.
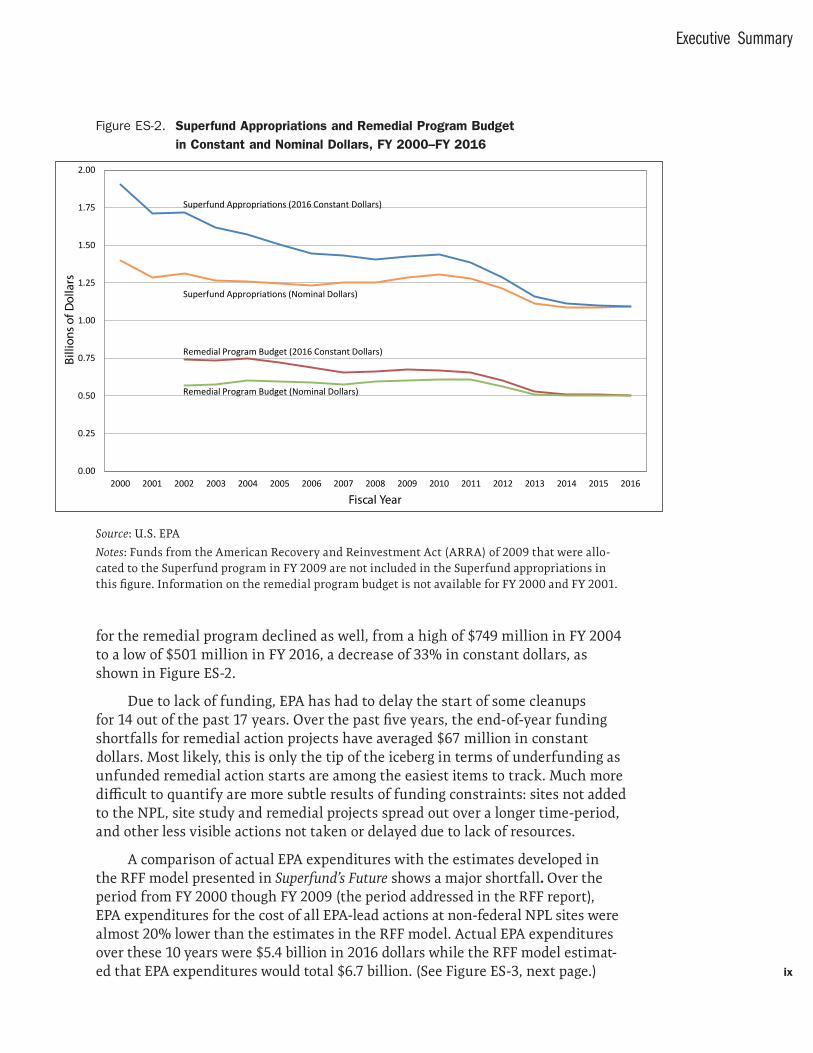
In constant 2016 dollars, annual Superfund appropriations declined from a high of $1.9 billion in FY 2000 to a low of $1.09 billion in FY 2016, a decrease of 43% in real dollars, as shown in Figure ES-2 (next page). Not surprisingly, funding
Figure ES-1. Cumulative Status of Non-Federal NPL Sites, FY 2000–FY 2016
0
200
400
600
800
1,000
1,200
1,400
1,600
1,800
2000 2001 2002 2003 2004 2005 2006 2007 2008 2009 2010 2011 2012 2013 2014 2015 2016
Num
ber o
f Site
s
Fiscal Year
Deleted 375 Sites
Construction Complete739 Sites
Active 426 Sites
Listed 15 Sites
2016 Status
Source: U.S. EPA
Executive Summary
ix
Figure ES-2. Superfund Appropriations and Remedial Program Budget in Constant and Nominal Dollars, FY 2000–FY 2016
0.00
0.25
0.50
0.75
1.00
1.25
1.50
1.75
2.00
2000 2001 2002 2003 2004 2005 2006 2007 2008 2009 2010 2011 2012 2013 2014 2015 2016
Billi
ons o
f Dol
lars
Fiscal Year
Superfund Appropriations (2016 Constant Dollars)
Superfund Appropriations (Nominal Dollars)
Remedial Program Budget (2016 Constant Dollars)
Remedial Program Budget (Nominal Dollars)
Source: U.S. EPA
Notes: Funds from the American Recovery and Reinvestment Act (ARRA) of 2009 that were allo-cated to the Superfund program in FY 2009 are not included in the Superfund appropriations in this figure. Information on the remedial program budget is not available for FY 2000 and FY 2001.
for the remedial program declined as well, from a high of $749 million in FY 2004 to a low of $501 million in FY 2016, a decrease of 33% in constant dollars, as shown in Figure ES-2.
Due to lack of funding, EPA has had to delay the start of some cleanups for 14 out of the past 17 years. Over the past five years, the end-of-year funding shortfalls for remedial action projects have averaged $67 million in constant dollars. Most likely, this is only the tip of the iceberg in terms of underfunding as unfunded remedial action starts are among the easiest items to track. Much more difficult to quantify are more subtle results of funding constraints: sites not added to the NPL, site study and remedial projects spread out over a longer time- period, and other less visible actions not taken or delayed due to lack of resources.
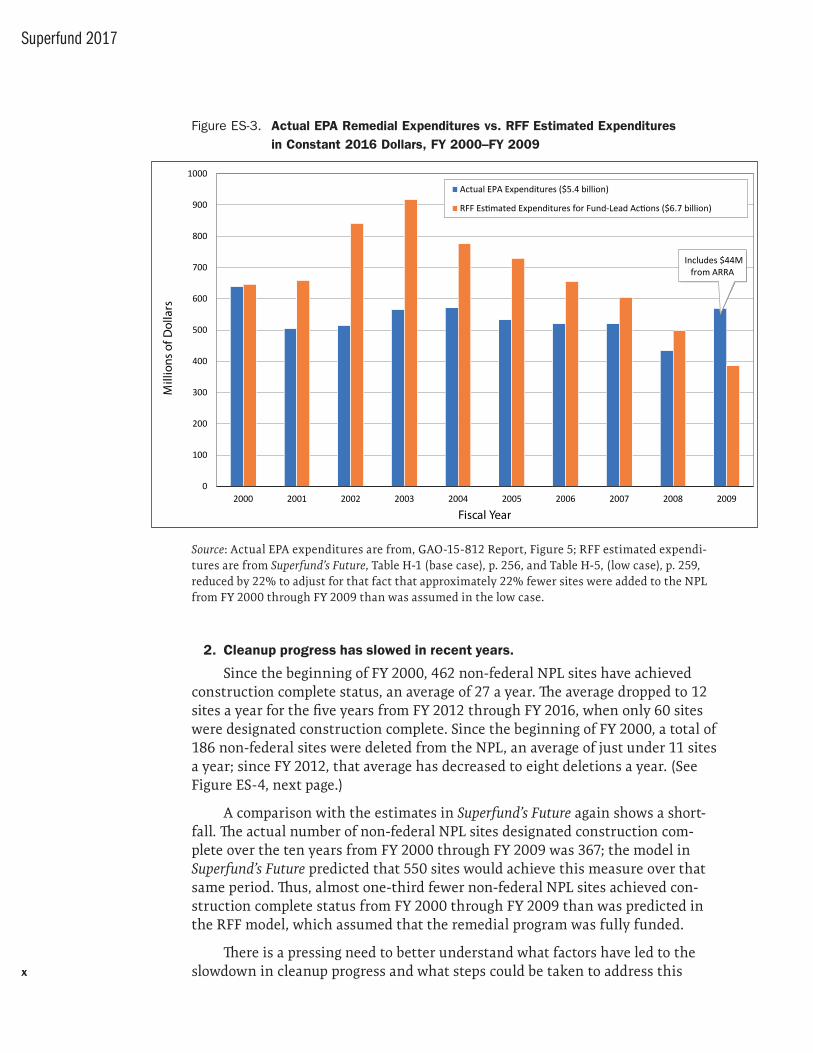
A comparison of actual EPA expenditures with the estimates developed in the RFF model presented in Superfund’s Future shows a major shortfall. Over the period from FY 2000 though FY 2009 (the period addressed in the RFF report), EPA expenditures for the cost of all EPA-lead actions at non-federal NPL sites were almost 20% lower than the estimates in the RFF model. Actual EPA expenditures over these 10 years were $5.4 billion in 2016 dollars while the RFF model estimat-ed that EPA expenditures would total $6.7 billion. (See Figure ES-3, next page.)
x
Superfund 2017
2. Cleanup progress has slowed in recent years.
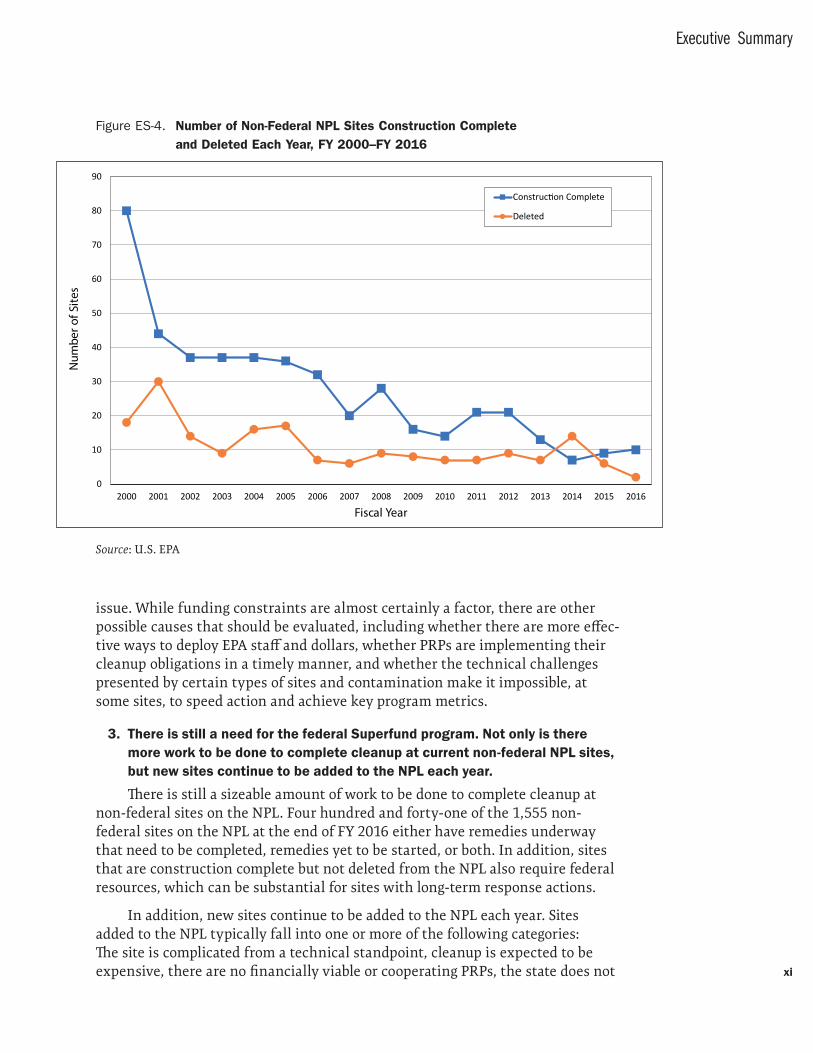
Since the beginning of FY 2000, 462 non-federal NPL sites have achieved construction complete status, an average of 27 a year. The average dropped to 12 sites a year for the five years from FY 2012 through FY 2016, when only 60 sites were designated construction complete. Since the beginning of FY 2000, a total of 186 non-federal sites were deleted from the NPL, an average of just under 11 sites a year; since FY 2012, that average has decreased to eight deletions a year. (See Figure ES-4, next page.)
A comparison with the estimates in Superfund’s Future again shows a short-fall. The actual number of non-federal NPL sites designated construction com-plete over the ten years from FY 2000 through FY 2009 was 367; the model in Superfund’s Future predicted that 550 sites would achieve this measure over that same period. Thus, almost one-third fewer non-federal NPL sites achieved con-struction complete status from FY 2000 through FY 2009 than was predicted in the RFF model, which assumed that the remedial program was fully funded.
There is a pressing need to better understand what factors have led to the slowdown in cleanup progress and what steps could be taken to address this
Figure ES-3. Actual EPA Remedial Expenditures vs. RFF Estimated Expenditures in Constant 2016 Dollars, FY 2000–FY 2009
0
100
200
300
400
500
600
700
800
900
1000
2000 2001 2002 2003 2004 2005 2006 2007 2008 2009
Mill
ions
of D
olla
rs
Fiscal Year
Actual EPA Expenditures ($5.4 billion)
RFF Estimated Expenditures for Fund-Lead Actions ($6.7 billion)
Includes $44M from ARRA
Source: Actual EPA expenditures are from, GAO-15-812 Report, Figure 5; RFF estimated expendi-tures are from Superfund’s Future, Table H-1 (base case), p. 256, and Table H-5, (low case), p. 259, reduced by 22% to adjust for that fact that approximately 22% fewer sites were added to the NPL from FY 2000 through FY 2009 than was assumed in the low case.
Executive Summary
xi
issue. While funding constraints are almost certainly a factor, there are other possible causes that should be evaluated, including whether there are more effec-tive ways to deploy EPA staff and dollars, whether PRPs are implementing their cleanup obligations in a timely manner, and whether the technical challenges presented by certain types of sites and contamination make it impossible, at some sites, to speed action and achieve key program metrics.
3. There is still a need for the federal Superfund program. Not only is there more work to be done to complete cleanup at current non-federal NPL sites, but new sites continue to be added to the NPL each year.
There is still a sizeable amount of work to be done to complete cleanup at non-federal sites on the NPL. Four hundred and forty-one of the 1,555 non- federal sites on the NPL at the end of FY 2016 either have remedies underway that need to be completed, remedies yet to be started, or both. In addition, sites that are construction complete but not deleted from the NPL also require federal resources, which can be substantial for sites with long-term response actions.
In addition, new sites continue to be added to the NPL each year. Sites added to the NPL typically fall into one or more of the following categories: The site is complicated from a technical standpoint, cleanup is expected to be expensive, there are no financially viable or cooperating PRPs, the state does not
Figure ES-4. Number of Non-Federal NPL Sites Construction Complete and Deleted Each Year, FY 2000–FY 2016
0
10
20
30
40
50
60
70
80
90
2000 2001 2002 2003 2004 2005 2006 2007 2008 2009 2010 2011 2012 2013 2014 2015 2016
Num
ber o
f Site
s
Fiscal Year
Construction Complete
Deleted
Source: U.S. EPA
xii
Superfund 2017
have adequate funds to address the site, the site has recalcitrant PRPs and the state lacks the necessary resources and legal authority needed and seeks federal enforcement, or the site is high-profile and has hit the front page of the national newspapers.
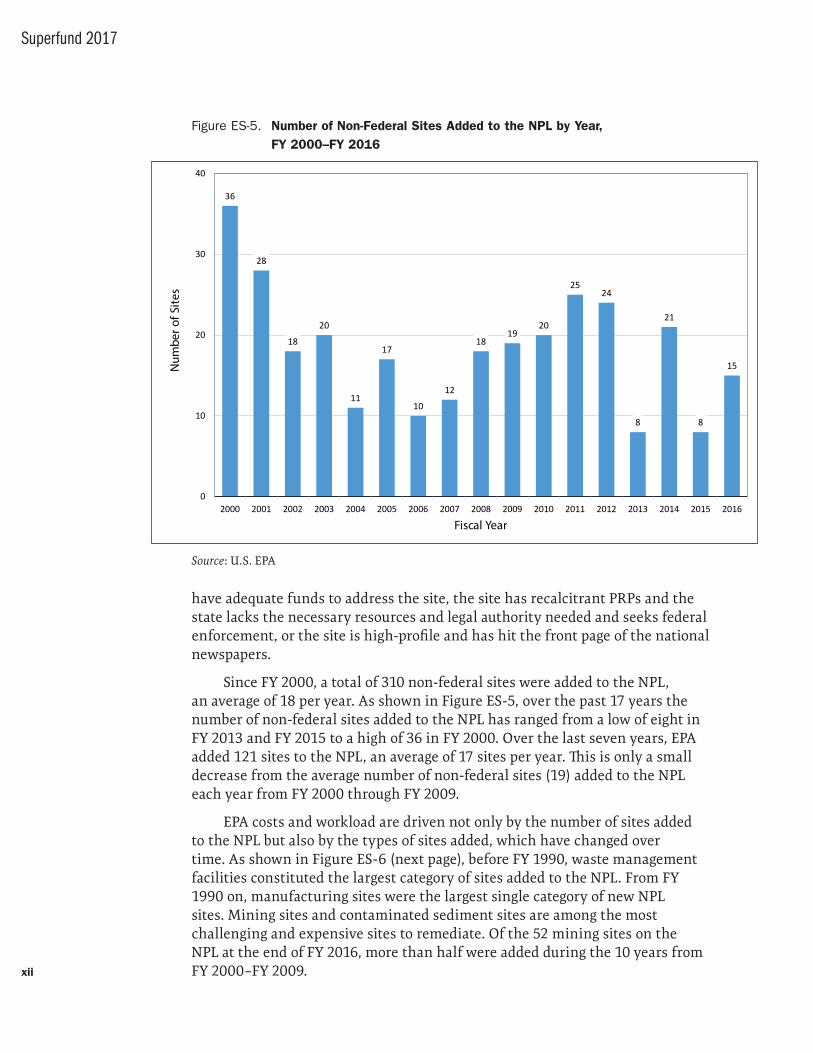
Since FY 2000, a total of 310 non-federal sites were added to the NPL, an average of 18 per year. As shown in Figure ES-5, over the past 17 years the number of non-federal sites added to the NPL has ranged from a low of eight in FY 2013 and FY 2015 to a high of 36 in FY 2000. Over the last seven years, EPA added 121 sites to the NPL, an average of 17 sites per year. This is only a small decrease from the average number of non-federal sites (19) added to the NPL each year from FY 2000 through FY 2009.
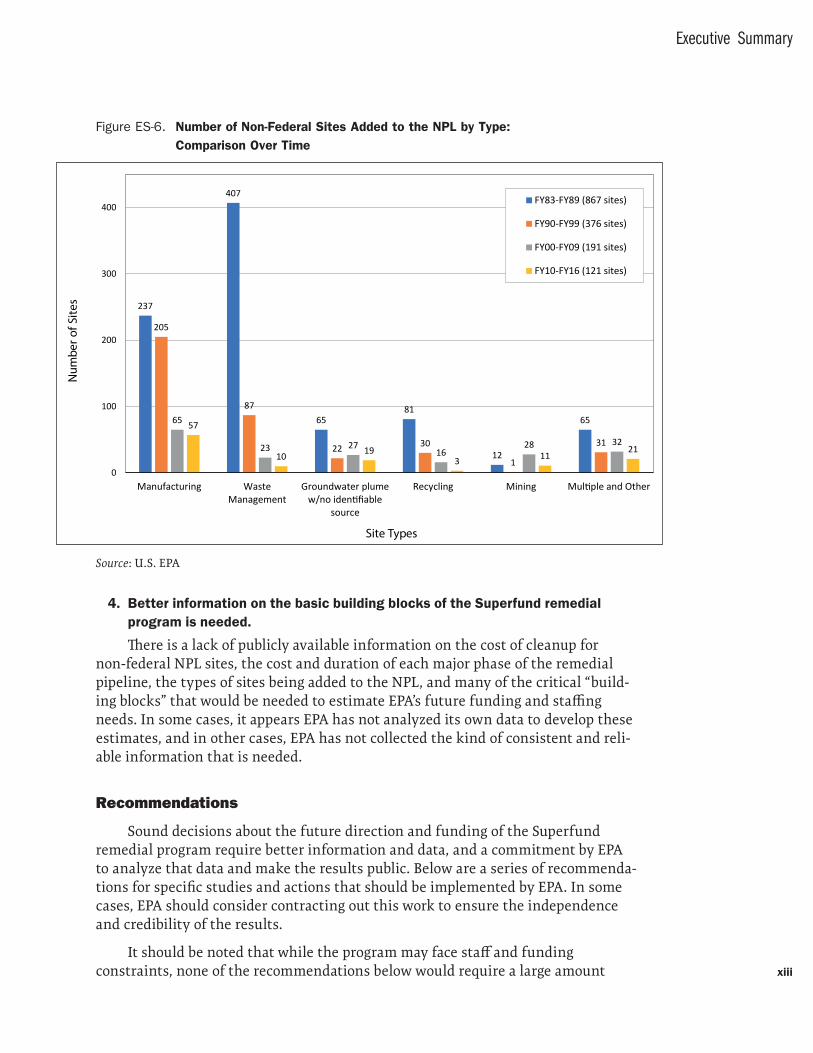
EPA costs and workload are driven not only by the number of sites added to the NPL but also by the types of sites added, which have changed over time. As shown in Figure ES-6 (next page), before FY 1990, waste management facilities constituted the largest category of sites added to the NPL. From FY 1990 on, manufacturing sites were the largest single category of new NPL sites. Mining sites and contaminated sediment sites are among the most challenging and expensive sites to remediate. Of the 52 mining sites on the NPL at the end of FY 2016, more than half were added during the 10 years from FY 2000–FY 2009.
Figure ES-5. Number of Non-Federal Sites Added to the NPL by Year, FY 2000–FY 2016
36
28
18
20
11
17
10
12
1819
20
2524
8
21
8
15
0
10
20
30
40
2000 2001 2002 2003 2004 2005 2006 2007 2008 2009 2010 2011 2012 2013 2014 2015 2016
Num
ber o
f Site
s
Fiscal Year
Source: U.S. EPA
Executive Summary
xiii
4. Better information on the basic building blocks of the Superfund remedial program is needed.
There is a lack of publicly available information on the cost of cleanup for non-federal NPL sites, the cost and duration of each major phase of the remedial pipeline, the types of sites being added to the NPL, and many of the critical “build-ing blocks” that would be needed to estimate EPA’s future funding and staffing needs. In some cases, it appears EPA has not analyzed its own data to develop these estimates, and in other cases, EPA has not collected the kind of consistent and reli-able information that is needed.
Recommendations
Sound decisions about the future direction and funding of the Superfund remedial program require better information and data, and a commitment by EPA to analyze that data and make the results public. Below are a series of recommenda-tions for specific studies and actions that should be implemented by EPA. In some cases, EPA should consider contracting out this work to ensure the independence and credibility of the results.
It should be noted that while the program may face staff and funding constraints, none of the recommendations below would require a large amount
Figure ES-6. Number of Non-Federal Sites Added to the NPL by Type: Comparison Over Time
237
407
6581
12
65
205
87
22 30
1
31
65
23 2716
28 32
57
10 193 11
21
0
100
200
300
400
Manufacturing WasteManagement
Groundwater plumew/no identifiable
source
Recycling Mining Multiple and Other
Num
ber o
f Site
s
Site Types
FY83-FY89 (867 sites)
FY90-FY99 (376 sites)
FY00-FY09 (191 sites)
FY10-FY16 (121 sites)
Source: U.S. EPA
xiv
Superfund 2017
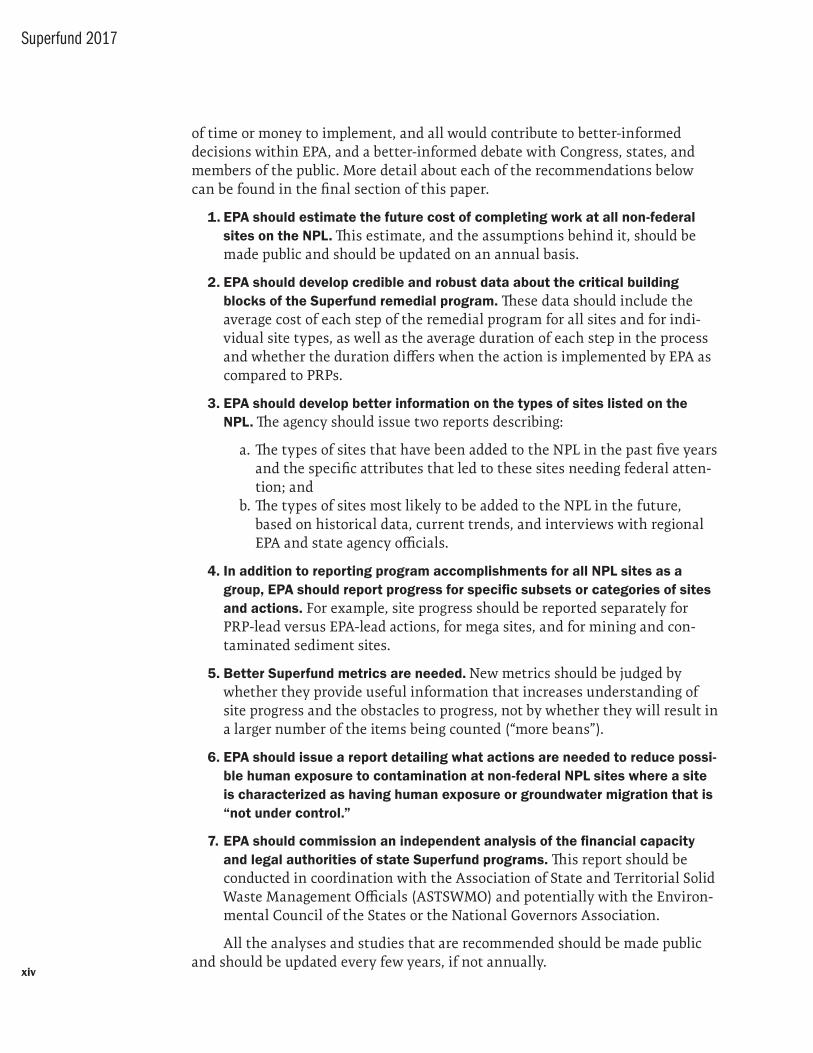
of time or money to implement, and all would contribute to better-informed decisions within EPA, and a better-informed debate with Congress, states, and members of the public. More detail about each of the recommendations below can be found in the final section of this paper.
1. EPA should estimate the future cost of completing work at all non-federal sites on the NPL. This estimate, and the assumptions behind it, should be made public and should be updated on an annual basis.
2. EPA should develop credible and robust data about the critical building blocks of the Superfund remedial program. These data should include the average cost of each step of the remedial program for all sites and for indi-vidual site types, as well as the average duration of each step in the process and whether the duration differs when the action is implemented by EPA as compared to PRPs.
3. EPA should develop better information on the types of sites listed on the NPL. The agency should issue two reports describing:
a. The types of sites that have been added to the NPL in the past five years and the specific attributes that led to these sites needing federal atten-tion; and
b. The types of sites most likely to be added to the NPL in the future, based on historical data, current trends, and interviews with regional EPA and state agency officials.
4. In addition to reporting program accomplishments for all NPL sites as a group, EPA should report progress for specific subsets or categories of sites and actions. For example, site progress should be reported separately for PRP-lead versus EPA-lead actions, for mega sites, and for mining and con-taminated sediment sites.
5. Better Superfund metrics are needed. New metrics should be judged by whether they provide useful information that increases understanding of site progress and the obstacles to progress, not by whether they will result in a larger number of the items being counted (“more beans”).
6. EPA should issue a report detailing what actions are needed to reduce possi-ble human exposure to contamination at non-federal NPL sites where a site is characterized as having human exposure or groundwater migration that is “not under control.”
7. EPA should commission an independent analysis of the financial capacity and legal authorities of state Superfund programs. This report should be conducted in coordination with the Association of State and Territorial Solid Waste Management Officials (ASTSWMO) and potentially with the Environ-mental Council of the States or the National Governors Association.
All the analyses and studies that are recommended should be made public and should be updated every few years, if not annually.
1
Introduction
The Comprehensive Environmental Response, Compensation, and Liability Act (CERCLA), better known as “Superfund,” is now in its 37th year. It was signed into law by President Jimmy Carter on December 11, 1980.1 The goal of the act was to provide funding and authority for the U.S. Environmental Protection Agency (EPA) to clean up sites contaminated with hazardous substances. The law created a two-pronged approach to site cleanup. First, CERCLA created a powerful liability scheme to compel former and current owners and operators of contaminated sites (the “potentially responsible parties” or PRPs) to pay for and clean up sites themselves. Second, it created a designated trust fund to pay for site studies and cleanups where responsible parties could not, or would not, perform the work themselves. Authorization for the taxes that were the primary source of revenue for the trust fund expired at the end of 1995; since FY 2004, the vast majority of annual appropriations for the program has come from general revenues.2 Federal funds may be used to pay for remedial actions (typically referred to as “cleanups”) only at sites that are placed on EPA’s National Priorities List (NPL).
At the start of a new presidential administration it is timely, once again, to review the progress of that part of the Superfund program aimed at cleaning up sites on the NPL — the remedial program. The purpose of this paper is to provide information on the overall progress of the remedial program, looking at both the number and types of sites added to the NPL since FY 2000 as well as at key mea-sures of program success. Information on program funding for the past 17 years is also included, as one of the questions that has plagued the program for many years is whether Congress is appropriating adequate funds to ensure the timely cleanup of NPL sites. This paper focuses on the cleanup of sites on the NPL that are not owned or operated by federal agencies (referred to as “non-federal” NPL sites) from FY 2000 through FY 2016.3
1. CERCLA was amended by the Superfund Amendments and Reauthorization Act in 1986.
2. After the funds are appropriated to EPA, no distinction is made between “trust fund monies”
and “general revenues.” Funds deposited in the Superfund Trust Fund include fines, penalties, cost
recoveries from responsible parties, and interest accrued on the balance of the fund. In FY 2016,
74% of the annual appropriation of $1.09 billion came from general revenues and 26% came from
the Trust Fund.
3. Federal facilities are sites that are owned or operated by a federal agency, such as the De-
partment of Energy or Department of Defense. Cleanups at these sites are implemented and paid
2
Superfund 2017
The paper is organized into the following sections:
• Superfund Remedial Program Overview• Superfund Snapshot: Status of Non-Federal NPL Sites at the End of FY 2016• Trends in NPL Listing• Cleanup Progress Over Time• Funding Over Time• Conclusions and Recommendations
Where relevant, the paper includes a comparison between actual EPA data and estimated future funding needs and program accomplishments that were forecast in Resources for the Future (RFF) report, Superfund’s Future: What Will It Cost? A Report to Congress, which was issued in 2001.4 This report was requested as part of the conference report that accompanied the FY 2000 Departments of Veterans Affairs and Housing and Urban Development, and Independent Agencies appropriations bill. The request asked the authors to estimate the amount of mon-ey EPA would need in order to implement the Superfund program for the 10 years from FY 2000 through FY 2009. As part of that work, the authors estimated annual total program costs, annual costs of actions taken by EPA at non-federal NPL sites, and the number of sites where the construction of the remedy would be complet-ed each year. These estimates provide a useful point of comparison to EPA’s actual accomplishments and funding over the same time period. The author of this paper was the lead author and project director of Superfund’s Future.
A few aspects about the approach taken in this paper are worth noting:
• All data on the program are as of the end of FY 2016 unless otherwise noted; actions implemented since then are not included.
• All data are for non-federal final and deleted NPL sites; data on federal facil-ities, proposed NPL sites, and Superfund alternative sites are not included.
• All data on the program were either provided by EPA (the Superfund pro-gram), obtained from the EPA website, or are from published documents.
• All appropriations, budget, and cost data have been converted to 2016 constant dollars, for ease of comparison, unless otherwise noted.5
Due to time and resource constraints, three important elements of the Super-fund program are not addressed:
for by the agency responsible. The costs of remediating these sites are not part of the EPA Superfund
budget, nor part of Congressional appropriations to EPA. The cost of EPA oversight of federal facility
cleanups does come out of EPA appropriations.
4. Probst et al., Superfund’s Future: What Will It Cost? A Report to Congress (Washington, DC:
Resources for the Future, 2001).
5. The GDP deflator was used to convert 1999 through 2015 nominal dollars to constant 2016
dollars; see https://www.bea.gov/index.htm. Appendix A includes a table of the deflators used for each
year.
Cleanup Accomplishments and the Challenges Ahead
3
1. The removal program, which allows EPA to address imminent threats by, for example, providing alternative drinking water, removing leaking bar-rels, or fencing off a site;6
2. The enforcement program, whereby EPA enters into a settlement agree-ment with PRPs who agree to pay for and implement site cleanup activ-ities themselves, and also seeks to compel recalcitrant parties to pay for their share of cleanup costs; and
3. The role of state and tribal governments in NPL cleanups.
Superfund Remedial Program Overview
The NPL is the list of sites where federal funds may be used to pay for reme-dial actions or what are referred to colloquially as long-term cleanups. The NPL has become synonymous with those sites that are the highest priority for cleanup in the country — contaminated areas warranting federal attention either for fed-eral enforcement action, federal funding, or both. Since the beginning of FY 2001, EPA and state agencies have investigated more than 18,000 non-federal sites to assess whether they needed to be addressed either by states or by EPA.7 At the end of FY 2016, there were 1,555 final and deleted non-federal sites on the NPL.8
Sites placed on the NPL are quite diverse in terms of industrial operations, historic uses, average cleanup cost, and who pays for cleanup. The types of sites commonly found on the NPL include: chemical manufacturing, metal fabrication, mining, wood preserving operations, as well as commercial and on-site recycling and waste management facilities, among others. Not surprisingly, the types of non-federal sites added to the NPL has changed over time. In the early years of the program, the largest category of sites on the NPL was waste management sites. Since then, manufacturing sites have become the largest single category. Very few mining sites were placed on the NPL before FY 2000. Some sites are defined more by the media that is contaminated — such as sediments or ground-water — than by the industrial operation, disposal practices, or other conditions that caused the contamination.
NPL sites are typically divided into multiple projects, referred to as oper-able units (OUs), and most sites have more than one OU. Each OU at a site goes through the same process, referred to as the remedial pipeline: site study (the remedial investigation/feasibility study); remedial design; remedial action; and,
6. Removal actions are generally of shorter duration and lower cost than remedial actions,
although this is not always the case. Many sites on the NPL are subject to removal actions before
a longer-term remedial cleanup is implemented. Sites do not need to be on the NPL to obtain
federally-funded removal actions
7. Data provided by U.S. EPA. The overwhelming majority of the sites assessed did not warrant
any kind of federal action.
8. A small number of sites not on the NPL are addressed by EPA under the “Superfund
Alternative” approach.
4
Superfund 2017
if needed, long-term response action (which is often groundwater pump and treat) as well as operation and maintenance activities. Many NPL sites have more than one OU, and thus most sites go through the remedial pipeline more than once. Only when all remedial actions at a site have been fully implemented is a site declared “construction complete,” which is one of the two major progress milestones for NPL sites. “Construction complete” means that all remedies at the site have been constructed. The second major milestone occurs when a site is formally deleted from the NPL.9 A site can only be deleted from the NPL when all the remedies have been constructed and all the cleanup objectives at the site have been achieved — a much more challenging metric.
The total time to reach the construction complete phase is a lengthy process. According to a 2009 U. S. Government Accountability Office (GAO) report, the median length of time from when a site was proposed to the NPL to when it was deemed construction complete was 10 years for all sites, and almost 15 years for sites with more expensive cleanups.10 It is worth noting that there are several sites that were added to the NPL in 1983, with the first set of sites listed, that are yet to achieve construction complete status. Many sites require long-term operation and maintenance after the final remedy is constructed, and it could be decades before the cleanup objectives for a site are reached and it can then be deleted from the NPL. There may, in fact, be some sites with such intractable contamination that they may never be taken off the NPL, or at least, not for many decades.
Site investigations and cleanups can be implemented either by EPA or by potentially responsible parties, referred to as PRPs, or by a combination of the two. Typically, but not always, the party that is implementing the activity is the same party that is paying for it. At any individual site, some steps in the process might be implemented and/or paid for by EPA, and other steps by PRPs. The lead for remedial program activities can — and sometimes does — go back and forth between EPA and responsible parties. While information on the cost of EPA site studies and cleanups has been made public by EPA and in independent published reports, responsible parties are not required to disclose their costs at NPL sites and there is little publicly available information on the actual cost of PRP-lead actions. Thus, all information on the average cost of site cleanups is based on the cost of EPA activities.11 Who pays for each stage of the remedial process at NPL sites determines how much money is needed for EPA’s remedial program. If, for example, more of the sites added to the NPL are truly orphan sites — where the responsible parties either cannot be found or are not financially viable — then a larger share of cleanup costs will be borne by EPA; by the same token, if more sites
9. In some cases, EPA may designate a site as a “partial deletion” when a part of the site or
operable unit at a site is deleted but the entire site is not deleted.
10. GAO, Superfund: Litigation Has Decreased and EPA Needs Better Information on Site Cleanup
and Cost Issues to Estimate Future Program Funding Requirements, GAO-09-656, “Table 15, Construction
Complete Nonfederal NPL by Site Type and Megasite Designation through Fiscal Year 2007,” p. 70.
11. While PRPs sometimes disclose their estimated costs at a specific site, these estimates are
rarely documented, and the information is anecdotal and completely voluntary.
Cleanup Accomplishments and the Challenges Ahead
5
listed on the NPL have financially viable and cooperating PRPs, the burden on EPA will be less.
States also play a role in paying for remedial actions at NPL sites. Under Section 104 of CERCLA, states must contribute 10% of the cost of remedial actions paid for by EPA at non-federal NPL sites within their borders. States are also responsible for 100% of the operations and maintenance costs at these sites. As more and more NPL sites enter the remedial action stage, states have raised concerns about their ability to finance their share of cleanup and long-term operations and maintenance costs.
Cleanup costs vary widely depending on the type of NPL site. Superfund sites are often lumped into two cost categories: “mega sites,” that is, sites with expected total cleanup costs of $50 million or more, and “non-mega” sites. According to Superfund’s Future, the average cost to clean up a mega site on the NPL was approximately $140 million ($195 million in constant 2016 dollars), more than ten times the average cost of a non-mega site, which had an average cleanup cost of $12 million ($17 million in 2016 dollars).12 Unfortunately, more recent information on average site cleanup costs is not available.
Mining sites and contaminated sediment sites are generally considered among the most expensive to address due to the nature and extent of the contam-ination. Contamination at these kinds of sites is often measured in square miles rather than acres, and there can be hundreds of thousands of cubic yards of con-taminated media. As an example, Tar Creek, a mining site in Oklahoma added to the NPL in 1983, is 40 square miles. The site has extensive lead contamination and has already cost EPA and the state of Oklahoma over $300 million.13 Another very expensive site is the Hudson River PCB site in New York, where General Electric has spent over $1.5 billion on the project, and the work is not yet complete.14 Most cleanups do not cost hundreds of millions of dollars, but when these costs are borne by EPA, this becomes a huge drain on limited federal cleanup funds.
12. Superfund’s Future, page xxv of the Executive Summary. This appears to be the most recent
public information on the cost of cleanup for specific site types on a site basis. Data included in the
Superfund: Litigation Has Decreased and EPA Needs Better Information on Site Cleanup and Cost Issues
to Estimate Future Program Funding Requirements, GAO-09-656, are not average site cleanup costs as
total expenditures for all sites are averaged over the total number of sites, regardless of whether they
are EPA- or PRP-lead.
13. “$10 million Tar Creek settlement proposed,” available online at http://www.tulsaworld.
com/homepagelatest/million-tar-creek-settlement-proposed/article_107629cb-4f3c-5d6a-8a56-
0af354d99433.html and “NPL Site Narrative for Tar Creek (Ottawa County),” available online at
https://semspub.epa.gov/work/06/300355.pdf.
14. See “Hudson River PCBs Superfund Site,” available online at
https://www.epa.gov/superfund/superfund-35th-anniversary-region-2#hudson.
6
Superfund 2017
Superfund Snapshot: Status of Non-Federal NPL Sites at the End of FY 2016
From the inception of the Superfund program through the end of FY 2016, EPA has placed 1,555 non-federal sites on the NPL.15
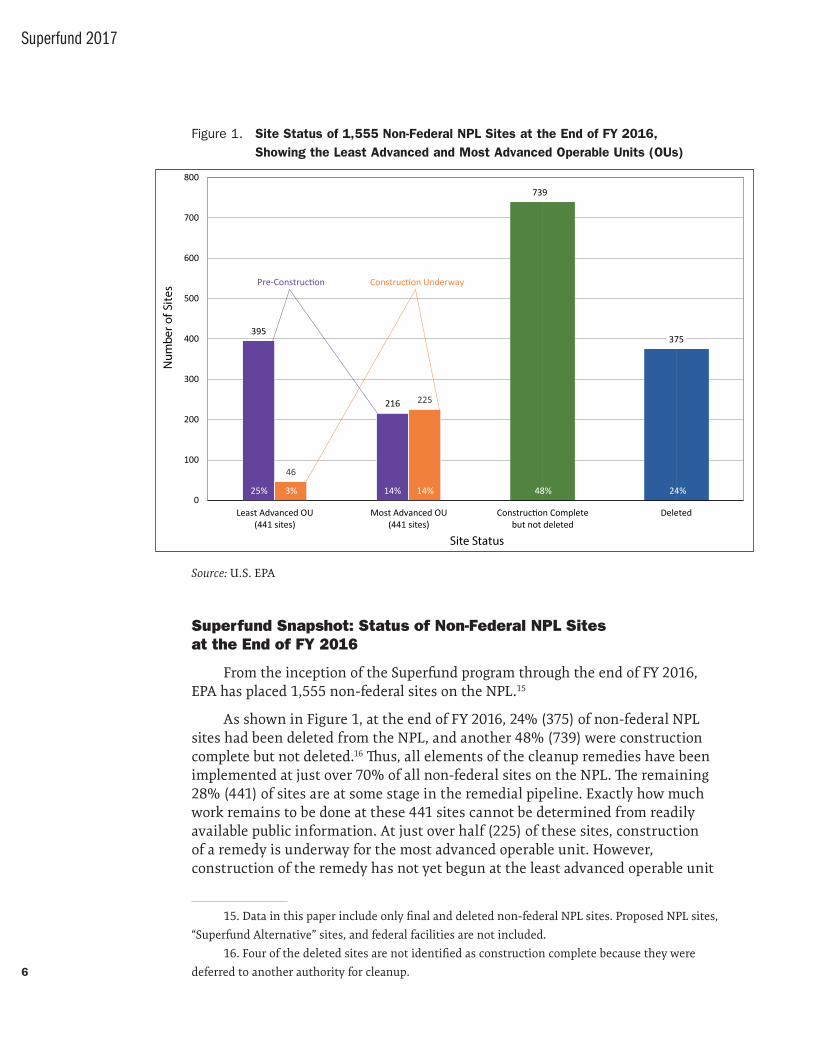
As shown in Figure 1, at the end of FY 2016, 24% (375) of non- federal NPL sites had been deleted from the NPL, and another 48% (739) were construction complete but not deleted.16 Thus, all elements of the cleanup remedies have been implemented at just over 70% of all non-federal sites on the NPL. The remaining 28% (441) of sites are at some stage in the remedial pipeline. Exactly how much work remains to be done at these 441 sites cannot be determined from readily available public information. At just over half (225) of these sites, construction of a remedy is underway for the most advanced operable unit. However, construction of the remedy has not yet begun at the least advanced operable unit
15. Data in this paper include only final and deleted non-federal NPL sites. Proposed NPL sites,
“Superfund Alternative” sites, and federal facilities are not included.
16. Four of the deleted sites are not identified as construction complete because they were
deferred to another authority for cleanup.
Figure 1. Site Status of 1,555 Non-Federal NPL Sites at the End of FY 2016, Showing the Least Advanced and Most Advanced Operable Units (OUs)
395
216
739
375
46
225
0
100
200
300
400
500
600
700
800
Least Advanced OU(441 sites)
Most Advanced OU(441 sites)
Construction Completebut not deleted
Deleted
Num
ber o
f Site
s
Site Status
Pre-Construction Construction Underway
25% 14% 48%3% 24%14%
Source: U.S. EPA
Cleanup Accomplishments and the Challenges Ahead
7
of 90% (395) of these sites. Thus, there are many sites that will require additional site studies and cleanup in the years to come.
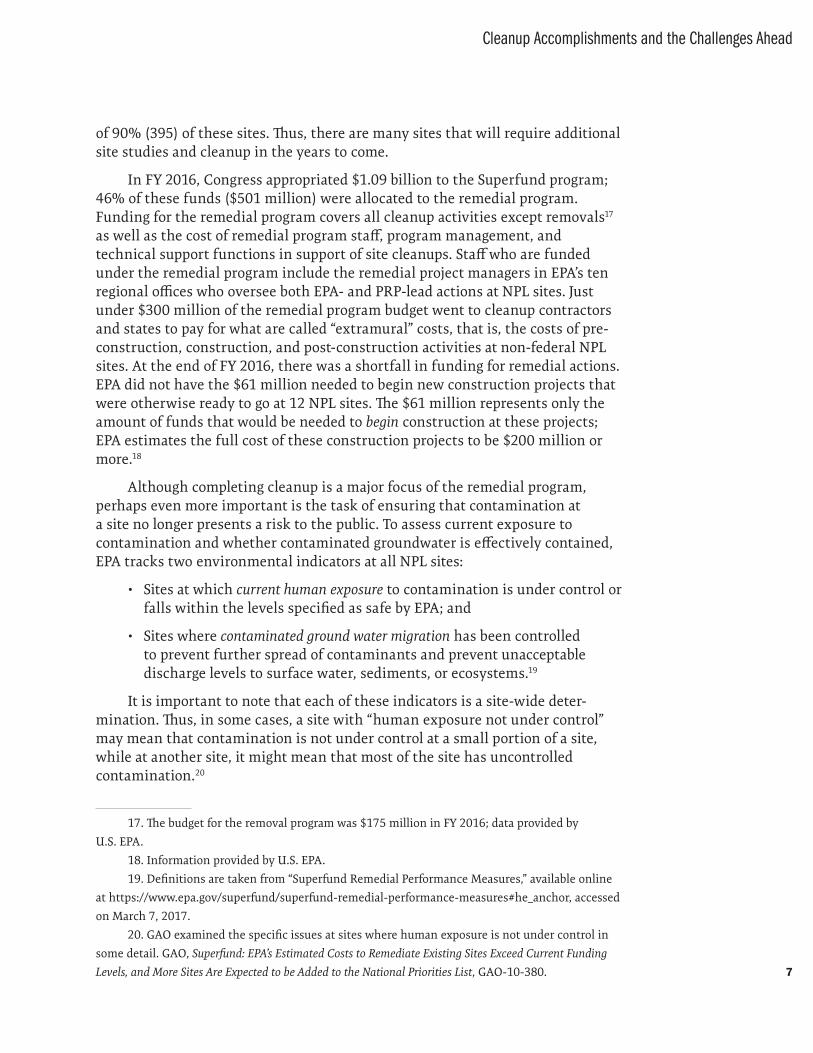
In FY 2016, Congress appropriated $1.09 billion to the Superfund program; 46% of these funds ($501 million) were allocated to the remedial program. Funding for the remedial program covers all cleanup activities except removals17 as well as the cost of remedial program staff, program management, and technical support functions in support of site cleanups. Staff who are funded under the remedial program include the remedial project managers in EPA’s ten regional offices who oversee both EPA- and PRP-lead actions at NPL sites. Just under $300 million of the remedial program budget went to cleanup contractors and states to pay for what are called “extramural” costs, that is, the costs of pre-construction, construction, and post-construction activities at non-federal NPL sites. At the end of FY 2016, there was a shortfall in funding for remedial actions. EPA did not have the $61 million needed to begin new construction projects that were otherwise ready to go at 12 NPL sites. The $61 million represents only the amount of funds that would be needed to begin construction at these projects; EPA estimates the full cost of these construction projects to be $200 million or more.18
Although completing cleanup is a major focus of the remedial program, perhaps even more important is the task of ensuring that contamination at a site no longer presents a risk to the public. To assess current exposure to contamination and whether contaminated groundwater is effectively contained, EPA tracks two environmental indicators at all NPL sites:
• Sites at which current human exposure to contamination is under control or falls within the levels specified as safe by EPA; and
• Sites where contaminated ground water migration has been controlled to prevent further spread of contaminants and prevent unacceptable discharge levels to surface water, sediments, or ecosystems.19
It is important to note that each of these indicators is a site-wide deter-mination. Thus, in some cases, a site with “human exposure not under control” may mean that contamination is not under control at a small portion of a site, while at another site, it might mean that most of the site has uncontrolled contamination.20
17. The budget for the removal program was $175 million in FY 2016; data provided by
U.S. EPA.
18. Information provided by U.S. EPA.
19. Definitions are taken from “Superfund Remedial Performance Measures,” available online
at https://www.epa.gov/superfund/superfund-remedial-performance-measures#he_anchor, accessed
on March 7, 2017.
20. GAO examined the specific issues at sites where human exposure is not under control in
some detail. GAO, Superfund: EPA’s Estimated Costs to Remediate Existing Sites Exceed Current Funding
Levels, and More Sites Are Expected to be Added to the National Priorities List, GAO-10-380.
8
Superfund 2017
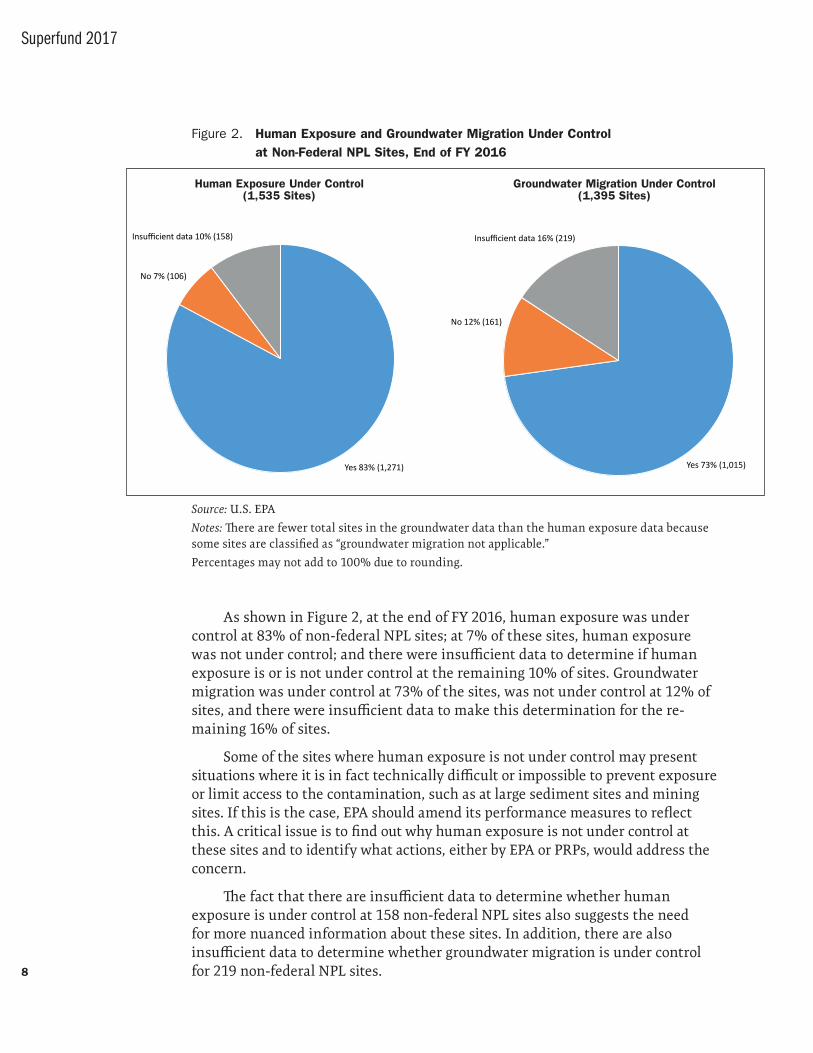
As shown in Figure 2, at the end of FY 2016, human exposure was under control at 83% of non-federal NPL sites; at 7% of these sites, human exposure was not under control; and there were insufficient data to determine if human exposure is or is not under control at the remaining 10% of sites. Groundwater migration was under control at 73% of the sites, was not under control at 12% of sites, and there were insufficient data to make this determination for the re-maining 16% of sites.
Some of the sites where human exposure is not under control may present situations where it is in fact technically difficult or impossible to prevent exposure or limit access to the contamination, such as at large sediment sites and mining sites. If this is the case, EPA should amend its performance measures to reflect this. A critical issue is to find out why human exposure is not under control at these sites and to identify what actions, either by EPA or PRPs, would address the concern.
The fact that there are insufficient data to determine whether human exposure is under control at 158 non-federal NPL sites also suggests the need for more nuanced information about these sites. In addition, there are also insufficient data to determine whether groundwater migration is under control for 219 non-federal NPL sites.
Figure 2. Human Exposure and Groundwater Migration Under Control at Non-Federal NPL Sites, End of FY 2016
Human Exposure Under Control (1,535 Sites)
Groundwater Migration Under Control (1,395 Sites)
Yes 83% (1,271)
No 7% (106)
Insufficient data 10% (158)
Yes 73% (1,015)
No 12% (161)
Insufficient data 16% (219)
Source: U.S. EPA
Notes: There are fewer total sites in the groundwater data than the human exposure data because some sites are classified as “groundwater migration not applicable.”
Percentages may not add to 100% due to rounding.
Cleanup Accomplishments and the Challenges Ahead
9
Trends in NPL Listing
One of the most important indicators of the need for the Superfund program—and a key determinant of future funding requirements — is the number of sites that are added to the NPL annually. EPA has a statutory requirement to revise the NPL at least once each year.21 The decision to add a site to the NPL is usually made jointly by EPA and the state or tribal government in which a site is located. Although there are specific criteria for NPL eligibility that are articulated in EPA regulations,22 the decision to list a site (or not) is completely at EPA’s discretion and the Agency has wide latitude in this matter. Thus, there is no objective way to determine whether the “right” number of sites are being added to the NPL or not.
Most states now have robust state cleanup programs. As a result, sites listed on the NPL tend to fall into one or more of the following categories: the site is compli-cated from a technical standpoint, cleanup is expected to be expensive, there are no financially viable or cooperating PRPs, the state does not have adequate funds to address the site, the site has recalcitrant PRPs and the state lacks the necessary re-sources and legal authority and seeks federal enforcement, or the site is high profile and has hit the front page of the national newspapers.
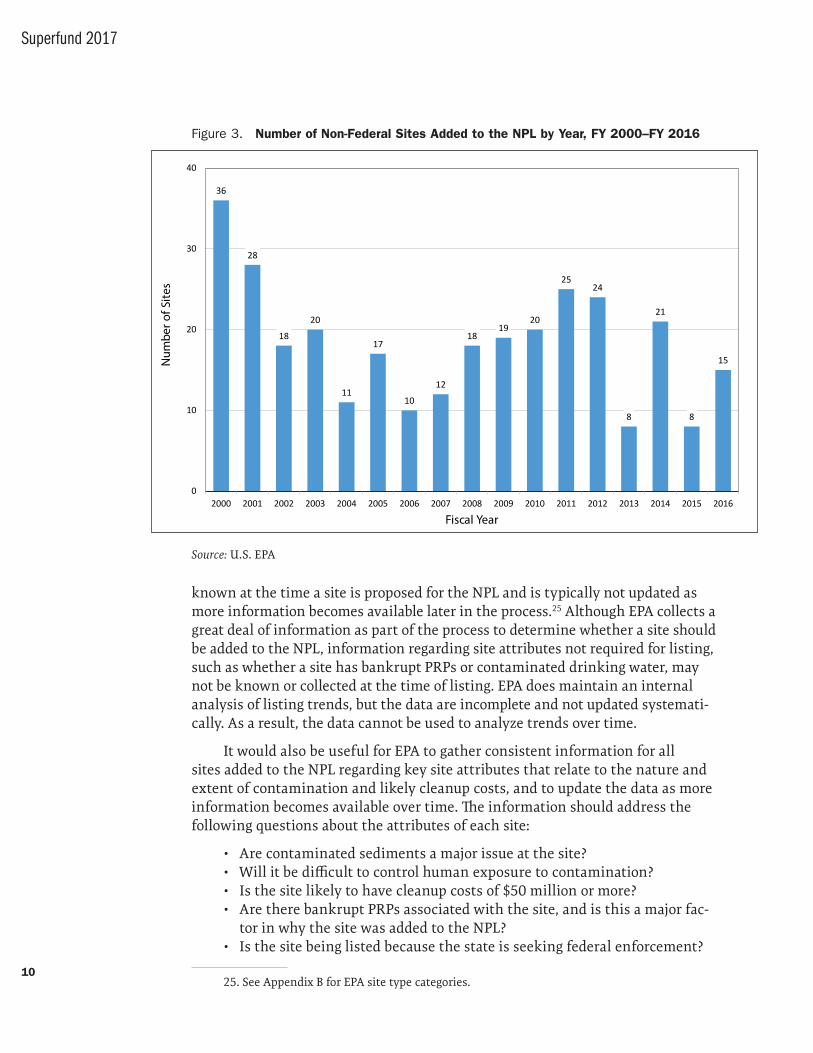
Since FY 2000, a total of 310 non-federal sites have been added to the NPL, an average of 18 per year. As shown in Figure 3 (next page), over the past 17 years the number of non-federal sites added to the NPL has ranged from a low of eight in FY 2013 and FY 2015 to a high of 36 in FY 2000. As part of the work that was conducted to estimate future EPA funding needs in Superfund’s Future, the authors of that report interviewed the Superfund division directors in all ten EPA regional offices and Superfund officials in nine states to help inform estimates of the likely number of sites to be added to the NPL from FY 2000 though FY 2009.23 Based on these interviews, as well as by looking at then-recent listing trends, the authors estimated that EPA was likely to list an average of from 23 (low case) to 49 (high case) non-federal NPL sites per year from FY 2001 through FY 2009.24 The actual number of non-federal sites added to the NPL in FY 2000 was known (it was 36). The “base case” estimate assumed that 35 new non-federal sites would be added each year from FY 2001 through FY 2009. In fact, an average of only 17 new NPL sites were added per year over this time period. Thus, actual listings were significantly lower than the estimated “low case.” The authors also concluded that future sites to be added were likely to be more expensive and more complicated to clean up than sites listed in the past, as many states had by this time developed their own state Superfund programs that could address the less difficult or expensive sites.
A more nuanced and robust description of what kinds of sites have been added to the NPL, and why, would be very useful for understanding the program’s likely future scope and funding needs. EPA information on site types is based on what is
21. See Section 105(a)(8)(B) of CERCLA.
22. 40 CFR 300.425.23. See Superfund’s Future, Chapter 5 and Appendix E.
24. See Superfund’s Future, p. 105, Table 5-4.
10
Superfund 2017
known at the time a site is proposed for the NPL and is typically not updated as more information becomes available later in the process.25 Although EPA collects a great deal of information as part of the process to determine whether a site should be added to the NPL, information regarding site attributes not required for listing, such as whether a site has bankrupt PRPs or contaminated drinking water, may not be known or collected at the time of listing. EPA does maintain an internal analysis of listing trends, but the data are incomplete and not updated systemati-cally. As a result, the data cannot be used to analyze trends over time.
It would also be useful for EPA to gather consistent information for all sites added to the NPL regarding key site attributes that relate to the nature and extent of contamination and likely cleanup costs, and to update the data as more information becomes available over time. The information should address the following questions about the attributes of each site:
• Are contaminated sediments a major issue at the site?• Will it be difficult to control human exposure to contamination?• Is the site likely to have cleanup costs of $50 million or more?• Are there bankrupt PRPs associated with the site, and is this a major fac-
tor in why the site was added to the NPL?• Is the site being listed because the state is seeking federal enforcement?
25. See Appendix B for EPA site type categories.
Figure 3. Number of Non-Federal Sites Added to the NPL by Year, FY 2000–FY 2016
36
28
18
20
11
17
10
12
1819
20
2524
8
21
8
15
0
10
20
30
40
2000 2001 2002 2003 2004 2005 2006 2007 2008 2009 2010 2011 2012 2013 2014 2015 2016
Num
ber o
f Site
s
Fiscal Year
Source: U.S. EPA
Cleanup Accomplishments and the Challenges Ahead
11
• Is the contamination the result of a gap in another regulatory program?• Is the site being listed because of failed financial assurance under another
program?• Were there any demographic or land-use changes that led to listing?
Consistent information on these types of site attributes would allow EPA, Congress, and the public to have a better understanding of why sites continue to be added to the NPL. Absent this kind of information, it is difficult to paint a clear picture of the types of sites that have been listed in recent years and what fac-tors drove their being added. It would also be helpful if EPA tagged NPL sites that are likely to be designated mega sites early in the process, as these sites typically demand more agency resources, both for cleanup dollars and for EPA program and enforcement staff, than do less costly sites.
According to EPA’s staff, recent NPL listings have included sites with bank-rupt PRPs; changing demographics leading to increasing exposure and risk; failed Resource Conservation and Recovery Act (RCRA) financial assurance; truly orphan sites where the cause of contamination is unknown; sites where a state had the lead for many years but then sought NPL listing when it determined it did not have the necessary funds to complete work at the site; and sites with what is referred to as an “emerging” contaminant, that is, a contaminant that was not previously a concern at NPL sites, such as perfluorooctanoic acid (PFOA). A few examples of sites recently added to the NPL are below.
Argonaut Mine, California — Bankrupt PRPs. A former gold mining oper-ation from the 1850s to 1942, 90 acres of the site were later sold and devel-oped for residential use. The PRPs are bankrupt. There are arsenic, mercury, and lead in soil in the residential area. Some of the residences were built on top of or adjacent to the former mining operations.
Dorado Ground Water Contamination, Puerto Rico — Changing demo-graphics. The site has a contaminated groundwater plume with no iden-tifiable source of the contamination that is affecting a municipal drinking water source for over 100,000 people. The area has seen increasing numbers of residences in recent years. There is no alternative source of drinking water. Contaminants of concern include trichloroethylene (TCE), perchloro-ethylene (PCE or “perc”), and vinyl chloride.
Eldorado Chemical Co., Inc., Texas — Orphan site. The site was oper-ated as a chemical manufacturer of cleaning products from 1978 to 2007, at which point it was abandoned. There are no known or viable PRPs, and there are high concentrations of volatile organic compounds, metals, and cyanide in the aquifer beneath the site that threaten 40 public supply wells serving nearly 1.5 million people.26
26. For brief descriptions of each of these three sites, see the site narratives at “National Prior-
ities List (NPL) Sites—by Site Name,” at https://www.epa.gov/superfund/national-priorities-list-npl-
sites-site-name.
12
Superfund 2017
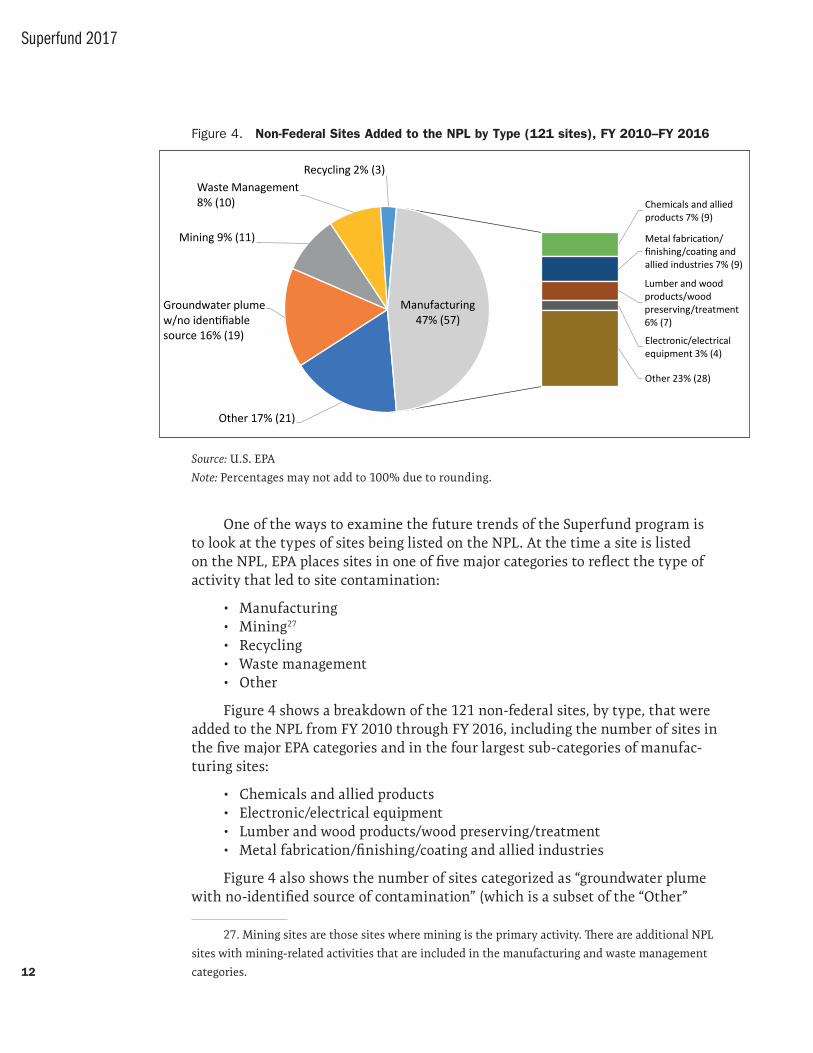
One of the ways to examine the future trends of the Superfund program is to look at the types of sites being listed on the NPL. At the time a site is listed on the NPL, EPA places sites in one of five major categories to reflect the type of activity that led to site contamination:
• Manufacturing• Mining27
• Recycling• Waste management• Other
Figure 4 shows a breakdown of the 121 non-federal sites, by type, that were added to the NPL from FY 2010 through FY 2016, including the number of sites in the five major EPA categories and in the four largest sub-categories of manufac-turing sites:
• Chemicals and allied products• Electronic/electrical equipment• Lumber and wood products/wood preserving/treatment• Metal fabrication/finishing/coating and allied industries
Figure 4 also shows the number of sites categorized as “groundwater plume with no-identified source of contamination” (which is a subset of the “Other”
27. Mining sites are those sites where mining is the primary activity. There are additional NPL
sites with mining-related activities that are included in the manufacturing and waste management
categories.
Figure 4. Non-Federal Sites Added to the NPL by Type (121 sites), FY 2010–FY 2016
Other 17% (21)
Groundwater plume w/no identifiable source 16% (19)
Mining 9% (11)
Waste Management 8% (10)
Recycling 2% (3)
Chemicals and allied products 7% (9)
Metal fabrication/ finishing/coating and allied industries 7% (9)
Lumber and wood products/wood preserving/treatment6% (7)
Electronic/electrical equipment 3% (4)
Other 23% (28)
Manufacturing 47% (57)
Source: U.S. EPA
Note: Percentages may not add to 100% due to rounding.
Cleanup Accomplishments and the Challenges Ahead
13
Figure 5. Number of Non-Federal Sites Added to the NPL by Type: Comparison Over Time
237
407
6581
12
65
205
87
22 30
1
31
65
23 2716
28 32
57
10 193 11
21
0
100
200
300
400
Manufacturing WasteManagement
Groundwater plumew/no identifiable
source
Recycling Mining Multiple and Other
Num
ber o
f Site
s
Site Types
FY83-FY89 (867 sites)
FY90-FY99 (376 sites)
FY00-FY09 (191 sites)
FY10-FY16 (121 sites)
Source: U.S. EPA
Note: Appendix D includes this information presented in percentages.
category noted earlier), as they comprise a relatively large percentage of the 121 sites listed over those seven years. It is important to note that these are not the only sites that have groundwater contamination on the NPL. They were put into a separate category because the source of the contamination was not known at the time of listing, and as a result, they do not fall under any of the other possible site type categories.
Manufacturing sites make up the largest category of sites listed, 47 percent. The next largest category of sites (not including “Other”) are the 16% of sites with a groundwater plume with no identifiable source of contamination. Mining sites are the third largest group, with 11 sites (9%). Mining sites are of particular interest, as these sites are often among the most expensive sites to remediate.28 In addition, some of the most expensive and notorious mining sites on the NPL have bankrupt PRPs, which means that the cleanup costs of these expensive sites are often borne by EPA.
Of the 121 sites added to the NPL over the last seven years, almost half (46%) are in eight states: California, Florida, Illinois, Indiana, New Jersey, New York, North Carolina, and Texas. These states have consistently had the most NPL sites
28. Superfund’s Future, p. 203, Table F-1, and p. 216, Table F-10; and GAO-15-812, p. 24.
14
Superfund 2017
listed within their borders; in fact, six of them were in the “top 10” listing states for the period from October 1996 through February 2000.29
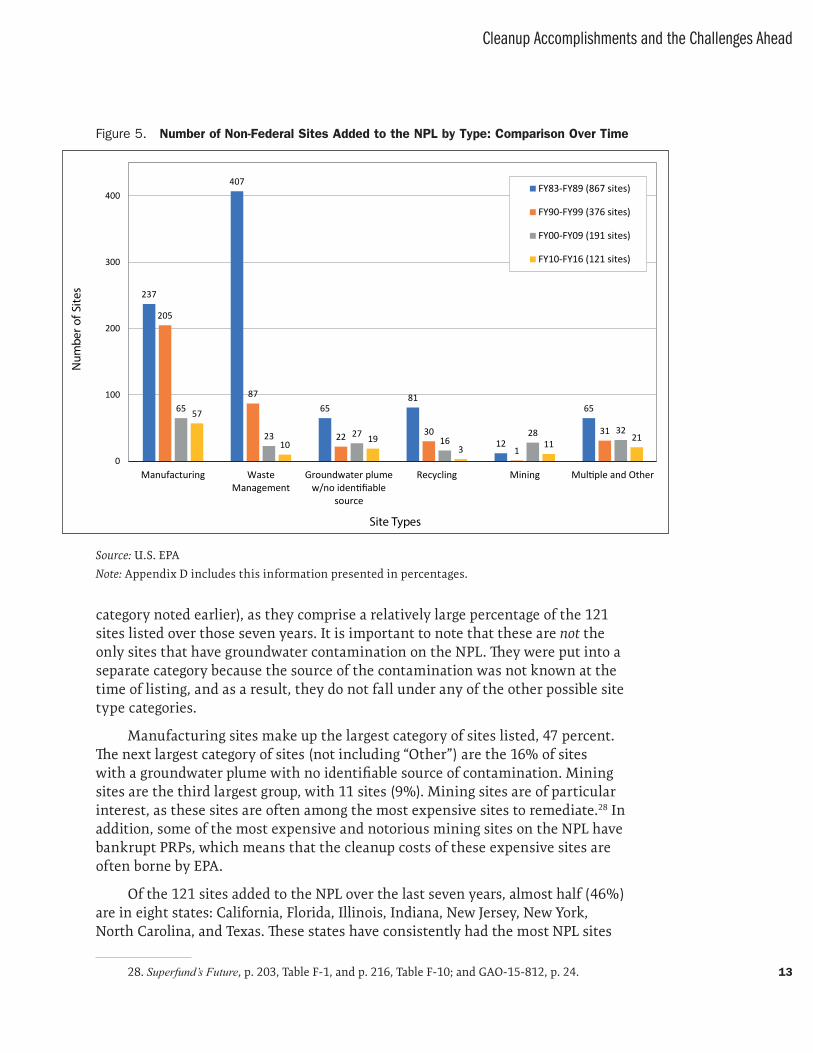
In addition to the types of sites added to the NPL in recent years, it is infor-mative to look at whether the types of sites added to the NPL have changed since the program’s inception and, if so, how? Figure 5 (see page 13) shows the number of sites in each of six categories: the five “major” EPA categories (manufacturing, mining, waste management, recycling, and other) and the subcategory of sites with groundwater plumes from an unknown source of contamination. Sites that qualify for multiple types have been grouped with “Other.”
The first aspect of the data that stands out is the large number of sites (867, or 56%) that were listed before FY 1990. At that time, waste management facilities constituted the largest category of sites added to the NPL, but from FY 1990 on, manufacturing sites were the largest category.30 Mining sites represent a small number of all non-federal NPL sites, and very few mining sites were placed on the NPL prior to FY 2000. Of the 52 mining sites on the NPL at the end of FY 2016, more than half were added during the 10 years from FY 2000–FY 2009.
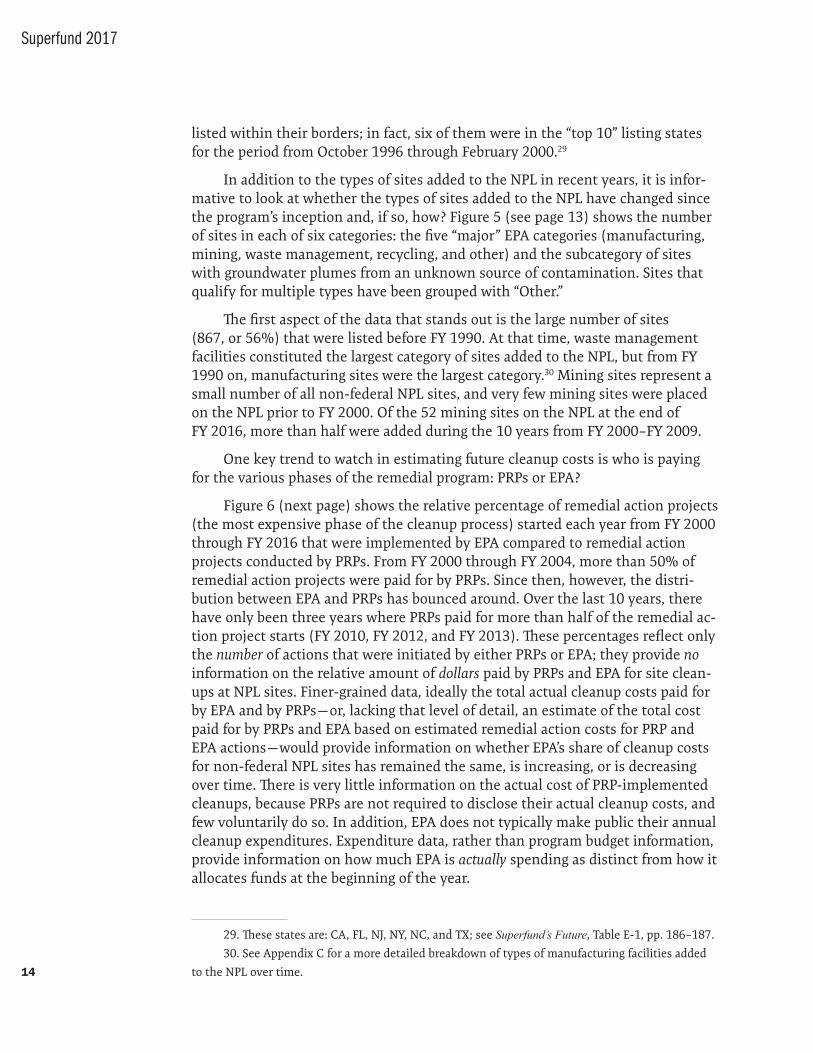
One key trend to watch in estimating future cleanup costs is who is paying for the various phases of the remedial program: PRPs or EPA?
Figure 6 (next page) shows the relative percentage of remedial action projects (the most expensive phase of the cleanup process) started each year from FY 2000 through FY 2016 that were implemented by EPA compared to remedial action projects conducted by PRPs. From FY 2000 through FY 2004, more than 50% of remedial action projects were paid for by PRPs. Since then, however, the distri-bution between EPA and PRPs has bounced around. Over the last 10 years, there have only been three years where PRPs paid for more than half of the remedial ac-tion project starts (FY 2010, FY 2012, and FY 2013). These percentages reflect only the number of actions that were initiated by either PRPs or EPA; they provide no information on the relative amount of dollars paid by PRPs and EPA for site clean-ups at NPL sites. Finer-grained data, ideally the total actual cleanup costs paid for by EPA and by PRPs — or, lacking that level of detail, an estimate of the total cost paid for by PRPs and EPA based on estimated remedial action costs for PRP and EPA actions — would provide information on whether EPA’s share of cleanup costs for non-federal NPL sites has remained the same, is increasing, or is decreasing over time. There is very little information on the actual cost of PRP- implemented cleanups, because PRPs are not required to disclose their actual cleanup costs, and few voluntarily do so. In addition, EPA does not typically make public their annual cleanup expenditures. Expenditure data, rather than program budget information, provide information on how much EPA is actually spending as distinct from how it allocates funds at the beginning of the year.
29. These states are: CA, FL, NJ, NY, NC, and TX; see Superfund’s Future, Table E-1, pp. 186–187.
30. See Appendix C for a more detailed breakdown of types of manufacturing facilities added
to the NPL over time.
Cleanup Accomplishments and the Challenges Ahead
15
Cleanup Progress Over Time
EPA has developed several indicators of site cleanup progress over the course of the Superfund program. The oldest metric of program accomplishments is the number of NPL sites that have been “deleted” from the NPL. According to EPA guidance, a site can be deleted from the NPL when “no further response is re-quired at the site, all cleanup levels have been achieved, and the site is deemed protective of human health and the environment.”31 In the early years of the pro-gram, this was the only measure of cleanup progress. It soon became clear, how-ever, that at some sites it could take years, or even decades, to achieve the clean-up standards called for in the remedy. For this reason, in 1993, EPA established “construction complete” as a new measure of site progress. A site is designated construction complete when the physical construction of all remedies at the site is complete even if all cleanup goals at the site have not been achieved.
31. Close Out Procedures for National Priorities List Sites, OSWER Directive 9320.2-22, p. 8, May
2011, U.S. EPA.
Figure 6. Percentage of Remedial Action Project Starts at Non-Federal NPL Sites that Were PRP and EPA Lead, FY 2000–FY 2016
33% 38% 37% 23% 42% 59% 53% 52% 56% 68% 46% 60% 33% 49% 61% 61% 51%
67% 63% 63% 77% 58% 41% 47% 48% 44% 32% 54% 40% 67% 51% 39% 39% 49%
2000 2001 2002 2003 2004 2005 2006 2007 2008 2009 2010 2011 2012 2013 2014 2015 2016
Fiscal Year
EPA Lead
PRP Lead
100%
50%
50%
100%
75%
25%
25%
75%
Source: U.S. EPA
Note: Remedial actions starts are tracked at the project, not the operable unit, level.
16
Superfund 2017
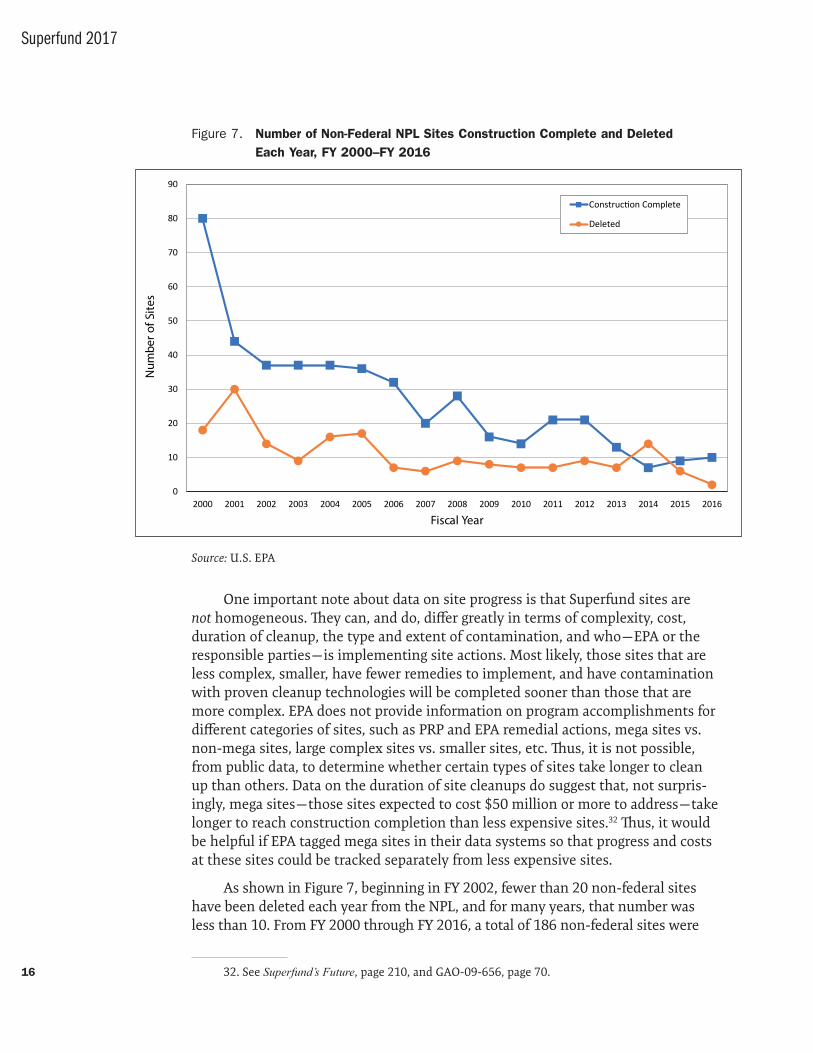
One important note about data on site progress is that Superfund sites are not homogeneous. They can, and do, differ greatly in terms of complexity, cost, duration of cleanup, the type and extent of contamination, and who — EPA or the responsible parties — is implementing site actions. Most likely, those sites that are less complex, smaller, have fewer remedies to implement, and have contamination with proven cleanup technologies will be completed sooner than those that are more complex. EPA does not provide information on program accomplishments for different categories of sites, such as PRP and EPA remedial actions, mega sites vs. non-mega sites, large complex sites vs. smaller sites, etc. Thus, it is not possible, from public data, to determine whether certain types of sites take longer to clean up than others. Data on the duration of site cleanups do suggest that, not surpris-ingly, mega sites — those sites expected to cost $50 million or more to address — take longer to reach construction completion than less expensive sites.32 Thus, it would be helpful if EPA tagged mega sites in their data systems so that progress and costs at these sites could be tracked separately from less expensive sites.
As shown in Figure 7, beginning in FY 2002, fewer than 20 non-federal sites have been deleted each year from the NPL, and for many years, that number was less than 10. From FY 2000 through FY 2016, a total of 186 non-federal sites were
32. See Superfund’s Future, page 210, and GAO-09-656, page 70.
Figure 7. Number of Non-Federal NPL Sites Construction Complete and Deleted Each Year, FY 2000–FY 2016
0
10
20
30
40
50
60
70
80
90
2000 2001 2002 2003 2004 2005 2006 2007 2008 2009 2010 2011 2012 2013 2014 2015 2016
Num
ber o
f Site
s
Fiscal Year
Construction Complete
Deleted
Source: U.S. EPA
Cleanup Accomplishments and the Challenges Ahead
17
deleted from the NPL, an average of 11 deletions each year. Looking at the last five years, from FY 2012 through FY 2016, this average dropped to fewer than eight de-letions each year. Over this same time-period, 76 new non-federal sites were added to the NPL, an average of 15 sites a year. More sites are being added to the NPL each year than are being taken off.
From FY 2000 through FY 2016, a total of 462 non-federal NPL sites reached construction complete status, an average of 27 each year. In the five years FY 2012 through FY 2016, this number dropped by more than half, to an average of 12 sites designated as construction complete each year.
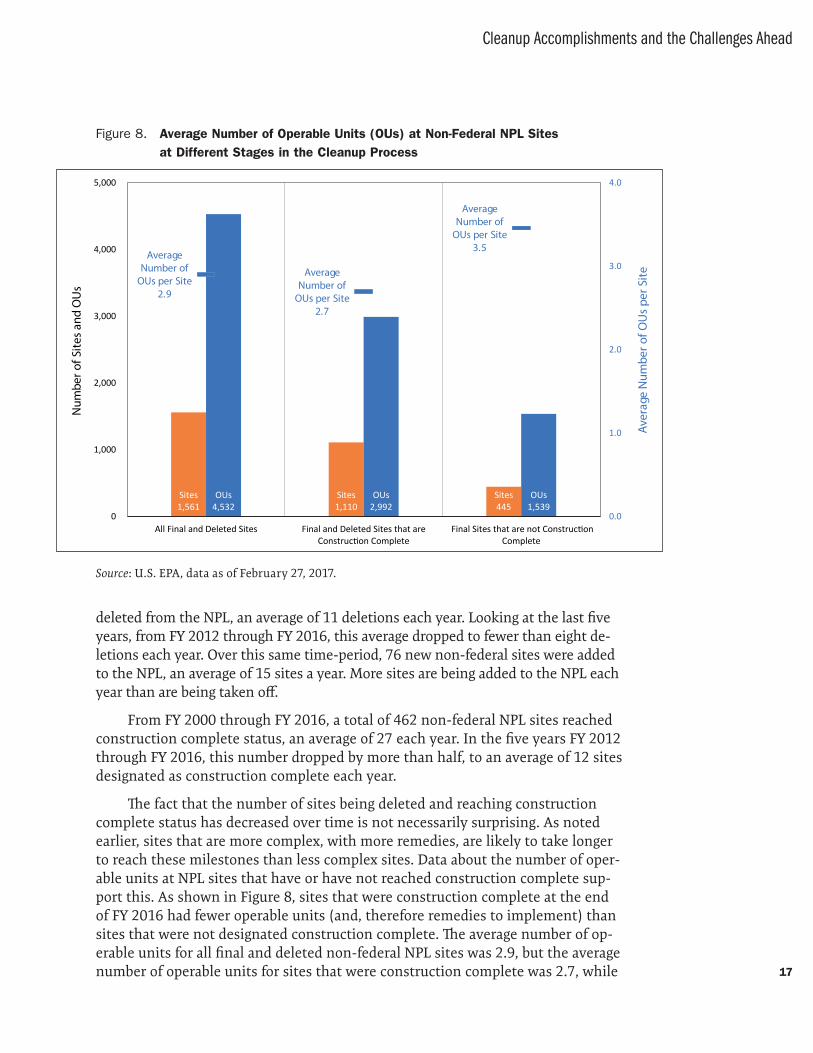
The fact that the number of sites being deleted and reaching construction complete status has decreased over time is not necessarily surprising. As noted earlier, sites that are more complex, with more remedies, are likely to take longer to reach these milestones than less complex sites. Data about the number of oper-able units at NPL sites that have or have not reached construction complete sup-port this. As shown in Figure 8, sites that were construction complete at the end of FY 2016 had fewer operable units (and, therefore remedies to implement) than sites that were not designated construction complete. The average number of op-erable units for all final and deleted non-federal NPL sites was 2.9, but the average number of operable units for sites that were construction complete was 2.7, while
Figure 8. Average Number of Operable Units (OUs) at Non-Federal NPL Sites at Different Stages in the Cleanup Process
Sites1,561
Sites1,110
Sites445
OUs4,532
OUs2,992
OUs1,539
Average Number of
OUs per Site2.9
Average Number of
OUs per Site2.7
Average Number of
OUs per Site3.5
0.0
1.0
2.0
3.0
4.0
0
1,000
2,000
3,000
4,000
5,000
All Final and Deleted Sites Final and Deleted Sites that areConstruction Complete
Final Sites that are not ConstructionComplete
Aver
age
Num
ber o
f OU
s pe
r Site
Num
ber o
f Site
s an
d O
Us
Source: U.S. EPA, data as of February 27, 2017.
18
Superfund 2017
the average for sites that were not yet construction complete was 3.5. That said, it is worth noting that there are sites with only one operable unit that are extremely expensive. For example, the Portland Harbor site in Oregon has only one operable unit and is estimated to have cleanup costs of approximately $1 billion.33
The decreasing number of non-federal NPL sites being deleted and achieving construction complete raises two questions. First, why is this the case? Are the number of sites achieving these progress metrics decreasing because of technical challenges, funding constraints, EPA or PRP inaction, or some other reason? Second, are these, in fact, useful and important measures of program success, or would other metrics — perhaps yet to be developed — provide more useful indicators of both clean-up progress and benefits? These are important issues to address in order to identify ways to make the remedial program more successful and to better track progress.
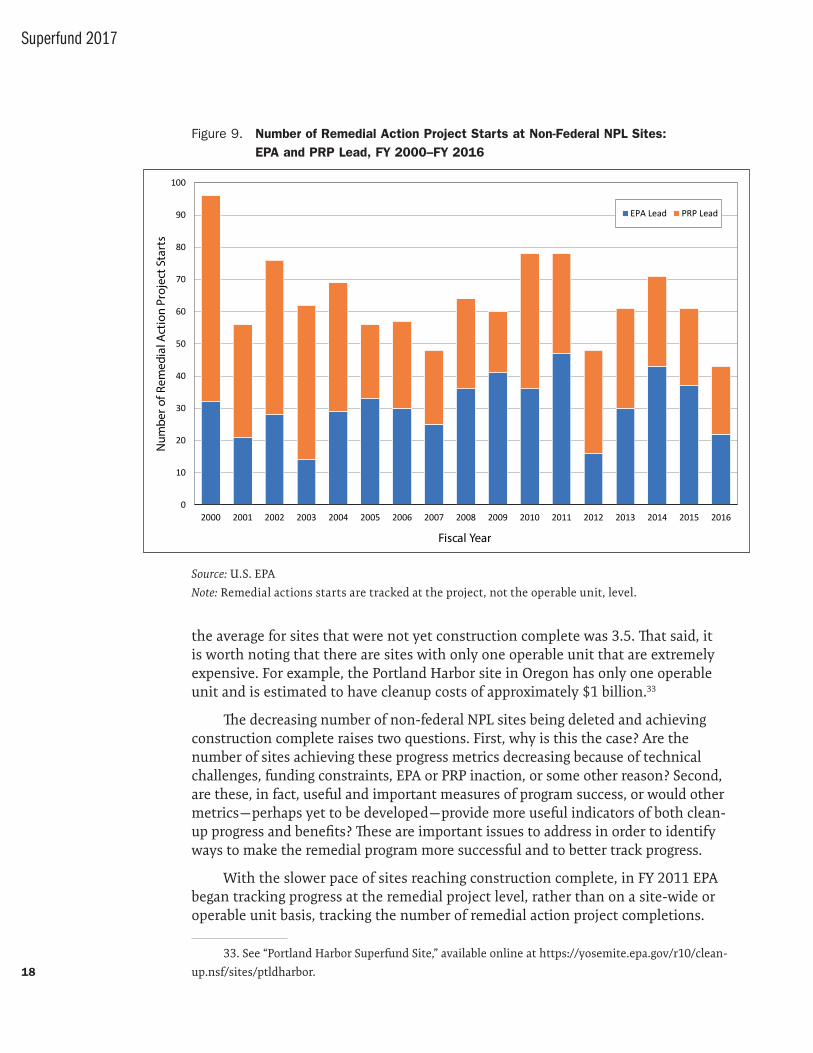
With the slower pace of sites reaching construction complete, in FY 2011 EPA began tracking progress at the remedial project level, rather than on a site-wide or operable unit basis, tracking the number of remedial action project completions.
33. See “Portland Harbor Superfund Site,” available online at https://yosemite.epa.gov/r10/clean-
up.nsf/sites/ptldharbor.
Figure 9. Number of Remedial Action Project Starts at Non-Federal NPL Sites: EPA and PRP Lead, FY 2000–FY 2016
0
10
20
30
40
50
60
70
80
90
100
2000 2001 2002 2003 2004 2005 2006 2007 2008 2009 2010 2011 2012 2013 2014 2015 2016
Num
ber o
f Rem
edia
l Act
ion
Proj
ect S
tart
s
Fiscal Year
EPA Lead PRP Lead
Source: U.S. EPA
Note: Remedial actions starts are tracked at the project, not the operable unit, level.
Cleanup Accomplishments and the Challenges Ahead
19
Sixty-five remedial action projects were completed at non-federal NPL sites in FY 2015, and another 54 were completed in FY 2016. 34 Unfortunately, data for non-federal sites only are not available for prior years, so it is not possible to provide an historical perspective regarding completions.35
Figure 9 (page 18) shows remedial action project starts since FY 2000. The num-ber of remedial action project starts has bounced around, with a high of 96 in FY 2000 and a low of 43 in FY 2016. Over the last five years, an average of 57 remedial action projects were started each year, which is somewhat lower than the average from FY 2000 through FY 2016, when remedial action project starts averaged 64 a year.
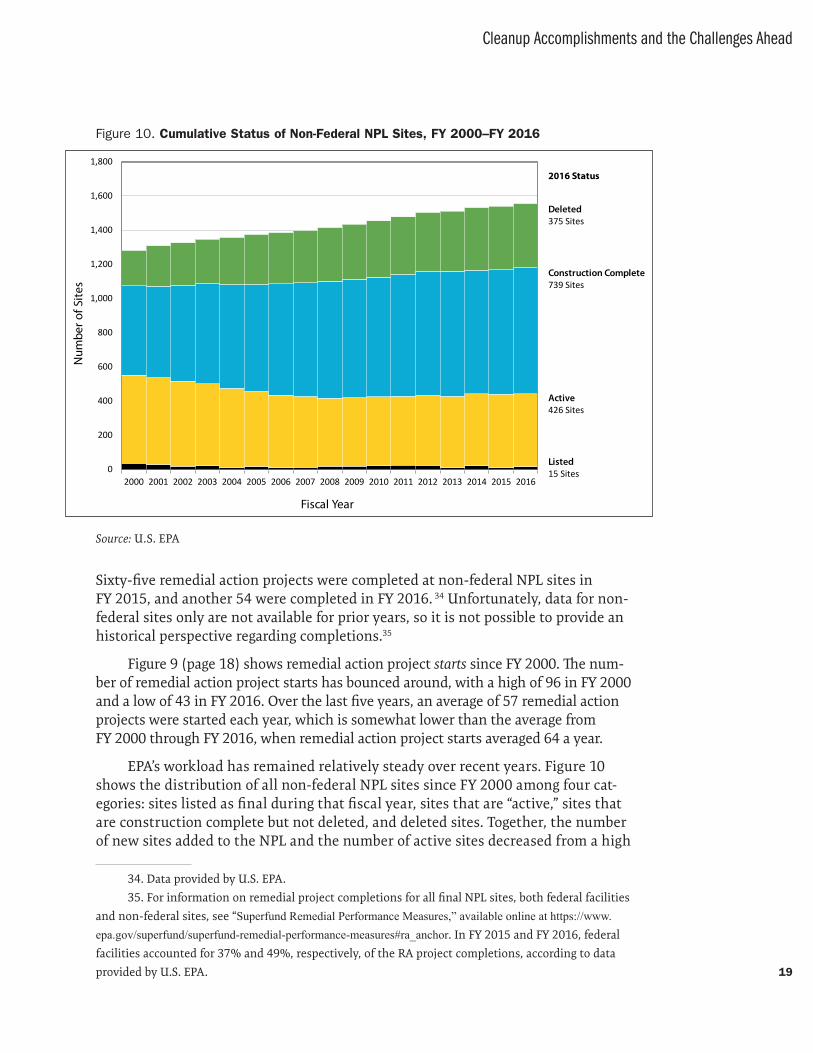
EPA’s workload has remained relatively steady over recent years. Figure 10 shows the distribution of all non-federal NPL sites since FY 2000 among four cat-egories: sites listed as final during that fiscal year, sites that are “active,” sites that are construction complete but not deleted, and deleted sites. Together, the number of new sites added to the NPL and the number of active sites decreased from a high
34. Data provided by U.S. EPA.
35. For information on remedial project completions for all final NPL sites, both federal facilities
and non-federal sites, see “Superfund Remedial Performance Measures,” available online at https://www.epa.gov/superfund/superfund-remedial-performance-measures#ra_anchor. In FY 2015 and FY 2016, federal
facilities accounted for 37% and 49%, respectively, of the RA project completions, according to data
provided by U.S. EPA.
Figure 10. Cumulative Status of Non-Federal NPL Sites, FY 2000–FY 2016
0
200
400
600
800
1,000
1,200
1,400
1,600
1,800
2000 2001 2002 2003 2004 2005 2006 2007 2008 2009 2010 2011 2012 2013 2014 2015 2016
Num
ber o
f Site
s
Fiscal Year
Deleted 375 Sites
Construction Complete739 Sites
Active 426 Sites
Listed 15 Sites
2016 Status
Source: U.S. EPA
20
Superfund 2017
of 552 in FY 2000 to a low of 416 in FY 2008. Over the past five years, the number of sites in these two categories has hovered between 427 and 441 each year. The number of active sites in recent years has remained relatively steady, but more detailed information on the number and cost of future site actions — as well as whether the costs would be borne by EPA or PRPs — would be needed to estimate future funding needs. And it is worth noting that EPA (and PRPs and states) con-tinue to expend staff and other resources on sites that are construction complete as well as on sites that have been deleted.
Funding Over Time
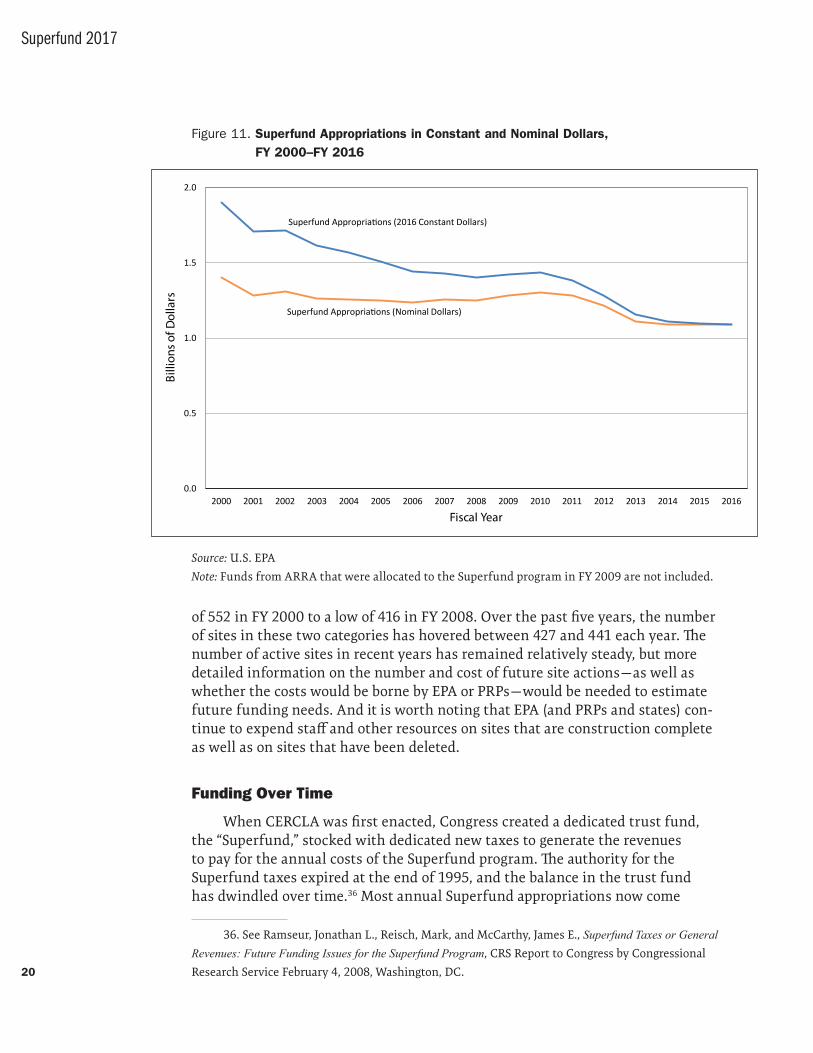
When CERCLA was first enacted, Congress created a dedicated trust fund, the “Superfund,” stocked with dedicated new taxes to generate the revenues to pay for the annual costs of the Superfund program. The authority for the Superfund taxes expired at the end of 1995, and the balance in the trust fund has dwindled over time.36 Most annual Superfund appropriations now come
36. See Ramseur, Jonathan L., Reisch, Mark, and McCarthy, James E., Superfund Taxes or General Revenues: Future Funding Issues for the Superfund Program, CRS Report to Congress by Congressional
Research Service February 4, 2008, Washington, DC.
Figure 11. Superfund Appropriations in Constant and Nominal Dollars, FY 2000–FY 2016
0.0
0.5
1.0
1.5
2.0
2000 2001 2002 2003 2004 2005 2006 2007 2008 2009 2010 2011 2012 2013 2014 2015 2016
Billi
ons o
f Dol
lars
Fiscal Year
Superfund Appropriations (2016 Constant Dollars)
Superfund Appropriations (Nominal Dollars)
Source: U.S. EPA
Note: Funds from ARRA that were allocated to the Superfund program in FY 2009 are not included.
Cleanup Accomplishments and the Challenges Ahead
21
from general revenues, not trust fund monies. Since then, while there have been periodic attempts to reinstate the taxes that stocked the trust fund, no administra-tion — Democratic nor Republican — has made a serious effort to reinstate the Super-fund taxes or some variation of them.
As shown in Figure 11 (previous page), in nominal terms, annual appropria-tions remained relatively steady from FY 2001 through FY 2011, hovering around $1.3 billion for most of these years. In FY 2013, annual appropriations in nominal dollars fell to under $1.2 billion for the first time. In nominal dollars, funding went from a high of $1.4 billion in FY 2000 to a low of $1.09 billion in FY 2014 (and FY 2015 and 2016), a decrease of 22 percent. In real terms the decrease in fund-ing has been much more dramatic: annual funding has been cut over 40 percent. In constant 2016 dollars, appropriations dropped from a high of $1.9 billion in FY 2000 to a low of $1.09 billion in FY 2016, a decrease of 43 percent. In FY 2009, the program received a one-time increase in appropriations of $600 million ($666 million in 2016 dollars) from the American Recovery and Reinvestment Act of 2009 (ARRA), which is not shown in Figure 11.
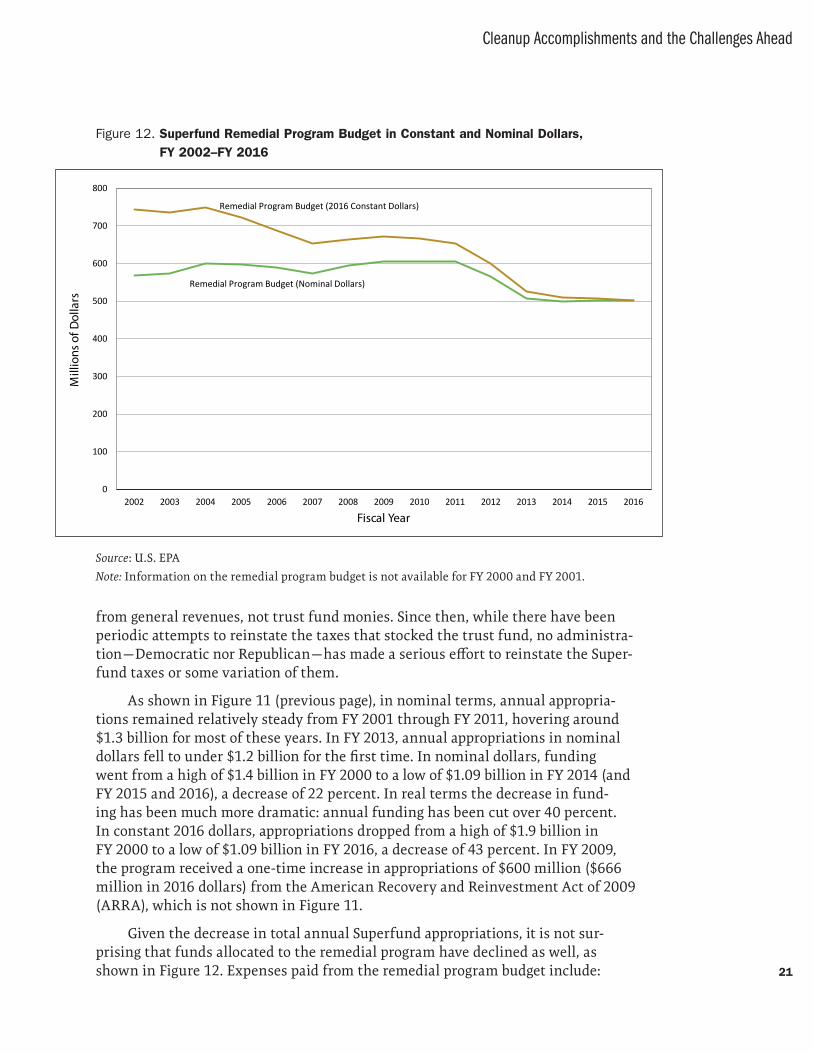
Given the decrease in total annual Superfund appropriations, it is not sur-prising that funds allocated to the remedial program have declined as well, as shown in Figure 12. Expenses paid from the remedial program budget include:
Figure 12. Superfund Remedial Program Budget in Constant and Nominal Dollars, FY 2002–FY 2016
0
100
200
300
400
500
600
700
800
2002 2003 2004 2005 2006 2007 2008 2009 2010 2011 2012 2013 2014 2015 2016
Mill
ions
of D
olla
rs
Fiscal Year
Remedial Program Budget (2016 Constant Dollars)
Remedial Program Budget (Nominal Dollars)
Source: U.S. EPA
Note: Information on the remedial program budget is not available for FY 2000 and FY 2001.
22
Superfund 2017
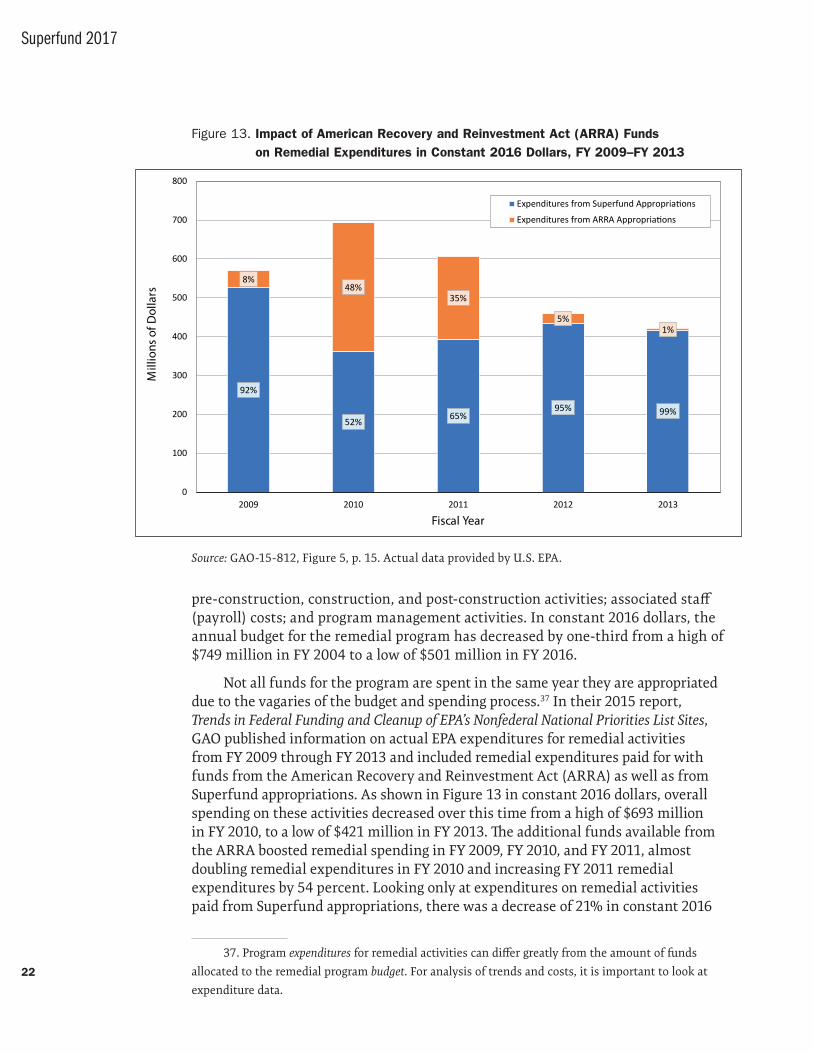
pre- construction, construction, and post-construction activities; associated staff (payroll) costs; and program management activities. In constant 2016 dollars, the annual budget for the remedial program has decreased by one-third from a high of $749 million in FY 2004 to a low of $501 million in FY 2016.
Not all funds for the program are spent in the same year they are appropriated due to the vagaries of the budget and spending process.37 In their 2015 report, Trends in Federal Funding and Cleanup of EPA’s Nonfederal National Priorities List Sites, GAO published information on actual EPA expenditures for remedial activities from FY 2009 through FY 2013 and included remedial expenditures paid for with funds from the American Recovery and Reinvestment Act (ARRA) as well as from Superfund appropriations. As shown in Figure 13 in constant 2016 dollars, overall spending on these activities decreased over this time from a high of $693 million in FY 2010, to a low of $421 million in FY 2013. The additional funds available from the ARRA boosted remedial spending in FY 2009, FY 2010, and FY 2011, almost doubling remedial expenditures in FY 2010 and increasing FY 2011 remedial expenditures by 54 percent. Looking only at expenditures on remedial activities paid from Superfund appropriations, there was a decrease of 21% in constant 2016
37. Program expenditures for remedial activities can differ greatly from the amount of funds
allocated to the remedial program budget. For analysis of trends and costs, it is important to look at
expenditure data.
Figure 13. Impact of American Recovery and Reinvestment Act (ARRA) Funds on Remedial Expenditures in Constant 2016 Dollars, FY 2009–FY 2013
92%
52% 65%95% 99%
8%48%
35%
5%1%
0
100
200
300
400
500
600
700
800
2009 2010 2011 2012 2013
Mill
ions
of D
olla
rs
Fiscal Year
Expenditures from Superfund Appropriations
Expenditures from ARRA Appropriations
Source: GAO-15-812, Figure 5, p. 15. Actual data provided by U.S. EPA.
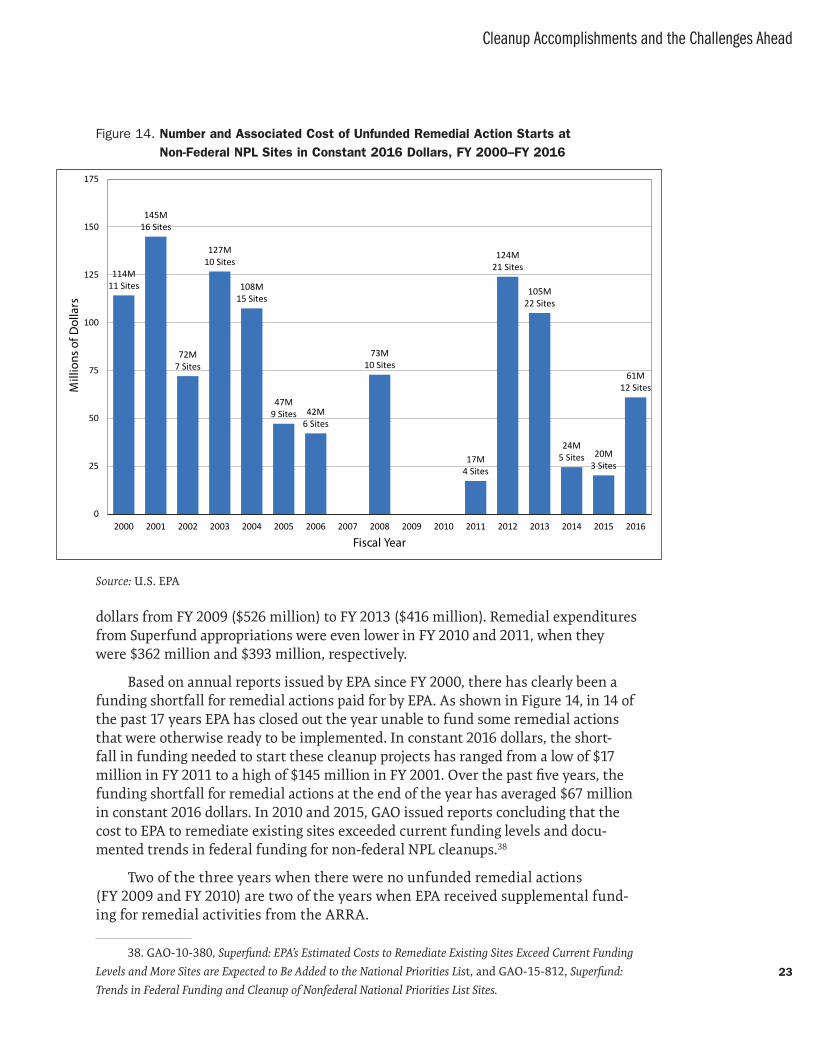
Cleanup Accomplishments and the Challenges Ahead
23
dollars from FY 2009 ($526 million) to FY 2013 ($416 million). Remedial expenditures from Superfund appropriations were even lower in FY 2010 and 2011, when they were $362 million and $393 million, respectively.
Based on annual reports issued by EPA since FY 2000, there has clearly been a funding shortfall for remedial actions paid for by EPA. As shown in Figure 14, in 14 of the past 17 years EPA has closed out the year unable to fund some remedial actions that were otherwise ready to be implemented. In constant 2016 dollars, the short-fall in funding needed to start these cleanup projects has ranged from a low of $17 million in FY 2011 to a high of $145 million in FY 2001. Over the past five years, the funding shortfall for remedial actions at the end of the year has averaged $67 million in constant 2016 dollars. In 2010 and 2015, GAO issued reports concluding that the cost to EPA to remediate existing sites exceeded current funding levels and docu-mented trends in federal funding for non-federal NPL cleanups.38
Two of the three years when there were no unfunded remedial actions (FY 2009 and FY 2010) are two of the years when EPA received supplemental fund-ing for remedial activities from the ARRA.
38. GAO-10-380, Superfund: EPA’s Estimated Costs to Remediate Existing Sites Exceed Current Funding
Levels and More Sites are Expected to Be Added to the National Priorities List, and GAO-15-812, Superfund:
Trends in Federal Funding and Cleanup of Nonfederal National Priorities List Sites.
Figure 14. Number and Associated Cost of Unfunded Remedial Action Starts at Non-Federal NPL Sites in Constant 2016 Dollars, FY 2000–FY 2016
114M11 Sites
145M16 Sites
72M7 Sites
127M10 Sites
108M15 Sites
47M9 Sites 42M
6 Sites
73M10 Sites
17M4 Sites
124M21 Sites
105M22 Sites
24M5 Sites 20M
3 Sites
61M12 Sites
0
25
50
75
100
125
150
175
2000 2001 2002 2003 2004 2005 2006 2007 2008 2009 2010 2011 2012 2013 2014 2015 2016
Mill
ions
of D
olla
rs
Fiscal Year
Source: U.S. EPA
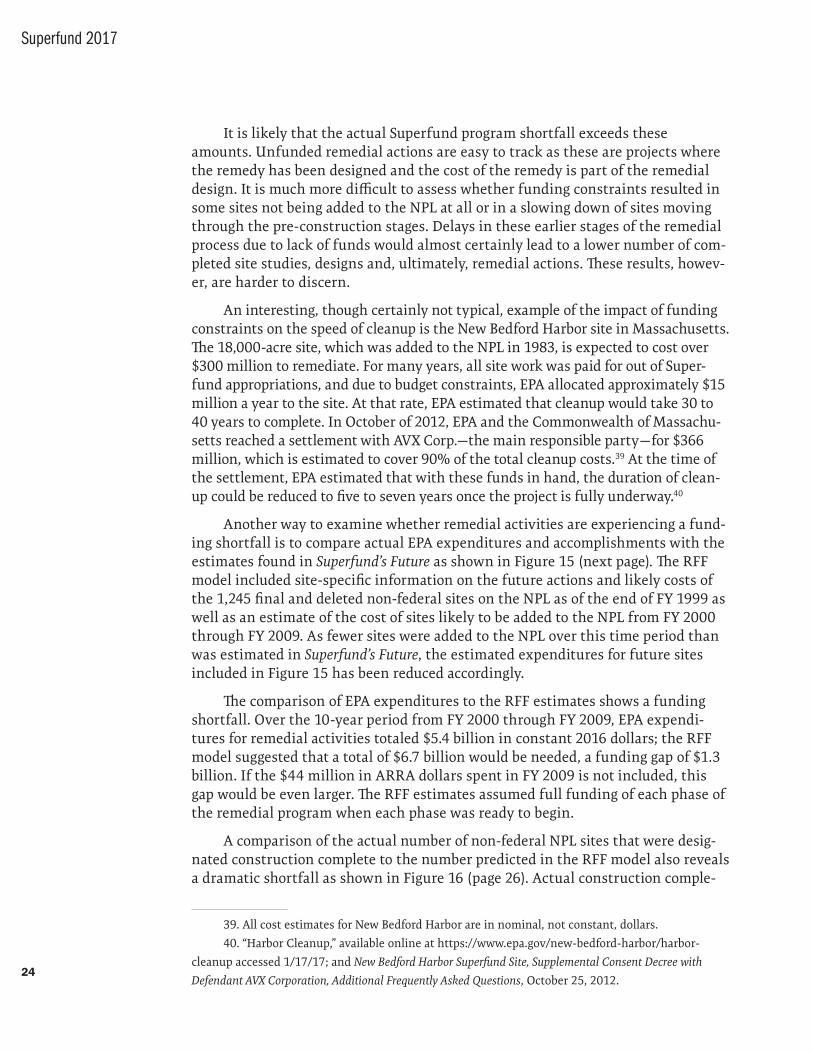
24
Superfund 2017
It is likely that the actual Superfund program shortfall exceeds these amounts. Unfunded remedial actions are easy to track as these are projects where the remedy has been designed and the cost of the remedy is part of the remedial design. It is much more difficult to assess whether funding constraints resulted in some sites not being added to the NPL at all or in a slowing down of sites moving through the pre-construction stages. Delays in these earlier stages of the remedial process due to lack of funds would almost certainly lead to a lower number of com-pleted site studies, designs and, ultimately, remedial actions. These results, howev-er, are harder to discern.
An interesting, though certainly not typical, example of the impact of funding constraints on the speed of cleanup is the New Bedford Harbor site in Massachusetts. The 18,000-acre site, which was added to the NPL in 1983, is expected to cost over $300 million to remediate. For many years, all site work was paid for out of Super-fund appropriations, and due to budget constraints, EPA allocated approximately $15 million a year to the site. At that rate, EPA estimated that cleanup would take 30 to 40 years to complete. In October of 2012, EPA and the Commonwealth of Massachu-setts reached a settlement with AVX Corp.—the main responsible party — for $366 million, which is estimated to cover 90% of the total cleanup costs.39 At the time of the settlement, EPA estimated that with these funds in hand, the duration of clean-up could be reduced to five to seven years once the project is fully underway.40
Another way to examine whether remedial activities are experiencing a fund-ing shortfall is to compare actual EPA expenditures and accomplishments with the estimates found in Superfund’s Future as shown in Figure 15 (next page). The RFF model included site-specific information on the future actions and likely costs of the 1,245 final and deleted non-federal sites on the NPL as of the end of FY 1999 as well as an estimate of the cost of sites likely to be added to the NPL from FY 2000 through FY 2009. As fewer sites were added to the NPL over this time period than was estimated in Superfund’s Future, the estimated expenditures for future sites included in Figure 15 has been reduced accordingly.
The comparison of EPA expenditures to the RFF estimates shows a funding shortfall. Over the 10-year period from FY 2000 through FY 2009, EPA expendi-tures for remedial activities totaled $5.4 billion in constant 2016 dollars; the RFF model suggested that a total of $6.7 billion would be needed, a funding gap of $1.3 billion. If the $44 million in ARRA dollars spent in FY 2009 is not included, this gap would be even larger. The RFF estimates assumed full funding of each phase of the remedial program when each phase was ready to begin.
A comparison of the actual number of non-federal NPL sites that were desig-nated construction complete to the number predicted in the RFF model also reveals a dramatic shortfall as shown in Figure 16 (page 26). Actual construction comple-
39. All cost estimates for New Bedford Harbor are in nominal, not constant, dollars.
40. “Harbor Cleanup,” available online at https://www.epa.gov/new-bedford-harbor/ harbor-
cleanup accessed 1/17/17; and New Bedford Harbor Superfund Site, Supplemental Consent Decree with
Defendant AVX Corporation, Additional Frequently Asked Questions, October 25, 2012.
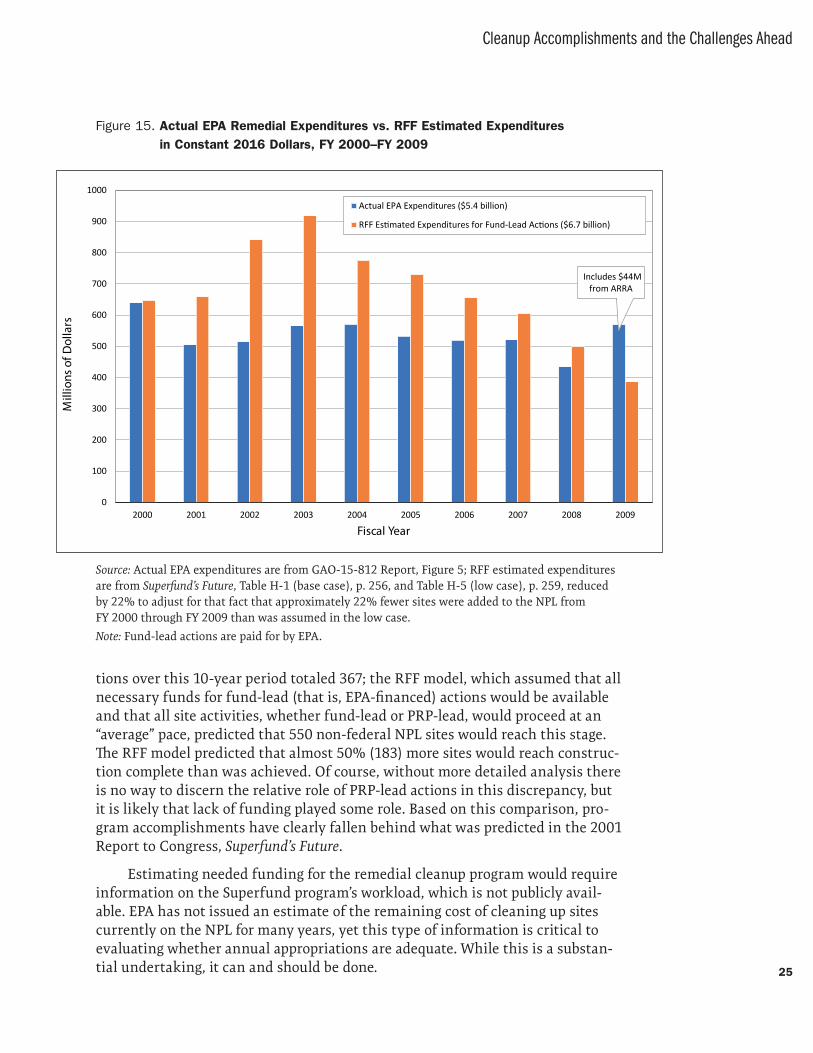
Cleanup Accomplishments and the Challenges Ahead
25
tions over this 10-year period totaled 367; the RFF model, which assumed that all necessary funds for fund-lead (that is, EPA-financed) actions would be available and that all site activities, whether fund-lead or PRP-lead, would proceed at an “average” pace, predicted that 550 non-federal NPL sites would reach this stage. The RFF model predicted that almost 50% (183) more sites would reach construc-tion complete than was achieved. Of course, without more detailed analysis there is no way to discern the relative role of PRP-lead actions in this discrepancy, but it is likely that lack of funding played some role. Based on this comparison, pro-gram accomplishments have clearly fallen behind what was predicted in the 2001 Report to Congress, Superfund’s Future.
Estimating needed funding for the remedial cleanup program would require information on the Superfund program’s workload, which is not publicly avail-able. EPA has not issued an estimate of the remaining cost of cleaning up sites currently on the NPL for many years, yet this type of information is critical to evaluating whether annual appropriations are adequate. While this is a substan-tial undertaking, it can and should be done.
Figure 15. Actual EPA Remedial Expenditures vs. RFF Estimated Expenditures in Constant 2016 Dollars, FY 2000–FY 2009
0
100
200
300
400
500
600
700
800
900
1000
2000 2001 2002 2003 2004 2005 2006 2007 2008 2009
Mill
ions
of D
olla
rs
Fiscal Year
Actual EPA Expenditures ($5.4 billion)
RFF Estimated Expenditures for Fund-Lead Actions ($6.7 billion)
Includes $44M from ARRA
Source: Actual EPA expenditures are from GAO-15-812 Report, Figure 5; RFF estimated expenditures are from Superfund’s Future, Table H-1 (base case), p. 256, and Table H-5 (low case), p. 259, reduced by 22% to adjust for that fact that approximately 22% fewer sites were added to the NPL from FY 2000 through FY 2009 than was assumed in the low case.
Note: Fund-lead actions are paid for by EPA.
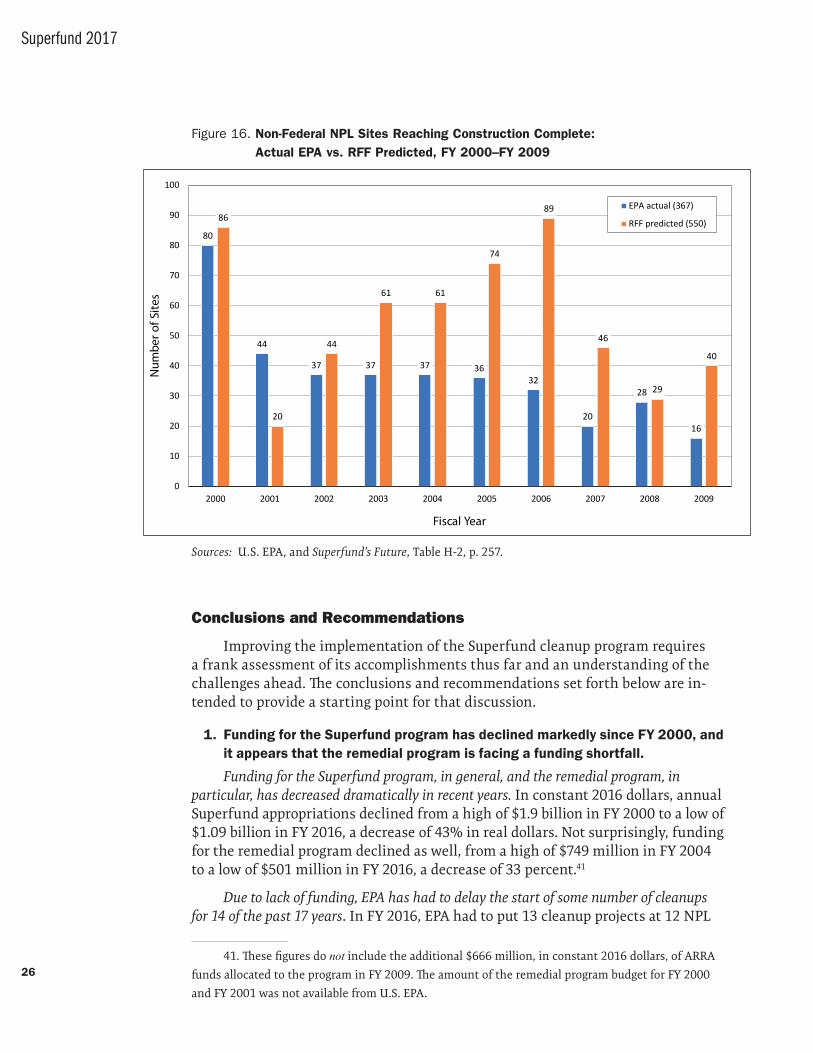
26
Superfund 2017
Conclusions and Recommendations
Improving the implementation of the Superfund cleanup program requires a frank assessment of its accomplishments thus far and an understanding of the challenges ahead. The conclusions and recommendations set forth below are in-tended to provide a starting point for that discussion.
1. Funding for the Superfund program has declined markedly since FY 2000, and it appears that the remedial program is facing a funding shortfall.
Funding for the Superfund program, in general, and the remedial program, in particular, has decreased dramatically in recent years. In constant 2016 dollars, annual Superfund appropriations declined from a high of $1.9 billion in FY 2000 to a low of $1.09 billion in FY 2016, a decrease of 43% in real dollars. Not surprisingly, funding for the remedial program declined as well, from a high of $749 million in FY 2004 to a low of $501 million in FY 2016, a decrease of 33 percent.41
Due to lack of funding, EPA has had to delay the start of some number of cleanups for 14 of the past 17 years. In FY 2016, EPA had to put 13 cleanup projects at 12 NPL
41. These figures do not include the additional $666 million, in constant 2016 dollars, of ARRA
funds allocated to the program in FY 2009. The amount of the remedial program budget for FY 2000
and FY 2001 was not available from U.S. EPA.
Figure 16. Non-Federal NPL Sites Reaching Construction Complete: Actual EPA vs. RFF Predicted, FY 2000–FY 2009
80
44
37 37 37 3632
20
28
16
86
20
44
61 61
74
89
46
29
40
0
10
20
30
40
50
60
70
80
90
100
2000 2001 2002 2003 2004 2005 2006 2007 2008 2009
Num
ber o
f Site
s
Fiscal Year
EPA actual (367)
RFF predicted (550)
Sources: U.S. EPA, and Superfund’s Future, Table H-2, p. 257.
Cleanup Accomplishments and the Challenges Ahead
27
sites on hold due to lack of funding. The estimated price tag to get the 13 projects started was $61 million. (EPA estimated the total cost of these 13 cleanup projects to be $200 million or more.) Over the past five years, the end-of-year funding short-fall for remedial action projects has averaged $67 million in constant 2016 dollars. Most likely, this is only the tip of the iceberg in terms of underfunding as unfunded remedial action starts are among the easiest items to track. Much more difficult to quantify are more subtle results of funding constraints: sites not added to the NPL, site study and remedial projects spread out over a longer time period, and other less visible actions not taken or delayed due to lack of resources.
A comparison of actual EPA expenditures and accomplishments with the estimates in Superfund’s Future shows a major shortfall. Over the period from FY 2000 though FY 2009, EPA expenditures for the cost of all EPA-lead actions at non-federal NPL sites were almost 20% lower than the estimates in Superfund’s Future, even after taking into account that fewer sites were added to the NPL than was assumed in the most conservative estimate. The number of sites that achieved construction complete status over this same 10-year period was almost one-third fewer than was estimated in the RFF model, which assumed that the remedial program would be fully funded. More detailed analysis is needed to confirm that the decrease in construction completions is due to fewer resources being allocated to these actions than was estimated in Superfund’s Future, but it seems likely that lack of funding played a role.
2. Cleanup progress has slowed in recent years.
The average number of non-federal NPL sites reaching construction complete status and being deleted each year is relatively small and has decreased in the last five years. Since the beginning of FY 2000, 462 non-federal NPL sites achieved construction complete, an average of 27 a year. During the years from FY 2001 through FY 2006, the average number of sites reaching construction complete was 37 per year. However, the aver-age dropped to 12 sites a year for the five years from FY 2012 through FY 2016, when only 60 sites were designated construction complete. Since the beginning of FY 2000, a total of 186 non-federal sites were deleted from the NPL, an average of just under 11 sites a year; since FY 2012, that average has decreased to eight deletions a year.
There is a pressing need to better understand what factors have led to the slow-down in cleanup progress and what steps could be taken to address this issue. While funding constraints are almost certainly a factor, there are other possible reasons that should be evaluated, including whether there are more effective ways to deploy EPA staff and dollars, whether PRPs are implementing their cleanup obligations in a timely manner, and whether the technical challenges presented by certain types of sites and contamination make it impossible, at some sites, to speed action.
3. There is still a need for the federal Superfund program. Not only is there more work to be done to complete cleanup at current non-federal NPL sites, but new sites continue to be added to the NPL each year.
There is still a sizable amount of work to be done to complete cleanup at non-federal sites on the NPL. Four hundred and forty-one (28%) of the 1,555 non-federal sites on
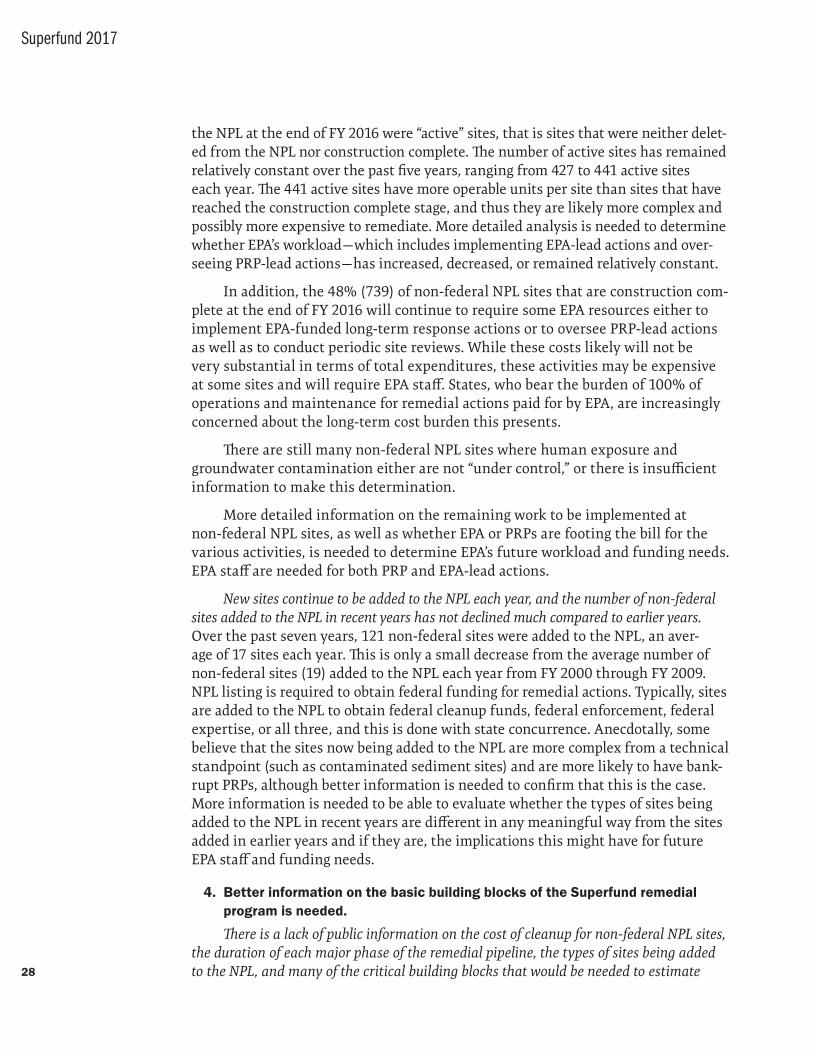
28
Superfund 2017
the NPL at the end of FY 2016 were “active” sites, that is sites that were neither delet-ed from the NPL nor construction complete. The number of active sites has remained relatively constant over the past five years, ranging from 427 to 441 active sites each year. The 441 active sites have more operable units per site than sites that have reached the construction complete stage, and thus they are likely more complex and possibly more expensive to remediate. More detailed analysis is needed to determine whether EPA’s workload — which includes implementing EPA-lead actions and over-seeing PRP-lead actions — has increased, decreased, or remained relatively constant.
In addition, the 48% (739) of non-federal NPL sites that are construction com-plete at the end of FY 2016 will continue to require some EPA resources either to implement EPA-funded long-term response actions or to oversee PRP-lead actions as well as to conduct periodic site reviews. While these costs likely will not be very substantial in terms of total expenditures, these activities may be expensive at some sites and will require EPA staff. States, who bear the burden of 100% of operations and maintenance for remedial actions paid for by EPA, are increasingly concerned about the long-term cost burden this presents.
There are still many non-federal NPL sites where human exposure and groundwater contamination either are not “under control,” or there is insufficient information to make this determination.
More detailed information on the remaining work to be implemented at non-federal NPL sites, as well as whether EPA or PRPs are footing the bill for the various activities, is needed to determine EPA’s future workload and funding needs. EPA staff are needed for both PRP and EPA-lead actions.
New sites continue to be added to the NPL each year, and the number of non-federal sites added to the NPL in recent years has not declined much compared to earlier years. Over the past seven years, 121 non-federal sites were added to the NPL, an aver-age of 17 sites each year. This is only a small decrease from the average number of non- federal sites (19) added to the NPL each year from FY 2000 through FY 2009. NPL listing is required to obtain federal funding for remedial actions. Typically, sites are added to the NPL to obtain federal cleanup funds, federal enforcement, federal expertise, or all three , and this is done with state concurrence. Anecdotally, some believe that the sites now being added to the NPL are more complex from a technical standpoint (such as contaminated sediment sites) and are more likely to have bank-rupt PRPs, although better information is needed to confirm that this is the case. More information is needed to be able to evaluate whether the types of sites being added to the NPL in recent years are different in any meaningful way from the sites added in earlier years and if they are, the implications this might have for future EPA staff and funding needs.
4. Better information on the basic building blocks of the Superfund remedial program is needed.
There is a lack of public information on the cost of cleanup for non-federal NPL sites, the duration of each major phase of the remedial pipeline, the types of sites being added to the NPL, and many of the critical building blocks that would be needed to estimate
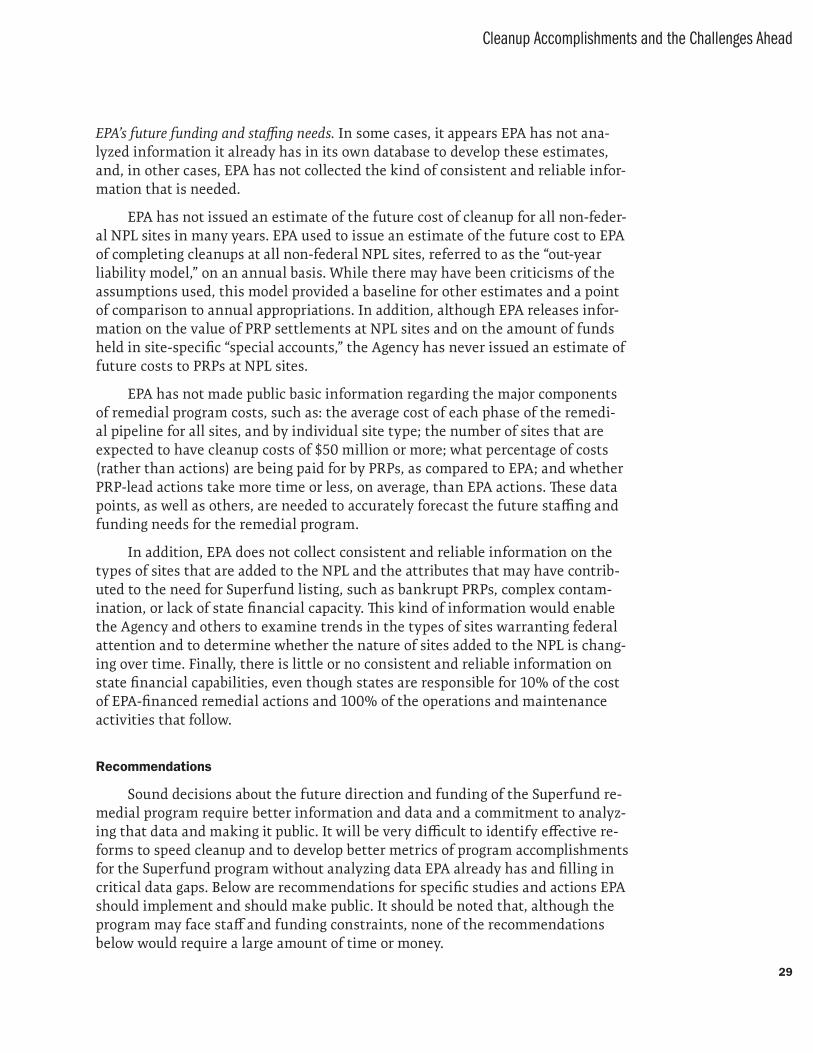
Cleanup Accomplishments and the Challenges Ahead
29
EPA’s future funding and staffing needs. In some cases, it appears EPA has not ana-lyzed information it already has in its own database to develop these estimates, and, in other cases, EPA has not collected the kind of consistent and reliable infor-mation that is needed.
EPA has not issued an estimate of the future cost of cleanup for all non-feder-al NPL sites in many years. EPA used to issue an estimate of the future cost to EPA of completing cleanups at all non-federal NPL sites, referred to as the “out-year liability model,” on an annual basis. While there may have been criticisms of the assumptions used, this model provided a baseline for other estimates and a point of comparison to annual appropriations. In addition, although EPA releases infor-mation on the value of PRP settlements at NPL sites and on the amount of funds held in site-specific “special accounts,” the Agency has never issued an estimate of future costs to PRPs at NPL sites.
EPA has not made public basic information regarding the major components of remedial program costs, such as: the average cost of each phase of the remedi-al pipeline for all sites, and by individual site type; the number of sites that are expected to have cleanup costs of $50 million or more; what percentage of costs (rather than actions) are being paid for by PRPs, as compared to EPA; and whether PRP-lead actions take more time or less, on average, than EPA actions. These data points, as well as others, are needed to accurately forecast the future staffing and funding needs for the remedial program.
In addition, EPA does not collect consistent and reliable information on the types of sites that are added to the NPL and the attributes that may have contrib-uted to the need for Superfund listing, such as bankrupt PRPs, complex contam-ination, or lack of state financial capacity. This kind of information would enable the Agency and others to examine trends in the types of sites warranting federal attention and to determine whether the nature of sites added to the NPL is chang-ing over time. Finally, there is little or no consistent and reliable information on state financial capabilities, even though states are responsible for 10% of the cost of EPA-financed remedial actions and 100% of the operations and maintenance activities that follow.
Recommendations
Sound decisions about the future direction and funding of the Superfund re-medial program require better information and data and a commitment to analyz-ing that data and making it public. It will be very difficult to identify effective re-forms to speed cleanup and to develop better metrics of program accomplishments for the Superfund program without analyzing data EPA already has and filling in critical data gaps. Below are recommendations for specific studies and actions EPA should implement and should make public. It should be noted that, although the program may face staff and funding constraints, none of the recommendations below would require a large amount of time or money.
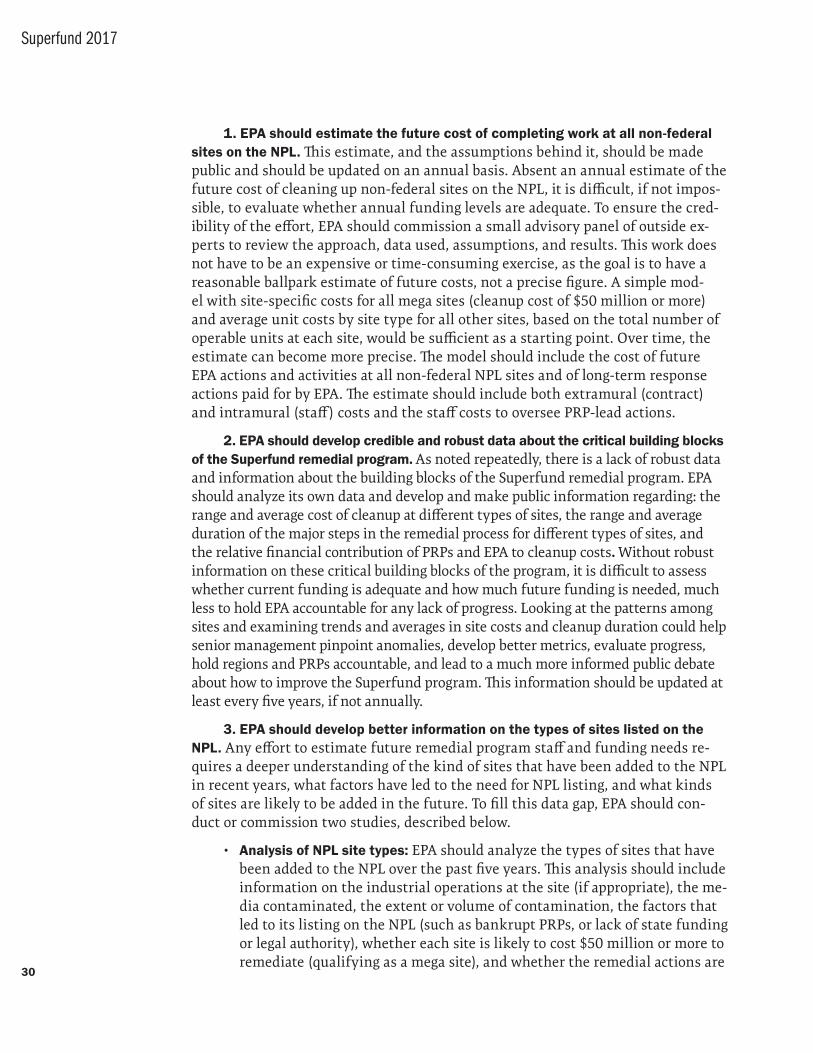
30
Superfund 2017
1. EPA should estimate the future cost of completing work at all non-federal sites on the NPL. This estimate, and the assumptions behind it, should be made public and should be updated on an annual basis. Absent an annual estimate of the future cost of cleaning up non-federal sites on the NPL, it is difficult, if not impos-sible, to evaluate whether annual funding levels are adequate. To ensure the cred-ibility of the effort, EPA should commission a small advisory panel of outside ex-perts to review the approach, data used, assumptions, and results. This work does not have to be an expensive or time-consuming exercise, as the goal is to have a reasonable ballpark estimate of future costs, not a precise figure. A simple mod-el with site- specific costs for all mega sites (cleanup cost of $50 million or more) and average unit costs by site type for all other sites, based on the total number of operable units at each site, would be sufficient as a starting point. Over time, the estimate can become more precise. The model should include the cost of future EPA actions and activities at all non-federal NPL sites and of long-term response actions paid for by EPA. The estimate should include both extramural (contract) and intramural (staff) costs and the staff costs to oversee PRP-lead actions.
2. EPA should develop credible and robust data about the critical building blocks of the Superfund remedial program. As noted repeatedly, there is a lack of robust data and information about the building blocks of the Superfund remedial program. EPA should analyze its own data and develop and make public information regarding: the range and average cost of cleanup at different types of sites, the range and average duration of the major steps in the remedial process for different types of sites, and the relative financial contribution of PRPs and EPA to cleanup costs. Without robust information on these critical building blocks of the program, it is difficult to assess whether current funding is adequate and how much future funding is needed, much less to hold EPA accountable for any lack of progress. Looking at the patterns among sites and examining trends and averages in site costs and cleanup duration could help senior management pinpoint anomalies, develop better metrics, evaluate progress, hold regions and PRPs accountable, and lead to a much more informed public debate about how to improve the Superfund program. This information should be updated at least every five years, if not annually.
3. EPA should develop better information on the types of sites listed on the NPL. Any effort to estimate future remedial program staff and funding needs re-quires a deeper understanding of the kind of sites that have been added to the NPL in recent years, what factors have led to the need for NPL listing, and what kinds of sites are likely to be added in the future. To fill this data gap, EPA should con-duct or commission two studies, described below.
• Analysis of NPL site types: EPA should analyze the types of sites that have been added to the NPL over the past five years. This analysis should include information on the industrial operations at the site (if appropriate), the me-dia contaminated, the extent or volume of contamination, the factors that led to its listing on the NPL (such as bankrupt PRPs, or lack of state funding or legal authority), whether each site is likely to cost $50 million or more to remediate (qualifying as a mega site), and whether the remedial actions are
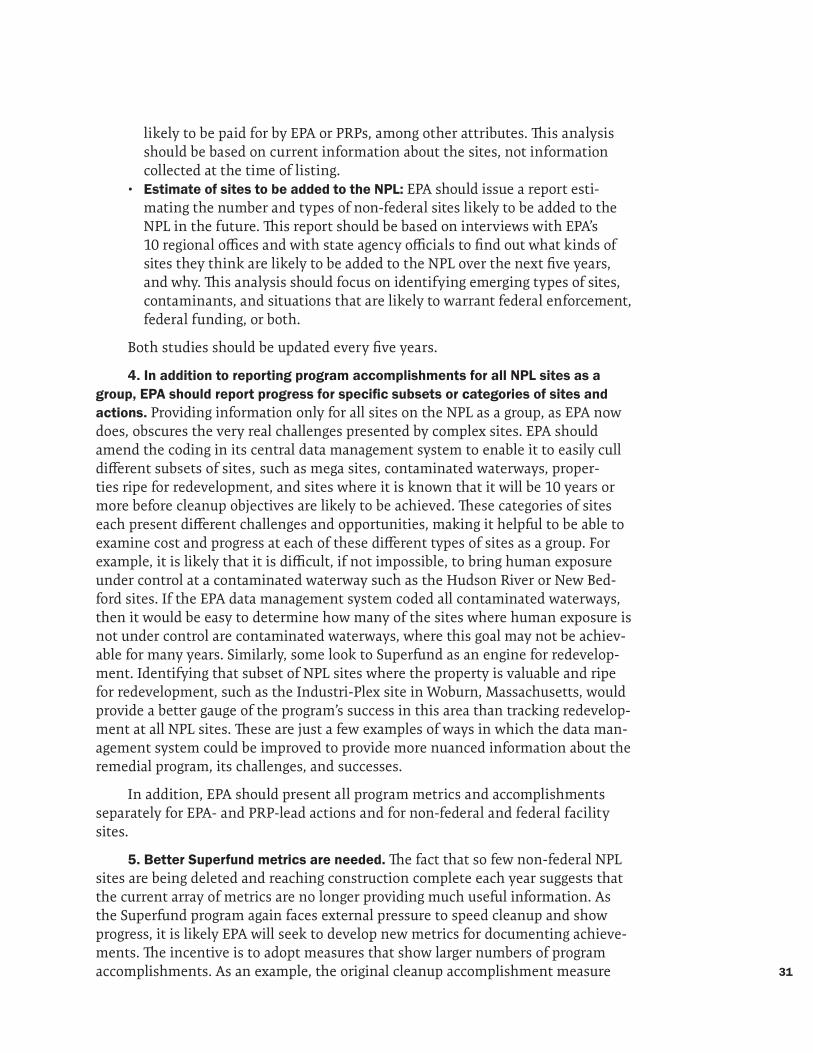
31
likely to be paid for by EPA or PRPs, among other attributes. This analysis should be based on current information about the sites, not information collected at the time of listing.
• Estimate of sites to be added to the NPL: EPA should issue a report esti-mating the number and types of non-federal sites likely to be added to the NPL in the future. This report should be based on interviews with EPA’s 10 regional offices and with state agency officials to find out what kinds of sites they think are likely to be added to the NPL over the next five years, and why. This analysis should focus on identifying emerging types of sites, contaminants, and situations that are likely to warrant federal enforcement, federal funding, or both.
Both studies should be updated every five years.
4. In addition to reporting program accomplishments for all NPL sites as a group, EPA should report progress for specific subsets or categories of sites and actions. Providing information only for all sites on the NPL as a group, as EPA now does, obscures the very real challenges presented by complex sites. EPA should amend the coding in its central data management system to enable it to easily cull different subsets of sites , such as mega sites, contaminated waterways, proper-ties ripe for redevelopment, and sites where it is known that it will be 10 years or more before cleanup objectives are likely to be achieved. These categories of sites each present different challenges and opportunities, making it helpful to be able to examine cost and progress at each of these different types of sites as a group. For example, it is likely that it is difficult, if not impossible, to bring human exposure under control at a contaminated waterway such as the Hudson River or New Bed-ford sites. If the EPA data management system coded all contaminated waterways, then it would be easy to determine how many of the sites where human exposure is not under control are contaminated waterways, where this goal may not be achiev-able for many years. Similarly, some look to Superfund as an engine for redevelop-ment. Identifying that subset of NPL sites where the property is valuable and ripe for redevelopment, such as the Industri-Plex site in Woburn, Massachusetts, would provide a better gauge of the program’s success in this area than tracking redevelop-ment at all NPL sites. These are just a few examples of ways in which the data man-agement system could be improved to provide more nuanced information about the remedial program, its challenges, and successes.
In addition, EPA should present all program metrics and accomplishments separately for EPA- and PRP-lead actions and for non-federal and federal facility sites.
5. Better Superfund metrics are needed. The fact that so few non-federal NPL sites are being deleted and reaching construction complete each year suggests that the current array of metrics are no longer providing much useful information. As the Superfund program again faces external pressure to speed cleanup and show progress, it is likely EPA will seek to develop new metrics for documenting achieve-ments. The incentive is to adopt measures that show larger numbers of program accomplishments. As an example, the original cleanup accomplishment measure
32
for the program was the number of sites deleted from the NPL, but when it be-came clear this was taking a long time, the program came up with the construc-tion completion measure, then partial deletions, and more recently remedial action project starts and completions. Without a context — such as the number of total remedial actions that will be undertaken at all sites — the number of remedial actions started or completed is meaningless. Simply dividing site activities into smaller and smaller units does not show progress. Moreover, these kinds of mea-sures may not even provide useful information about the real accomplishments at the site in terms of protecting public health and the environment.
The measures that are intended to document risks at the site — those indicat-ing whether human exposure and groundwater contamination are under con-trol — need improvement. These measures provide no indication of the severity of the risk, the likelihood of human exposure, or how long contamination has been uncontrolled. EPA should report each quarter the number of non-federal NPL sites that (1) were categorized as not under control in the previous quarter but are now under control, and (2) were categorized as under control in the previous quarter but are now not under control. While some of this information is available on a site-by-site basis, the rationale for program metrics is to provide comparable information across all sites.
New metrics should be judged by whether they provide useful information that increases understanding of site progress and the obstacles to progress, not by whether they will result in a larger number of the items being counted (“more beans”). EPA should seek to develop metrics that convey information about real program accomplishments, not simply steps in the remedial pipeline. The metrics should provide EPA senior management, Congress, and the public a more robust understanding of both the program’s accomplishments and the challenges that lie ahead.
6. EPA should issue a report detailing what actions are needed to reduce possible human exposure to contamination at non-federal NPL sites where a site is characterized as having human exposure or groundwater migration that is “not under control.” EPA should review all non-federal NPL sites where human exposure and groundwater migration (1) is not under control, or (2) where there are insufficient data to determine if it is under control, to determine what steps would be needed to resolve these issues. This assessment should identify the spe-cific steps that are needed to bring human exposure and groundwater migration under control, as well as whether these actions would be paid for by PRPs or EPA and, if EPA, the associated cost. For those sites with insufficient data, the report should detail why this is the case, and what steps would be needed to make this determination. In addition, the assessment should examine whether there are technical obstacles to addressing these concerns and identify those specific sites where it is not technically possible to bring the measure under control in the next decade, and why. Based on this analysis, EPA should revise the current performance measures to make them more meaningful and create a new code for both metrics that indicates those sites where it is not technically feasible to bring
33
(1) human exposure, or (2) groundwater migration under control in the next 10 years (or some specified time period to be decided by EPA).
7. EPA should commission an independent analysis of the financial capacity and legal authorities of state Superfund programs. This report should be con-ducted in coordination with the Association of State and Territorial Solid Waste Management Officials, and potentially with the Environmental Council of the States or the National Governors Association. Some have suggested there is little or no need for a federal cleanup program and that the program should be dele-gated to the states. Yet few (if any) states have the financial resources to pay for the cleanup of an NPL-caliber site, much less a mega site. Under Section 104 of CERCLA, states must contribute to the cost of cleanup at non-federal NPL sites when the remedial action is paid for by EPA. At these sites, the law requires states to pay for 10% of the cost of the remedial action and 100% of all operation and maintenance costs. The report on state capacity should include information for all 50 states42 on the number of non-federal NPL sites where the state is currently responsible for 10% of government-performed remedial actions and the associ-ated cost burden, as well as the estimated annual cost of operation and mainte-nance for these sites. In addition, the study should include information on the total amount of monies, if any, in each state’s cleanup fund (that is, funds that could be used to clean up contaminated sites similar to those listed on the NPL), whether these funds are replenished on an on-going basis, the average cost of any state-funded cleanups implemented over the past 10 years, and whether state Superfund laws have the same liability provisions as CERCLA. This kind of infor-mation was previously available for a number of years when EPA commissioned an in-depth analysis of state Superfund programs that was conducted by the Environ-mental Law Institute. The last of these reports was issued in 2002.43
42. Because of OMB information collection budget requirements, this might have to be limited
to nine states, in which case we recommend that information on the nine states with the most
non-federal sites added to the NPL in the last five years be included.
43. Go to https://www.eli.org/research-report/analysis-state-superfund-programs-50-state-
study-2001-update to download An Analysis of State Superfund Programs: 50-State Study, 2001 Update,
November 2002, Environmental Law Institute, Washington, DC.

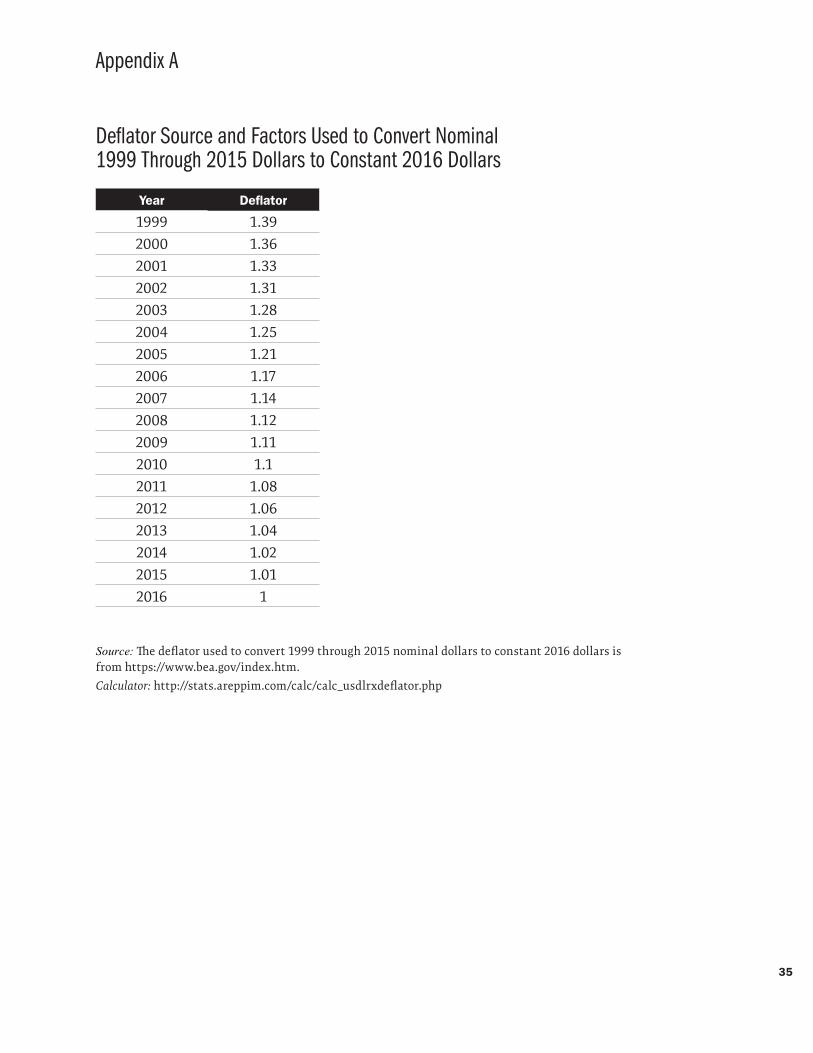
35
Appendix A
Deflator Source and Factors Used to Convert Nominal 1999 Through 2015 Dollars to Constant 2016 Dollars
Year Deflator
1999 1.39
2000 1.36
2001 1.33
2002 1.31
2003 1.28
2004 1.25
2005 1.21
2006 1.17
2007 1.14
2008 1.12
2009 1.11
2010 1.1
2011 1.08
2012 1.06
2013 1.04
2014 1.02
2015 1.01
2016 1
Source: The deflator used to convert 1999 through 2015 nominal dollars to constant 2016 dollars is from https://www.bea.gov/index.htm.
Calculator: http://stats.areppim.com/calc/calc_usdlrxdeflator.php
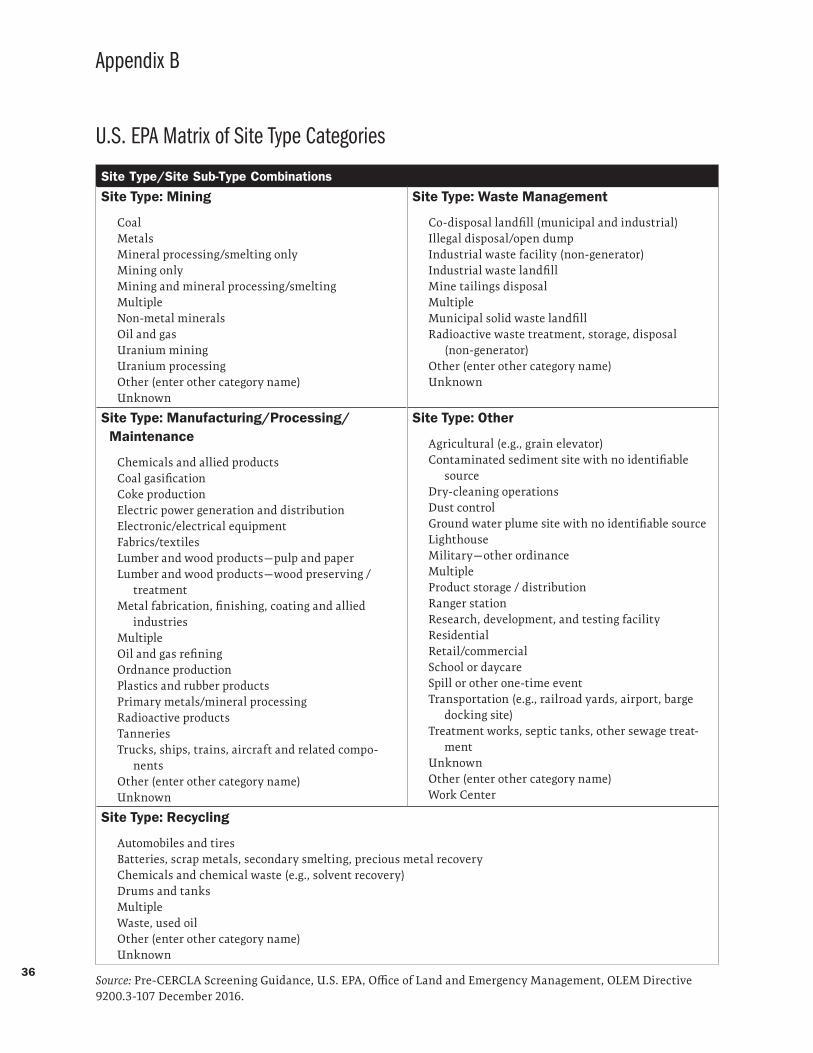
36
Appendix B
U.S. EPA Matrix of Site Type Categories
Site Type/Site Sub-Type Combinations
Site Type: Mining
CoalMetalsMineral processing/smelting onlyMining onlyMining and mineral processing/smeltingMultipleNon-metal mineralsOil and gasUranium miningUranium processingOther (enter other category name)Unknown
Site Type: Waste Management
Co-disposal landfill (municipal and industrial)Illegal disposal/open dumpIndustrial waste facility (non-generator)Industrial waste landfillMine tailings disposalMultipleMunicipal solid waste landfillRadioactive waste treatment, storage, disposal
(non-generator)Other (enter other category name)Unknown
Site Type: Manufacturing/Processing/Maintenance
Chemicals and allied productsCoal gasificationCoke productionElectric power generation and distributionElectronic/electrical equipmentFabrics/textilesLumber and wood products — pulp and paperLumber and wood products — wood preserving /
treatmentMetal fabrication, finishing, coating and allied
industriesMultipleOil and gas refiningOrdnance productionPlastics and rubber productsPrimary metals/mineral processingRadioactive productsTanneriesTrucks, ships, trains, aircraft and related compo-
nentsOther (enter other category name)Unknown
Site Type: Other
Agricultural (e.g., grain elevator)Contaminated sediment site with no identifiable
sourceDry-cleaning operationsDust controlGround water plume site with no identifiable sourceLighthouseMilitary — other ordinanceMultipleProduct storage / distributionRanger stationResearch, development, and testing facilityResidentialRetail/commercialSchool or daycareSpill or other one-time eventTransportation (e.g., railroad yards, airport, barge
docking site)Treatment works, septic tanks, other sewage treat-
mentUnknownOther (enter other category name)Work Center
Site Type: Recycling
Automobiles and tiresBatteries, scrap metals, secondary smelting, precious metal recoveryChemicals and chemical waste (e.g., solvent recovery)Drums and tanksMultipleWaste, used oilOther (enter other category name)Unknown
Source: Pre-CERCLA Screening Guidance, U.S. EPA, Office of Land and Emergency Management, OLEM Directive 9200.3-107 December 2016.
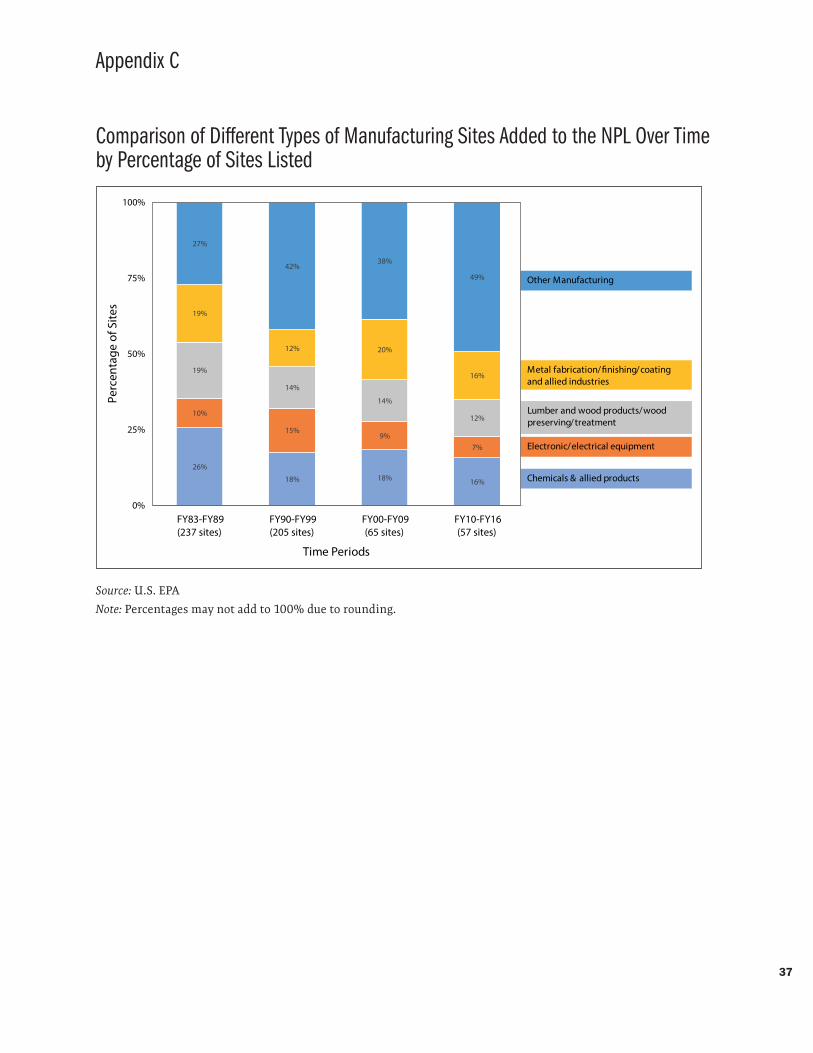
37
Appendix C
Comparison of Different Types of Manufacturing Sites Added to the NPL Over Time by Percentage of Sites Listed
26%
18% 18% 16%
10%
15%9%
7%
19%
14%
14%
12%
19%
12% 20%
16%
27%
42%38%
49%
0%
25%
50%
75%
100%
FY83-FY89(237 sites)
FY90-FY99(205 sites)
FY00-FY09(65 sites)
FY10-FY16(57 sites)
Perc
enta
ge o
f Site
s
Time Periods
Lumber and wood products/wood preserving/treatment
Electronic/electrical equipment
Metal fabrication/�nishing/coating and allied industries
Other Manufacturing
Chemicals & allied products
Source: U.S. EPA
Note: Percentages may not add to 100% due to rounding.
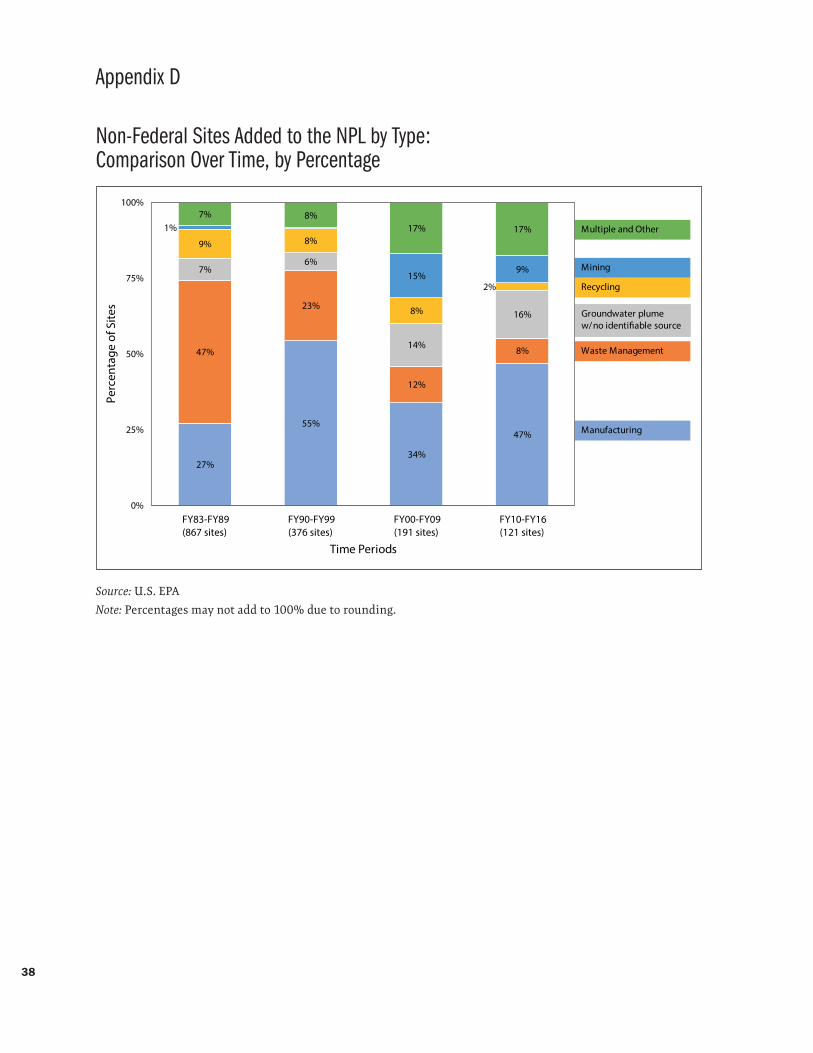
38
Appendix D
Non-Federal Sites Added to the NPL by Type: Comparison Over Time, by Percentage
27%
55%
34%
47%
47%
23%
12%
8%
7%6%
14%
16%
9% 8%
8%
2%
1%
15%9%
7% 8%17% 17%
0%
25%
50%
75%
100%
FY83-FY89(867 sites)
FY90-FY99(376 sites)
FY00-FY09(191 sites)
FY10-FY16(121 sites)
Perc
enta
ge o
f Site
s
Time Periods
Groundwater plume w/no identi�able source
Waste Management
Recycling
Mining
Multiple and Other
Manufacturing
Source: U.S. EPA
Note: Percentages may not add to 100% due to rounding.


www.kateprobstconsulting.com


