24
Superior Plus Corp. September Update TSX: SPB

Superior Plus Corp. September Update
TSX: SPB
1
Forward-Looking Statements and Information
This presentation is for information purposes only and is not intended to, and should not be construed to constitute, an offer to sell or the solicitation of an offer to buy,securities of Superior Plus Corp. (“Superior"). This presentation and its contents should not be construed, under any circumstances, as investment, tax or legal advice. Anyperson accepting delivery of this presentation acknowledges the need to conduct their own thorough investigation into Superior and its activities before considering anyinvestment in its securities.
Certain information included herein and certain oral statements made by management are forward-looking information within the meaning of applicable Canadian securitieslaws. Forward-looking information may include statements regarding the objectives, business strategies to achieve those objectives, expected financial results (including thosein the area of risk management), economic or market conditions, and the outlook of or involving Superior Plus Corp., Superior Plus LP (‘Superior LP”) and its businesses. Suchinformation is typically identified by words such as “anticipate”, “believe”, “continue”, “could”, “estimate”, “expect”, “plan”, “intend”, “forecast”, “future”, “guidance”, “may”,“predict”, “project”, “should”, “strategy”, “target”, “will” or similar expressions suggesting future outcomes.
Forward-looking information in this document includes: future financial position, consolidated and business segment outlooks, expected EBITDA from operations, expectedAOCF and AOCF per share, expected leverage ratios and debt repayment, expectations in terms of the cost of operations, business strategy and objectives, development plansand programs, business expansion and cost structure and other improvement projects, expected product margins and sales volumes, market conditions in Canada and the U.S.,continued improvements in operational efficiencies and sales and marketing initiatives in Energy Distribution, expected synergies as a result of the acquisition of Canwest,anticipated acquisition closing, future economic conditions, future exchange rates, exposure to such rates and incremental earnings associated with such rates, expectedweather, expectations for to the global economic environment, our trading strategy and the risk involved in these strategies, the impact of certain hedges on future reportedearnings and cash flows, future taxes, commodity prices and costs, the impact of contracts for commodities, demand for propane, heating oil and similar products, demand forchemicals including sodium chlorate and chlor-alkali, effect of operational and technological improvements, anticipated costs and benefits of business enterprise systemupgrade plans, future working capital levels, expected governmental regulatory regimes and legislation and their expected impact on regulatory and legislative compliancecosts, expectations for the outcome of existing or potential legal and contractual claims, our ability to obtain financing on acceptable terms, expected life of facilities andstatements regarding net working capital and capital expenditure requirements of Superior or Superior LP.
Forward-looking information is provided for the purpose of providing information about management’s expectations and plans about the future and may not be appropriate forother purposes. Forward-looking information herein is based on various assumptions and expectations that Superior believes are reasonable in the circumstances. No assurancecan be given that these assumptions and expectations will prove to be correct. Those assumptions and expectations are based on information currently available to Superior,including information obtained from third party industry analysts and other third party sources, and the historic performance of Superior’s businesses. Such assumptions includeanticipated financial performance, current business and economic trends, the amount of future dividends paid by Superior, business prospects, availability and utilization of taxbasis, regulatory developments, currency, exchange and interest rates, trading data, cost estimates, recovery within the chlor-alkali market, our ability to obtain financing onacceptable terms, the assumptions set forth under the “Financial Outlook” sections of our fourth quarter MD&A and are subject to the risks and uncertainties set forth below.
By its very nature, forward-looking information involves numerous assumptions, risks and uncertainties, both general and specific. Should one or more of these risks anduncertainties materialize or should underlying assumptions prove incorrect, as many important factors are beyond our control, Superior's or Superior LP's actual performanceand financial results may vary materially from those estimates and intentions contemplated, expressed or implied in the forward-looking information. These risks anduncertainties include incorrect assessments of value when making acquisitions, increases in debt service charges, the loss of key personnel, fluctuations in foreign currency,exchange rates and commodity prices, inadequate insurance coverage, liability for cash taxes, counterparty risk, compliance with environmental laws and regulations, reducedcustomer demand, operational risks involving our facilities, force majeure, labour relations matters, our ability to access external sources of debt and equity capital, and therisks identified in (i) our fourth quarter MD&A under the heading "Risk Factors" and (ii) Superior's most recent Annual Information Form. The preceding list of assumptions, risksand uncertainties is not exhaustive.
When relying on our forward-looking information to make decisions with respect to Superior, investors and others should carefully consider the preceding factors, otheruncertainties and potential events. Any forward-looking information is provided as of the date of this document and, except as required by law, neither Superior nor Superior LPundertakes to update or revise such information to reflect new information, subsequent or otherwise. For the reasons set forth above, investors should not place undue relianceon forward-looking information.
See Superior’s Q2 2017 MD&A for definitions related to Non-GAAP Financial Measures.

2
(1) As at June 30, 2017.(2) As at September 1, 2017.(3) See “Non-GAAP Financial Measures”.(4) Trailing Twelve Months (“TTM”) Q2 2017 EBITDA from operations, which excludes Construction Products Distribution (“CPD”) and
includes $37.8 million pro forma EBITDA from Canwest Propane (excludes anticipated synergies of $20 million).(5) Per Bloomberg, includes reinvested dividends.
Shares outstanding (1) 142.8 million
TSX share price (2) $11.96
Market capitalization (2) $1.7 Billion
Enterprise value (2) $2.7 Billion
Monthly dividend per share $0.06
Dividend yield (2) 6.0%
EBITDA from operations (3)(4) $321.2 million
Debt/Adjusted EBITDA (1)(3) 3.3x
Superior Plus Overview
62%
38%
Q2 2017 TTM EBITDA from Operations(4)
Energy Distribution Specialty Chemicals
-50%
0%
50%
100%
150%
200%
250%
Pe
rce
nta
ge R
etu
rn
Performance vs. S&P/TSX Index to September 1, 2017
Superior Plus S&P TSX Index
> Superior Plus delivered 190% in cumulative total shareholder return,significantly outperforming the TSX since December 31, 2011

3
Energy Distribution Specialty Chemicals
• Leading distributor and marketer of propane in Canada
• Distribution of retail and wholesale propane and distillates in the Northeast U.S.
• Wholesale propane marketing
• Approximately 60% of EBITDA from operations(2)
Production and sales of:• Sodium Chlorate products in North America
• Chlor-alkali and related products in North America
• Sodium Chlorate in Chile, South America
• Export sales represent ~17% of North American production(3)
• Approximately 40% of EBITDA from operations(2)
CANADARevenue – 42% (1)
USARevenue – 58% (1)
(1) Based on Q2 2017 TTM pro forma Canwest Propane. USA includes results from Chile, representing ~5% of gross revenue.(2) Based on Q2 2027 TTM pro forma Canwest Propane and excluding CPD. See “Non-GAAP financial measures”.(3) Based on 2016 volumes.
Energy Distribution and Chemicals have:
> Solid industry positions
> Attractive acquisition opportunities
> Sustainable free cash flow models
> Opportunities for geographic and market expansion
Our Businesses
4
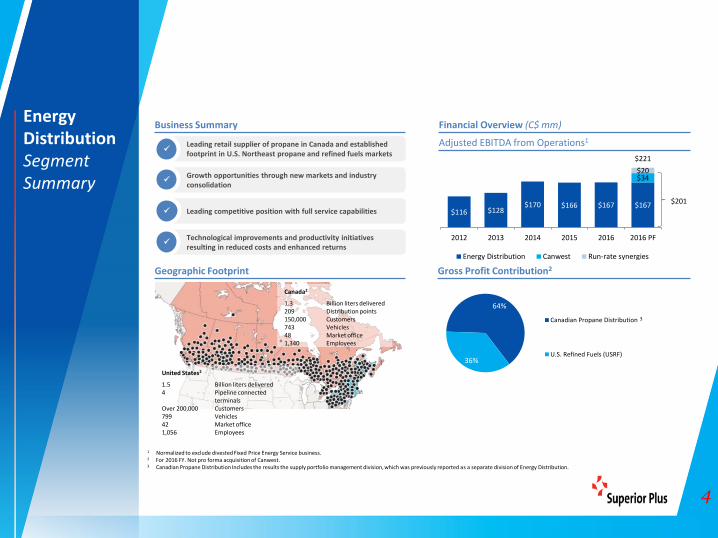
$116 $128$170 $166 $167 $167
$34$20
$221
2012 2013 2014 2015 2016 2016 PF
Energy Distribution Canwest Run-rate synergies
Energy DistributionSegment Summary
Leading retail supplier of propane in Canada and established footprint in U.S. Northeast propane and refined fuels markets
Growth opportunities through new markets and industry consolidation
Leading competitive position with full service capabilities
Technological improvements and productivity initiatives resulting in reduced costs and enhanced returns
Business Summary Financial Overview (C$ mm)
Adjusted EBITDA from Operations1
Gross Profit Contribution2Geographic Footprint
$201
64%
36%
Canadian Propane Distribution
U.S. Refined Fuels (USRF)
Canada2
1.3 Billion liters delivered209 Distribution points150,000 Customers743 Vehicles48 Market office1,340 Employees
United States2
1.5 Billion liters delivered4 Pipeline connected
terminalsOver 200,000 Customers799 Vehicles42 Market office1,056 Employees
1 Normalized to exclude divested Fixed Price Energy Service business.2 For 2016 FY. Not pro forma acquisition of Canwest.3 Canadian Propane Distribution Includes the results the supply portfolio management division, which was previously reported as a separate division of Energy Distribution.
3

5
Energy DistributionSegment Summary
Business & Product Summary
CanadianPropane Distribution
> Superior Propane is Canada’s leading propane distribution company
− Founded in 1951, Superior Propane is an iconic 65-year old Canadian brand with ~30-35% market share
− Offers coast to coast propane solution
− Largest purchaser of propane for domestic retail supply
− Leading customer portal and digital sensor solutions
> Services include primary propane distribution services as well as tank/equipment installation, rental and maintenance
U.S. Refined Fuels
> USRF distributes liquid fuels and propane gas under several different brand names to customers located in 10 states in the Northeast U.S.
− Formed by acquisition in 2009/2010, USRF predominately services the residential/home heating market, constituting 63% of total gross profit
− Lower market shares at 14% of propane and 5% of heating oil offers room for growth with a focus on propane
> In addition, USRF provides other homecare services, including heating, ventilation, air-conditioning installation, maintenance and repair
Supply Portfolio Management
> Superior Gas Liquids (SGL) is an intermediary between upstream natural gas liquids producers and downstream retail customers
> Provides value-added supply portfolio management services to Superior Plus Propane and small and medium sized propane retailers in North America
− Includes transportation, storage, risk management, supply and logistics services
> Focused on growth through organic initiatives and potential acquisitions within the wholesale business
Cdn. Propane Distribution Volumes1U.S. Refined Fuels Volumes1
1 For 2016 FY. Not pro forma acquisition of Canwest.
6
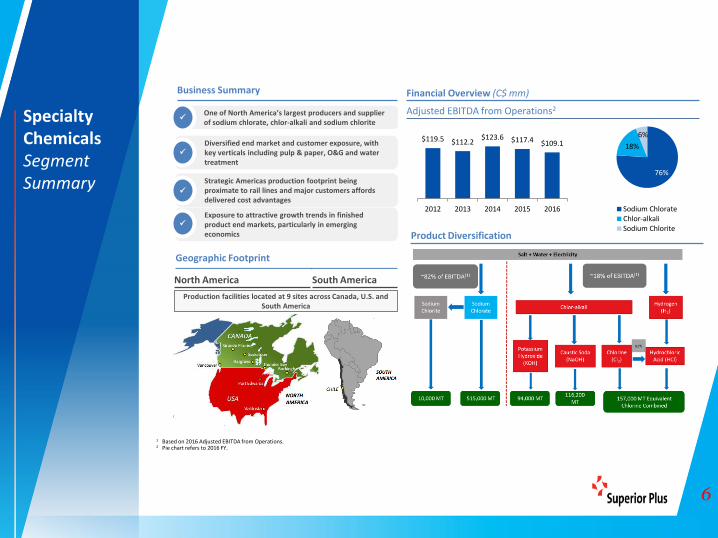
$119.5 $112.2$123.6 $117.4 $109.1
2012 2013 2014 2015 2016
Specialty ChemicalsSegment Summary
Business Summary Financial Overview (C$ mm)
Adjusted EBITDA from Operations2One of North America’s largest producers and supplier of sodium chlorate, chlor-alkali and sodium chlorite
Diversified end market and customer exposure, with key verticals including pulp & paper, O&G and water treatment
Strategic Americas production footprint being proximate to rail lines and major customers affords delivered cost advantages
Exposure to attractive growth trends in finished product end markets, particularly in emerging economics
1 Based on 2016 Adjusted EBITDA from Operations. 2 Pie chart refers to 2016 FY.
Product Diversification
Geographic Footprint
North America South America
Production facilities located at 9 sites across Canada, U.S. and South America
76%
18%
6%
Sodium ChlorateChlor-alkaliSodium Chlorite

7
Specialty ChemicalsBusiness & Product Overview
Business & Product Summary
Sodium Chlorate(76% of Adjusted
EBITDA)1
> Sodium chlorate is an inorganic specialty chemical used primarily (>95%) by the pulp and paper industry for the dioxin-free bleaching of pulp− Simple ingredient profile: water, salt and electricity, with electricity representing as much as 80% of total input costs
> ERCO’s six plants in North America and one in Chile total 515,000 metric tonnes of annual capacity, and are expected to achieve high operating rates going forward− North American facilities represent 28% of continental chlorate capacity
Chlor-alkali(18% of Adjusted
EBITDA)1
> ERCO’s chlor-alkali segment produces caustic soda, potassium caustic, chlorine and hydrochloric acid for a variety of end markets− North American sales also concentrated around pulp & paper, but with additional consumption by the oil & gas and
water treatment industries> ERCO production facilities located in Port Edwards, WI and Saskatoon, SK
− Facilities have achieved operating rates over 10% higher than the North American industry average over the last 5 years
> 157,000 electrochemical units of chlor-alkali annual capacity
Sodium Chlorite (6% of Adjusted EBITDA)1
> Sodium chlorite is a niche chemical used in various water treatment, food processing and oil & gas applications> ERCO’s two facilities at Thunder Bay, ON and Buckingham, QC constitute 55% of total North American capacity for the
chemical> 10,000 metric tonnes of annual capacity
1
2
3
Sales by Customer Segment
Leading North American sodium chlorate producer selling into a diverse range of attractive, stable end markets
10%
24%
14%10%
13%
11%
18%
Hardwood
Softwood
Bleached Board
Coated Paper
Fluff Pulp
Other
Export
7%6%
9%
11%
18%3%
7%
12%
20%
7%
Pulp & PaperTi02Ag IntermediatesBleachChemical DistributionDe-icingFertilizerFoodOil & GasOther
24%
26%15%
7%
16%
4%8%
Oil & Gas
Municipal
Ethanol
Food
Industrial
Export
Other
1 Based on 2016 Specialty Chemicals adjusted EBITDA from operations.
Sodium Chlorate Chlor-alkali Sodium Chlorite

8
Specialty ChemicalsIndustry & Market Overview
Global Pulp Market
U.S. Chlorine Capacity Utilization
Sodium Chlorate
> Chlorate market driven by trends in underlying pulp and paper demand
> Global pulp demand is strong and growing, with stable operating rates− Market is expected to grow at a CAGR of 2.8% from
2015 - 2020> Weakening demand for paper products in mature markets
like North America expected to be offset by growing towel/tissue demand
Chlor-alkali
> While the chlor-alkali market has seen weakness in recent years, ERCO’s strategically located plants yield unique advantages− HCl demand currently depressed due to weak oil and
gas markets, but ERCO benefitting from increased flexibility with new HCI burners and capacity expansions completed in 2014/2015
− Chlorine demand in ERCO’s local markets is balanced− Localized caustic demand also significantly exceeds
production
Sodium Chlorite
> Chlorite market served by two North American producers with approximately same size
> Solid long-term application for water treatment in the O&G segment
> Demand growth initially slowed in 2016, however, is now showing signs of improvement going forward
> Increased interest in chlorine dioxide generators for portable water disinfection
1
2
3
Industry & Market Overview
94.2%82.3%
76.2%86.7% 81.9% 81.4% 80.1% 79.1% 81.2%
83.0%
0.0%
20.0%
40.0%
60.0%
80.0%
100.0%
0.02.04.06.08.0
10.012.014.016.0
2007 2008 2009 2010 2011 2012 2013 2014 2015 2016YTD
Utilizatio
n R
ate
Mill
ion
(M
T)
Capacity (MT) Production (MT) Utilization Rate
90% 89% 89% 89% 88% 86% 87% 87%
60%65%70%75%80%85%90%95%
0
40
80
120
160
2013 2014 2015 2016 2017 2018 2019 2020
Utilizatio
n R
ateMill
ion
(M
T)
Global Capacity Global Demand Utilization Rate

9
> Second quarter results announced in August; AOCF per share(1)
of $0.19, a 58% increase over Q2-16;
- Continued improvements in Specialty Chemicals and lower realizedlosses on foreign exchange hedging contracts were partially offsetby lower EBITDA from Energy Distribution
> Entered an agreement with the CRA regarding its objection tothe tax consequences of Superior’s corporate conversiontransaction in 2008;
- The settlement will not impact cash income taxes for the currentyear or any previous financial years
- Superior expects to receive refunds from the CRA and relatedprovincial taxes agencies for taxes paid of ~$33.0 million in Q4-17or Q1-18
- Superior does not anticipate to pay provincial or federal incometaxes until 2020 and 2023 respectively(2)
(1) See “Non-GAAP Financial Measures”. AOCF per share is before transaction and other costs.(2) See “Forward Looking Information”
Recent Developments

10
> Announced the acquisition of the propane distribution assets ofR.W. Earhart Propane for total consideration of US $38.0 million;
- The acquisition expands Superior’s propane distribution business intoOhio and adds approximately 47.3 million retail litres.
> Completed the acquisition of the assets of Yankee & VirginiaPropane Inc. for total consideration of US $31.5 million;
- The acquisition expands the Superior’s footprint in New York, NewJersey and Virginia and adds approximately 29 million retail litres.
> Canwest Transaction;
- Discussions continue with Canadian Competition Bureau
- Transaction expected to close during H2-17
> Completed the acquisition of Pomerleau Propane Gas in April for$10.7 million;
- Small propane distributor in south east Quebec serving residential andcommercial customers;
Recent Developments (Continued)

11
2017 2nd
Quarter Results
(1) Superior’s 2017 Q2 and 2016 Q2 results as per 2017 second quarter earnings release.(2) Superior’s FY 2016 and FY 2015 results as per 2016 annual report.
(millions of dollars except per share amounts) Q2 2017 Q2 2016 FY 2016 FY 2015
Energy Distribution 12.8 16.9 167.4 166.3
Specialty Chemicals 28.4 22.3 109.1 117.4
Construction Product Distribution - - 27.1 47.9
Adjusted EBITDA from operations 41.2 39.2 303.6 331.6
Income from Canwest Propane 2.8 - - -
Interest expense (11.2) (9.5) (36.3) (47.1)
Corporate costs (2.0) (3.8) (20.2) (16.5)
Cash taxes (1.6) (1.7) (4.9) (2.1)
Realized losses on foreign currency hedging contracts (1.7) (7.7) (29.6) (52.3)
Adjusted operating cash flow before restructuring 27.5 16.5 212.6 213.6
Adjusted operating cash flow per share before restructuring $0.19 $0.12 $1.50 $1.65
Average number of shares outstanding (millions) 142.8 141.9 142.1 129.0

12
Key Operating Statistics
FY 2016 Propane Revenue (1) ˃ $142 Million
FY 2016 Other Revenue (1) ˃ $26 Million
FY 2016 Adjusted EBITDA(1)(2) ˃ $34 Million
FY 2016 Volume(1) ˃ 423 Million Litres
Propane Volumes by Business Segment(1)
(1) Canwest 2016 results as per Gibson 2016 Annual MD&A.(2) See “Non GAAP Measures”.
CanwestAcquisition Overview
> Canwest asset base constitutes one of the leading propane distribution franchises in Canada, with average propane sales of approximately 470 million litres over the past two years
Branch Network
41%
34%
25%
Oil and Gas Commercial Other
Year Founded ˃ 1987
Headquarters ˃ Calgary, Alberta
Customers ˃ ~50,000
Branch locations ˃ 37
Satellite locations ˃ 30

13
Run rate
Consolidated – At least ~$20.0 million
Synergy Summary
Labour costs
Proximity to existing Superior Propane operations supports synergy case
Synergies are primarily in the operating expense segment; highly visible and will be realized quickly post closing
Capital
Fleet optimization savings through consolidation of the fleet
One-time capital disposal synergy due to facility overlap
Property & Facilities (“P&F”)
Consolidation of facilities to provide synergies
Synergy (1) Timeline
Year 1
$5.3 million
Year 2
$14.4 million
Year 3
$20.0 million
Estimated run-rate pre-tax synergies expected to be at least $20 million on a run-rate basisand are expected to be fully realized within 24-36 months from transaction completion
(1) See Forward-Looking Statements and information..

14
Superior Plus
> Successful close of Canwest propane acquisition> Execution on key themes of Evolution 2020
• Internal growth• Continuous improvement programs• Talent management• Sustainable capital structure and cash flow profile• Increased resources focused on acquisitions
Energy Distribution
> Integration of Canwest Propane after close of transaction> Strategic tuck-in acquisitions – 3-4> Continuous focus on cost improvement> Growth of wholesale business> Investment in sales and marketing in support of growth
Specialty Chemicals
> Focus on plant optimization and logistics> Developing advanced sales and marketing approach> Maintaining excellent customer partner relationships> Continue to develop export market> Strategic acquisitions
2017 Areas of Focus

15
Financial Overview

16
2017
Adjusted Operating cash flow per share (1) $1.50 - $1.75
Total Debt to Adjusted EBITDA (1)(2) 3.2X – 3.6X
Total capital forecast to
decline as long term run-rate
has been achieved on
base business
0
20
40
60
80
100
120
2016 2017
$ in
mill
ion
s
2016 Actuals and 2017 Estimated Capital Spending (2)(3)(4)(5)
Maintenance Growth Finance leases
(1) Per 2017 Second Quarter MD&A. See “Non-GAAP Financial Measures”.(2) See “Forward-Looking Statements and Information”.(3) Growth Capital includes efficiency and process improvement capital.(4) 2016 capital spend includes acquisition capital of $4.2 million from the Caledon Acquisition.(5) Maintenance capital is net of disposals.
$116.1$100-$105
2017 Financial Outlook & Capital Spend
> Hedging program mitigating risk in foreign currency fluctuations;
- Substantively hedged at USD/CAD rate of ~$1.31 for the balance of 2017

17
Financial Metrics & Maturity Profile
$0
$50
$100
$150
$200
$250
$300
$350
Mill
ion
s o
f D
olla
rs (
CA
D)
Debt Maturity Profile
5.25% High Yield Note Syndicated Credit Facility
Convertible Debenture 6.5% Unsecured Debenture
(1) $97 million convertible debenture is callable July 31, 2017.
> Prudent capital management
> Long-term Debt to Adjusted EBITDA of 3.0x
> Payout Ratio of 40 – 60%
> Credit facility extended and increased to $620 million
> $432 million was drawn on the credit facility as at September 1, 2017

18
Summary

19
Evolution 2020Business Overview
Energy Distribution
> An ideal industry to grow through acquisitions and immediately leverage our
solid platform, including:
• Increased provision of value-added services
• Utilizing our supply cost advantage
• Maximizing logistics capabilities
> Acquisition strategy focused on retail and wholesale propane
Specialty Chemicals
> Focus on sodium chlorate optimization and sales strategy:
• Improved go-to-market strategy
• Increase export volumes
• Evaluate plant expansions and continued focus on low-cost operations
> Increase direct customer sales initiatives in chlor-alkali
> Improve operations and marketing for chlor-alkali recovery
> Source strategic acquisition opportunities
20
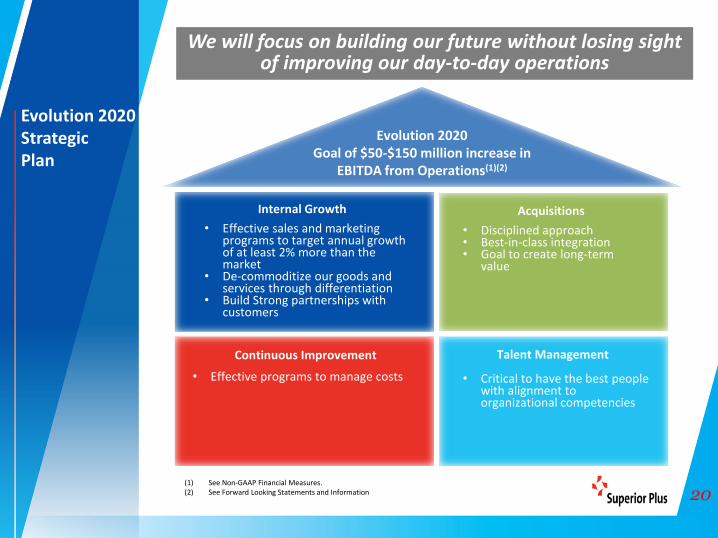
Evolution 2020StrategicPlan
We will focus on building our future without losing sight of improving our day-to-day operations
• Effective sales and marketing programs to target annual growth of at least 2% more than the market
• De-commoditize our goods and services through differentiation
• Build Strong partnerships with customers
• Critical to have the best people with alignment to organizational competencies
• Disciplined approach• Best-in-class integration• Goal to create long-term
value
Evolution 2020Goal of $50-$150 million increase in
EBITDA from Operations(1)(2)
Continuous Improvement
• Effective programs to manage costs
Internal Growth Acquisitions
Talent Management
(1) See Non-GAAP Financial Measures.(2) See Forward Looking Statements and Information
21
Evolution 2020 Target
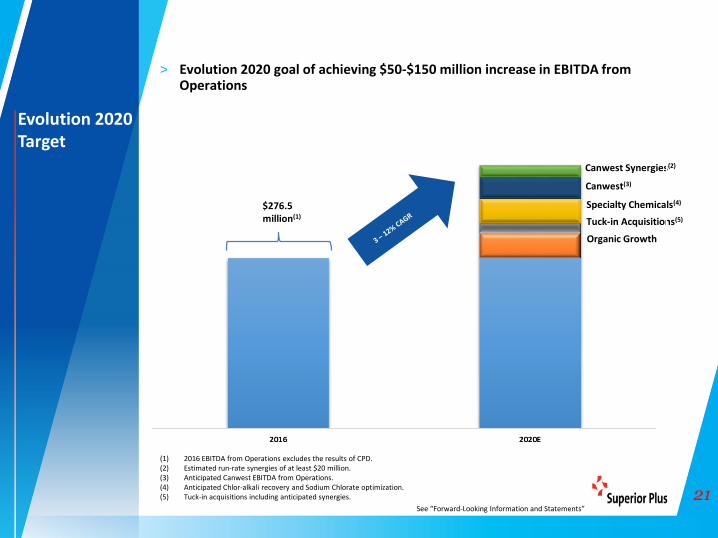
> Evolution 2020 goal of achieving $50-$150 million increase in EBITDA from Operations
See “Forward-Looking Information and Statements”
$276.5million(1)
(1) 2016 EBITDA from Operations excludes the results of CPD.(2) Estimated run-rate synergies of at least $20 million.(3) Anticipated Canwest EBITDA from Operations. (4) Anticipated Chlor-alkali recovery and Sodium Chlorate optimization.(5) Tuck-in acquisitions including anticipated synergies.
Canwest Synergies(2)
Canwest(3)
Specialty Chemicals(4)
Tuck-in Acquisitions(5)
Organic Growth
22
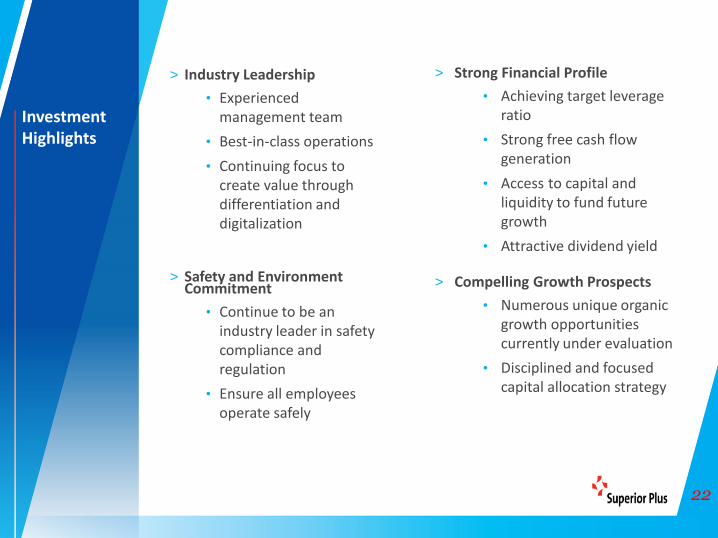
> Industry Leadership
• Experienced management team
• Best-in-class operations
• Continuing focus to create value through differentiation and digitalization
> Safety and Environment Commitment
• Continue to be an industry leader in safety compliance and regulation
• Ensure all employees operate safely
> Strong Financial Profile
• Achieving target leverage ratio
• Strong free cash flow generation
• Access to capital and liquidity to fund future growth
• Attractive dividend yield
> Compelling Growth Prospects
• Numerous unique organic growth opportunities currently under evaluation
• Disciplined and focused capital allocation strategy
Investment Highlights

23
Energy Services
Specialty Chemicals
Construction Products Distribution
2) 3)
Throughout the presentation, Superior has used the following terms that are not defined by GAAP, but are used by management toevaluate the performance of Superior and its businesses. Since non-GAAP financial measures do not have standardized meaningprescribed by GAAP and are therefore unlikely to be comparable to similar measures presented by other companies, securitiesregulations require that non-GAAP financial measures are clearly defined, qualified and reconciled to their nearest GAAP financialmeasures. Except as otherwise indicated, these Non-GAAP financial measures are calculated and disclosed on a consistent basisfrom period to period. Specific adjusting items may only be relevant in certain periods. The intent of non-GAAP financial measuresis to provide additional useful information to investors and analysts and the measures do not have any standardized meaning underIFRS. The measures should not, therefore, be considered in isolation or used in substitute for measures of performance prepared inaccordance with IFRS. Other issuers may calculate non-GAAP financial measures differently.
Investors should be cautioned that Adjusted EBITDA, EBITDA from operations and AOCF should not be construed as alternatives tonet earnings, cash flow from operating activities or other measures of financial results determined in accordance with GAAP as anindicator of Superior’s performance.
Non-GAAP financial measures are identified and defined as follows:
Adjusted Operating Cash FlowAOCF is equal to cash flow from operating activities as defined by IFRS, adjusted for changes in non-cash working capital, otherexpenses, non-cash interest expense, current income taxes and finance costs. Superior may deduct or include additional items in itscalculation of AOCF; these items would generally, but not necessarily, be items of a non-recurring nature. AOCF is the mainperformance measure used by management and investors to evaluate Superior’s performance. AOCF represents cash flowgenerated by Superior that is available for, but not necessarily limited to, changes in working capital requirements, investingactivities and financing activities of Superior.
Adjusted EBITDAFor the purposes of this presentation Adjusted EBITDA represents earnings before taxes, depreciation, amortization, financeexpense, and certain other non-cash expenses and transaction and other costs deemed to be non-recurring, and is used by Superiorto assess its consolidated results and ability to service debt. The EBITDA of Superior’s operating segments may be referred to asEBITDA from operations.
EBITDA from operationsEBITDA from operations is defined as adjusted EBITDA excluding gains/(losses) on foreign currency hedging contracts, corporatecosts and transaction and other costs. For purposes of this presentation, foreign currency hedging contract gains and losses areexcluded from the results of the operating segments. EBITDA from Operations is used by Superior and investors to assess theresults of its operating segments.
For additional information with respect to financial measures which have not been identified by GAAP, including reconciliations tothe closest comparable GAAP measure, see Superior's 2016 Annual MD&A, available on SEDAR at www.sedar.com
Non-GAAP Financial Measures


