22
Superior Value Creation Denver Gold Forum 2016 Neal Froneman Chief Executive Officer 19 September 2016
Superior Value
Creation
Denver Gold Forum 2016
Neal Froneman
Chief Executive Officer
19 September 2016
Disclaimer
The information in this presentation may include forward-looking statements, which are based on current expectations and
projections about future events. These statements may include, without limitation, any statements preceded by, followed by or
including words such as “target,” “expect,” “may,” “anticipate,” “estimate,” “will,” and other words and terms of similar
meaning or the negative thereof. These forward-looking statements, as well as those included in any other material discussed
at the meeting, are subject to risks, uncertainties and assumptions, including, among other things, the development of
Sibanye’s business, general economic conditions and actions of regulators. In light of these risks, uncertainties and
assumptions, the events in the forward-looking statements may not occur. No representation or warranty is made that any
forward-looking statement will come to pass and no reliance should be placed on any forward-looking statement. No one
undertakes to publicly update or revise any such forward-looking statement.
2
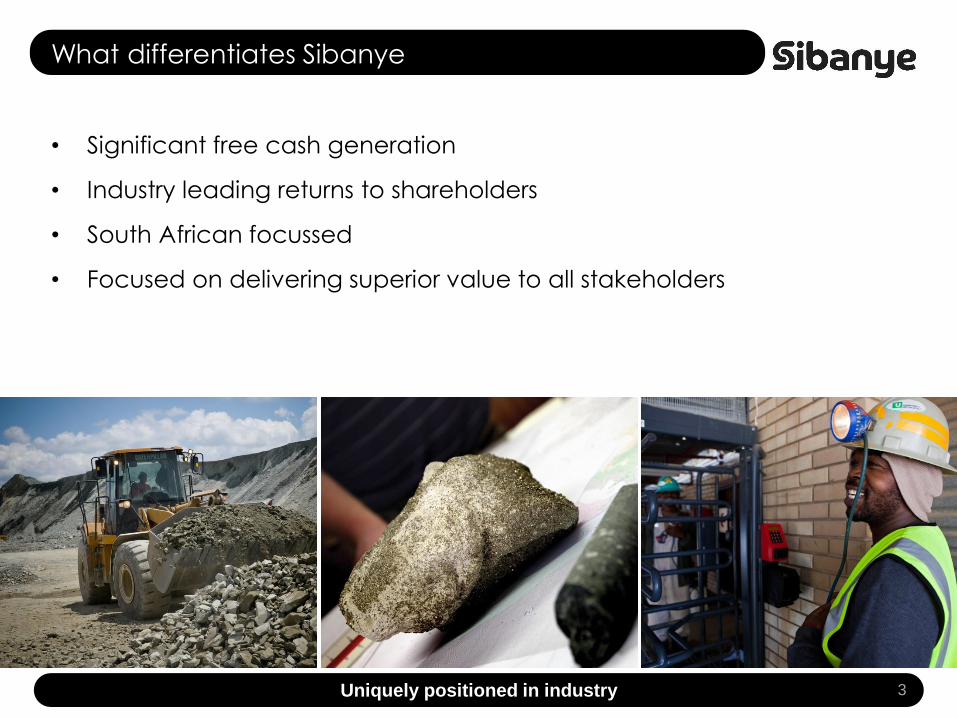
What differentiates Sibanye
• Significant free cash generation
• Industry leading returns to shareholders
• South African focussed
• Focused on delivering superior value to all stakeholders
3Uniquely positioned in industry

Corporate overview
4A FTSE/JSE Top 40 precious metals company
Shares in issueShares in ADR form
923 902 469189 073 910
Market cap R53.5bn (US$3.8bn)
Listings • JSE Limited share code: SGL • New York Stock Exchange ADR
programme share code: SBGL
Debt1 R5.3bn (US$478m) of R10.1bn term and revolving facility
Major Sibanye Gold shareholders*
Gold One Limited 20.07%
Public Investment Corporation 8,99%
Old Mutual Plc 4.91%
Van Eck Associates Corporation 4.73%
Contact details
Libanon Business Park
1 Hospital Road (off Cedar Avenue)
Libanon, Westonaria, 1779
South Africa
Neal Froneman
CEO
Tel: +27 11 278 9600
e-mail: [email protected]
James Wellsted
Investor Relations
Tel: +27 11 278 9600
e-mail: [email protected]
1 At 30 June 2016, except market cap at 5 September 2016
20%
24%
33%
5%
3%
2%
13%
China
South Africa
USA
Luxembourg
United Kingdom
Ireland
Others
* Source: J.P.Morgan Cazenove, July 2016
Shareholder geographic distribution*
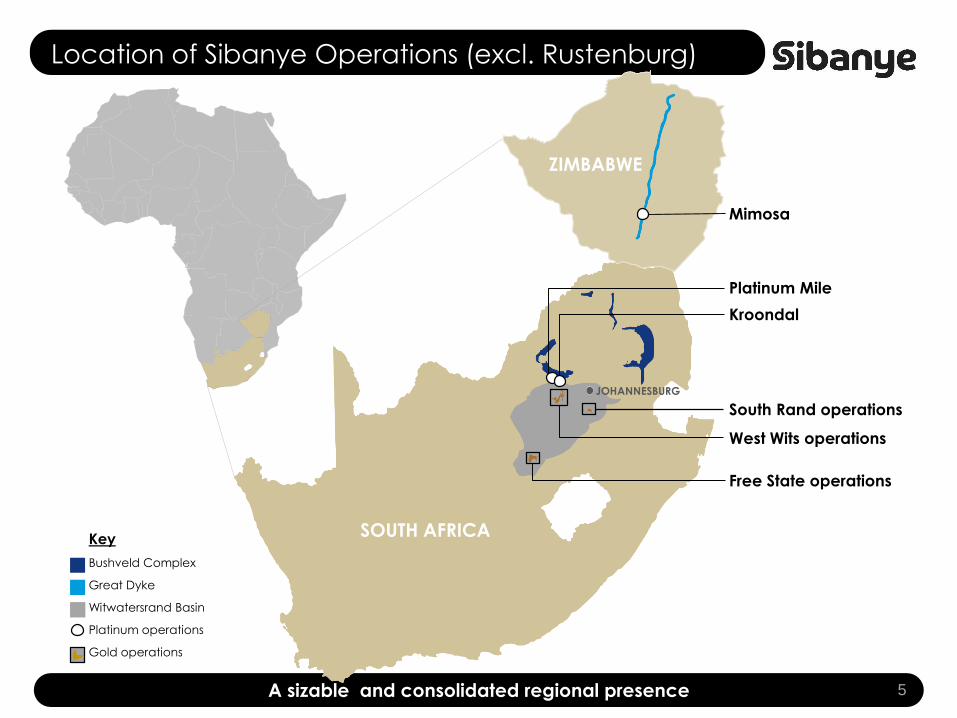
Location of Sibanye Operations (excl. Rustenburg)
5A sizable and consolidated regional presence
Mimosa
Platinum Mile
Kroondal
SOUTH AFRICA
ZIMBABWE
JOHANNESBURG
Free State operations
West Wits operations
South Rand operations
Key
Bushveld Complex
Great Dyke
Witwatersrand Basin
Platinum operations
Gold operations
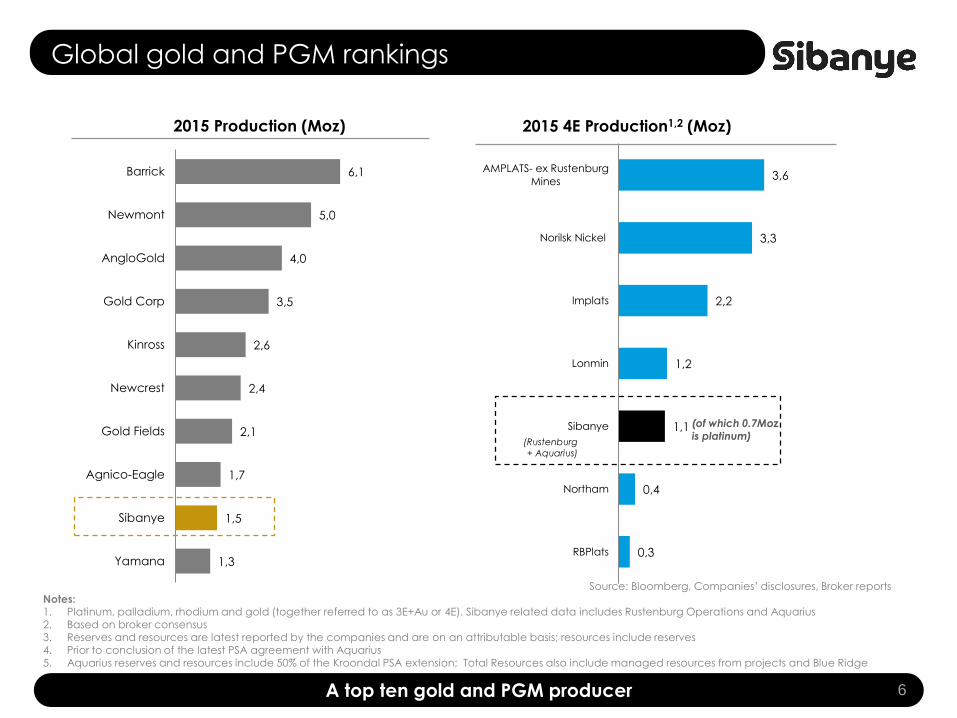
Source: Bloomberg, Companies’ disclosures, Broker reports
Notes:1. Platinum, palladium, rhodium and gold (together referred to as 3E+Au or 4E). Sibanye related data includes Rustenburg Operations and Aquarius2. Based on broker consensus3. Reserves and resources are latest reported by the companies and are on an attributable basis; resources include reserves4. Prior to conclusion of the latest PSA agreement with Aquarius5. Aquarius reserves and resources include 50% of the Kroondal PSA extension; Total Resources also include managed resources from projects and Blue Ridge
1,3
1,5
1,7
2,1
2,4
2,6
3,5
4,0
5,0
6,1
Yamana
Sibanye
Agnico-Eagle
Gold Fields
Newcrest
Kinross
Gold Corp
AngloGold
Newmont
Barrick
2015 Production (Moz)
Global gold and PGM rankings
6A top ten gold and PGM producer
0,3
0,4
1,1
1,2
2,2
3,3
3,6
RBPlats
Northam
Sibanye
Lonmin
Implats
Norilsk Nickel
AMPLATS- ex Rustenburg
Mines
(Rustenburg
+ Aquarius)
2015 4E Production1,2 (Moz)
(of which 0.7Mozis platinum)
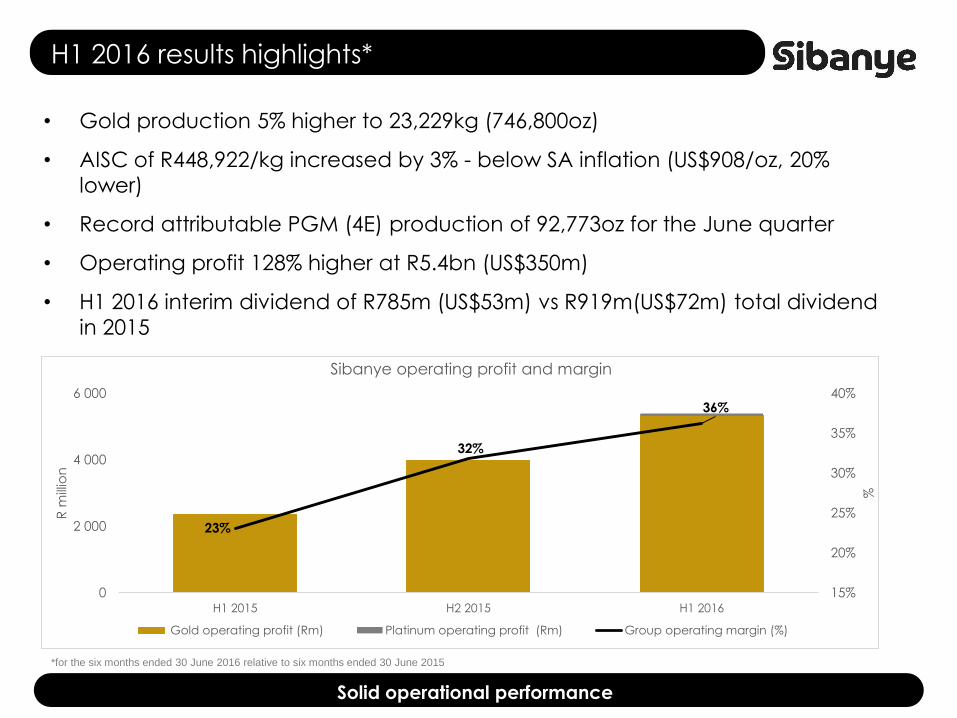
H1 2016 results highlights*
• Gold production 5% higher to 23,229kg (746,800oz)
• AISC of R448,922/kg increased by 3% - below SA inflation (US$908/oz, 20%
lower)
• Record attributable PGM (4E) production of 92,773oz for the June quarter
• Operating profit 128% higher at R5.4bn (US$350m)
• H1 2016 interim dividend of R785m (US$53m) vs R919m(US$72m) total dividend
in 2015
*for the six months ended 30 June 2016 relative to six months ended 30 June 2015
Solid operational performance
23%
32%
36%
15%
20%
25%
30%
35%
40%
0
2 000
4 000
6 000
H1 2015 H2 2015 H1 2016
%
R m
illio
n
Sibanye operating profit and margin
Gold operating profit (Rm) Platinum operating profit (Rm) Group operating margin (%)
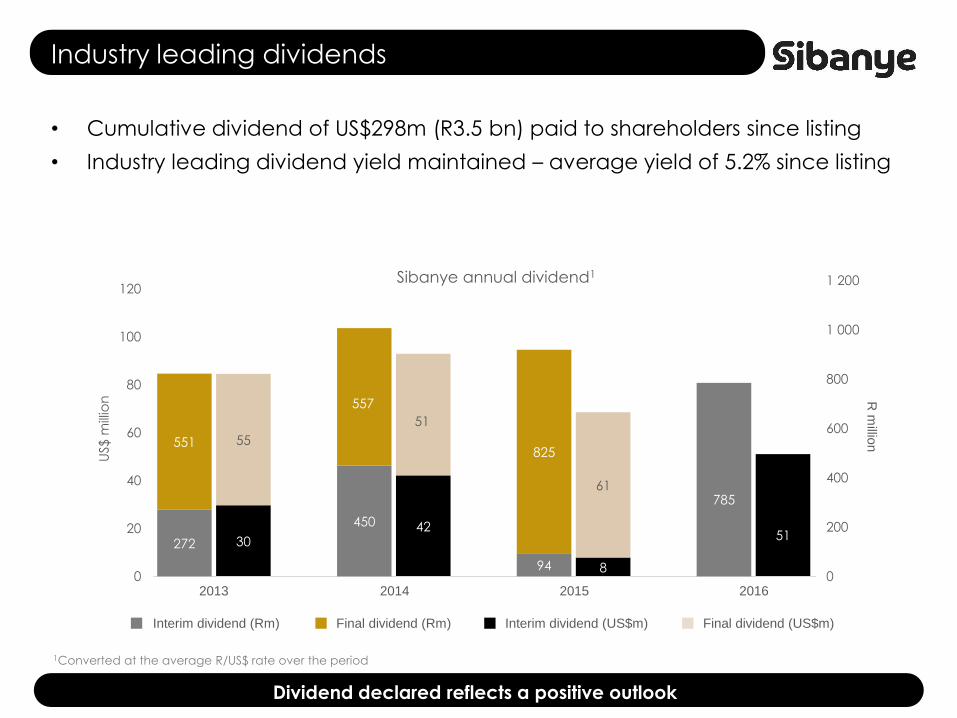
• Cumulative dividend of US$298m (R3.5 bn) paid to shareholders since listing
• Industry leading dividend yield maintained – average yield of 5.2% since listing
Industry leading dividends
Dividend declared reflects a positive outlook
1Converted at the average R/US$ rate over the period
3042
8
51
55
51
61
0
20
40
60
80
100
120
2013 2014 2015 2016
US$ m
illio
n
Sibanye annual dividend1
272
450
94
785
551
557
825
0
200
400
600
800
1 000
1 200
R m
illion
2013 2014 2015 2016
Interim dividend (Rm) Final dividend (Rm) Interim dividend (US$m) Final dividend (US$m)
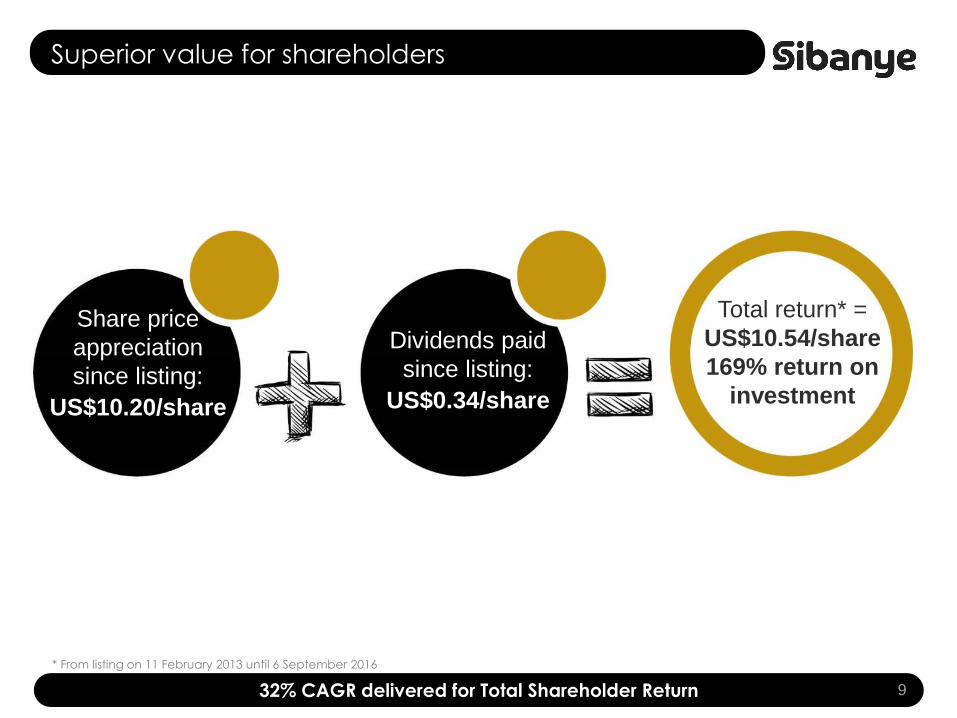
Superior value for shareholders
932% CAGR delivered for Total Shareholder Return
* From listing on 11 February 2013 until 6 September 2016
Share price
appreciation
since listing:
US$10.20/share
Dividends paid
since listing:
US$0.34/share
Total return* =
US$10.54/share
169% return on
investment
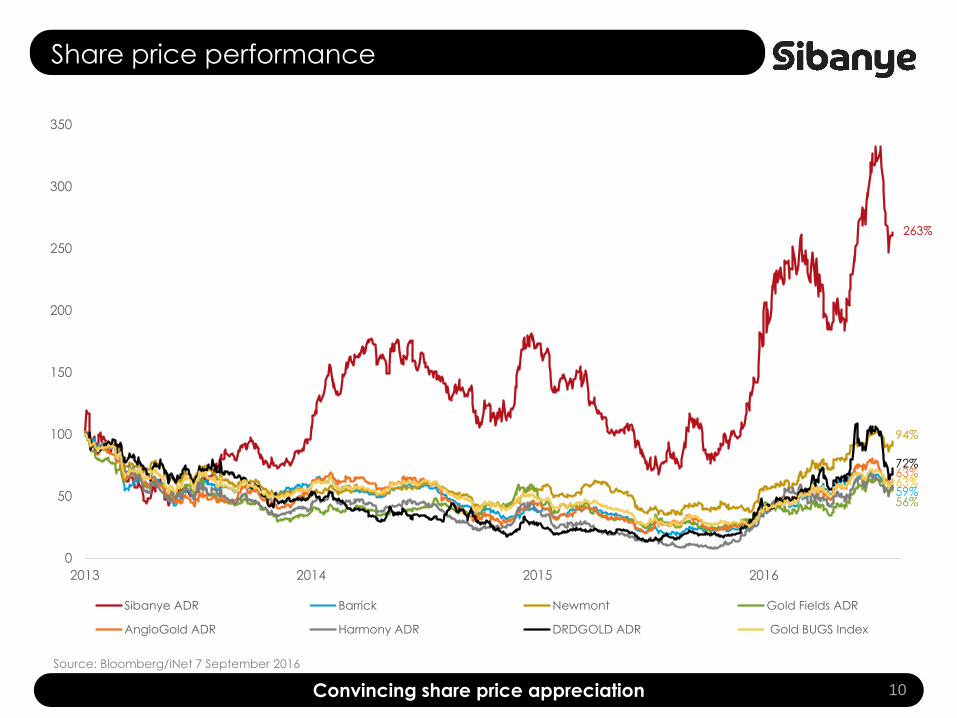
Share price performance
0
50
100
150
200
250
300
350
2013 2014 2015 2016
Sibanye ADR Barrick Newmont Gold Fields ADR
AngloGold ADR Harmony ADR DRDGOLD ADR Gold BUGS Index
10
Source: Bloomberg/iNet 7 September 2016
263%
94%
72%
63%63%
56%59%
Convincing share price appreciation
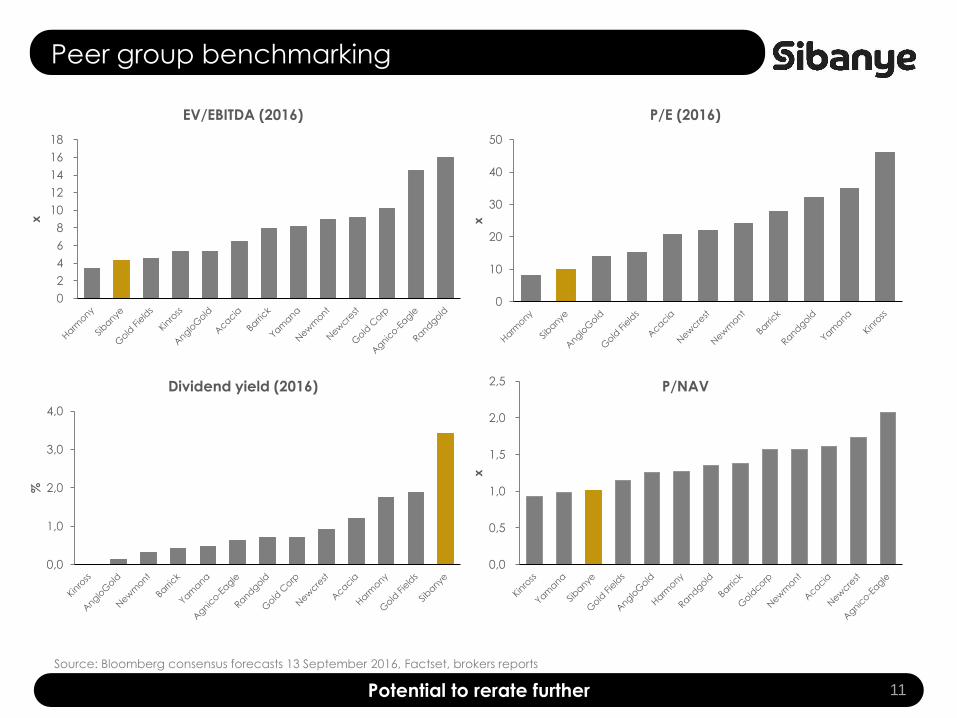
Peer group benchmarking
11Potential to rerate further
Source: Bloomberg consensus forecasts 13 September 2016, Factset, brokers reports
0,0
0,5
1,0
1,5
2,0
2,5
x
P/NAV
0
2
4
6
8
10
12
14
16
18
x
EV/EBITDA (2016)
0
10
20
30
40
50
x
P/E (2016)
0,0
1,0
2,0
3,0
4,0
%
Dividend yield (2016)
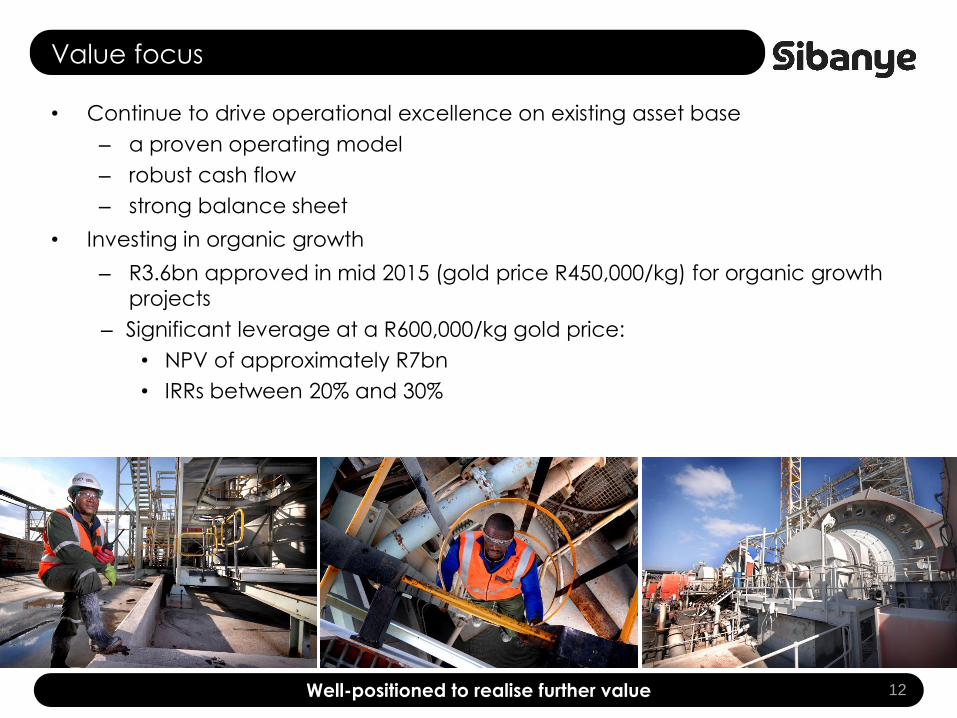
Value focus
• Continue to drive operational excellence on existing asset base
– a proven operating model
– robust cash flow
– strong balance sheet
• Investing in organic growth
– R3.6bn approved in mid 2015 (gold price R450,000/kg) for organic growth
projects
– Significant leverage at a R600,000/kg gold price:
• NPV of approximately R7bn
• IRRs between 20% and 30%
12Well-positioned to realise further value
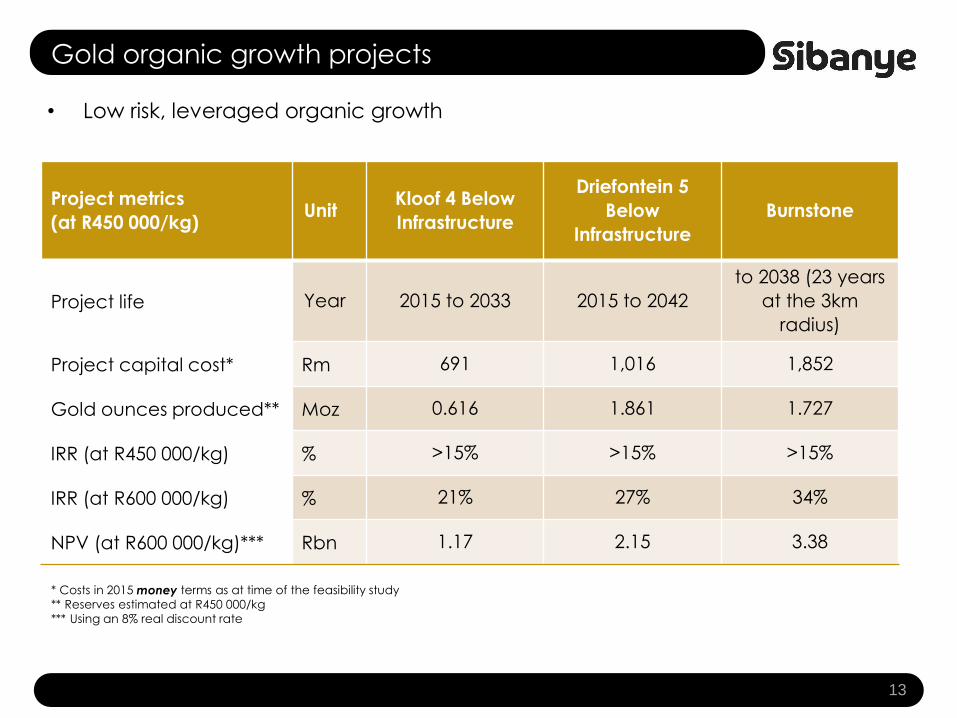
Gold organic growth projects
• Low risk, leveraged organic growth
13
Project metrics
(at R450 000/kg)Unit
Kloof 4 Below
Infrastructure
Driefontein 5
Below
Infrastructure
Burnstone
Project life Year 2015 to 2033 2015 to 2042
to 2038 (23 years
at the 3km
radius)
Project capital cost* Rm 691 1,016 1,852
Gold ounces produced** Moz 0.616 1.861 1.727
IRR (at R450 000/kg) % >15% >15% >15%
IRR (at R600 000/kg) % 21% 27% 34%
NPV (at R600 000/kg)*** Rbn 1.17 2.15 3.38
* Costs in 2015 money terms as at time of the feasibility study
** Reserves estimated at R450 000/kg
*** Using an 8% real discount rate

LoM reserve production profiles
14Extending the operating life
0
10 000
20 000
30 000
40 000
50 000
60 000
kg
Pre-feasibilities studies
undertaken
De Bron
Beisa
Pending capital approval
WRTRP
Projects in development
Burnstone
Below infrastructure projects
Kloof
Driefontein
Surface reserves in LoM
Kloof
Driefontein
Cooke
Beatrix
Underground reserves in LoM
Kloof
Driefontein
Cooke
Beatrix
Note: Project profile is based on pre-feasibility and feasibility studies as at December 2015
Based on Reserves declared as at 31 December 2015
Assumptions: Gold price: R430,000/kg, Uranium R1,455/lb (real 2015 terms)
Gold Fields plan
31,000kg (1Moz)

Precious metals strategy - Platinum a logical first step
• Many operational similarities with gold mining
• Long-term PGM supply and demand fundamentals remain robust
• Low PGM prices and escalating costs (labour, utilities) have put balance sheets
under strain
• Opportunity to leverage Sibanye’s successful operating model and hard rock,
tabular, labour intensive mining competency to realise further value
• Innovative approach to structuring transactions and projects
• The SA PGM sector offers a number of consolidation opportunities
15
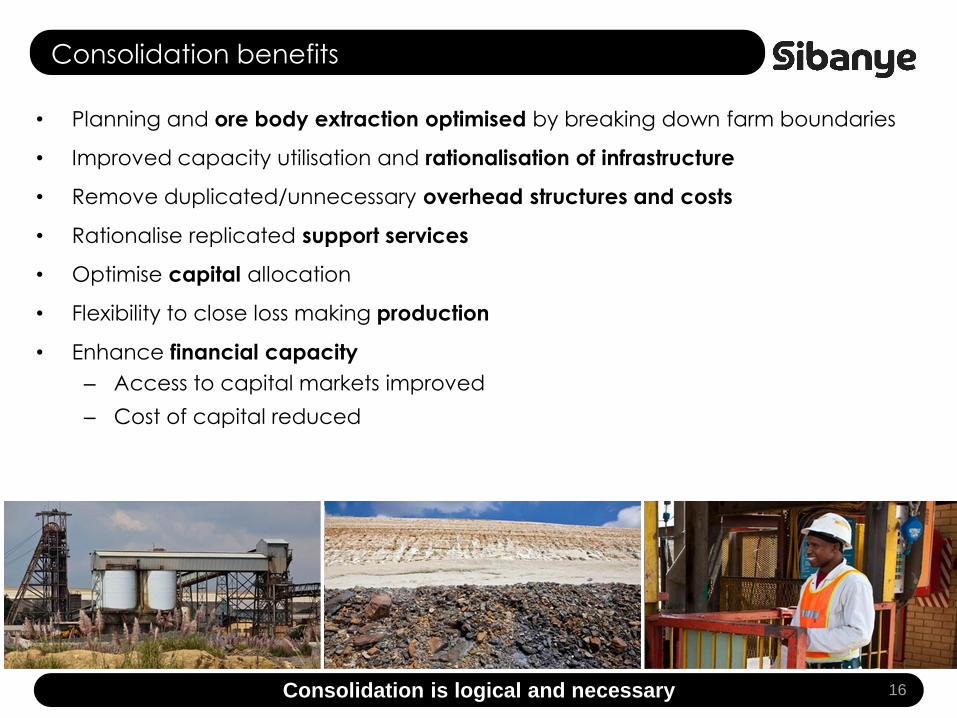
Consolidation benefits
• Planning and ore body extraction optimised by breaking down farm boundaries
• Improved capacity utilisation and rationalisation of infrastructure
• Remove duplicated/unnecessary overhead structures and costs
• Rationalise replicated support services
• Optimise capital allocation
• Flexibility to close loss making production
• Enhance financial capacity
– Access to capital markets improved
– Cost of capital reduced
Consolidation is logical and necessary 16
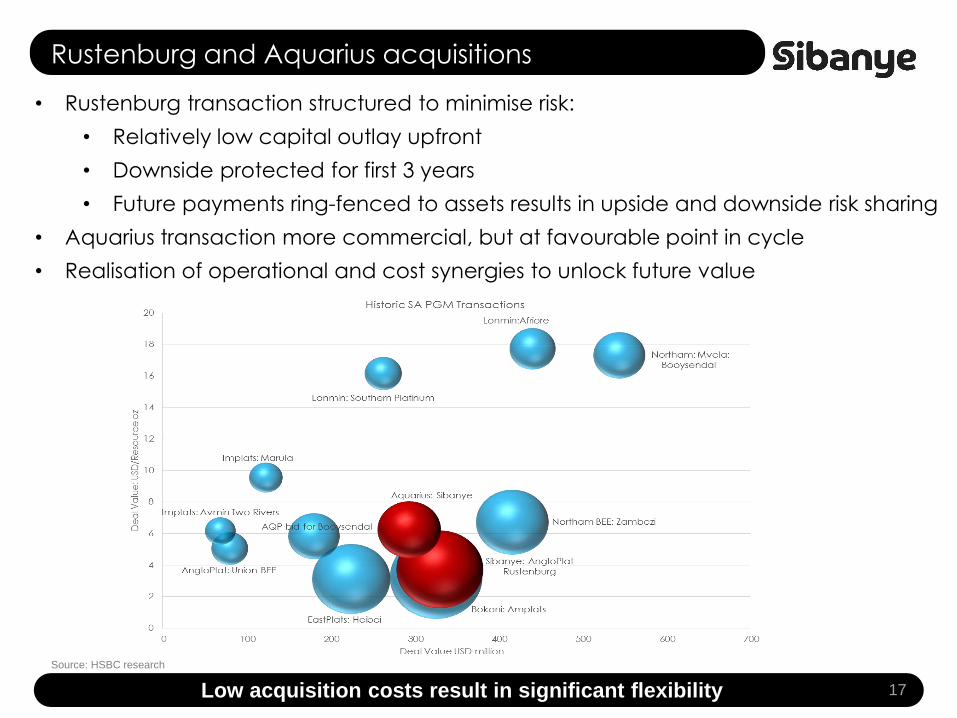
Rustenburg and Aquarius acquisitions
Low acquisition costs result in significant flexibility
Source: HSBC research
• Rustenburg transaction structured to minimise risk:
• Relatively low capital outlay upfront
• Downside protected for first 3 years
• Future payments ring-fenced to assets results in upside and downside risk sharing
• Aquarius transaction more commercial, but at favourable point in cycle
• Realisation of operational and cost synergies to unlock future value
17

Operating synergies
• Removal of mine boundaries results in
optimised mine plans and underground infrastructure
• Optimising plant utilisation and surface ore flow
Direct cost savings at operations
• Best practice operational
benchmarking
• Economies of scale benefits
Operating and separate synergies targeted
Driving value creation through realisation of regional and operating synergies 18
Shared services and central cost savings
• Bathopele/Kroondal shared services optimised
• Rustenburg and Kroondal training
• Regional, central and shared services
• Corporate overheads reduced
Turk #
(undeveloped)
School
of MinesRustenburg Operations
Care and maintenance
Aquarius
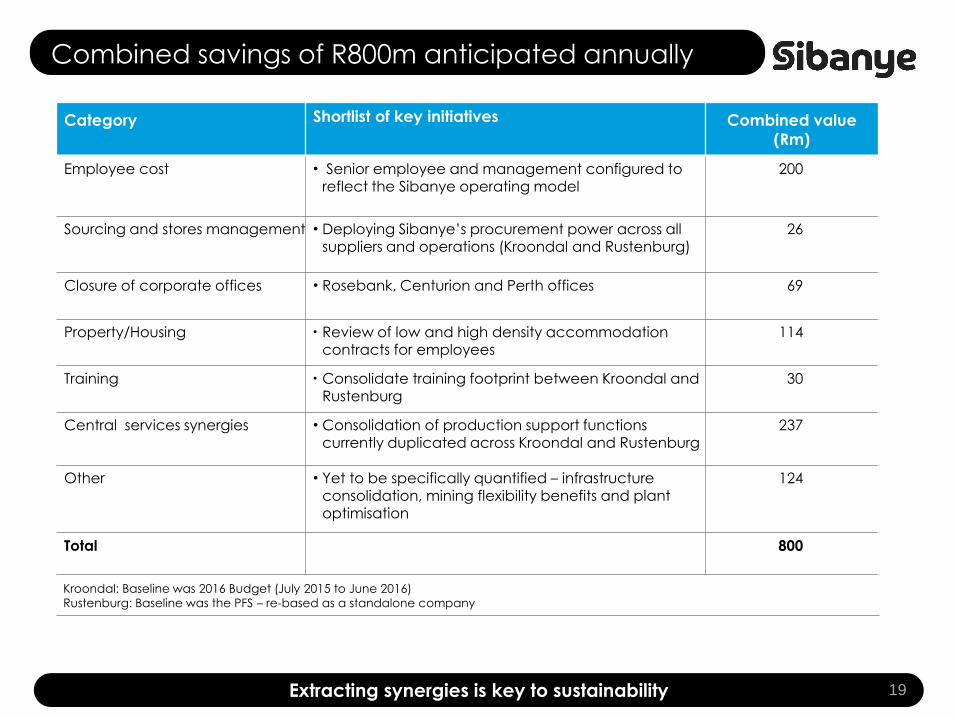
Combined savings of R800m anticipated annually
Extracting synergies is key to sustainability 19
Category Shortlist of key initiatives Combined value
(Rm)
Employee cost • Senior employee and management configured to reflect the Sibanye operating model
200
Sourcing and stores management • Deploying Sibanye’s procurement power across all suppliers and operations (Kroondal and Rustenburg)
26
Closure of corporate offices • Rosebank, Centurion and Perth offices 69
Property/Housing • Review of low and high density accommodation contracts for employees
114
Training • Consolidate training footprint between Kroondal and Rustenburg
30
Central services synergies • Consolidation of production support functions currently duplicated across Kroondal and Rustenburg
237
Other • Yet to be specifically quantified – infrastructure consolidation, mining flexibility benefits and plant optimisation
124
Total 800
Kroondal: Baseline was 2016 Budget (July 2015 to June 2016)
Rustenburg: Baseline was the PFS – re-based as a standalone company
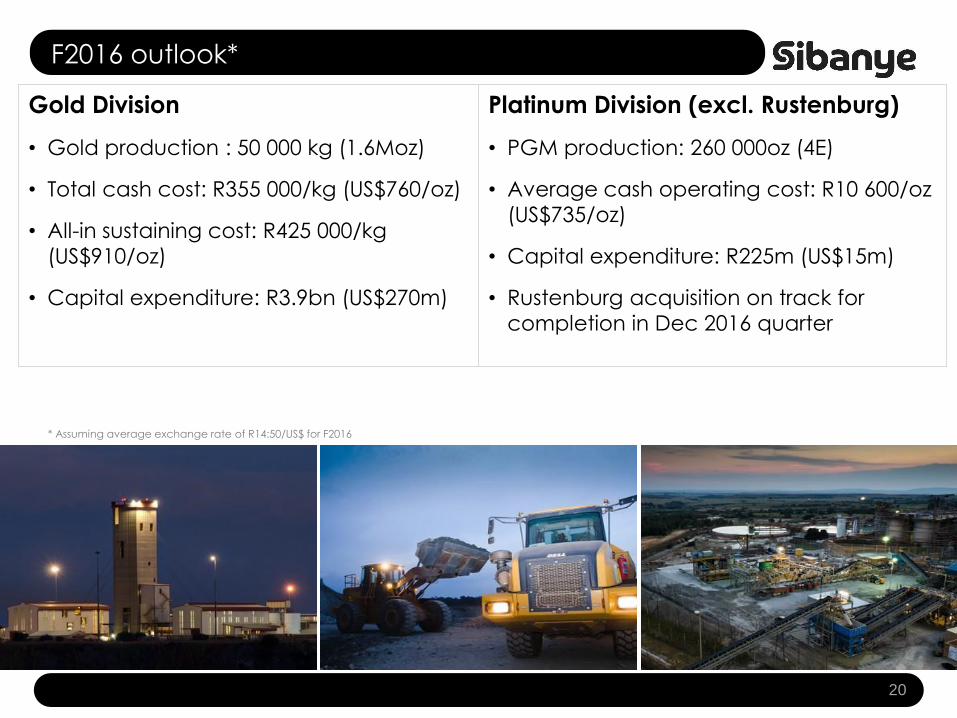
F2016 outlook*
20A very solid outlook
Gold Division
• Gold production : 50 000 kg (1.6Moz)
• Total cash cost: R355 000/kg (US$760/oz)
• All-in sustaining cost: R425 000/kg
(US$910/oz)
• Capital expenditure: R3.9bn (US$270m)
* Assuming average exchange rate of R14:50/US$ for F2016
Platinum Division (excl. Rustenburg)
• PGM production: 260 000oz (4E)
• Average cash operating cost: R10 600/oz
(US$735/oz)
• Capital expenditure: R225m (US$15m)
• Rustenburg acquisition on track for
completion in Dec 2016 quarter
• A secure and prosperous future
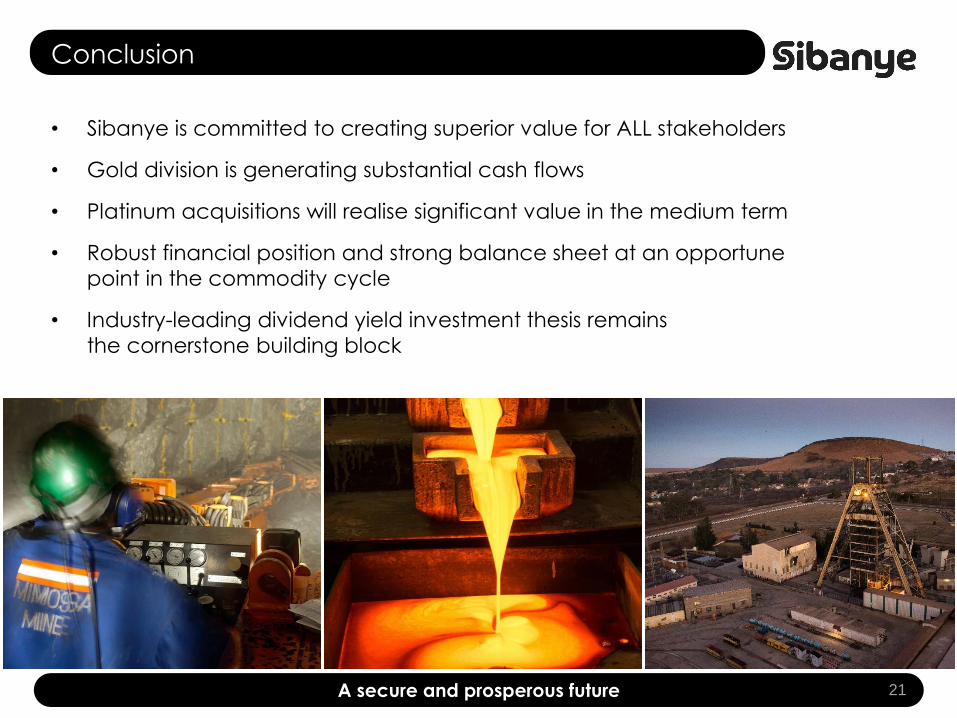
Conclusion
• Sibanye is committed to creating superior value for ALL stakeholders
• Gold division is generating substantial cash flows
• Platinum acquisitions will realise significant value in the medium term
• Robust financial position and strong balance sheet at an opportune
point in the commodity cycle
• Industry-leading dividend yield investment thesis remains
the cornerstone building block
21A secure and prosperous future
Questions


![ORDER - justice.gov.za · Neutral citation: Black Sash Trust v Minister of Social Development and Others [2017] ZACC 8 Coram: Mogoeng CJ, Nkabinde ADCJ, Cameron J, Froneman J, Jafta](https://static.documents.pub/doc/80x56/5b6e2bb37f8b9a962a8dc83c/order-neutral-citation-black-sash-trust-v-minister-of-social-development.jpg)