78
Version 8.0 Updated January 2002 U.S. Department of Transportation Federal Highway Administration Superpave Asphalt Mixture Design Workshop Workbook
Version 8.0Updated January 2002
U.S. Department of Transportation Federal Highway Administration
Superpave Asphalt Mixture Design
WorkshopWorkbook

SUPERPAVE
Superpave
Asphalt Mixture Design
Workshop
Developed by the Asphalt Team
Thomas Harman (202) 493-3072Federal Highway Administration, HRDI-11
6300 Georgetown Pike, McLean, VA 22101
John D'Angelo (202) 366-0121John Bukowski (202) 366-1287
Federal Highway Administration, HIPT-10400 Seventh Street, S. W., Washington, DC 20590
In conjunction with
Charles Paugh
With excerpts from
FHWA National Asphalt Training Center Training Manuals,Asphalt Institute MS & SP Series, &
SUPERPAVE
Superpave Lead States Guidelines.
This workshop is intended to demonstrate the Superpave asphalt mixture designsystem developed by the Strategic Highway Research Program (SHRP). Thisworkshop includes the latest recommendations of the Superpave Lead States and theMixture/Aggregate & Binder Expert Task Groups.
Very special thanks to:

SUPERPAVE
Dr. Aroon Shenoy, Ph.D.Editor & Friend

SUPERPAVE
TABLE OF CONTENTS
FOREWORD . . . . . . . . . . . . . . . . . . . . . . . . . . . . . . . . . . . . . . . . . . . . . . . . . . . . . . . . . . . . . . . . . 1
INTRODUCTION . . . . . . . . . . . . . . . . . . . . . . . . . . . . . . . . . . . . . . . . . . . . . . . . . . . . . . . . . . . . . 1Background of SHRP . . . . . . . . . . . . . . . . . . . . . . . . . . . . . . . . . . . . . . . . . . . . . . . . . . . . . 1SHRP Implementation . . . . . . . . . . . . . . . . . . . . . . . . . . . . . . . . . . . . . . . . . . . . . . . . . . . . . 2
SUPERPAVE OVERVIEW . . . . . . . . . . . . . . . . . . . . . . . . . . . . . . . . . . . . . . . . . . . . . . . . . . . . . . 3Simulation Background . . . . . . . . . . . . . . . . . . . . . . . . . . . . . . . . . . . . . . . . . . . . . . . . . . . . . 5
SELECTION OF MATERIALS . . . . . . . . . . . . . . . . . . . . . . . . . . . . . . . . . . . . . . . . . . . . . . . . . . . 6Binder Tests Required for Mixture Design . . . . . . . . . . . . . . . . . . . . . . . . . . . . . . . . . . . . . . 13Aggregate Selection . . . . . . . . . . . . . . . . . . . . . . . . . . . . . . . . . . . . . . . . . . . . . . . . . . . . . . 17CONSENSUS PROPERTY STANDARDS . . . . . . . . . . . . . . . . . . . . . . . . . . . . . . . . . . . 18
Coarse Aggregate Angularity (ASTM D 5821) . . . . . . . . . . . . . . . . . . . . . . . . . . . . 18Uncompacted Void Content of Fine Aggregate (AASHTO TP33) . . . . . . . . . . . . . 19Flat or Elongated Particles in Coarse Aggregate (ASTM D 4791) . . . . . . . . . . . . . . 19Sand Equivalent Test (AASHTO T 176) . . . . . . . . . . . . . . . . . . . . . . . . . . . . . . . . 20
SOURCE PROPERTY STANDARDS . . . . . . . . . . . . . . . . . . . . . . . . . . . . . . . . . . . . . . . 27L.A. Abrasion (AASHTO T 96) . . . . . . . . . . . . . . . . . . . . . . . . . . . . . . . . . . . . . . 27Sulfate Soundness (AASHTO T 104) . . . . . . . . . . . . . . . . . . . . . . . . . . . . . . . . . . . 27Clay Lumps and Friable Particles (AASHTO T 112) . . . . . . . . . . . . . . . . . . . . . . . 28
SELECTION OF A DESIGN AGGREGATE STRUCTURE . . . . . . . . . . . . . . . . . . . . . . . . . . . . 29
SELECTION OF THE DESIGN ASPHALT BINDER CONTENT . . . . . . . . . . . . . . . . . . . . . . . 57
EVALUATION OF MOISTURE SENSITIVITY AASHTO T-283 . . . . . . . . . . . . . . . . . . . . . . . 62
APPENDICES . . . . . . . . . . . . . . . . . . . . . . . . . . . . . . . . . . . . . . . . . . . . . . . . . . . . . . . . . . . . . . . 63MIXING AND COMPACTION TEMPERATURE DETERMINATION . . . . . . . . . . . . . 64

SUPERPAVE
LIST OF TABLES
MP-2, Table 1 - Binder Selection on the Basis of Traffic Speed and Traffic Level . . . . . . . . . . . . . . . 8Superpave Performance Grades (PG) . . . . . . . . . . . . . . . . . . . . . . . . . . . . . . . . . . . . . . . . . . . . . . . . 9Binder Specification Test Results . . . . . . . . . . . . . . . . . . . . . . . . . . . . . . . . . . . . . . . . . . . . . . . . . . 11Aggregate Stockpiles . . . . . . . . . . . . . . . . . . . . . . . . . . . . . . . . . . . . . . . . . . . . . . . . . . . . . . . . . . . 17Aggregate Tests . . . . . . . . . . . . . . . . . . . . . . . . . . . . . . . . . . . . . . . . . . . . . . . . . . . . . . . . . . . . . . . 18MP-2, Table 4 - Superpave Aggregate Consensus Property Requirements . . . . . . . . . . . . . . . . . . . 21Simulation Study Test Results (ASTM D 5821), CAA . . . . . . . . . . . . . . . . . . . . . . . . . . . . . . . . . . 22Simulation Study Test Results (AASHTO TP 33), FAA . . . . . . . . . . . . . . . . . . . . . . . . . . . . . . . . . 22Simulation Study Test Results (ASTM D 4791), F&E . . . . . . . . . . . . . . . . . . . . . . . . . . . . . . . . . . . 23Simulation Study Test Results (AASHTO T 176), SE . . . . . . . . . . . . . . . . . . . . . . . . . . . . . . . . . . . 23Superpave Aggregate Gradation Requirements . . . . . . . . . . . . . . . . . . . . . . . . . . . . . . . . . . . . . . . . 31Develop Trial Blends . . . . . . . . . . . . . . . . . . . . . . . . . . . . . . . . . . . . . . . . . . . . . . . . . . . . . . . . . . . 32Huber’s Method - Trial Blend No. 1 . . . . . . . . . . . . . . . . . . . . . . . . . . . . . . . . . . . . . . . . . . . . . . . 35Summary of Actual Stockpile and Estimated Blend Properties . . . . . . . . . . . . . . . . . . . . . . . . . . . . . 35Estimated Effective Specific Gravities . . . . . . . . . . . . . . . . . . . . . . . . . . . . . . . . . . . . . . . . . . . . . . . 37Estimated Volume of Absorbed Binder . . . . . . . . . . . . . . . . . . . . . . . . . . . . . . . . . . . . . . . . . . . . . . 37Estimated Weight of Aggregate and Percent of Binder . . . . . . . . . . . . . . . . . . . . . . . . . . . . . . . . . . . 38Required Tests . . . . . . . . . . . . . . . . . . . . . . . . . . . . . . . . . . . . . . . . . . . . . . . . . . . . . . . . . . . . . . . . 39PP-28, Table 1 - Superpave Gyratory Compaction Effort . . . . . . . . . . . . . . . . . . . . . . . . . . . . . . . . 43PP-35, Table 2 - Superpave Volumetric Mixture Design Requirements . . . . . . . . . . . . . . . . . . . . . . 44PP-28, Table 4 - Selection of a Design Aggregate Structure (Example) . . . . . . . . . . . . . . . . . . . . . 45Summary of Project Volumetric Criteria . . . . . . . . . . . . . . . . . . . . . . . . . . . . . . . . . . . . . . . . . . . . . 46Trial Blend No. 1: Specimen Compaction & Height Data . . . . . . . . . . . . . . . . . . . . . . . . . . . . . . . . 49Trial Blend No. 1 Compaction Results . . . . . . . . . . . . . . . . . . . . . . . . . . . . . . . . . . . . . . . . . . . . . . 49Trial Blend No. 1 Compaction Results . . . . . . . . . . . . . . . . . . . . . . . . . . . . . . . . . . . . . . . . . . . . . . 51Summary Superpave Gyratory Compaction Results . . . . . . . . . . . . . . . . . . . . . . . . . . . . . . . . . . . . 53Summary of Estimated Properties at 4 % Va . . . . . . . . . . . . . . . . . . . . . . . . . . . . . . . . . . . . . . . . . . 55Required Tests . . . . . . . . . . . . . . . . . . . . . . . . . . . . . . . . . . . . . . . . . . . . . . . . . . . . . . . . . . . . . . . . 57Compaction Test Results . . . . . . . . . . . . . . . . . . . . . . . . . . . . . . . . . . . . . . . . . . . . . . . . . . . . . . . . 59Volumetric Test Results at Ndesign . . . . . . . . . . . . . . . . . . . . . . . . . . . . . . . . . . . . . . . . . . . . . . . . . . 60Summary of Design Mixture Properties at 5.4 % AC (Pb ) . . . . . . . . . . . . . . . . . . . . . . . . . . . . . . . . 60AASHTO T 283 Results . . . . . . . . . . . . . . . . . . . . . . . . . . . . . . . . . . . . . . . . . . . . . . . . . . . . . . . . 62

SUPERPAVE
LIST OF FIGURES
ASTM D 4791 . . . . . . . . . . . . . . . . . . . . . . . . . . . . . . . . . . . . . . . . . . . . . . . . . . . . . . . . . . . . . . . 20AASHTO T 176 . . . . . . . . . . . . . . . . . . . . . . . . . . . . . . . . . . . . . . . . . . . . . . . . . . . . . . . . . . . . . . 20Trial Blends 0.45 Power Chart . . . . . . . . . . . . . . . . . . . . . . . . . . . . . . . . . . . . . . . . . . . . . . . . . . . . 33Gyratory Compaction Graph . . . . . . . . . . . . . . . . . . . . . . . . . . . . . . . . . . . . . . . . . . . . . . . . . . . . . 47Gyratory Compaction Data . . . . . . . . . . . . . . . . . . . . . . . . . . . . . . . . . . . . . . . . . . . . . . . . . . . . . . 51Trial Blend Gyratory Compaction Curves . . . . . . . . . . . . . . . . . . . . . . . . . . . . . . . . . . . . . . . . . . . . 53Design Gyratory Compaction Curves . . . . . . . . . . . . . . . . . . . . . . . . . . . . . . . . . . . . . . . . . . . . . . . 58

SUPERPAVE
Superpave AsphaltMixture Design
SUPERPAVEWorkbook: Introduction Page 1
FOREWORD
The focus of this workbook is to provide engineers and technicians with adetailed example of Superpave Volumetric asphalt mixture design.
INTRODUCTION
a. Background of SHRP
The Strategic Highway Research Program (SHRP) was established by Congress in 1987as a five-year, $150 million dollars, product driven, research program to improve thequality, efficiency, performance, and productivity of our nation's highways and to makethem safer for motorists and highway workers. It was developed in partnership withStates, American Association of State Highway and Transportation Officials (AASHTO),Transportation Research Board (TRB), Industry, and Federal Highway Administration(FHWA). SHRP research focused on asphalt (liquids and mixtures), concrete &structures, highway operations, and long-term pavement performance (LTPP).
SUPERPAVEWorkbook: Introduction Page 2
b. SHRP Implementation
As a follow-up program to SHRP, Congress authorized $108 million over six years as partof the Intermodal Surface Transportation Efficiency Act (ISTEA) of 1991, to establishprograms to implement SHRP products and to continue SHRP's LTPP program. TheFHWA was given the responsibility of directing the implementation efforts to facilitate theapplication of the research findings. Several concurrent efforts were undertaken including:
(1) TRB Superpave Committee(2) TRB Expert Task Groups:
(a) Asphalt Binder(b) Asphalt Mixture/Aggregate(c) Communications(d) Superpave Models - NCHRP 9-19
(3) Pooled Fund Equipment Buys - Nearly Completed(4) National Asphalt Training Center - Completed(5) Mobile Superpave Laboratory(6) Equipment Loan Program - Completed(7) Expert Technical Assistance(8) Superpave Regional Centers(9) Superpave Models Contract - NCHRP 9-19(10) Superpave Lead States - Twilighted Sept. 00
In 1998, Congress enacted the Transportation Equity Act for the 21st Century (TEA21).Although TEA21 encourages the continued implementation of SHRP technologies, nospecific funding is provided. To address this shortfall in funding the FHWA, AASHTO,TRB, and NCHRP approached the States to fund critical Superpave activities withNCHRP funding. The Asphalt TWG has been replace by the TRB Superpave Committee.The ETG’s have also been transferred to TRB for management. FHWA will continue toprovide expert technical assistance.

SUPERPAVEWorkbook: Introduction Page 3
SUPERPAVE OVERVIEW
The final product of the SHRP asphalt program area is Superpave. Superpave is an acronym which standsfor:
Superior Performing Asphalt Pavements.
Superpave is a performance-related asphalt binder and mixture specification. Superpave is not just acomputer software package, nor just a binder specification, nor just a mixture design and analysis tool.Superpave is a system which is inclusive of all these parts.
Superpave mixture design provides for a functional selection, blending, and volumetric analysis of proposedmaterials, along with an evaluation of moisture sensitivity. There are four steps in mixture design:
Î Selection of Materials,
Ï Selection of a Design Aggregate Structure,
Ð Selection of the Design Asphalt Binder Content, and
Ñ Evaluation of Moisture Sensitivity of the Design Mixture.
Criteria for materials selection and compaction are a function of three factors:
a. Environment,b. Traffic, andc. Pavement Structure.
Binder selection is based on environmental data, traffic level and traffic speed. Aggregate selection is basedupon layer location, traffic level, and traffic speed.
Selection of the design aggregate structure (design blend) consists of determining the aggregate stockpileproportions and corresponding combined gradations of the mix design. The design aggregate structure,when blended at the optimum asphalt binder content, should yield acceptable volumetric properties basedon the established criteria.

SUPERPAVEWorkbook: Introduction Page 4
Selection of the design (optimum) asphalt binder content consists of varying the amount of asphalt binderin the design aggregate structure to obtain acceptable volumetric properties when compared to theestablished mixture criteria. It also provides a feel for the sensitivity of the design properties to changes inthe asphalt binder content during production.
Evaluation of moisture sensitivity consists of testing the design mixture by AASHTO T-283, or other Statespecified method, to determine if the mixture will be susceptible to moisture damage.

SUPERPAVEWorkbook: Step 1- Selection of Materials Page 5
Simulation Background
a. This simulated project is located in the city of Hot Mix, USA.
b. The estimated, 20-year, design traffic for this project is 6,300,000ESAL80-kN, (18-kip ESAL = 80-kN ESAL).
c. The posted traffic speed for the design section is 80 kilometers per hour,kph (50 mph). The estimated actual average speed for this section,accounting for speeding and rush hour, is 72 kph (45 mph).
d. The mix is a surface course (such that the top of this pavement layer fromthe surface is less than 100 millimeters).
The project location in conjunction with the Weather Database will provide the minimum pavementtemperature, the maximum pavement temperature, and the maximum air temperature. The estimated trafficand project temperature data, in combination with the layer location will establish the material andcompaction criteria.
Update: All Superpave mixes are designed volumetrically. Currently under NCHRP study 9-19,“Superpave Models Development,” being conducted by the University of Marylandand the University of Arizona, a simple performance test is being identified/developed.The simple performance test will be used in conjunction with the Superpave volumetricmixture design. This test is intended to add an additional level of reliability to assuredesign mixes are able to resist the applied trafficking with minimal permanentdeformation (rutting).
SUPERPAVEWorkbook: Step 1- Selection of Materials Page 6
SELECTION OF MATERIALS
The performance grade (PG) binder required for the project is based on environmental data, traffic leveland traffic speed. The environmental data is obtained by converting historic air temperatures to pavementtemperatures. The SHRP researchers developed algorithms to convert high and low air temperatures topavement temperature. These algorithms have been refined and updated by LTPP:
Refinement
The original SHRP low-pavement-temperature algorithm did not correctly determine the low pavementtemperature from the air temperature. The FHWA LTPP program developed a newlow-pavement-temperature algorithm from their weather stations at over 30 sites all over North America.Data supporting the LTPP algorithm is presented in LTPP Seasonal Asphalt Concrete PavementTemperature Models, FHWA-RD-97-103, September, 1998.
LTPP High-Temperature Model with Reliability
T(pav) = 54.32+0.78 T(air) -0.0025 Lat ² -15.14 log10(H + 25)+z (9 +0.61 F air²)½
where: T(pav) = High pavement temperature below the surface, /CT(air) =High air temperature, /CLat = Latitude of the section, degreesH = Depth from surface, mmF air = Standard deviation of the high 7-day mean air temperature, /Cz = From the standard normal distribution table, z=2.055 for 98% reliability

SUPERPAVEWorkbook: Step 1- Selection of Materials Page 7
LTPP Low-Temperature Model with Reliability
T(pav) = -1.56+0.72 T(air) -0.004 Lat ² +6.26 log10(H + 25)-z (4.4 +0.52 F air²)½
where: T(pav) = Low pavement temperature below the surface, /CT(air) =Low air temperature, /CLat = Latitude of the section, degreesH = Depth from surface, mmF air = Standard deviation of the high 7-day mean air temperature, /Cz = From the standard normal distribution table, z=2.055 for 98% reliability
A complete report documenting the research is available entitled, “LTPP Seasonal Asphalt Concrete (AC)Pavement Temperature Models.” Publication No. FHWA-RD-97-103, September 1998.
SUPERPAVEWorkbook: Step 1- Selection of Materials Page 8
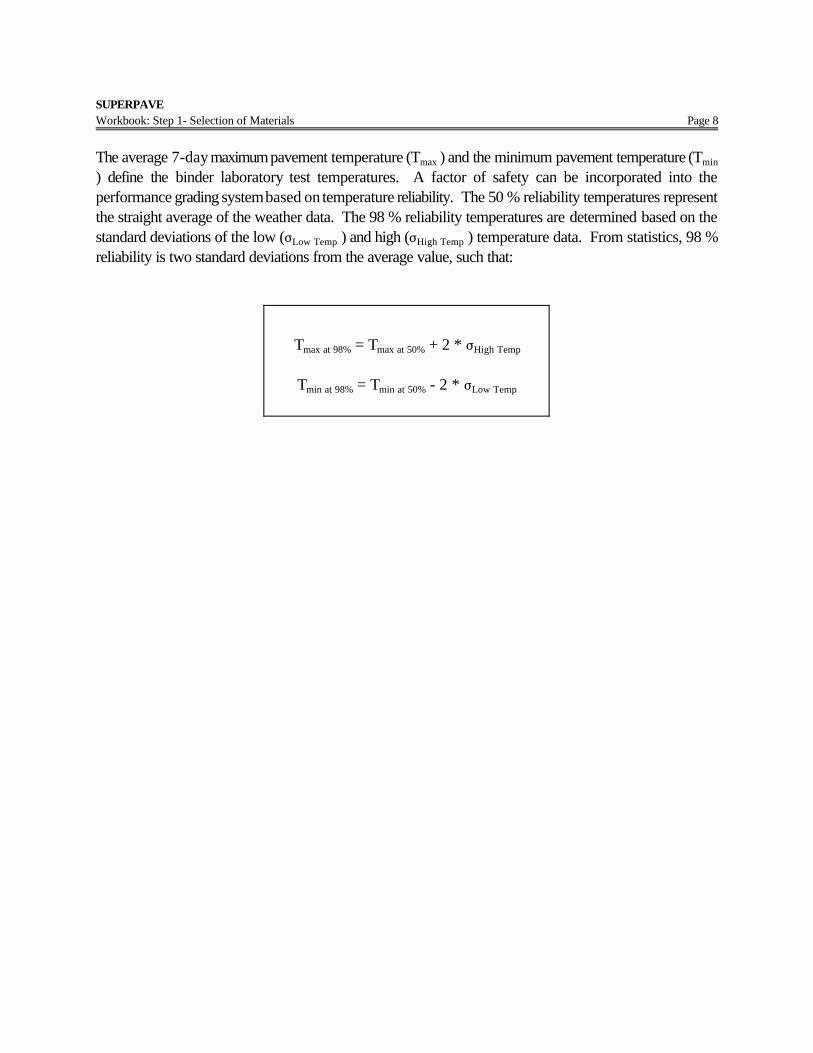
The average 7-day maximum pavement temperature (Tmax ) and the minimum pavement temperature (Tmin
) define the binder laboratory test temperatures. A factor of safety can be incorporated into theperformance grading system based on temperature reliability. The 50 % reliability temperatures representthe straight average of the weather data. The 98 % reliability temperatures are determined based on thestandard deviations of the low (FLow Temp ) and high (FHigh Temp ) temperature data. From statistics, 98 %reliability is two standard deviations from the average value, such that:
Tmax at 98% = Tmax at 50% + 2 * FHigh Temp
Tmin at 98% = Tmin at 50% - 2 * FLow Temp

SUPERPAVEWorkbook: Step 1- Selection of Materials Page 9
Grades
Mean
84%
97.5%
99.8%
54
56
58
50%52
58
58
58
52
-1-2-3 +3+2+1
High Temperature
Mean 52 degrees
STD 2 degrees
Page 12
-1-2-3 +3+2+1
Mean
84%
97.5%
99.8%
Normal Distribution
-21
-24
-27
50%-18
-22
-28
-28
-22
Low Temperature
Mean -18 degrees
STD 3 degrees
Pavement Temperature Distributions
Traffic level and speed are also considered in selecting the project performance grade (PG) binder eitherthrough reliability or “grade bumping.” A table is provided in AASHTO MP-2, “Standard Specificationfor Superpave Volumetric Mix Design,” to provide the designer with guidance on grade selection.
MP-2, Table 1 - Binder Selection on the Basis of Traffic Speed and Traffic Level
Design ESALs1
(million)
Adjustment to Binder PG Grade5
Traffic Load Rate
Standing2 Slow3 Standard4
< 0.3 -6 - -
0.3 to < 3 2 1 -
3 to < 10 2 1 -
SUPERPAVEWorkbook: Step 1- Selection of Materials Page 10
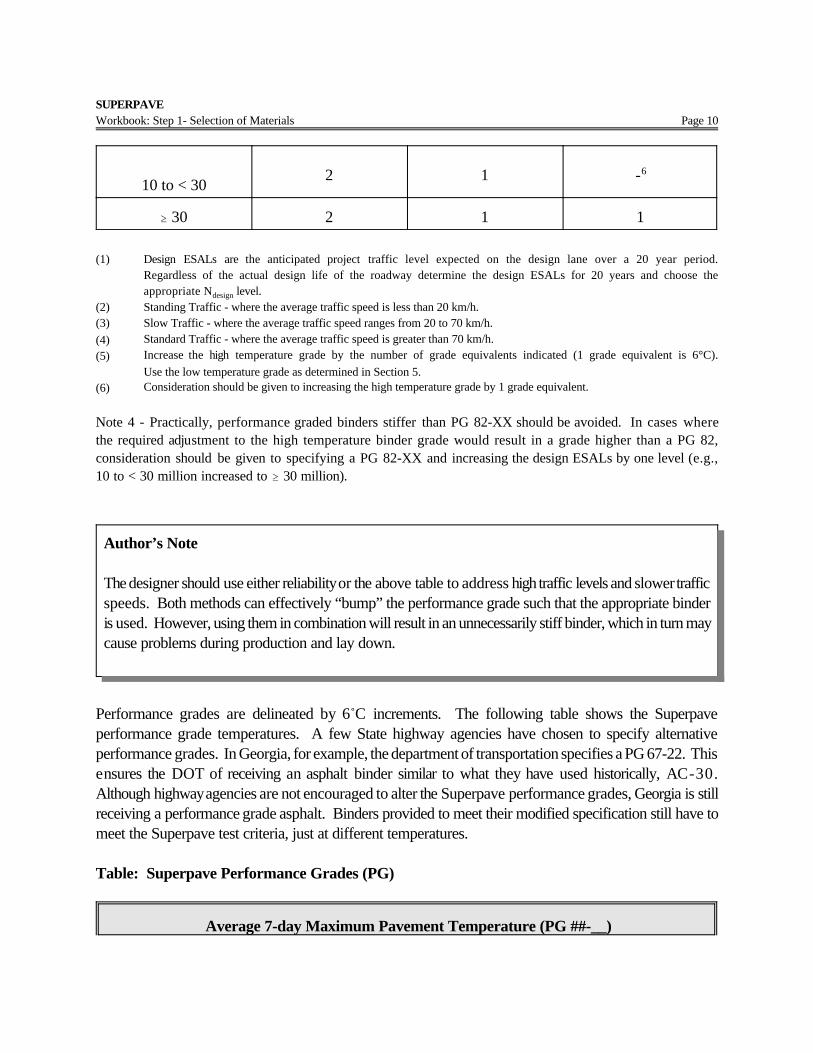
10 to < 302 1 -6
$ 30 2 1 1
(1) Design ESALs are the anticipated project traffic level expected on the design lane over a 20 year period.Regardless of the actual design life of the roadway determine the design ESALs for 20 years and choose theappropriate Ndesign level.
(2) Standing Traffic - where the average traffic speed is less than 20 km/h.(3) Slow Traffic - where the average traffic speed ranges from 20 to 70 km/h.(4) Standard Traffic - where the average traffic speed is greater than 70 km/h.(5) Increase the high temperature grade by the number of grade equivalents indicated (1 grade equivalent is 6°C).
Use the low temperature grade as determined in Section 5.(6) Consideration should be given to increasing the high temperature grade by 1 grade equivalent.
Note 4 - Practically, performance graded binders stiffer than PG 82-XX should be avoided. In cases wherethe required adjustment to the high temperature binder grade would result in a grade higher than a PG 82,consideration should be given to specifying a PG 82-XX and increasing the design ESALs by one level (e.g.,10 to < 30 million increased to $ 30 million).
Author’s Note
The designer should use either reliability or the above table to address high traffic levels and slower trafficspeeds. Both methods can effectively “bump” the performance grade such that the appropriate binderis used. However, using them in combination will result in an unnecessarily stiff binder, which in turn maycause problems during production and lay down.
Performance grades are delineated by 6/C increments. The following table shows the Superpaveperformance grade temperatures. A few State highway agencies have chosen to specify alternativeperformance grades. In Georgia, for example, the department of transportation specifies a PG 67-22. Thisensures the DOT of receiving an asphalt binder similar to what they have used historically, AC-30.Although highway agencies are not encouraged to alter the Superpave performance grades, Georgia is stillreceiving a performance grade asphalt. Binders provided to meet their modified specification still have tomeet the Superpave test criteria, just at different temperatures.
Table: Superpave Performance Grades (PG)
Average 7-day Maximum Pavement Temperature (PG ##-__)

SUPERPAVEWorkbook: Step 1- Selection of Materials Page 11
46°C 52°C 58°C 64°C 70°C 76°C 76°+ n6°
Minimum Pavement Temperature (PG __-##)
+2°C -4°C -10°C -16°C -22°C -28°C -28°-n6°

SUPERPAVEWorkbook: Step 1- Selection of Materials Page 12
For Hot Mix, USA, the following data is obtained from the project location and historical temperature data:a. Latitude is 41.1 degrees,b. 7-day average maximum air temperature is 33.0/C with a F of 2/C, andc. 1-day average minimum air temperature is -21.0/C with a F of 3/C.
From this data the high and low pavement temperature are determined at a depth of 20 mm:
High pavement temperature 50.8/CLow pavement temperature -14.7/C
PG 52-16 at 50% reliabilityPG 58-22 at 98% reliability
Q. Does the project traffic level of 6.3 million ESAL’s warrant an increase in the high temperatureperformance grade?a. Yes, orb. No.
Q. Does the estimated average speed of 72 kph warrant an increase in the high temperatureperformance grade?a. Yes, orb. No.
For Hot Mix, USA, the 50 % reliability performance grade is a PG 52-16. The project traffic level andspeed do not require grade bumping. However, the traffic speed is just above the threshold for gradebumping and historically in this area pavements have shown susceptibility to low-temperature cracking.Such that, the agency shall require a PG 58-22.

SUPERPAVEWorkbook: Step 1- Selection of Materials Page 13
Binder Selection
The project asphalt binder is tested for specification compliance to the Superpave PG system.
Project Binder: PG 58-22Binder Source: Asphalt is Us
Table: Binder Specification Test Results
Test Property Results Criteria
Original Binder
Flash Point n/a
Rotational Viscometer 135°C
Rotational Viscometer 165°C
Dynamic Shear Rheometer, G*/sin * 58°C
310 /C
0.364 Pa-s
0.100 Pa-s
1.7 kPa
$ 230°C
# 3 Pa-s
n/a
$ 1.0 kPa
RTFO Residue - Aged Binder
Mass Loss n/a
Dynamic Shear Rheometer, G*/sin * 58°C
0.4 %
2.8 kPa
# 1.0 %
$ 2.2 kPa
RTFO + PAV Residue - Aged Binder
Dynamic Shear Rheometer, G* sin * 22°C
Bending Beam Rheometer, Stiffness -12°C
Bending Beam Rheometer, m-value -12°C
3.4 MPa
280 MPa
0.334
# 5 MPa
# 300 MPa
$ 0.300
SUPERPAVEWorkbook: Step 1- Selection of Materials Page 14
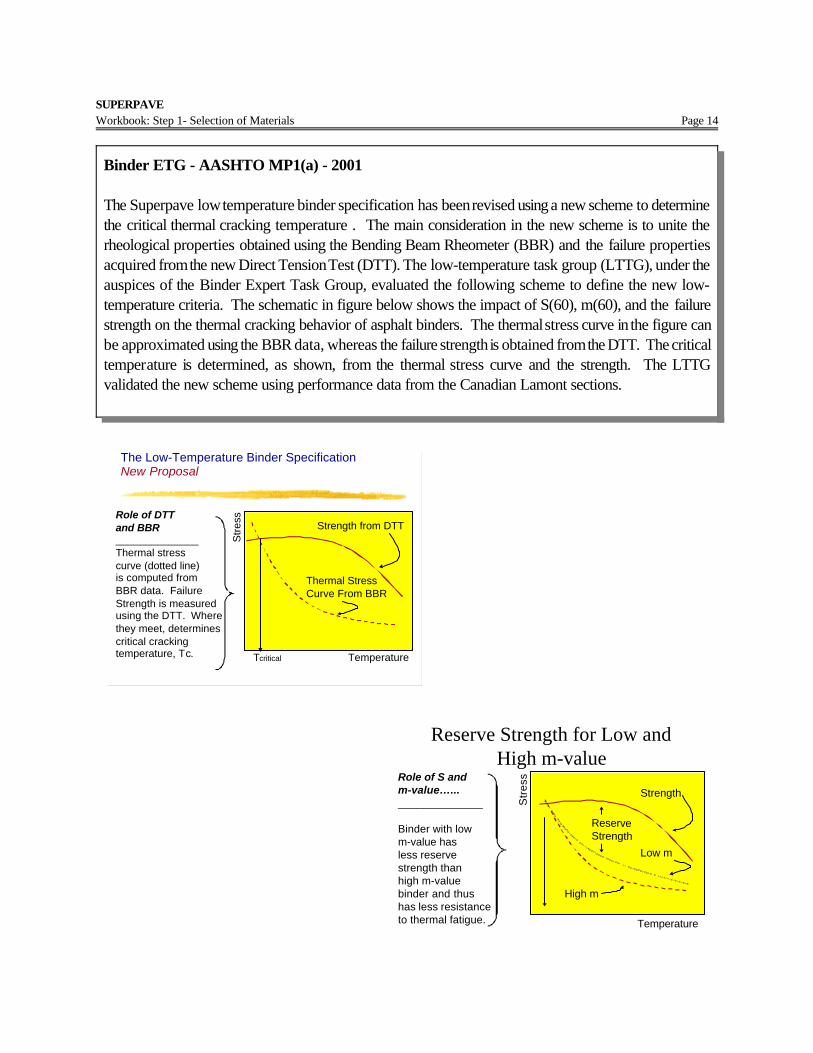
The Low-Temperature Binder SpecificationNew Proposal
Str
ess
Temperature
Thermal StressCurve From BBR
Strength from DTTRole of DTTand BBR______________Thermal stress curve (dotted line)is computed fromBBR data. FailureStrength is measuredusing the DTT. Wherethey meet, determinescritical cracking temperature, Tc. Tcritical
Reserve Strength for Low andHigh m-value
Str
ess
Temperature
Low m
High m
StrengthRole of S andm-value…...______________
Binder with low m-value hasless reserve strength than high m-valuebinder and thus has less resistance to thermal fatigue.
ReserveStrength
Binder ETG - AASHTO MP1(a) - 2001
The Superpave low temperature binder specification has been revised using a new scheme to determinethe critical thermal cracking temperature . The main consideration in the new scheme is to unite therheological properties obtained using the Bending Beam Rheometer (BBR) and the failure propertiesacquired from the new Direct Tension Test (DTT). The low-temperature task group (LTTG), under theauspices of the Binder Expert Task Group, evaluated the following scheme to define the new low-temperature criteria. The schematic in figure below shows the impact of S(60), m(60), and the failurestrength on the thermal cracking behavior of asphalt binders. The thermal stress curve in the figure canbe approximated using the BBR data, whereas the failure strength is obtained from the DTT. The criticaltemperature is determined, as shown, from the thermal stress curve and the strength. The LTTGvalidated the new scheme using performance data from the Canadian Lamont sections.

SUPERPAVEWorkbook: Step 1- Selection of Materials Page 15
Binder Tests Required for Mixture Design
The rotational viscometer (Brookfield™ ), as part of the binder specification, is performed on theoriginal/unconditioned binder at 135°C. The specification recommends all binders to have a viscosity lessthan 3 Pascal-seconds (Pa-s). This is to ensure pump-ability during production. For mixture design, therotational viscometer must be run at a second temperature, typically 160°C. This is done in order todetermine the proper mixing and compaction temperatures. SHRP adopted the Asphalt Institute mixingand compaction guidelines base on the temperature-viscosity relationship of the binder, where:
Range for mixing =150 to 190 centiStokes
Range for compaction =250 to 310 centiStokes
The rotational viscometer measures viscosity in centipoises (cP) and the values are reported in Pascal-seconds (Pa-s). The conversion from centipoises to Pascal-seconds is as follows:
1 Pa-s = 1000 centipoises
The relationship between centiStokes and Pascal-seconds (or centipoises) is a function of the asphalt binderspecific gravity. The specific gravity of an asphalt binder is a function of temperature. The asphalt binderspecific gravity (Gb ) is determined according to AASHTO T 228 and is typically measured at 25°C.Tables of Gb temperature correction factors have been developed to adjust Gb over a range oftemperatures. The following equation has been determined from these tables:
Correction Factor, CF = -0.0006 (Ttest ) + 1.0135
where: CF is the correction factor, andTtest is the test temperature in °C.
Such that the conversion from centipoises or Pascal-seconds to centiStokes is performed as follows:
SUPERPAVEWorkbook: Step 1- Selection of Materials Page 16
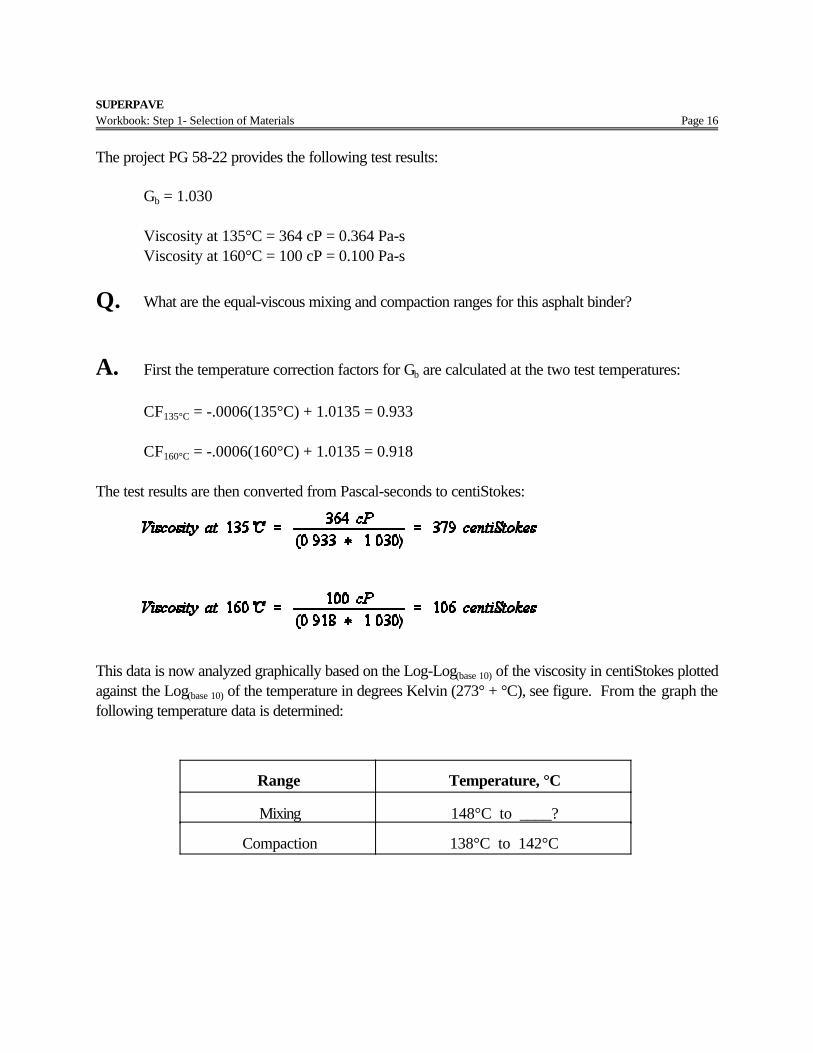
The project PG 58-22 provides the following test results:
Gb = 1.030
Viscosity at 135°C = 364 cP = 0.364 Pa-sViscosity at 160°C = 100 cP = 0.100 Pa-s
Q. What are the equal-viscous mixing and compaction ranges for this asphalt binder?
A. First the temperature correction factors for Gb are calculated at the two test temperatures:
CF135°C = -.0006(135°C) + 1.0135 = 0.933
CF160°C = -.0006(160°C) + 1.0135 = 0.918
The test results are then converted from Pascal-seconds to centiStokes:
This data is now analyzed graphically based on the Log-Log(base 10) of the viscosity in centiStokes plottedagainst the Log(base 10) of the temperature in degrees Kelvin (273° + °C), see figure. From the graph thefollowing temperature data is determined:
Range Temperature, °C
Mixing 148°C to ____?
Compaction 138°C to 142°C

SUPERPAVEWorkbook: Step 1- Selection of Materials Page 17
Temperature - Viscosity Chart
2.60 2.62 2.64 2.660.28
0.30
0.32
0.34
0.36
0.38
0.40
0.42
Log of Absolute Temperature, shown in °C
Log
- Log
of V
isco
sity
, sho
wn
in c
entiS
toke
s
120° 125° 130° 135° 140° 145° 150° 155° 160° 165° 170° 175° 180° 185° 190°
Mixing Range
Compaction Range
80
90
100
110
120
130
140
150
170
190
210
230
250
270290310
350
400
SUPERPAVEWorkbook: Step 1- Selection of Materials Page 18
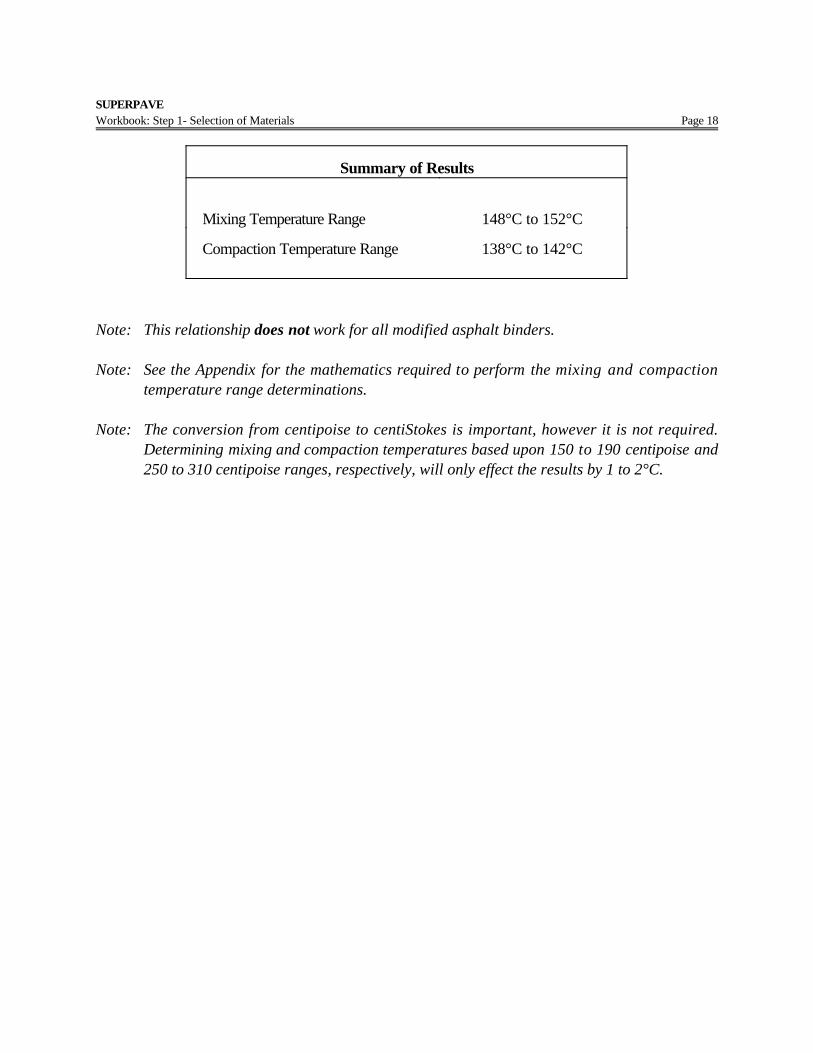
Summary of Results
Mixing Temperature Range 148°C to 152°C
Compaction Temperature Range 138°C to 142°C
Note: This relationship does not work for all modified asphalt binders.
Note: See the Appendix for the mathematics required to perform the mixing and compactiontemperature range determinations.
Note: The conversion from centipoise to centiStokes is important, however it is not required.Determining mixing and compaction temperatures based upon 150 to 190 centipoise and250 to 310 centipoise ranges, respectively, will only effect the results by 1 to 2°C.

SUPERPAVEWorkbook: Step 1- Selection of Materials Page 19
Aggregate Selection
Superpave utilizes a completely new system for testing, specifying, and selectingasphalt binders. While no new aggregate tests were developed, current methodsof selecting and specifying aggregates were refined and incorporated into theSuperpave design system. Superpave asphalt mixture requirements wereestablished from currently used criteria.
For this simulated project, four (4) stockpiles of materials consisting of two (2) coarse materials and two(2) fine materials are employed. Representative samples of the materials are obtained, and washed sieveanalysis is performed for each aggregate. The gradation results are shown in the Aggregate BlendingSection.
The specific gravities (bulk Gsb and apparent Gsa ) are determined for each aggregate. The specific gravitiesare used in trial binder content and Voids in Mineral Aggregate (VMA) calculations.
Table: Aggregate Stockpiles
Aggregate Stockpile Bulk, Gsb Apparent, Gsa
Coarse AggregateIntermediate AggregateManufactured FinesNatural Fines
2.5672.5872.5012.598
2.6802.7242.6502.673
In addition to sieve analysis and specific gravity determinations, Superpave requires certain consensus andsource aggregate tests be performed to assure that the combined aggregates selected for the mix designare acceptable. The consensus property criteria are fixed in the Superpave design system; these areminimum requirements which should be adhered to regardless of geographic location. The source propertycriteria are specified by the State highway agency. Superpave recommends three source property testswhich should be included in the aggregate selection process.
SUPERPAVEWorkbook: Step 1- Selection of Materials Page 20
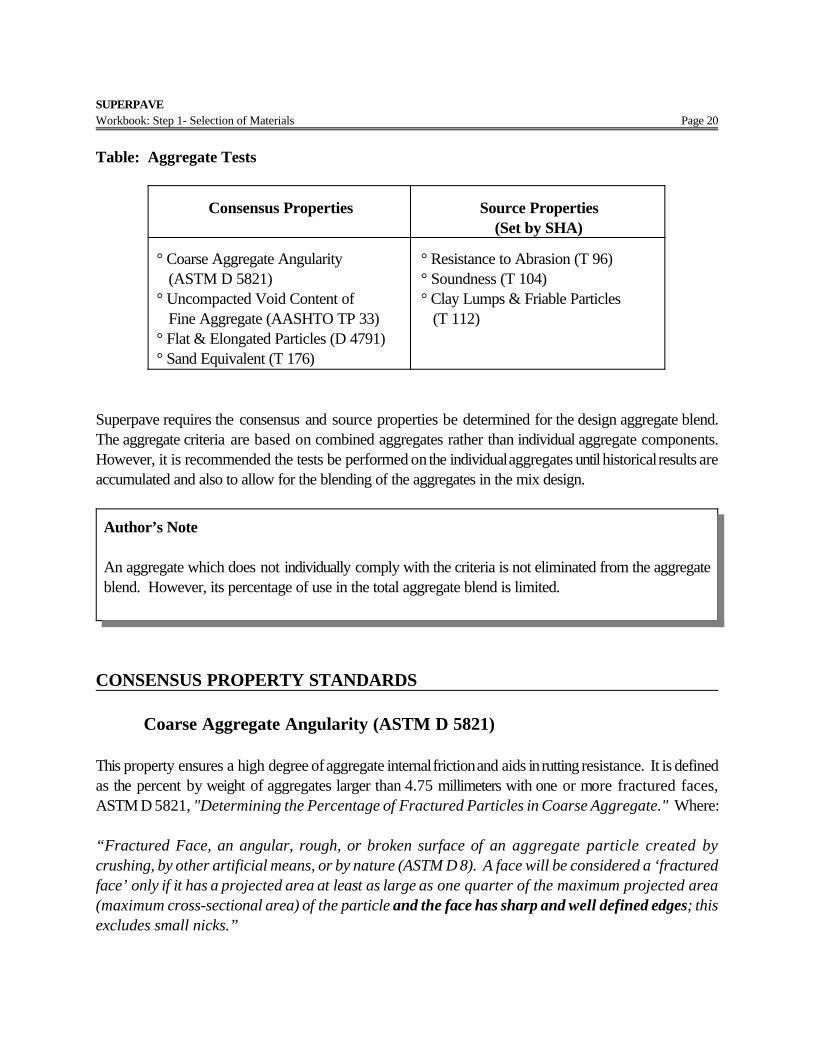
Table: Aggregate Tests
Consensus Properties Source Properties(Set by SHA)
° Coarse Aggregate Angularity (ASTM D 5821)° Uncompacted Void Content of Fine Aggregate (AASHTO TP 33)° Flat & Elongated Particles (D 4791)° Sand Equivalent (T 176)
° Resistance to Abrasion (T 96)° Soundness (T 104)° Clay Lumps & Friable Particles (T 112)
Superpave requires the consensus and source properties be determined for the design aggregate blend.The aggregate criteria are based on combined aggregates rather than individual aggregate components.However, it is recommended the tests be performed on the individual aggregates until historical results areaccumulated and also to allow for the blending of the aggregates in the mix design.
Author’s Note
An aggregate which does not individually comply with the criteria is not eliminated from the aggregateblend. However, its percentage of use in the total aggregate blend is limited.
CONSENSUS PROPERTY STANDARDS
Coarse Aggregate Angularity (ASTM D 5821)
This property ensures a high degree of aggregate internal friction and aids in rutting resistance. It is definedas the percent by weight of aggregates larger than 4.75 millimeters with one or more fractured faces,ASTM D 5821, "Determining the Percentage of Fractured Particles in Coarse Aggregate." Where:
“Fractured Face, an angular, rough, or broken surface of an aggregate particle created bycrushing, by other artificial means, or by nature (ASTM D 8). A face will be considered a ‘fracturedface’ only if it has a projected area at least as large as one quarter of the maximum projected area(maximum cross-sectional area) of the particle and the face has sharp and well defined edges; thisexcludes small nicks.”
SUPERPAVEWorkbook: Step 1- Selection of Materials Page 21
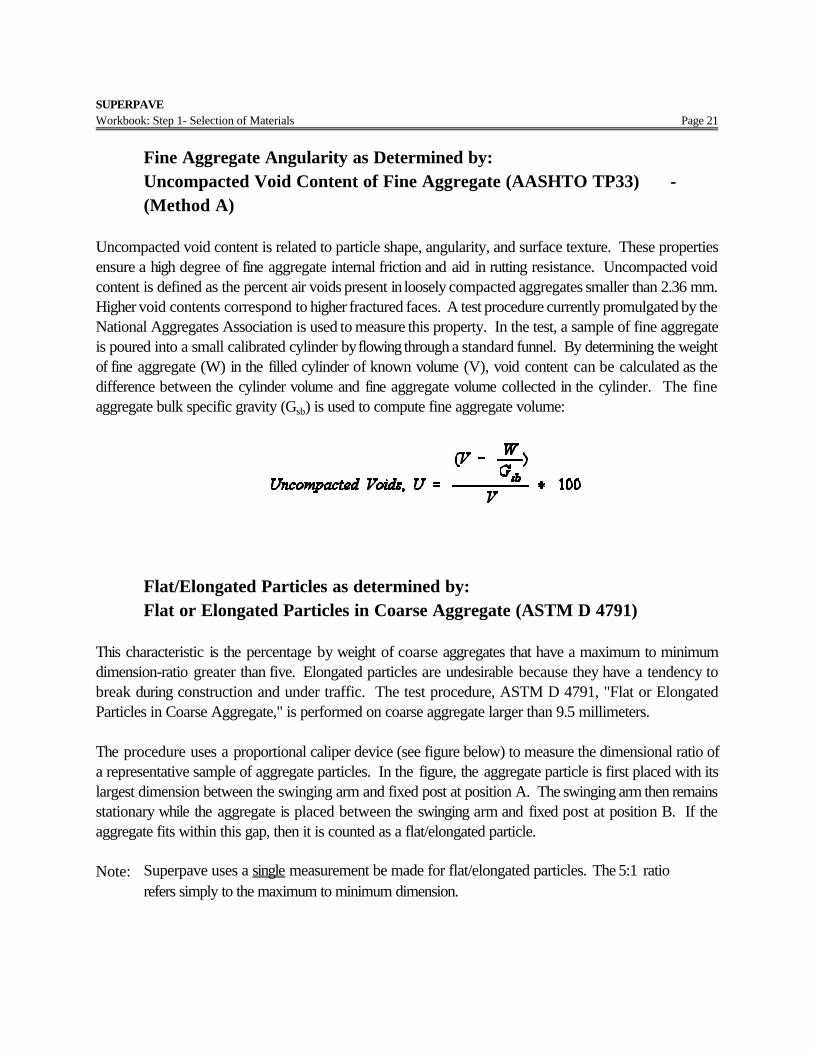
Fine Aggregate Angularity as Determined by:Uncompacted Void Content of Fine Aggregate (AASHTO TP33) -(Method A)
Uncompacted void content is related to particle shape, angularity, and surface texture. These propertiesensure a high degree of fine aggregate internal friction and aid in rutting resistance. Uncompacted voidcontent is defined as the percent air voids present in loosely compacted aggregates smaller than 2.36 mm.Higher void contents correspond to higher fractured faces. A test procedure currently promulgated by theNational Aggregates Association is used to measure this property. In the test, a sample of fine aggregateis poured into a small calibrated cylinder by flowing through a standard funnel. By determining the weightof fine aggregate (W) in the filled cylinder of known volume (V), void content can be calculated as thedifference between the cylinder volume and fine aggregate volume collected in the cylinder. The fineaggregate bulk specific gravity (Gsb) is used to compute fine aggregate volume:
Flat/Elongated Particles as determined by:Flat or Elongated Particles in Coarse Aggregate (ASTM D 4791)
This characteristic is the percentage by weight of coarse aggregates that have a maximum to minimumdimension-ratio greater than five. Elongated particles are undesirable because they have a tendency tobreak during construction and under traffic. The test procedure, ASTM D 4791, "Flat or ElongatedParticles in Coarse Aggregate," is performed on coarse aggregate larger than 9.5 millimeters.
The procedure uses a proportional caliper device (see figure below) to measure the dimensional ratio ofa representative sample of aggregate particles. In the figure, the aggregate particle is first placed with itslargest dimension between the swinging arm and fixed post at position A. The swinging arm then remainsstationary while the aggregate is placed between the swinging arm and fixed post at position B. If theaggregate fits within this gap, then it is counted as a flat/elongated particle.
Note: Superpave uses a single measurement be made for flat/elongated particles. The 5:1 ratiorefers simply to the maximum to minimum dimension.

SUPERPAVEWorkbook: Step 1- Selection of Materials Page 22
Figure: ASTM D 4791
Clay Content as determined by:Sand Equivalent Test (AASHTO T 176)
Clay content is the percentage of clay material contained in the aggregate fraction that is finer than a 4.75mm sieve. It is measured by AASHTO T 176, "Plastic Fines in Graded Aggregates and Soils by Use ofthe Sand Equivalent Test." In this test, a sample of fine aggregate is placed in a graduated cylinder with aflocculating solution and agitated to loosen clay fines present in and coating the aggregate. The flocculatingsolution forces the clay material into suspension above the granular aggregate. After a period that allowssedimentation, the cylinder height of suspended clay and sedimented sand is measured (figure below). Thesand equivalent value is computed as a ratio of the sand to clay height readings expressed as a percentage.
Figure: AASHTO T 176
Clay Content (Sand Equivalent, SE), -4.75 mm
SR - sand readingCR - clay reading

SUPERPAVEWorkbook: Step 1- Selection of Materials Page 23
MP-2, Table 4 - Superpave Aggregate Consensus Property Requirements
Design ESALs1
(million)
Coarse Aggregate Angularity(Percent),minimum
Uncompacted Void Contentof Fine Aggregate (Percent),
minimumSand
Equivalent(Percent),minimum
Flat andElongated3
(Percent),maximum
Depth from Surface Depth from Surface
# 100 mm > 100 mm # 100 mm > 100 mm
< 0.3 55/- -/- - - 40 -
0.3 to < 3 75/- 50/- 40 40 40
103 to < 10 85/802 60/- 45 40 45
10 < 30 95/90 80/75 45 40 45
$ 30 100/100 100/100 45 45 50
(1) Design ESALs are the anticipated project traffic level expected on the design lane over a 20-year period. Regardless of the actual design life ofthe roadway, determine the design ESALs for 20 years, and choose the appropriate Ndesign level.
(2) 85/80 denotes that 85 % of the coarse aggregate has one fractured face and 80 % has two or more fractured faces.(3) Criterion based upon a 5:1 maximum-to-minimum ratio.
Note 5 - If less than 25% of a layer is within 100 mm of the surface, the layer may be considered to be below 100 mm for mixture design purposes.

SUPERPAVEWorkbook: Step 1- Selection of Materials Page 24
Table: Simulation Study Test Results (ASTM D 5821), CAA
Stockpiles/Blends 1+ Fractured Criterion 2+ Fractured Criterion
Coarse AggregateIntermediate Aggregate
99 %80 %
__ % min 97 %60 %
__ % min
This test is commonly only performed on the coarse aggregates during the initial screening of materials, eventhough the fine aggregate stockpiles may contain a small percentage retained on the 4.75 millimeter sieve.This test should also be run on the plus 4.75 millimeter material of the final design aggregate blend.
Q. Based on the table, what is the criterion for this surface mixture with an estimated traffic of6,300,000 ESALs, (fill in the above table)?
Do both stockpiles meet the criteria, (Y/N)? If the answer is “no,” what does this mean?(1) Stockpile cannot be used. or(2) Percentage of stockpile in blend is limited.
Table: Simulation Study Test Results (AASHTO TP 33), FAA
Stockpiles/Blends % Air Voids Criterion
Manufactured FinesNatural Fines
48 42 $ __
Q. Based on the table, what is the criterion for this surface mixture with an estimated traffic of6,300,000 ESALs, (fill in the above table)?
Do both stockpiles meet the criteria, (Y/N)? If the answer is "no," what does this mean?a. Stockpile cannot be used. orb. Percentage of stockpile in blend is limited.

SUPERPAVEWorkbook: Step 1- Selection of Materials Page 25
Author’s Note
Fine aggregates with higher angularity may aid in the development of higher voids in mineralaggregate (VMA).
Table: Simulation Study Test Results (ASTM D 4791), F&E
Stockpiles/Blends % Elongated Criterion
Coarse AggregateIntermediate Agg.
9 %2 %
__ %
Q. Based on the table, what is the criterion for this surface mixture with an estimated traffic of6,300,000 ESALs, (fill in the above table)?
Do both stockpiles meet the criteria, (Y/N)? If the answer is "no," what does this mean?a. Stockpile cannot be used. orb. Percentage of stockpile in blend is limited.
Table: Simulation Study Test Results (AASHTO T 176), SE
Stockpiles/Blends Sand Equivalent Criterion
Manufactured FinesNatural FinesIntermediate Aggregate
51 %39 %45%
__ %
Q. Based on the table, what is the criterion for this surface mixture with an estimated traffic of6,300,000 ESALs, (fill in the above table)?
Do both stockpiles meet the criteria, (Y/N)? If the answer is "no," what does this mean?a. Stockpile cannot be used. orb. Percentage of stockpile in blend is limited.
SUPERPAVEWorkbook: Step 1- Selection of Materials Page 26
Lead States Recommendations
Aggregate Consensus Properties - If Superpave criteria allow the use of aggregates with lowerquality than previously used in a State, consideration should be given to maintaining the States’ morestringent requirements until all Superpave validation work is complete. With respect to specificaggregate consensus properties, the following is offered:
Coarse Aggregate Angularity - Previous references in SHRP reports and elsewhere to thePennsylvania Department of Transportation Test Method No. 621 for determining coarse aggregateangularity have been revised in AASHTO MP2, “Standard Specification for Superpave Volumetric MixDesign” to reference ASTM D5821, “Standard Test Method for Determining the Percentage ofFractured Particles in Coarse Aggregate,” to more critically discriminate between aggregates.
Fine Aggregate Angularity - Fine aggregate angularity should be determined in accordance withAASHTO TP-33, “Uncompacted Void Content of Fine Aggregate,” method A. The Lead Statesrecommend the current Superpave fine aggregate angularity requirement of 45 at greater-than 3 millionESALs and 40 at less-than 3 million ESALs be specified. It should be noted that the aggregate’s bulkspecific gravity is a critical factor in the determination of the fine aggregate angularity, therefore, this valueshould be determined on a frequency appropriate for the variability of the source.
SUPERPAVEWorkbook: Step 1- Selection of Materials Page 27
Flat-and-Elongated Particle Content - Excessive amounts of flat-and-elongated particles in a mixturecan potentially lead to production and placement problems. This includes problems with volumetrics(both during design and production), aggregate degradation, and compaction.
Current Superpave requirements (and other documentation) establish a 10% maximum flat-and-elongated particle content on material coarser than the 4.75 mm sieve when using a ratio of 5:1. Thisratio is determined by comparing the maximum to minimum dimension. These dimensions should bevisualized by circumscribed rectangular prisms around the aggregate. Testing is performed in accordancewith ASTM D 4791, “Flat Particles, Elongated Particles, or Flat and Elongated Particles in CoarseAggregate.” It should be noted D 4791 requires testing to be performed on material coarser than the 9.5mm sieve. Many believe testing aggregate passing the 9.5 mm sieve and retained on the 4.75 mm sievewill be very difficult and results highly variable. While this discrepancy is being addressed throughAASHTO and ASTM, the Lead States recommend the states be aware of this issue and basespecifications on their judgement of potential risks.
Many states have expressed concern that this criteria may not adequately discriminate between suitableand unsuitable aggregates and a 3:1 ratio should be specified. However, the relationship betweenflat-and-elongated particle content and performance has not been clearly established. There are currentlyseveral on-going research efforts attempting to establish this relationship.
Before changing the flat-and-elongated particle criteria to a 3:1 ratio, the Lead States recommend thatpast specifications and performance be considered. Further, until information is obtained relating flat-and-elongated particle content to performance, the maximum allowable value should not be set lowerthan 20%. This value is consistent with existing SMA criteria and has been used successfully in the past.Caution should be exercised when considering this change as it may significantly affect the use of certainmaterials which may otherwise prove to be suitable.
SUPERPAVEWorkbook: Step 1- Selection of Materials Page 28
1 2 3 4 5 6 7 8 9101112131415161718192021222324252627Stockpile
0
5
10
15
20
25
30
Perc
ent P
assi
ng
5:1 Ratio3:1 Ratio
Flat & Elongated Particles
5 10 15 20 25 30
Criteria (Maximum)
0
20
40
60
80
100
Perc
ent o
f Dat
a w
ithin
Cri
teri
a
3:1 Ratio5:1 Ratio
Flat & Elongated Particles
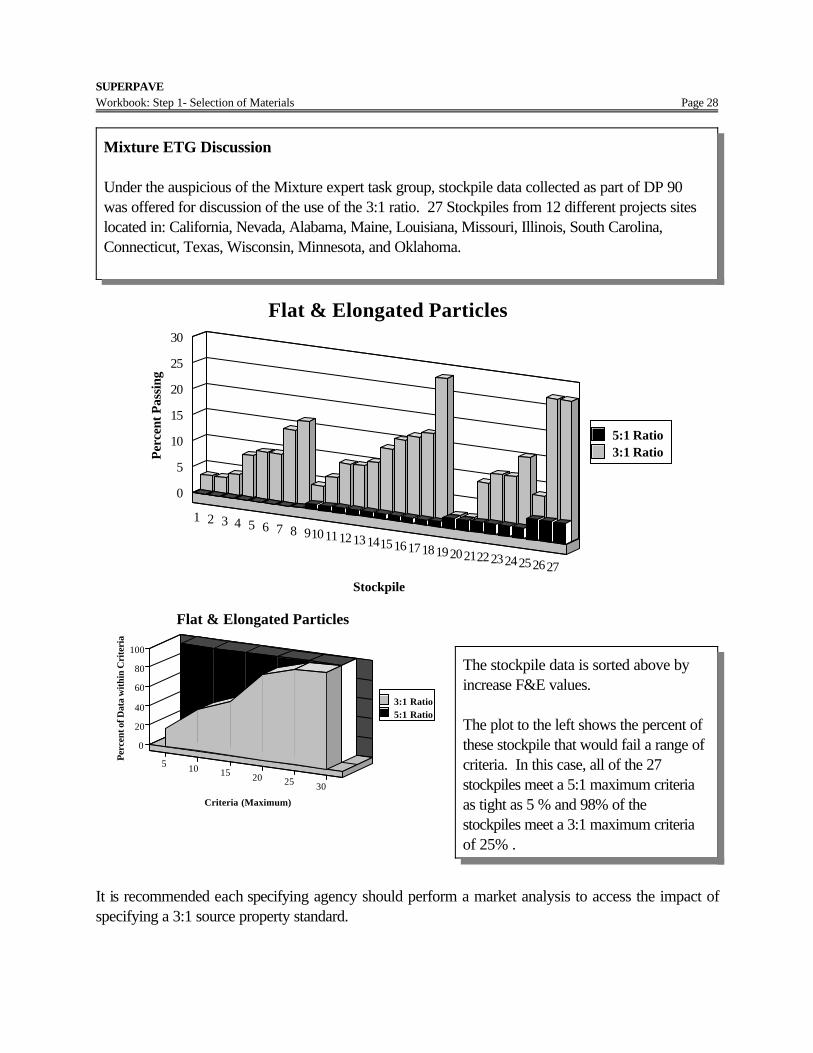
Mixture ETG Discussion
Under the auspicious of the Mixture expert task group, stockpile data collected as part of DP 90was offered for discussion of the use of the 3:1 ratio. 27 Stockpiles from 12 different projects siteslocated in: California, Nevada, Alabama, Maine, Louisiana, Missouri, Illinois, South Carolina,Connecticut, Texas, Wisconsin, Minnesota, and Oklahoma.
The stockpile data is sorted above byincrease F&E values.
The plot to the left shows the percent ofthese stockpile that would fail a range ofcriteria. In this case, all of the 27stockpiles meet a 5:1 maximum criteriaas tight as 5 % and 98% of thestockpiles meet a 3:1 maximum criteriaof 25% .
It is recommended each specifying agency should perform a market analysis to access the impact ofspecifying a 3:1 source property standard.

SUPERPAVEWorkbook: Step 1- Selection of Materials Page 29
SOURCE PROPERTY STANDARDS
Toughness as determined by:L.A. Abrasion (AASHTO T 96)
Toughness is the percent loss of materials from an aggregate blend during the Los Angeles Abrasion test.The procedure is stated in AASHTO T 96, "Resistance to Abrasion of Small Size Coarse Aggregate byUse of the Los Angeles Machine." This test estimates the resistance of coarse aggregate to abrasion andmechanical degradation during handling, construction, and service. It is performed by subjecting the coarseaggregate, usually larger than 2.36 mm, to impact and grinding by steel spheres. The test result is percentloss, which is the weighted percentage of coarse material lost during the test as a result of the mechanicaldegradation.
Maximum allowable loss values typically range from approximately 35 to 45 percent.
Soundness as determined by:Sulfate Soundness (AASHTO T 104)
Soundness is the percent loss of materials from an aggregate blend during the sodium or magnesium sulfatesoundness test. The procedure is stated in AASHTO T 104, "Soundness of Aggregate by Use of SodiumSulfate or Magnesium Sulfate." This test estimates the resistance of aggregate to weathering while in-service. It can be performed on both coarse and fine aggregate. The test is performed by alternatelyexposing an aggregate sample to repeated immersions in saturated solutions of sodium or magnesium sulfateeach followed by oven drying. One immersion and drying is considered one soundness cycle. During thedrying phase, salts precipitate in the permeable void space of the aggregate. Upon re-immersion the saltre-hydrates and exerts internal expansive forces that simulate the expansive forces of freezing water. Thetest result is total percent loss over various sieve intervals for a required number of cycles.
Maximum allowable loss values typically range from approximately 10 to 20 percent for fivecycles.

SUPERPAVEWorkbook: Step 1- Selection of Materials Page 30
Deleterious Material as determined by:Clay Lumps and Friable Particles (AASHTO T 112)
Deleterious materials are defined as the weight percentage of contaminants such as shale, wood, mica, andcoal in the blended aggregate. This property is measured by AASHTO T 112, "Clay Lumps and FriableParticles in Aggregates." It can be performed on both coarse and fine aggregate. The test is performedby wet sieving aggregate size fractions over prescribed sieves. The weight percentage of material lost asa result of wet sieving is reported as the percent of clay lumps and friable particles.
A wide range of maximum permissible percentage of clay lumps and friable particles isevident. Values range from as little as 0.2 percent to as high as 10 percent, depending onthe exact composition of the contaminant.
SUPERPAVEWorkbook: Step 2- Selection of a Design Aggregate Structure Page 31
Ï SELECTION OFA DESIGN AGGREGATE STRUCTURE
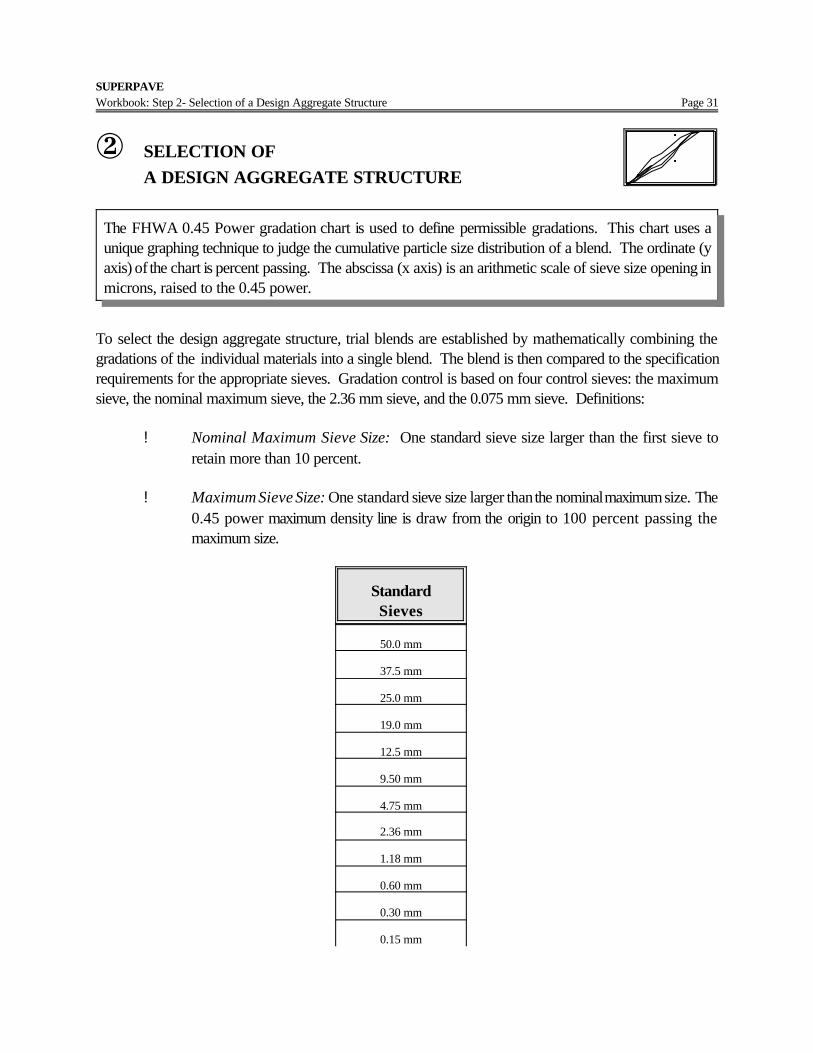
The FHWA 0.45 Power gradation chart is used to define permissible gradations. This chart uses aunique graphing technique to judge the cumulative particle size distribution of a blend. The ordinate (yaxis) of the chart is percent passing. The abscissa (x axis) is an arithmetic scale of sieve size opening inmicrons, raised to the 0.45 power.
To select the design aggregate structure, trial blends are established by mathematically combining thegradations of the individual materials into a single blend. The blend is then compared to the specificationrequirements for the appropriate sieves. Gradation control is based on four control sieves: the maximumsieve, the nominal maximum sieve, the 2.36 mm sieve, and the 0.075 mm sieve. Definitions:
! Nominal Maximum Sieve Size: One standard sieve size larger than the first sieve toretain more than 10 percent.
! Maximum Sieve Size: One standard sieve size larger than the nominal maximum size. The0.45 power maximum density line is draw from the origin to 100 percent passing themaximum size.
StandardSieves
50.0 mm
37.5 mm
25.0 mm
19.0 mm
12.5 mm
9.50 mm
4.75 mm
2.36 mm
1.18 mm
0.60 mm
0.30 mm
0.15 mm
SUPERPAVEWorkbook: Step 2- Selection of a Design Aggregate Structure Page 32
0.075 mm
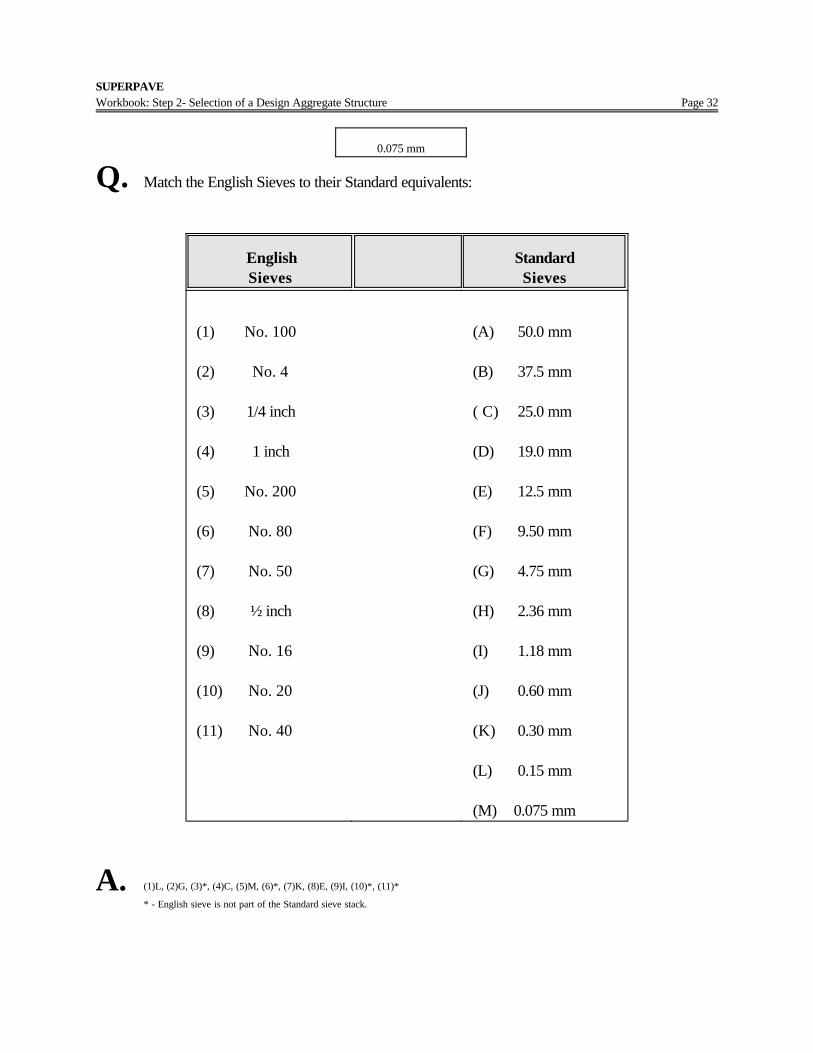
Q. Match the English Sieves to their Standard equivalents:
EnglishSieves
StandardSieves
(1) No. 100
(2) No. 4
(3) 1/4 inch
(4) 1 inch
(5) No. 200
(6) No. 80
(7) No. 50
(8) ½ inch
(9) No. 16
(10) No. 20
(11) No. 40
(A) 50.0 mm
(B) 37.5 mm
( C) 25.0 mm
(D) 19.0 mm
(E) 12.5 mm
(F) 9.50 mm
(G) 4.75 mm
(H) 2.36 mm
(I) 1.18 mm
(J) 0.60 mm
(K) 0.30 mm
(L) 0.15 mm
(M) 0.075 mm
A. (1)L, (2)G, (3)*, (4)C, (5)M, (6)*, (7)K, (8)E, (9)I, (10)*, (11)*
* - English sieve is not part of the Standard sieve stack.
SUPERPAVEWorkbook: Step 2- Selection of a Design Aggregate Structure Page 33
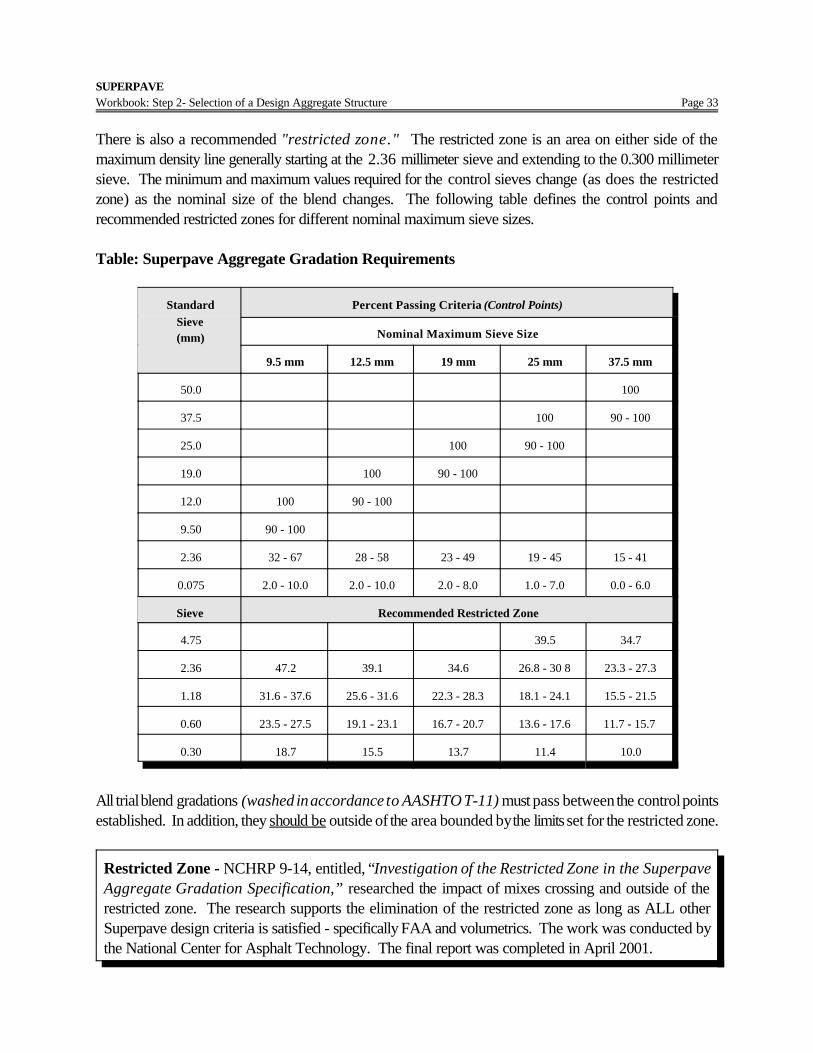
There is also a recommended "restricted zone." The restricted zone is an area on either side of themaximum density line generally starting at the 2.36 millimeter sieve and extending to the 0.300 millimetersieve. The minimum and maximum values required for the control sieves change (as does the restrictedzone) as the nominal size of the blend changes. The following table defines the control points andrecommended restricted zones for different nominal maximum sieve sizes.
Table: Superpave Aggregate Gradation Requirements
StandardSieve(mm)
Percent Passing Criteria (Control Points)
Nominal Maximum Sieve Size
9.5 mm 12.5 mm 19 mm 25 mm 37.5 mm
50.0 100
37.5 100 90 - 100
25.0 100 90 - 100
19.0 100 90 - 100
12.0 100 90 - 100
9.50 90 - 100
2.36 32 - 67 28 - 58 23 - 49 19 - 45 15 - 41
0.075 2.0 - 10.0 2.0 - 10.0 2.0 - 8.0 1.0 - 7.0 0.0 - 6.0
Sieve Recommended Restricted Zone
4.75 39.5 34.7
2.36 47.2 39.1 34.6 26.8 - 30 8 23.3 - 27.3
1.18 31.6 - 37.6 25.6 - 31.6 22.3 - 28.3 18.1 - 24.1 15.5 - 21.5
0.60 23.5 - 27.5 19.1 - 23.1 16.7 - 20.7 13.6 - 17.6 11.7 - 15.7
0.30 18.7 15.5 13.7 11.4 10.0
All trial blend gradations (washed in accordance to AASHTO T-11) must pass between the control pointsestablished. In addition, they should be outside of the area bounded by the limits set for the restricted zone.
Restricted Zone - NCHRP 9-14, entitled, “Investigation of the Restricted Zone in the SuperpaveAggregate Gradation Specification,” researched the impact of mixes crossing and outside of therestricted zone. The research supports the elimination of the restricted zone as long as ALL otherSuperpave design criteria is satisfied - specifically FAA and volumetrics. The work was conducted bythe National Center for Asphalt Technology. The final report was completed in April 2001.

SUPERPAVEWorkbook: Step 2- Selection of a Design Aggregate Structure Page 34
Typically the State highway agency will specify the nominal maximum size required for the pavement layer.For our simulation study, the specified size is 19.0 mm. It is recommended that three trial blends be initiallydeveloped.
Table: Develop Trial Blends
Mineral Aggregates TrialNo. 1
TrialNo. 2
TrialNo. 3
CoarseAgg. Intr.
Agg. Man.Fines Natr’l.
Fines
46%24%15%15%
51%25%15%9%
25%24%23%28%
Sieve Stockpile Gradations No. 1 No. 2 No. 3
37.5 mm25.0 mm19.0 mm12.5 mm9.5 mm4.75 mm2.36 mm1.18 mm0.60 mm0.30 mm0.15 mm0.075 mm
100.0100.0 92.0 50.0 14.0 3.0 2.0 2.0 2.0 2.0 2.0 2.0
100.0100.0100.0100.0 95.0 25.0 6.0 4.0 4.0 3.0 3.0 2.8
100.0100.0100.0100.0100.0100.0 87.0 65.0 42.0 18.0 6.0 3.7
100.0100.0100.0100.0100.0100.0 93.0 64.0 48.0 32.0 18.0 10.0
100.0100.0 96.3 77.0 59.2 37.4 29.4 21.2 15.4 9.1 5.2 3.6
100.0100.0 95.9 74.5 54.9 31.8 23.9 17.5 12.6 7.4 4.3 3.2
100.0100.0 98.0 87.5 77.3 57.8 48.0 34.3 24.6 14.3 7.6 5.8
! Nominal Maximum Sieve Size: One standard sieve size larger than the first sieve to retain morethan 10 percent. The first sieve to retain more than 10 percent for all blends is the 12.5 millimeter.On sieve larger is the 19.0 millimeter. Such that the nominal maximum sieve size is the 19.0millimeter.
! Maximum Sieve Size: One standard sieve size larger than the nominal maximum size. Such thatthe 25.0 millimeter is the maximum sieve size.

SUPERPAVEWorkbook: Step 2- Selection of a Design Aggregate Structure Page 35
0
20
40
60
80
100
0 0.5 1 1.5 2 2.5 3 3 . 5 4 4.5
Sieve Size raised to the 0.45 Power
Perc
ent P
assi
ng
Control
Points
Restricted
Zone
Max Density
Trial No. 1
Trial No. 2
Trial No. 3
Figure: Trial Blends 0.45 Power Chart
Once the trial blends are established, preliminary determinations of the blended aggregate properties canbe determined. This can be estimated mathematically from the individual aggregate properties using theblend percentages. The combined aggregate bulk and apparent specific gravities are determined using thelaw of partial fractions. (If the individual properties were not previously determined, the consensusand source properties standards need to be determined for the design aggregate blend.) Example:
Stockpile Trial Blend #1Percentage
Test ResultsBulk Sp.Gv. (Gsb)
Coarse AggregateIntermediate Agg
Manufactured FinesNatural Fines
46 %24 %15 %15 %
2.5672.5872.5012.598
Estimated Trial Blend #1 Gsb
where: Gsb = bulk specific gravity for the total aggregate blendP1 , P2 ,...Pn = percentage by weight of aggregates, 1, 2,...n

SUPERPAVEWorkbook: Step 2- Selection of a Design Aggregate Structure Page 36
G1 , G2 ,...Gn = bulk specific gravity of aggregates, 1, 2,...n
For the estimation of the consensus and source property standards a method developed by Gerry Huber(Heritage Research Group) is used:
Huber’s Method:
Step 1: First the portion of each stockpile that applies to a property standard is determined for each trialblend. This is simply the percentage of the stockpile used in the trial blend multiplied by thepercentage of the stockpile which applies to property standard (ex. For the coarse aggregateangularity it would be the plus 4.75 mm material).
Trail Blend No. 1: Coarse Aggregate Angularity (CAA)
Stockpile CAA Test Result (A)Trial Blend
(B)+ 4.75 mm
D = (A x B)% App. To CAA
Coarse 99/97 46 % 97 % 44.6 %
Intermediate 80/60 24 % 75 % 18 %
Man. Fines / 15 % 0 % 0
Natural Fines / 15 % 0 % 0Note: % App. To CAA is the portion of the stockpiles that apply to the consensus property.
Step 2: Determine the estimated property:
( ) ( )[ ]( ) ( )[ ]Est operty
CxD CxD nD D n
.Pr...
...=
++
1 21 2
where: Est. Property is the consensus or source propertyC = Test ResultD = Portion of the stockpile that applies to consensus or source propertyn = Stockpile number
( ) ( )[ ]( ) ( )[ ]CAAx x
+1 =++
=99 442 80 144
442 14494
. .
. .%
SUPERPAVEWorkbook: Step 2- Selection of a Design Aggregate Structure Page 37
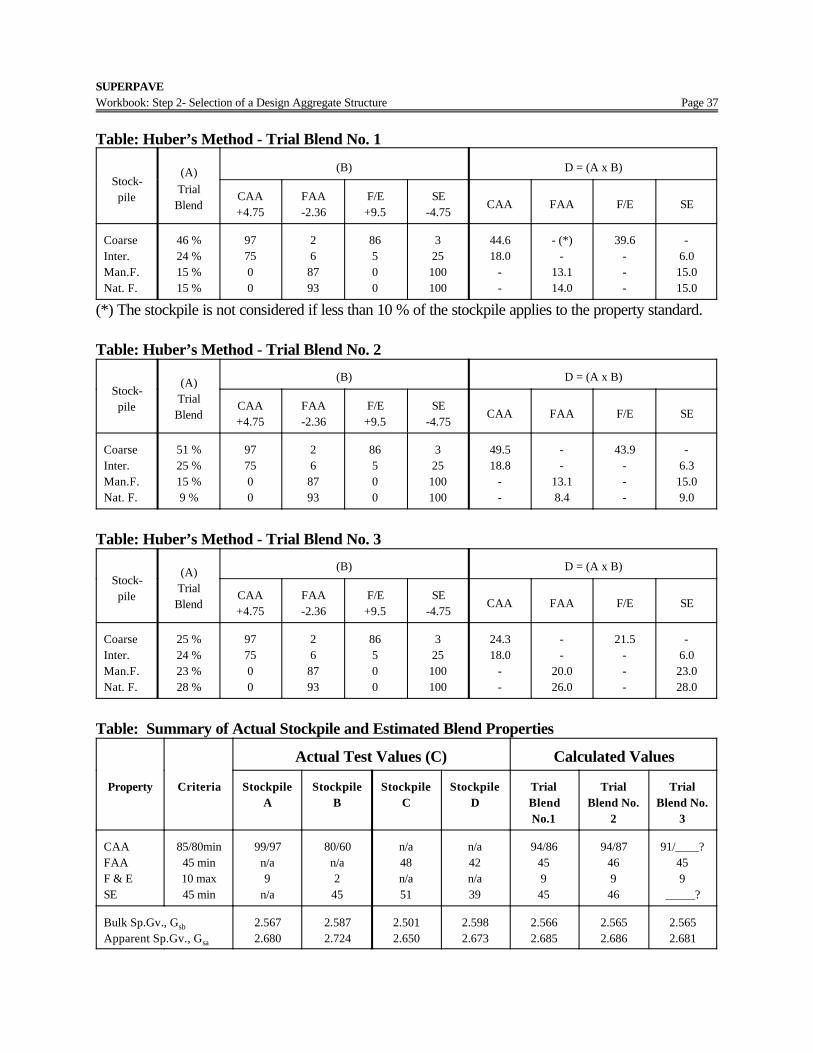
Table: Huber’s Method - Trial Blend No. 1
Stock-pile
(A)TrialBlend
(B) D = (A x B)
CAA+4.75
FAA-2.36
F/E+9.5
SE-4.75
CAA FAA F/E SE
CoarseInter.Man.F.Nat. F.
46 %24 %15 %15 %
977500
268793
86500
325100100
44.618.0
--
- (*)-
13.114.0
39.6---
-6.015.015.0
(*) The stockpile is not considered if less than 10 % of the stockpile applies to the property standard.
Table: Huber’s Method - Trial Blend No. 2
Stock-pile
(A)TrialBlend
(B) D = (A x B)
CAA+4.75
FAA-2.36
F/E+9.5
SE-4.75
CAA FAA F/E SE
CoarseInter.Man.F.Nat. F.
51 %25 %15 %9 %
977500
268793
86500
325100100
49.518.8
--
--
13.18.4
43.9---
-6.315.09.0
Table: Huber’s Method - Trial Blend No. 3
Stock-pile
(A)TrialBlend
(B) D = (A x B)
CAA+4.75
FAA-2.36
F/E+9.5
SE-4.75
CAA FAA F/E SE
CoarseInter.Man.F.Nat. F.
25 %24 %23 %28 %
977500
268793
86500
325100100
24.318.0
--
--
20.026.0
21.5---
-6.023.028.0
Table: Summary of Actual Stockpile and Estimated Blend Properties
Property Criteria
Actual Test Values (C) Calculated Values
StockpileA
StockpileB
StockpileC
StockpileD
TrialBlendNo.1
TrialBlend No.
2
TrialBlend No.
3
CAAFAAF & ESE
85/80min45 min10 max45 min
99/97n/a9
n/a
80/60n/a245
n/a48n/a51
n/a42n/a39
94/8645945
94/8746946
91/____?459
_____?
Bulk Sp.Gv., Gsb
Apparent Sp.Gv., Gsa
2.5672.680
2.5872.724
2.5012.650
2.5982.673
2.5662.685
2.5652.686
2.5652.681

SUPERPAVEWorkbook: Step 2- Selection of a Design Aggregate Structure Page 38
Q. Complete the above table for Trial Blend No. 3 . . .
A. CAA2+= (97 * 24.3 + 60 *18.0) / (24.3 + 18.0) = 81SE = (45*6 + 51*23 + 39*28) / (6 + 23 + 28 ) = 44
Estimate Trial Blend Asphalt Binder Contents
The next step is to evaluate the trial blends by compacting specimens and determining the volumetricproperties of each trial blend. The trial asphalt binder content can be determined for each trial blend byestimating the effective specific gravity (Gse ) of the blends and using the calculations shown below. Thisestimate is based on several assumptions that may or may not apply to local aggregates. It is important toapproximate the trial asphalt binder content from experience prior to performing the calculations.
Based on experience for 19 millimeter nominal, surface course mixture the asphalt content should beapproximately...
? %
Estimate Trial Blend Asphalt Contents - Calculations:
Calculations for estimating the trial asphalt binder content can be divided into four steps.
Step 1: Estimate aggregate effective specific gravityStep 2: Estimate volume of absorbed binderStep 3: Estimate volume of effective binderStep 4: Estimate trial binder content
Step 1: Estimate the effective specific gravity (Gse ) of the trial blends:
Gse = Gsb + 0.8 * (Gsa - Gsb )
0.8 factor accounts for absorption, high absorptive aggregates may require values closer to 0.6 or 0.5.For this example, experience with this equation and local aggregates dictates a factor of 0.6.
Trial Blend No. 1; Gse = 2.566 + 0.6 * (2.685 - 2.566) = 2.637
SUPERPAVEWorkbook: Step 2- Selection of a Design Aggregate Structure Page 39
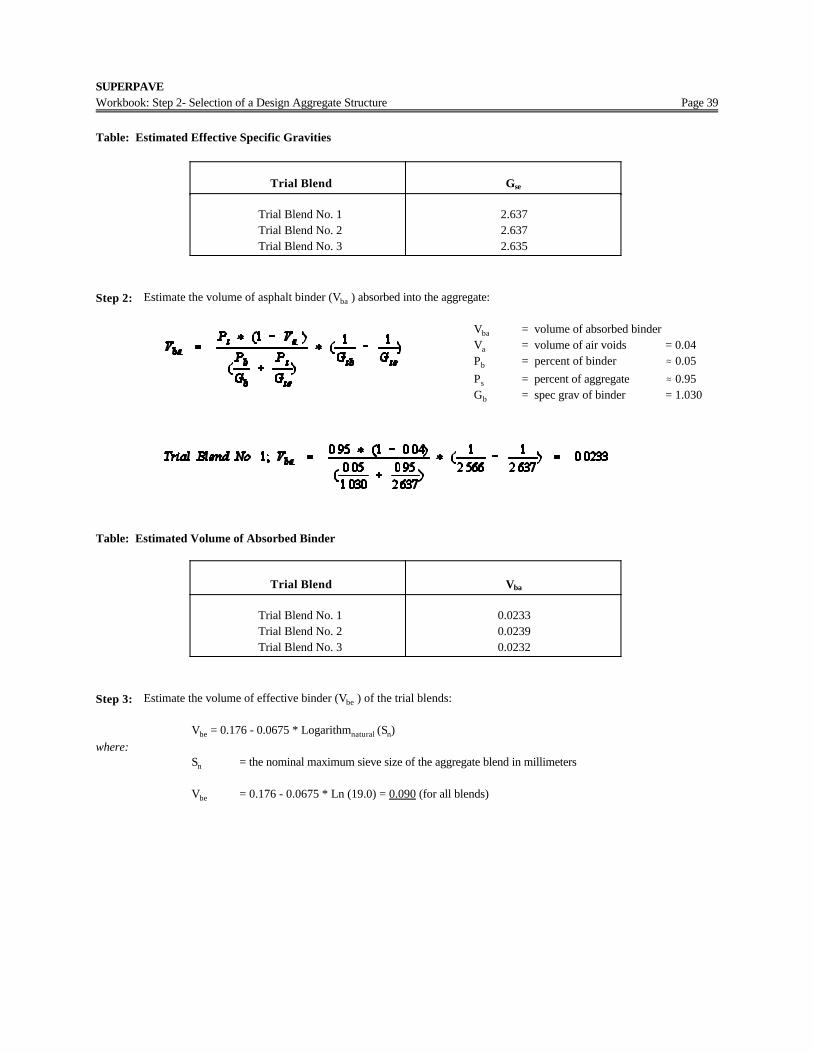
Table: Estimated Effective Specific Gravities
Trial Blend Gse
Trial Blend No. 1Trial Blend No. 2Trial Blend No. 3
2.6372.6372.635
Step 2: Estimate the volume of asphalt binder (Vba ) absorbed into the aggregate:
Vba = volume of absorbed binderVa = volume of air voids = 0.04Pb = percent of binder . 0.05Ps = percent of aggregate . 0.95Gb = spec grav of binder = 1.030
Table: Estimated Volume of Absorbed Binder
Trial Blend Vba
Trial Blend No. 1Trial Blend No. 2Trial Blend No. 3
0.02330.02390.0232
Step 3: Estimate the volume of effective binder (Vbe ) of the trial blends:
Vbe = 0.176 - 0.0675 * Logarithmnatural (Sn)where:
Sn = the nominal maximum sieve size of the aggregate blend in millimeters
Vbe = 0.176 - 0.0675 * Ln (19.0) = 0.090 (for all blends)

SUPERPAVEWorkbook: Step 2- Selection of a Design Aggregate Structure Page 40
Table: Estimated Volume of Effective Binder
Nominal Max, Sn Vbe
50.0 mm37.5 mm25.0 mm19.0 mm12.5 mm9.50 mm4.75 mm
0.0610.0700.0820.0900.1020.1100.130
Step 4: Estimate initial trial asphalt binder (Pbi ) content for the trial blends:
Ps * (1 - Va )Ws = ))))))))))))
(Pb/Gb + Ps/Gse )
Gb * (Vbe + Vba )Pbi = )))))))))))))))))) * 100
(Gb *(Vbe + Vba )) + Ws
where:Ws = weight of aggregatePbi = percent (by weight of mix) of binder
0.95 * (1 - 0.04)Trial Blend No. 1; Ws = ))))))))))))))))))))))) = 2.231
(0.05/1.030 + 0.95/2.637)
1.030 * (0.090 + 0.0233)Trial Blend No. 1; Pbi = ))))))))))))))))))))))))))))) * 100 = 4.95 %
(1.030 * (0.090 + 0.0233)) + 2.231
Table: Estimated Weight of Aggregate and Percent of Binder
Trial Blend Ws Pbi
Trial Blend No. 1Trial Blend No. 2Trial Blend No. 3
2.2312.2312.229
4.95 %4.98 %4.95 %

SUPERPAVEWorkbook: Step 2- Selection of a Design Aggregate Structure Page 41
Author’s Note
The estimated percent of binder determined by the equations can not replace experience. Localaggregate and binders when combined will almost always require a slightly different optimum asphaltcontent. Your experience with Superpave mixtures should always govern over these calculatedestimates.
Next: Evaluate Trial Blends at Estimated Asphalt Binder Contents
Table: Required Tests
Trial Blend SuperpaveGyratory Compactor
Specimens
Rice, Gmm
Max Specific Gravity(T 209)
Number 1 3 Specimens4800 g/ea
2 Tests2000 g/ea
Number 2 3 Specimens 2 Tests
Number 3 3 Specimens 2 Tests
Total (55,200 g) 9 Specimens (43,200 g) 6 Tests (12,000 g)
A minimum of two specimens (FHWA recommends three) for each trial blend are compacted using theSuperpave gyratory compactor. A mixture weight of 4800 grams is usually sufficient for the compactedspecimens. Two specimens are also prepared for determination of the mixture's maximum theoreticalspecific gravity, (Gmm ). A mixture weight of 2000 grams is usually sufficient for the specimens used todetermine Gmm. Excerpt, AASHTO T 209:
Nominal MaximumSize of Aggregate
(mm)
Minimum Massof Sample
(kg)
25.019.0 12.5 9.5 4.75
2.52.01.51.00.5

SUPERPAVEWorkbook: Step 2- Selection of a Design Aggregate Structure Page 42
Author’s Note
Nominal maximum size of aggregate for the above table is based on AASHTO definition not Superpave.Such that the nominal maximum size is the smallest sieve size through which the entire amount ofaggregate is permitted to pass. How does this relate to Superpave?

SUPERPAVEWorkbook: Step 2- Selection of a Design Aggregate Structure Page 43
Aging
Specimens are mixed at the appropriate mixing temperature based on the temperature-viscosityrelationship. The specimens are short-term aged. The original procedure required 4 hours of short termaging in a forced-draft oven at 135/C. The mix is spread to a density of 21 to 22 kilograms per squaremeter (kg/m²) of pan (approximately 10 mm thick). The specimens are hand mixed every hour. The LeadStates propose an alternate procedure, based on the following rationale:
Lead States’ Rationale
NCHRP 9-9, “Evaluation of the Superpave Gyratory Compaction Procedure,” research performed byNCAT has shown there is not a practical difference for non-absorptive aggregates in mixture volumetricproperties when 2- or 4-hour conditioning is performed. This research confirmed previous findings ofthe Mixture Expert Task Group. Additionally, NCAT evaluated the difference in a mixture’s volumetricproperties when aging is performed at the mixture’s compaction temperature and aging at 135 °C. Whiledifferences were noted, it was determined that these differences were inconsequential from anengineering perspective. However, additional research sited by the FHWA indicates there is a differencein the resulting mechanical properties of mixtures conditioned for 2 versus 4 hours. Adopting a specific2-hour mixture conditioning period for the volumetric mixture design procedure at the mixture’scompaction temperature will expedite mixture design development. The existing “short and long” agingprocedures are maintained for use when mechanical property testing of the mixture will be performed.
Summary of Practice
Original: For short term aging a mixture of aggregate and asphalt binder is aged in a forced- draftoven for 4 hours at 135°C. For long term aging a compacted mixture of aggregate andasphalt binder is aged in a forced-draft oven for 5 days at 85°C.
Current ‘99: For mixture conditioning for volumetric mixture design, a mixture of aggregate and asphaltbinder is conditioned in a forced-draft oven for 2 hours at the mixture’s specifiedcompaction temperature.
For short-term mixture conditioning for mechanical property testing, a mixture of aggregateand asphalt binder is aged in a forced-draft oven for 4 hours at 135°C.
For long-term mixture conditioning for mechanical property testing, a compacted mixtureof aggregate and asphalt binder is aged in a forced-draft oven for 5 days at 85°C.

SUPERPAVEWorkbook: Step 2- Selection of a Design Aggregate Structure Page 44
Compaction
History Lesson
The Superpave system, developed under SHRP, employs gyratory compaction to fabricate asphaltmixture specimens. The level of compaction in the SGC is based upon the design traffic and the average7-day maximum air temperature. The design traffic is the projected, single lane, traffic volume over 20years - expressed in ESALs. AASHTO MP-2 provides a table for selection of specimen compactionlevels. The table has seven traffic categories and four ranges of temperatures, constituting a total matrixof twenty-eight (28) different compaction levels.
The compaction table is based on research conducted under the SHRP contract by the Asphalt Institute,(AI). The researchers evaluated 9, in-service, general pavement studies, (GPS), from across the UnitedStates, using a prototype gyratory compactor. All of the GPS sites were performing well after severalyears of service. The sites were cored and volumetrics were determined. Aggregates were thenrecovered and recombined with a standard asphalt binder (AC-20) and compacted in a prototype SGC.The compaction efforts required to produce four percent air voids were determined. This effort wasthen equated to traffic level and site environmental data resulting in the table of compaction levels.
NCHRP 9-9 entitled, “Refinement of the Superpave Gyratory Compaction Procedure”, conducted byNCAT, evaluated the sensitivity of the compaction levels. The principal investigator, Dr. E. Ray Brown,and his team investigated whether there is any significant volumetric property differences betweenmixtures compacted at the various compaction levels.
A parallel effort conducted by the FHWA Mixture ETG, investigated the validity of the number ofgyrations used to design asphalt mixtures. This effort, designated, “N-design II,” was conducted throughthe AI in partnership with Heritage Research Group. The principal researchers included Mike Anderson(AI), Gerry Huber (Heritage), Bob McGennis (South Central Superpave Regional Center), and RichMay (previously with AI, now with Koch Materials). The researchers were provided with samplesand data from several State Highway Agencies, FHWA Turner Fairbank Highway Research Center,and FHWA Performance Related Specifications Test Track, (WesTrack).
The NCHRP 9-9 research effort developed a simplified, compaction matrix. As did the research N-design II effort. During the Mix ETG meeting held September 22 and 23, 1998 in Baltimore, Maryland,the expert task group reviewed the findings of both research efforts. On September 24, 1998, theSuperpave Lead States met and concurred with the efforts of the Mix ETG. These efforts resulted in thedevelopment of a new compaction matrix. The new compaction table was forwarded by the Mix ETGto AASHTO for balloting and inclusion in the standards.

SUPERPAVEWorkbook: Step 2- Selection of a Design Aggregate Structure Page 45
The Superpave compaction criteria are based on three points during the compaction effort: an initial (Nini
), design (Ndes ), and maximum (Nmax ) number of gyrations. Limiting criteria based on the percent of Gmm
has also been established for the initial, design, and maximum number of gyrations. PP-28, Table 1 - Superpave Gyratory Compaction Effort
Design ESALs1
(million)
Compaction ParametersTypical Roadway Application2
Ninitial Ndesign Nmax
< 0.3 6 50 75
Applications include roadways with very lighttraffic volumes such as local roads, county roads,and city streets where truck traffic is prohibited orat a very minimal level. Traffic on these roadwayswould be considered local in nature, not regional,intrastate, or interstate. Special purpose roadwaysserving recreational sites or areas may also beapplicable to this level.
0.3 to < 3 7 75 115Applications include many collector roads oraccess streets. Medium-trafficked city streets andthe majority of county roadways may be applicableto this level.
3 to < 30 8 100 160
Applications include many two-lane, multilane,divided, and partially or completely controlledaccess roadways. Among these are medium-tohighly-trafficked city streets, many state routes,US highways, and some rural interstates.
$ 30 9 125 205
Applications include the vast majority of the USInterstate system, both rural and urban in nature.Special applications such as truck-weighingstations or truck-climbing lanes on two-laneroadways may also be applicable to this level.
(1) Design ESALs are the anticipated project traffic level expected on the design lane over a 20-year period. Regardless of theactual design life of the roadway, determine the design ESALs for 20 years, and choose the appropriate Ndesign level.
(2) Typical Roadway Applications as defined by A Policy on Geometric Design of Highway and Streets, 1994, AASHTO.
Note 17 -- When specified by the agency and the top of the design layer is $ 100 mm from the pavement surface and theestimated design traffic level $ 0.3 million ESALs, decrease the estimated design traffic level by one, unless themixture will be exposed to significant main line and construction traffic prior to being overlaid. If less than 25% ofthe layer is within 100 mm of the surface, the layer may be considered to be below 100 mm for mixture designpurposes.

SUPERPAVEWorkbook: Step 2- Selection of a Design Aggregate Structure Page 46
Note 18 – When the design ESALs are between 3 to < 10 million ESALs the agency may, at their discretion, specify Ninitial at7, Ndesign at 75, and Nmax at 115, based on local experience.
PP-35, Table 2 - Superpave Volumetric Mixture Design Requirements
DesignESALs1
(million)
Required Density
(% of Theoretical MaximumSpecific Gravity)
Voids-in-the Mineral Aggregate(Percent), minimum Voids
FilledWith
Asphalt(Percent)
Dust-to-BinderRatio
Ninitial Ndesign Nmax
Nominal Maximum AggregateSize, mm
37.5 25.0 19.0 12.5 9.5
< 0.3 # 91.5
96.0 # 98.0 11.0 12.0 13.0 14.0 15.0
70 - 80 3,4
0.6 - 1.2
0.3 to < 3 # 90.5 65 - 784
3 to < 10
# 89.0 65 - 752,410 to < 30
$ 30
(1) Design ESALs are the anticipated project traffic level expected on the design lane over a 20-year period.Regardless of the actual design life of the roadway, determine the design ESALs for 20 years, and choosethe appropriate Ndesign level.
(2) For 9.5-mm nominal maximum size mixtures, the specified VFA range shall be 73% to 76% for design trafficlevels $3 million ESALs.
(3) For 25.0-mm nominal maximum size mixtures, the specified lower limit of the VFA shall be 67% for designtraffic levels < 0.3 million ESALs.
(4) For 37.5-mm nominal maximum size mixtures, the specified lower limit of the VFA shall be 64% for alldesign traffic levels.
Note 19 -- If the aggregate gradation passes beneath the boundaries of the aggregate restricted zone specifiedin Table 3, consideration should be given to increasing the dust-to-binder ratio criteria from 0.6 - 1.2 to 0.8 - 1.6.

SUPERPAVEWorkbook: Step 2- Selection of a Design Aggregate Structure Page 47
PP-28, Table 4 - Selection of a Design Aggregate Structure (Example)
VolumetricProperty
Trial Mixture (19.0 mm nominal maximum aggregate)
20-Year Project Design ESALs = 5 millionCriteria
1 2 3
At the initial trial asphalt content
Pb (trial) 4.4 4.4 4.4
%Gmminitial (trial) 88.1 88.8 87.1
%Gmmdesign (trial) 95.9 95.3 94.7
Va at Ndesign 4.1 4.7 5.3 4.0
VMAtrial 12.9 13.4 13.9
Adjustments to reach design asphalt content (Va = 4.0 % atNdesign)
) Va -0.1 -0.7 -1.3
) Pb 0.0 0.3 0.5
) VMA 0.0 -0.1 -0.3
At the estimated design asphalt content (Va = 4.0 % atNdesign)
Estimated Pb
(design)4.4 4.7 4.9
VMA (design) 12.9 13.3 13.6 > 13.0
%Gmminitial
(design)88.2 89.5 88.4
ESALs
<0.3 x 10⁶
0.3 - 3 x 10⁶
> 3 x 10⁶
Criteria,%Gmm
<91.5
<90.5
< 89.0

SUPERPAVEWorkbook: Step 2- Selection of a Design Aggregate Structure Page 48
Notes:
The top portion of this table presents measured compaction densities and volumetric properties for specimens prepared foreach trial aggregate gradation at the initial trial asphalt content.
None of the specimens had an air void content of exactly 4.0 percent. Therefore, the procedures described in Section 9 mustbe applied to: 1) estimate the design asphalt content at which Va = 4.0 percent, and 2) obtain adjusted VMA and densityvalues at this estimated asphalt content.
The middle portion of this table presents the change in asphalt content ()Pb) and VMA ()VMA) that occurs when the airvoid content (Va) is adjusted to 4.0 percent for each trial aggregate gradation.
A comparison of the VMA and densities at the estimated design asphalt content to the criteria in the last column shows thattrial gradation #1 does not have sufficient VMA (12.9% versus a requirement of $ 13.0%). Trial gradation #2 exceeds thecriterion for density at Ninitial gyrations (89.5 versus a requirement of < 89.0 %). Trial gradation #3 meets the requirements fordensity and VMA and, in this example, is selected as the design aggregate structure.
For Hot Mix, USA, the estimated, 20-year, design traffic is 6,300,000 ESALs. The traffic level falls in the3 to less than 30 million ESAL range. The project is a State route, which falls in the typical roadwayapplication defined in the current ‘99 table above. Such that, from the table the initial, design, andmaximum number of gyrations are 8, 100, and 160, respectively. The following table summarizes thevolumetric criteria for the project:
Table: Summary of Project Volumetric Criteria
Volumetric Property Volumetric Criteria
N ini
%Gmm at Nini
8 gyrations#89 %
N ini
%Gmm at Ndesign
100 gyrations= 96 % (4% air voids)
N max
%Gmm at Nmax
160 gyrations# 98 %
Voids-in-the Mineral Aggregate (VMA) 13.0 minimum
Voids Filled with Asphalt (VFA) 65 - 75 percent
Dust-to-Binder Ratio 0.6 - 1.2
For the evaluation of the trial blends, specimens are compacted to the design number of gyrations, with

SUPERPAVEWorkbook: Step 2- Selection of a Design Aggregate Structure Page 49
SUPERPAVE Gyratory Compaction Curves
1 2 5 10 20 50 100 200 500 1,00080
85
90
95
100
Log(Number of Gyrations)
% G
mm
the specimen height collected during the compaction process. Since the specimen mass and cross sectionare constant throughout compaction, the density can be continually calculated based on the height.
After compaction is complete, the specimen is extruded and the bulk specific gravity is determined (Gmb
) by AASHTO T 166. The Gmm of each blend is also determined by AASHTO T-209. From this, thedesign percent of maximum theoretical specific gravity (%Gmm des) can be calculated. Such that, from thecompaction height data (hx ), the %Gmm per gyration can be determined as follows:
Initial:%Gmm ini =%Gmm des * (hdes / hini )
Figure: Gyratory Compaction Graph

SUPERPAVEWorkbook: Step 2- Selection of a Design Aggregate Structure Page 50
Gyratory Compaction Calculations
For each option blend, three gyratory specimens are compacted (AASHTO TP 4) in the Superpavegyratory compactor to Ndes and two maximum theoretical specific gravities are determined (AASHTO T209) (Gmm ). The gyratory specimens are extruded from the molds and bulk specific gravities aredetermined (Gmb ).
Trial Blend No. 1: Measured Properties of the Specimens
Gmm = 2.475 (Rice)
Specimen 1: Gmb = 2.351 (at design number of gyrations, Ndes )
Specimen 2: Gmb = 2.348
Specimen 3: Gmb = 2.353
The percent of maximum theoretical specific gravity at Ndes (% Gmm des) is calculated as follows:
Q. What is %Gmm des for specimens 2 and 3 at Ndes ?
Specimen 2: %Gmm des = ))))) *100 = ___.__ %
Specimen 3: %Gmm des = ))))) * 100 = ___.__ %
SUPERPAVEWorkbook: Step 2- Selection of a Design Aggregate Structure Page 51
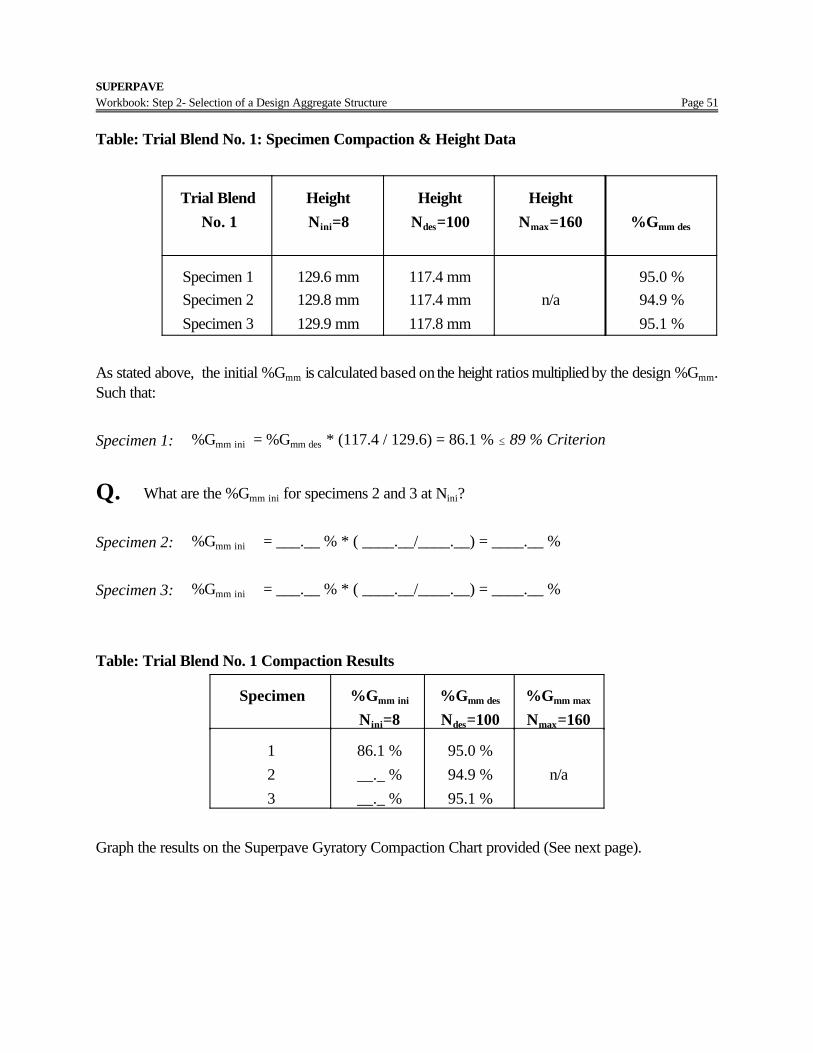
Table: Trial Blend No. 1: Specimen Compaction & Height Data
Trial Blend No. 1
HeightNini=8
HeightNdes=100
HeightNmax=160 %Gmm des
Specimen 1Specimen 2Specimen 3
129.6 mm129.8 mm129.9 mm
117.4 mm117.4 mm117.8 mm
n/a95.0 %94.9 %95.1 %
As stated above, the initial %Gmm is calculated based on the height ratios multiplied by the design %Gmm.Such that:
Specimen 1: %Gmm ini = %Gmm des * (117.4 / 129.6) = 86.1 % # 89 % Criterion
Q. What are the %Gmm ini for specimens 2 and 3 at Nini?
Specimen 2: %Gmm ini = ___.__ % * ( ____.__/____.__) = ____.__ %
Specimen 3: %Gmm ini = ___.__ % * ( ____.__/____.__) = ____.__ %
Table: Trial Blend No. 1 Compaction Results
Specimen %Gmm ini
Nini=8%Gmm des
Ndes=100%Gmm max
Nmax=160
123
86.1 %__._ %__._ %
95.0 %94.9 %95.1 %
n/a
Graph the results on the Superpave Gyratory Compaction Chart provided (See next page).

SUPERPAVEWorkbook: Step 2- Selection of a Design Aggregate Structure Page 52
SUPERPAVE Gyratory Compactiom Chart
1 2 5 10 20 50 100 200 500 1,00080
81
82
83
84
85
86
87
88
89
90
91
92
93
94
95
96
97
98
99
100
Log(Number of Gyrations)
% o
f Gm
m

SUPERPAVEWorkbook: Step 2- Selection of a Design Aggregate Structure Page 53
80
90
100
1 10 100
Log(Nummber of Gyrations)
% G
mm
Specimen 1Specimen 2Specimen 3N initialN design
Table: Trial Blend No. 1 Compaction Results
Specimen %Gmm ini
Nini=8%Gmm des
Ndes=100%Gmm max
Nmax=160
123
86.1 %85.8 %86.2 %
95.0 %94.9 %95.1 %
n/a
Figure: Gyratory Compaction Data
Q. For a design target of 4.0 % voids in total mix at Ndes , is the asphalt binder content high or low?
Big Q. Should asphalt binder content be the main criteria for mixture design, Y or N?

SUPERPAVEWorkbook: Step 2- Selection of a Design Aggregate Structure Page 54
Rationale for Compaction Criteria:
Nini - "Tenderness Check" Nini represents the mix during construction. Mixes that compact tooquickly in the gyratory may have tenderness problems during construction.
Ndesign - "Volumetric Check" Ndesign represents the mix after construction and trafficking. Mixvolumetrics, (Va , VMA, VFA), are compared to empirically based criteria.
Nmax - "Rutting Check" Mixes that commonly rut have been compacted below 2 % voids undertraffic. Mixes that compact below 2 % voids in the gyratory may have rutting problems. (Appliedonly at the end of design procedure.)

SUPERPAVEWorkbook: Step 2- Selection of a Design Aggregate Structure Page 55
80
90
100
1 10 100
Log(Nummber of Gyrations)
% G
mm
Trial Blend 1Trial Blend 2Trial Blend 3N initialN design
All three trial blends are compacted and the volumetric properties are determined. It is important torecognize that the trial blends are compacted at an estimated asphalt binder content. Under Superpave thedesign (optimum) asphalt binder content provides a mixture with four percent (4.0 %) voids in total mix(VTM or Va ) at the design number of gyrations (Ndesign ); in addition to satisfying all other criteria. Onlyone of the trial blends at Ndesign yielded four percent (4.0 %) Va . All this means is that the estimated trialasphalt contents were not exact. This will almost always be the case.
Table: Summary Superpave Gyratory Compaction Results
TrialBlend
Trial% AC
%Gmm ini %Gmm des Va VMA
Nini = 8 Ndes = 100 Ndes = 100 Ndes = 100
1 5.0 86.1 95.0 5.0 14.0
2 5.0 86.5 96.0 4.0 13.0
3 5.0 89.6 95.5 4.5 13.5
SuperpaveGyrator
yCompaction
Curves-
TrialBlends

SUPERPAVEWorkbook: Step 2- Selection of a Design Aggregate Structure Page 56
Figure: Trial Blend Gyratory Compaction Curves
Superpave provides a procedure for adjusting the volumetric results to reflect a four percent (4.0 %) voidcontent at Ndes . Upon completing the adjustments, the trial blends are then analyzed based on theestablished criteria.

SUPERPAVEWorkbook: Step 2- Selection of a Design Aggregate Structure Page 57
Continuing: Estimate Trial Blends' Properties at 4.0% Air Voids (Va )
The aggregate gradation governs the slope of the gyratory compaction curve (rate of compaction). In looking at theabove compaction curves, it can be seen that the three trial blends produce different compaction rates. Because of thisrelationship, the blends' properties can be estimated.
1) Estimated asphalt binder content at 4.0 % Va at Ndes , Pb,est
Pb,est = Pbt - (0.4 *(4 - Va at Ndes ))
where:
Pbt = Trial percent asphalt binder content
Va = Percent air voids in total mix at Ndes
Trial Blend No. 1; Pb,est = 5.0 - (0.4 *(4 - 5.0)) = 5.40 %
2) Estimated voids in mineral aggregate (VMA) at Ndes, at 4.0 % Va, VMAest
VMAest = VMA at Ndes + C *(4 - Va at Ndes )
where:
C = constant (either 0.1 or 0.2)
C = 0.1 when Va is less than 4.0%
C = 0.2 when Va is 4.0% or greater
Trial Blend No. 1; VMAest = 14.0 + 0.2 *(4 - 5.0) = 13.8 %
3) Estimated voids filled with asphalt (VFA) at Ndes, at 4.0 % Va, VFAest
VFAest = 100 *(VMAest - Va at Ndes ) / VMAest
Trial Blend No. 1; VFAest = 100 *(13.8 - 4) / 13.8 = 71.0 %
4) Estimated Percent of Rice at Nini , Est %Gmm ini
Est %Gmm est-I = %Gmm ini - (4.0 - Va at Ndes )
Trial Blend No. 1; Est %Gmm ini = 86.1 - (4.0 - 5.0) = 87.1 %

SUPERPAVEWorkbook: Step 2- Selection of a Design Aggregate Structure Page 58
5) Estimated Percent of Rice at Nmax , Est %Gmm max
Est %Gmm max = %Gmm max - (4.0 - Va at Ndes )
Trial Blend No. 1; Est %Gmm max = 96.1 - (4.0 - 5.0) = 97.1 %
6) Estimated Fines to Effective Asphalt Ratio, F / Pbe,est
Note: The F / Pbe ratio under Superpave is based on the effective asphalt binder content, not the total. This issometimes referred to as the dust proportion.
Table: Summary of Estimated Properties at 4 % Va
TrialBlend
Estimated Properties
BinderPb
VMAat Ndes
VFAat Ndes
F / Pbe
Ratio%Gmm ini
No. 1 5.4 % 13.8 % 71 % 0.82 87.1 %
No. 2 5.0 % 13.0 % 69 % 0.81 86.5 %
No. 3 5.2 % 13.4 % 70 % 1.15 90.1 %

SUPERPAVEWorkbook: Step 2- Selection of a Design Aggregate Structure Page 59
Criteria n/a 13.0 %minimum
65 - 75 %range
0.6 - 1.2range
89.0 %maximum
Selection of the Design Aggregate Structure
Selecting the Design aggregate structure is the most difficult step. The estimated trial blends' properties areevaluated against the criteria:
° Trial Blend No. 1 passes ALL requirements.
° Trial Blend No. 2 "passes" ALL requirements.
However: VMA just meets the minimum requirement and the %Gmm max is just under themaximum criterion - during production it may be difficult to stay within the compaction criteria.
° Trial Blend No. 3 fails to meet all requirements.
%Gmm ini = 90.1 % > maximum criterion of 89 %
Select Trial BlendNumber 1!
Select Design Aggregate Structure
Q. What if all three initial Trial Blends meet the design requirements. How would the DesignAggregate Structure be selected?

SUPERPAVEWorkbook: Step 3 Selection of the Design Asphalt Binder Content Page 60
A. $ Economics $
Ð SELECTION OF THE
DESIGN ASPHALT BINDER CONTENT
Once the design aggregate structure is selected, Trial Blend No. 1 in this case, specimens are compactedat varying asphalt binder contents. The mixture properties are then evaluated to determine a design asphaltbinder content. Superpave requires a minimum of two specimens compacted at each of the followingasphalt contents, (FHWA recommends three specimens compacted at each asphalt binder content):
! estimated asphalt binder content,! estimated asphalt binder content ± 0.5 %, and! estimated asphalt binder content + 1.0 %.
For Trial Blend No. 1, the asphalt binder contents for the mix design are 4.9%, 5.4%, 5.9%, and 6.4%.Two specimens are also prepared at each asphalt binder content for determination of maximum theoreticalspecific gravities (Gmm ).
Table: Required Tests
Batch AsphaltBinder Content
Superpave GyratoryCompactor
Rice, Gmm
(T 209)
4.9%(-½%)5.4% Target*
5.9%(+½%)6.4%(+1%)
3 Specimens (4800 g/ea)3 Specimens3 Specimens3 Specimens
2 Tests (2000 g/ea)2 Tests2 Tests2 Tests
Total (73,600 g) 57,600 g 16,000 g

SUPERPAVEWorkbook: Step 3 Selection of the Design Asphalt Binder Content Page 61
80
90
100
1 10 100
Log(Nummber of Gyrations)
% G
mm
6.40%5.90%5.40%4.90%N initialN design
Lead StatesBased upon the recommendations of NCHRP 9-9,compact the design aggregate blend only to Ndes .
Author’s NoteBased on the calculations, 5.4 % is the estimated optimum asphalt content and should be the target
asphalt content for binder content selection. From a practical standpoint the results from the designaggregate structure selection can used to reduce the batching of all four binder contents.
Superpave Gyratory Compaction Curves

SUPERPAVEWorkbook: Step 3 Selection of the Design Asphalt Binder Content Page 62
Figure: Design Gyratory Compaction Curves
Note: Each compaction curve represents the average of three compacted specimens.

SUPERPAVEWorkbook: Step 3 Selection of the Design Asphalt Binder Content Page 63
Table: Compaction Test Results
AsphaltContent
%Gmm ini %Gmm des
4.9 %5.4 %5.9 %6.4 %
85.8 %87.1 %88.3 %89.6 %
94.8 %96.0 %97.3 %98.5 %
Criteria # 89.0 % = 96.0 %

SUPERPAVEWorkbook: Step 3 Selection of the Design Asphalt Binder Content Page 64
Table: Volumetric Test Results at Ndesign
AsphaltContent
Va VMA VFA
4.9 %5.4 %5.9 %6.4 %
5.2 %4.0 %2.7 %1.5 %
14.2 %13.5 %12.8 %12.2 %
62.7 %70.4 %78.1 %87.7 %
Criteria 4.0 % $ 13.0% 65-75
Similar to the Marshall mix design procedure, the volumetric properties are plotted versus asphalt content.This provides a graphical means of determining the design asphalt binder content (see Figures). The designasphalt binder content is established as 4.0 % air voids (Va ) at Ndes of 100 gyrations. In this simulation,the design asphalt binder content is 5.4 %. All other mixture properties are checked at the design asphaltbinder content to verify that they meet the criteria. The design values for the 19.0 mm nominal mixture(Trial Blend No. 1) are indicated below:
Table: Summary of Design Mixture Properties at 5.4 % AC (Pb )
Mix Property Results Criteria
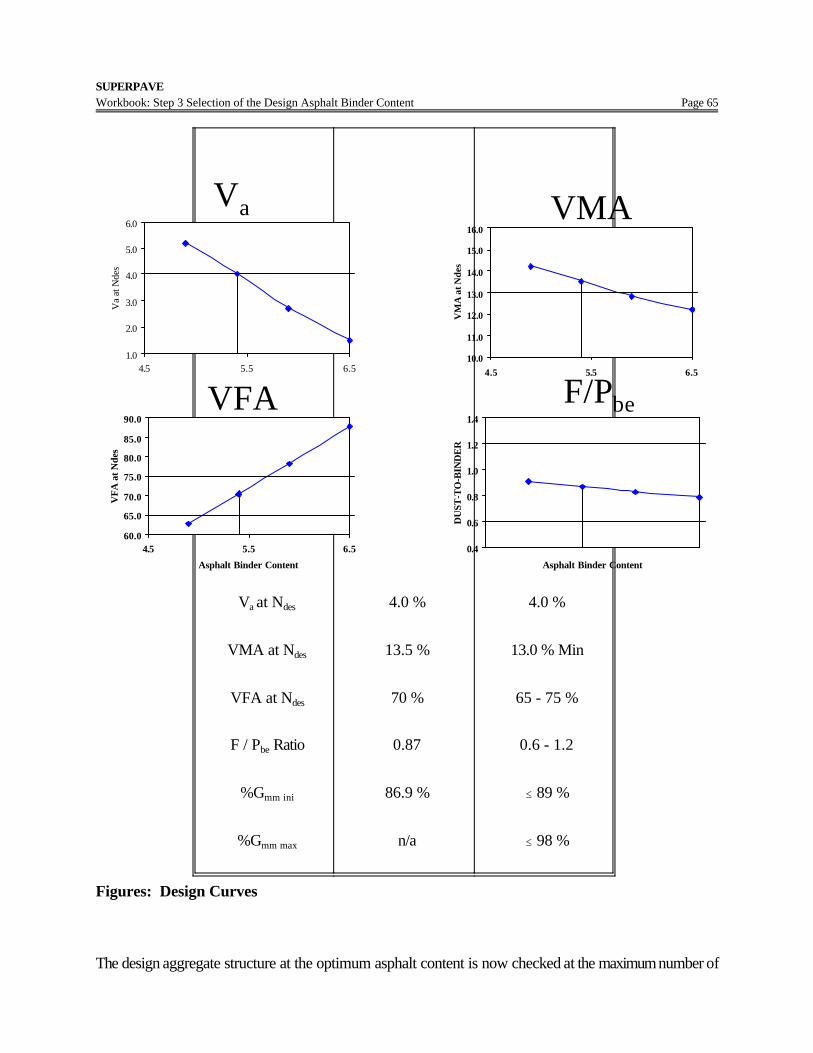
SUPERPAVEWorkbook: Step 3 Selection of the Design Asphalt Binder Content Page 65
1.0
2.0
3.0
4.0
5.0
6.0
4.5 5.5 6.5
Va
at N
des
60.0
65.0
70.0
75.0
80.0
85.0
90.0
4.5 5.5 6.5
Asphalt Binder Content
VFA
at N
des
0.4
0.6
0.8
1.0
1.2
1.4
Asphalt Binder Content
DU
ST-T
O-B
IND
ER
10.0
11.0
12.0
13.0
14.0
15.0
16.0
4.5 5.5 6.5
VM
A a
t Nde
s
Va VMA
VFA F/Pbe
Va at Ndes
VMA at Ndes
VFA at Ndes
F / Pbe Ratio
%Gmm ini
%Gmm max
4.0 %
13.5 %
70 %
0.87
86.9 %
n/a
4.0 %
13.0 % Min
65 - 75 %
0.6 - 1.2
# 89 %
# 98 %
Figures: Design Curves
The design aggregate structure at the optimum asphalt content is now checked at the maximum number of

SUPERPAVEWorkbook: Step 3 Selection of the Design Asphalt Binder Content Page 66
gyrations (Nmax ). As stated above, the compacted mixture should retain a minimum of 2 percent air voids,(maximum of 98 % Gmm ), at Nmax. For this project the following is determined:
% Gmm max = 97.3 % < 98 % Criterion, (Okay)
If the mix failed to meet the criterion, this indicates that a pavement made of this mix may be susceptibleto rutting. The aggregate gradation should be adjusted accordingly. Different stockpile material may berequired.

SUPERPAVEWorkbook: Step 4 - Evaluation of Moisture Sensitivity Page 67
Ñ EVALUATION OF
MOISTURE SENSITIVITY AASHTO T-283
The final step in the volumetric mix design process is to evaluate the moisture sensitivity of the designmixture. This step is accomplished by performing AASHTO T 283 on the design aggregate blend at thedesign asphalt binder content. Specimens are compacted to approximately 7.0% (±1.0%) air voids. Onesubset of three specimens is considered the control/unconditioned subset. The other subset of threespecimens is the conditioned subset. The conditioned subset is subjected to partial vacuum saturationfollowed by an optional freeze cycle, followed by a 24 hour heating cycle at 60°C. All specimens aretested to determine their indirect tensile strengths. The moisture sensitivity is determined as a ratio of thetensile strengths of the conditioned subset divided by the tensile strengths of the control subset. The tablebelow indicates the moisture sensitivity data for the mixture at the design asphalt binder content.
Table: AASHTO T 283 Results
Samples Superpave GyratoryCompactor
Indirect TensileStrength
Un-conditionedSpecimens (Dry)
3 Specimens compactedto 7 % Va (14,400 g) 872 k Pa
ConditionedSpecimens (Wet)
3 Specimens compactedto 7 % Va (14,400 g) 721 k Pa
% TSR 82.7 % (Ok)
Superpave Criteria 80.0 % Min
The minimum criteria for tensile strength ratio is 80.0 %. The design blend (82.7 %) meets the minimumrequirement. At this point, Superpave Volumetric Mixture Design is complete.

Author’s NoteThe criteria for TRS is based on experience gained from analysis 4 inch Marshall specimens. Researchconducted under NCHRP evaluated 150 mm (6 inch) SGC specimens in the AASHTO T -283procedure. The conditioning procedure was not as severe with the larger specimens. Most designersare using T-283 with SGC specimens. However, others are using 4 inch specimens, while others areusing the SGC specimens with 100% saturation, while still others are using other test procedures. Theuse of AASHTO T-283 is not required to design a Superpave mix. However, some method of moisturesensitivity should be employed.
APPENDICES
MIXING AND COMPACTION TEMPERATURE DETERMINATION
SGC Evaluation Specification, on CD
RAP Guidelines, on CD

Appendix
MIXING AND COMPACTION TEMPERATURE DETERMINATIONAlternate Method using Mathematics
Variables:: = viscosity, in centiStokesu = Log10(Log10(:))T = temperature, in Kelvint = Log10(T)m = slope of the lineb = Y axis intercept (Log-Log(Viscosity))
Data: :1 = 379 centiStokes, viscosity at first test temperature T1 = 135° + 273° = 408°Ku1 = Log10(Log10(:1 )) = 0.4114t1 = Log10(T1 ) = 2.611
:2 = 106 centiStokes, viscosity at second test temperature T2 = 160° + 273° = 433°Ku2 = Log10(Log10(:2 )) = 0.3065t2 = Log10(T2 ) = 2.637
m = (u2 - u1 )/(t2 - t1 ) = -4.035b = u1 - m * t1 = 10.9468
Calculations:tx = (ux - b)/m,where ux = Log10(Log10(150, 190, 250, & 310)) = 0.3377, 0.3577, 0.3798, & 0.3964Tx = 10tx
Such that, Tx = 10(ux - 10.9468)/(-4.035)
Mixing: 10(0.3377 - 10.9468)/(-4.035) = 425.9°K
425.9°K (153°C) to421.0°K (148°C)

Appendix
Compaction: 415.7°K (143°C) to 411.8°K (139°C)


