198

SUPERPAVE LEVEL ONE MIX DESIGN AT THE LOCAL GOVERNMENT LEVEL
Final Report
Prepared by:
Timothy R. Clyne Mark P. Hanson
Bruce A. Chadbourn Andrew Drescher
David E. Newcomb
University of Minnesota Department of Civil Engineering
500 Pillsbury Dr. SE Minneapolis, MN 55455-0116
July 2001 Prepared for
Minnesota Department of Transportation
This report represents the results of research conducted by the authors and does not necessarily represent the views or policy of the Minnesota Department of Transportation.
ACKNOWLEDGEMENTS
The authors gratefully acknowledge the financial and technical support provided by the Local
Road Research Board and the Minnesota Department of Transportation (Mn/DOT). Alan
Forsberg of Blue Earth County, and Roger Olson, John Isackson and Jim Schmidt of the
Mn/DOT Office of Materials and Road Research provided technical guidance to the project
team. Koch Materials Company provided the asphalt binders and performed the rut testing, for
which the project team is very thankful. Aggregates were provided by Commercial Asphalt,
Meridian Aggregates, and Blue Earth County. Finally, the contribution of the undergraduate
research assistants, Steve Kummer, Jennifer Matlock and Neal Dawes, was critical to the success
of this project.
TABLE OF CONTENTS CHAPTER 1 - INTRODUCTION -................................................................................................ 1
MOTIVATION ....................................................................................................... 1 RELATIONSHIP TO PREVIOUS WORK ............................................................ 1 OBJECTIVE............................................................................................................ 1 SCOPE .................................................................................................................... 2 ORGANIZATION OF REPORT............................................................................ 2
CHAPTER 2 - LITERATURE REVIEW -..................................................................................... 3
INTRODUCTION................................................................................................... 3 COMPACTION ...................................................................................................... 3 MATERIALS EVALUATION AND THEIR AFFECT ON COMPACTION ...... 6
Binder ................................................................................................................ 6 Aggregate .......................................................................................................... 7 Filler .................................................................................................................. 7
FACTORS AFFECTING COMPACTION ............................................................ 8 Mix Properties ................................................................................................... 8 Environmental ................................................................................................. 10 Layer (Lift) Thickness..................................................................................... 10
VOLUMETRIC PROPERTIES ............................................................................ 10 VOID CONTENT ................................................................................................. 12 MIX DESIGN PROCEDURES ............................................................................ 13
Hveem ............................................................................................................. 13 Marshall........................................................................................................... 14 Superpave ........................................................................................................ 16 Use in Quality Control .................................................................................... 20
RUGGEDNESS EVALUATIONS ....................................................................... 21 Gyratory Compactors ...................................................................................... 21
CONCLUSION ..................................................................................................... 24
CHAPTER 3 RESEARCH METHODOLOGY............................................................................ 27
OVERVIEW.......................................................................................................... 27 MIX DESIGN ....................................................................................................... 27
Summary of Laboratory Mixes ....................................................................... 27 Aggregate Properties ....................................................................................... 28 Gyratory Compactor........................................................................................ 30 Compaction Procedure .................................................................................... 31
RESILIENT MODULUS...................................................................................... 32 MOISTURE SENSITIVITY................................................................................. 34 RUT TESTING ..................................................................................................... 35 LOW TEMPERATURE CREEP TESTING......................................................... 36
CHAPTER 4 RESULTS AND DISCUSSION ............................................................................. 39
RESULTS.............................................................................................................. 39 Aggregate Testing ........................................................................................... 39
Mix Design...................................................................................................... 39 Resilient Modulus ........................................................................................... 46 Moisture Sensitivity ........................................................................................ 48
SAMPLE ID.......................................................................................................... 49 Rut Testing ...................................................................................................... 50 Low Temperature Creep Testing..................................................................... 50
DISCUSSION ....................................................................................................... 51 Mix Design...................................................................................................... 51 Resilient Modulus ........................................................................................... 55 Moisture Sensitivity ........................................................................................ 55 Rut Testing ...................................................................................................... 56 Low Temperature Creep Testing..................................................................... 56
CHAPTER 5 - CONCLUSIONS AND RECOMMENDATIONS – ............................................ 59
CONCLUSIONS................................................................................................... 59 RECOMMENDATIONS ...................................................................................... 61
REFERENCES.............................................................................................................................. 63
APPENDIX A MIX DESIGN
APPENDIX B RESILIENT MODULUS DATA
APPENDIX C APA RUT TEST PROCEDURE
APPENDIX D APA RUT DATA
APPENDIX E IDT CREEP DATA
APPENDIX F IDT STRENGTH DATA
LIST OF TABLES Table 2.1 Summary of Influence on Compaction (Asphalt Institute [15]) ................................... 11 Table 2.2 Effect of Compaction on Hot Mix Asphalt Pavements (Bell, et al [17]) ..................... 12 Table 2.3 Superpave Design Gyratory Compactive Effort (Asphalt Institute [7]) ....................... 19 Table 2.4 Summary of Design and Compaction Methods (D’Angelo, et al [19]) ........................ 21 Table 2.5 Main Factors Evaluated in Ruggedness Experiment (McGennis, et al [20])................ 22 Table 2.6 Variable Combinations used in Ruggedness Experiment (McGennis, et al [20]) ........ 22 Table 3.1 Coarse and Fine Mix Gradations................................................................................... 28 Table 3.2 Fine Aggregate Properties............................................................................................. 29 Table 3.3 Coarse Aggregate Properties......................................................................................... 30 Table 3.4 Mix Design Matrix........................................................................................................ 32 Table 4.1 Fine Aggregate Properties............................................................................................. 40 Table 4.2 Coarse Aggregate Properties......................................................................................... 40 Table 4.3 Summarized Mixed Design Results @ 4% Air Voids* ................................................ 45 Table 4.4 Summarized Mixed Design Results @ 3% Air Voids* ................................................ 45 Table 4.5 Average Resilient Modulus Test Results ...................................................................... 47 Table 4.6 Summarized Moisture Sensitivity Results .................................................................... 49 Table 4.7 Total Surface Area Calculation for Coarse Gradation .................................................. 53 Table 4.8 Total Surface Area Calculation for Fine Gradation ...................................................... 53 Table 4.9 Asphalt Film Thickness Calculations............................................................................ 54 Table A.1 Mix Design Data for Granite Falls Coarse Gradation................................................A-1 Table A.2 Mix Design Data for Granite Falls Fine Gradation....................................................A-2 Table A.3 Mix Design Data for New Ulm Quartzite Coarse Gradation .....................................A-3 Table A.4 Mix Design Data for New Ulm Quartzite Fine Gradation .........................................A-4 Table A.5 Mix Design Data for Kasota Limestone Coarse Gradation........................................A-5 Table A.6 Mix Design Data for Kasota Limestone Fine Gradation............................................A-6 Table A.7 Mix Design Data for Cedar Grove Gravel Coarse Gradation ....................................A-7 Table A.8 Mix Design Data for Cedar Grove Gravel Fine Gradation ........................................A-8 Table A.9 Mix Design Data for New Ulm Quartzite Fine Gradation (PG 58-40)......................A-9 Table A.10 Mix Design Data for Kasota Limestone Fine Gradation (PG 58-40) ....................A-10 Table B.1 Resilient Modulus Results for 0 °F Tests ...................................................................B-1 Table B.2 Resilient Modulus Results for 34 °F Tests .................................................................B-3 Table B.3 Resilient Modulus Results for 77 °F Tests .................................................................B-5 Table B.4 Resilient Modulus Results for 104 °F Tests ............................................................... B-7 Table D.1 Summary of University of Minnesota APA Rut Depths (mm)..................................D-1 Table E.1 KL 52-34 Sample Data (0 °C Tests).......................................................................... E-1 Table E.2 KL 52-34 Sample Data (-10 °C Tests) ...................................................................... E-1 Table E.3 KL 52-34 Sample Data (-20 °C Tests) ...................................................................... E-1 Table E.4 KL 52-34 Test Data (0 °C Tests)............................................................................... E-2 Table E.5 KL 52-34 Test Data (-10 °C Tests) ........................................................................... E-5 Table E.6 KL 52-34 Test Data (-20 °C Tests) ........................................................................... E-8
LIST OF TABLES (continued) Table E.7 KL 58-40 Sample Data (0 °C Tests)........................................................................ E-11 Table E.8 KL 58-40 Sample Data (-10 °C Tests) .................................................................... E-11 Table E.9 KL 58-40 Sample Data (-20 °C Tests) .................................................................... E-11 Table E.10 KL 58-40 Test Data (0 °C Tests)........................................................................... E-12 Table E.11 KL 58-40 Test Data (-10 °C Tests)........................................................................ E-15 Table E.12 KL 58-40 Test Data (-20 °C Tests)........................................................................ E-18 Table E.13 NU 52-34 Sample Data (0 °C Tests) ..................................................................... E-21 Table E.14 NU 52-34 Sample Data (-10 °C Tests) .................................................................. E-21 Table E.15 NU 52-34 Sample Data (-20 °C Tests) .................................................................. E-21 Table E.16 NU 52-34 Test Data (0 °C Tests) .......................................................................... E-22 Table E.17 NU 52-34 Test Data (-10 °C Tests) ....................................................................... E-25 Table E.18 NU 52-34 Test Data (-20 °C Tests) ....................................................................... E-28 Table E.19 NU 58-40 Sample Data (0 °C Tests) ..................................................................... E-31 Table E.20 NU 58-40 Sample Data (-10 °C Tests) .................................................................. E-31 Table E.21 NU 58-40 Sample Data (-20 °C Tests) .................................................................. E-31 Table E.22 NU 58-40 Test Data (0 °C Tests) .......................................................................... E-32 Table E.23 NU 58-40 Test Data (-10 °C Tests) ....................................................................... E-35 Table E.24 NU 58-40 Test Data (-20 °C Tests) ....................................................................... E-38 Table F.1 IDT Specimen Geometry ........................................................................................... F-1 Table F.2 IDT Strength Data (KL 52-34 #2) ............................................................................. F-2 Table F.3 IDT Strength Data (KL 52-34 #5) ............................................................................. F-7 Table F.4 IDT Strength Data (KL 58-40 #1) ........................................................................... F-10 Table F.5 IDT Strength Data (KL 58-40 #10) ......................................................................... F-14 Table F.6 IDT Strength Data (KL 58-40 #12) ......................................................................... F-19 Table F.7 IDT Strength Data (KL 58-40 #8) ........................................................................... F-24 Table F.8 IDT Strength Data (NU 52-34 #6) ........................................................................... F-29 Table F.9 IDT Strength Data (NU 52-34 #8) ........................................................................... F-32 Table F.10 IDT Strength Data (NU 52-34 #9) ......................................................................... F-35 Table F.11 IDT Strength Data (NU 58-40 #11) ....................................................................... F-38 Table F.12 IDT Strength Data (NU 58-40 #12) ....................................................................... F-43 Table F.13 IDT Strength Data (NU 58-40 #9) ......................................................................... F-48
LIST OF FIGURES Figure 2.1 Mohr's Circle ................................................................................................................. 4 Figure 2.2 Compaction Process (after Kari, [5]) ............................................................................. 5 Figure 2.3 Understressed and Overstressed Conditions (after Kari,[5]) ......................................... 6 Figure 2.4 Influence of Filler on Compactive Effort (after Santucci & Schmidt [8])..................... 8 Figure 2.5 Influence of Compaction Temperature on Percent Air Voids (after Parker [11]) ......... 9 Figure 3.1 Experimental Mix Gradations...................................................................................... 29 Figure 3.2 Shear Displacement During Gyratory Compaction ..................................................... 31 Figure 4.1 Air Voids vs. Asphalt Content for Coarse Mixes ........................................................ 40 Figure 4.2 Air Voids vs Asphalt Content for Fine Mixes ............................................................. 41 Figure 4.3 Air Voids vs Asphalt Content for PG 58-40 Mixes..................................................... 41 Figure 4.4 VMA @ Ndes vs. Asphalt Content for Coarse Mixes .................................................. 42 Figure 4.5 VMA @ Ndes vs. Asphalt Content for Fine Mixes ...................................................... 42 Figure 4.6 VMA @ Ndes vs. Asphalt Content for PG 58-40 Mixes .............................................. 43 Figure 4.7 VFA @ Ndes vs. Asphalt Content for Coarse Mixes.................................................... 43 Figure 4.8 VFA @ Ndes vs. Asphalt Content for Fine Mixes........................................................ 44 Figure 4.9 VFA @ Ndes vs. Asphalt Content for PG 58-40 Mixes................................................ 44 Figure 4.10 Influence of Gradation on Stiffness ........................................................................... 47 Figure 4.11 Influence of Aggregate on Stiffness .......................................................................... 48 Figure 4.12 Influence of Asphalt Grade on Stiffness.................................................................... 49
EXECUTIVE SUMMARY This report presents the results of an investigation into the use of the Superpave asphalt mix
design methodology at the local government level in Minnesota. It is commonly believed that
the use of Superpave criteria will result in more costly asphalt mixtures, which may be
prohibitive for cities and counties. A low-cost natural sand was combined with locally available
aggregates from four sources: a limestone, a quartzite, a partially-crushed river gravel and a
granite. The fine aggregate was combined with the coarse aggregates to produce coarse and fine
aggregate gradations for evaluation. Additionally, the use of two asphalt grades, PG 52-34 and
PG 58-40 were investigated.
The mix design effort showed that it was difficult to achieve the Superpave volumetric
requirements of voids in mineral aggregate (VMA) and voids filled with asphalt at 4 percent air
voids for a 12.5-mm maximum aggregate size, regardless of whether the gradation was coarse or
fine. It was found that a target air void content of 3 percent allowed the VFA requirement to be
satisfied, even though the VMA requirement could not be fulfilled. Compaction data showed
that the fine aggregate gradations produced densities which would indicate that the mixtures
might be tender during construction, but which would not necessarily be susceptible to rutting.
The coarse-graded mixtures did not show the tenderness problem, but did show that they might
be susceptible to rutting.
Resilient modulus testing showed little or no difference in the mixtures, regardless of aggregate
source or gradation. The difference in resilient modulus due to asphalt grade was apparent only
at the intermediate temperatures, and not at the highest or lowest test temperatures. Moisture
sensitivity testing showed that all the mixtures studied had adequate durability. This was likely
due to higher asphalt content.
Low temperature creep compliance testing indicated that mixtures made with PG 58-40 binder
may be less susceptible to low temperature cracking than those made with PG 52-34 binder.
Asphalt Pavement Analyzer (APA) rut testing indicated that PG 58-40 mixtures may also be less
susceptible to rutting in the asphalt layer than PG 52-34 mixtures. While aggregate type had
little effect on the measured rut depth in PG 58-40 mixtures, PG 52-34 limestone mixtures had
almost twice the rut depth of PG 52-34 quartzite mixtures.
For low-volume roads, it is recommended that if VMA requirements cannot be met using
standard Superpave procedures, a lower design air void content of three percent be used with a
fine aggregate gradation to ensure durability. Although this may result in tenderness problems,
these may normally be overcome by adjustments in field compaction procedures.
In addition, decreasing the lower binder grade and increasing the upper PG binder grade may be
effective in improving the low temperature cracking resistance and rut resistance of a pavement,
respectively.
CHAPTER 1 - INTRODUCTION -
MOTIVATION
The Strategic Highway Research Program (SHRP) Superpave asphalt mixture design system,
with its stringent material requirements was specifically developed to produce pavements to meet
the expectations of the American public. The Superpave system includes a performance graded
asphalt binder system, criteria for aggregate properties, a new mix design procedure using the
Superpave gyratory compactor, and refined procedures and requirements for mixture analysis.
To date, the Superpave system has primarily been used on medium to high volume roadways,
where funding is more readily available. Issues concerning aggregate availability and local
economy have limited its use on low-volume roads at the local government level. Therefore, the
question is: Can the material and testing requirements of the Superpave system be economically
applied at the local government level without compromising pavement performance? To answer
the above question, the two key requirements of the Superpave system, material requirements
and testing requirements, were evaluated.
RELATIONSHIP TO PREVIOUS WORK
The Superpave system has existed since 1987 when it was developed by the Strategic Highway
Research Program (Asphalt Institute, 1996). It has been used with varying degrees of success by
several State Departments of Transportation on high-volume roads such as urban interstates.
Due to its high material and construction costs relative to other mix design systems, however, its
use at the local government level has yet to be widely accepted. The results of this research
presents a slightly modified Superpave system for use at the local level for low-volume roadways
in the state of Minnesota.
OBJECTIVE
The intent of this research was to investigate the feasibility of using the Superpave Level One
mix design system at the local government level for use on low-volume roadways in the state of
Minnesota. The effects of different gradations, aggregate sources, and asphalt performance
grades were evaluated.
1
SCOPE
Two different aggregate gradations were evaluated: coarse and fine. The fine aggregate
(passing the 9.5 mm (3/8 in.) sieve) in all mixes was composed solely of a sand from Lakeland,
Minnesota—a very readily available, low-cost aggregate. Four different coarse aggregates
(retained on the 12.5 mm (1/2 in.) and 9.5 mm (3/8 in.) sieves) were evaluated: Granite Falls
granite, New Ulm quartzite, Kasota limestone, and Cedar Grove gravel—all readily available at
varying costs. Lastly, the effects of two different asphalt performance grades (PG 52-34 and PG
58-40) were evaluated. A Brovold gyratory compactor was used to prepare all samples.
ORGANIZATION OF REPORT
This report is arranged into five sections: Introduction, Literature Review, Research
Methodology, Results and Discussion, and Conclusions and Recommendations. The Literature
Review provides a background on the mechanics of asphalt compaction, the importance of
volumetrics, and current mix design methods—with special emphasis on the Superpave method.
Research Methodology discusses the aggregate properties, laboratory mixtures, gyratory
compactor, compaction procedure, test methods and data analysis methods. Results and
Discussion presents the results of the mix design, resilient modulus tests, moisture sensitivity
tests, low-temperature behavior and rutting characteristics and discusses their significance. The
report closes with some final conclusions and recommendations. Literature sources used as
supporting references are cited in the bibliography and additional summarized test data are
provided in the appendices.
2
CHAPTER 2 - LITERATURE REVIEW -
INTRODUCTION
The purpose of compaction is to densify an asphalt pavement. Resistance to shear deformation
cannot be developed without close contact of the aggregate particles in the mix. The close
contact of the particles allows the development of interparticle friction necessary to resist
displacement of the mix under load. Likewise, the development of a high degree of
impermeability results only when a well-designed and manufactured mix is thoroughly
compacted. It has been conclusively shown that the durability of the pavement is directly related
to permeability—the amount of air and water passing through the mix. Exposure to air may
cause oxidation of the asphalt leading to premature hardening of the pavement and a
susceptibility to cracking and stripping. According to Marker [1], unless the compactive effort
has placed the particles close enough together, the tensile strength of a mix cannot be developed
by the cohesiveness of the asphalt films coating each particle. Simply stated, a tough, durable,
smooth pavement can only be accomplished with proper compaction.
COMPACTION
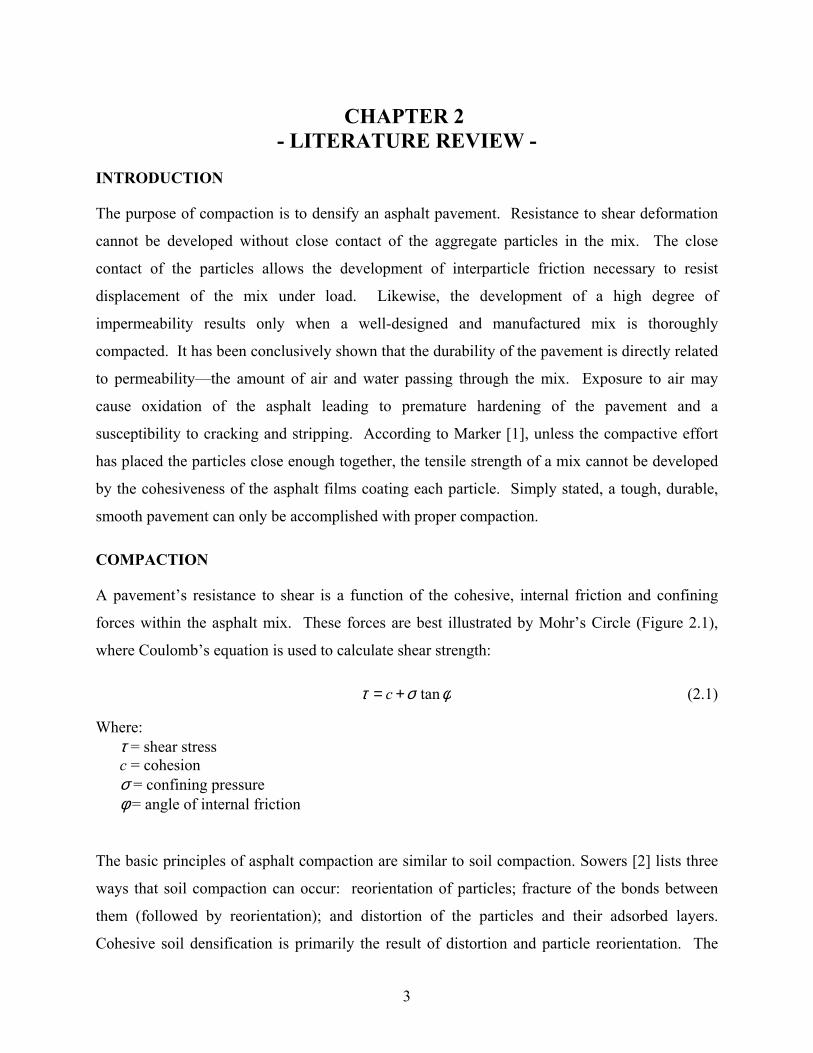
A pavement’s resistance to shear is a function of the cohesive, internal friction and confining
forces within the asphalt mix. These forces are best illustrated by Mohr’s Circle (Figure 2.1),
where Coulomb’s equation is used to calculate shear strength:
φστ tan+= c (2.1)
Where: τ = shear stress c = cohesion σ = confining pressure φ = angle of internal friction
The basic principles of asphalt compaction are similar to soil compaction. Sowers [2] lists three
ways that soil compaction can occur: reorientation of particles; fracture of the bonds between
them (followed by reorientation); and distortion of the particles and their adsorbed layers.
Cohesive soil densification is primarily the result of distortion and particle reorientation. The
3
fracturing and reorientation of particles enables densification of cohesionless soils such as
crushed rock. The internal friction between particles, however, resists particle reorientation.
Therefore, increasing aggregate angularity increases the material’s resistance to densification.
Figure 2.1 Mohr's Circle
The moisture content of soils, similar to asphalt content in hot mix asphalt, plays an important
role in densification. In cohesive materials, the interparticle cohesive forces decrease as
moisture content increases. Increasing moisture content in cohesionless materials cause the
capillary tension between particle grains to decrease. Sowers [2] stated that the resulting
decrease in interparticle contact pressures decreases the internal friction of the soil. Increases in
moisture contents to optimum levels prior to compaction results in the most effective compactive
effort.
Another important element of effective compaction is lateral confinement of the material. In the
laboratory, confinement of the mixture is achieved via the mold. In the field, the flow properties
of the material must enable adequate resistance to lateral flow. Geller [3] demonstrated that
without lateral flow confinement, vertical compression cannot take place. The confining ability
of pneumatic (rubber-tire) rollers makes them ideal for compacting tender mixtures.
Nijboer [4] explained the three primary forces resisting compaction within hot mix asphalt:
1. the angle of internal friction (frictional resistance)
2. the initial resistance (cohesive and interlocking resistances)
4
3. the viscous resistance (viscosity of the mix times rate of flow)
The first resistance, angle of internal friction, is primarily a function of the aggregate properties.
The second, initial resistance, is a function of the bitumen and filler properties acting as a thin
film coating the aggregate, the interlocking action of the particle shapes comes into effect toward
the completion of the compaction process. Viscous resistance is a function of both aggregate and
binder properties.
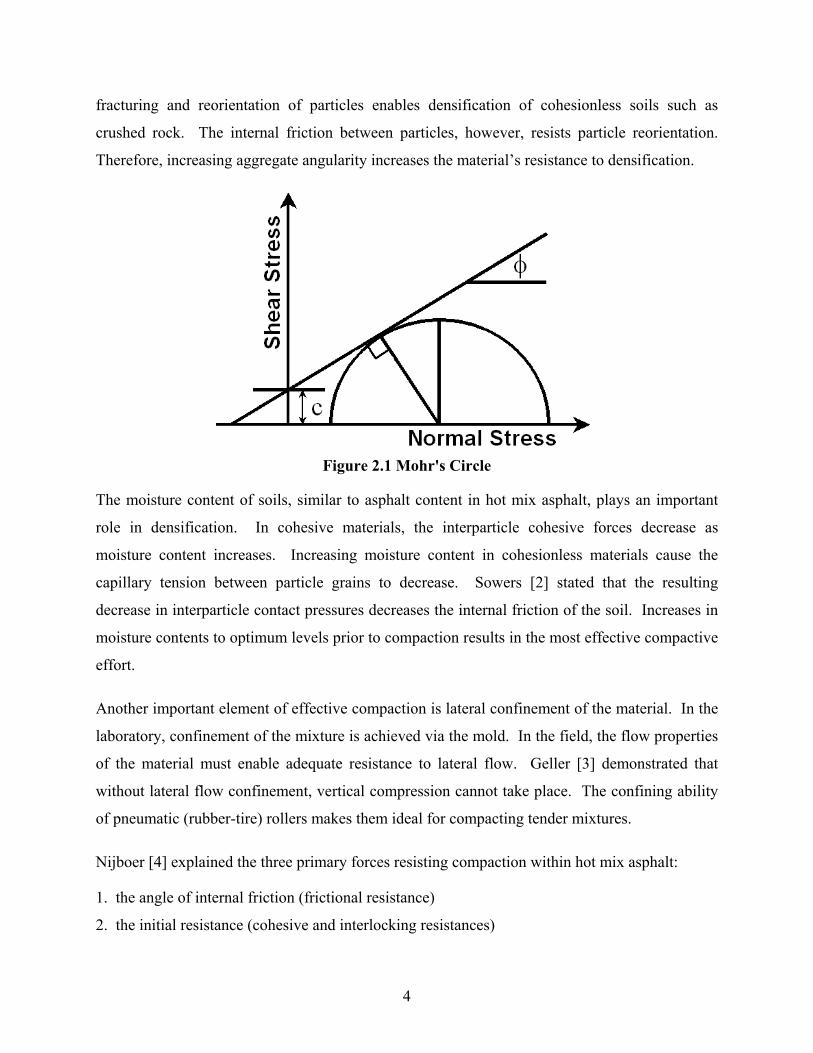
Kari [5] explained how in the field, the rolling of a hot asphalt concrete pavement provides a
means of applying vertical pressure and kneading action to a mix enabling densification to occur.
The conditions existing under a moving roller are shown in Figure 2.2. The roller wheel or tires
sink into the asphalt mix until the contact area is large enough to reduce the contact pressure of
the wheel to approximately that of the mix’s bearing capacity. The roller wheel’s motion creates
shear forces within the asphalt. The horizontal shear forces developed in the front and rear of the
roller create zones of decompaction within the pavement. The vertical shear forces developed
directly underneath the roller wheel create a zone of compaction.
Figure 2.2 Compaction Process (after Kari, [5])
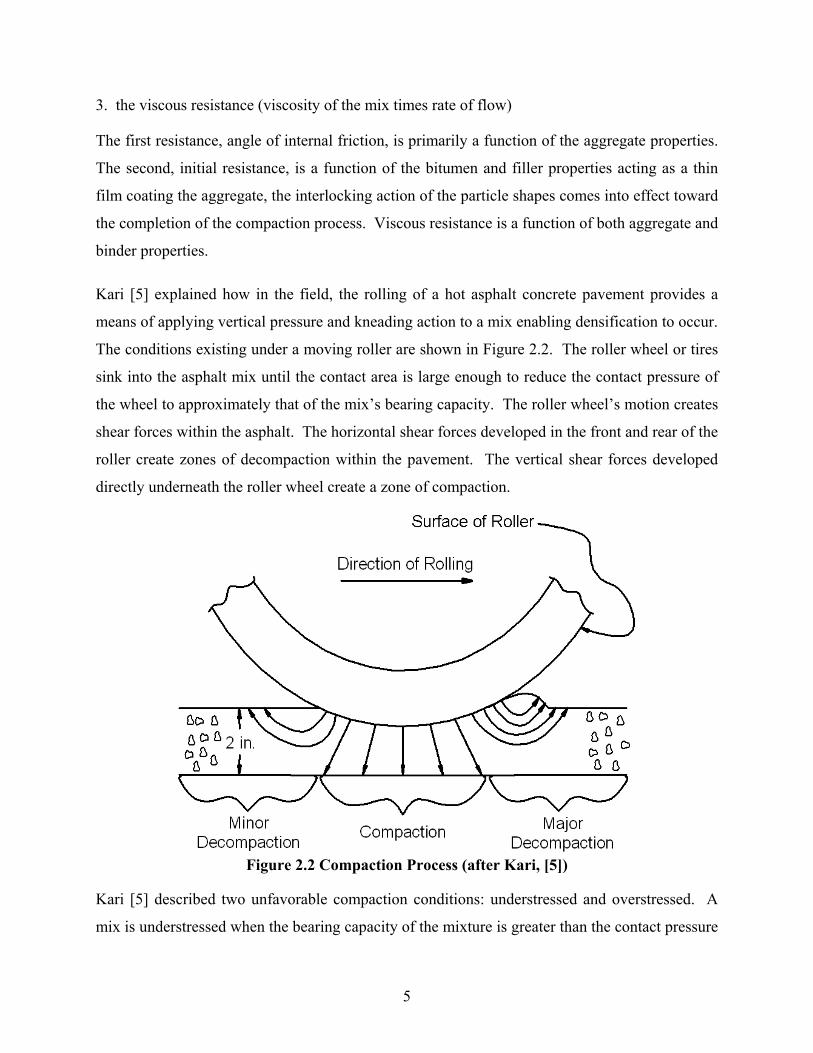
Kari [5] described two unfavorable compaction conditions: understressed and overstressed. A
mix is understressed when the bearing capacity of the mixture is greater than the contact pressure
5
applied by the roller—the roller simply rides on top of the mix without any compaction taking
place (Figure 2.3). A mix is overstressed when it cannot support the weight of the roller—the
roller sinks deep into the mix resulting in shoving and severe cracking but little to no
densification. Thus, the bearing capacity of the mix and the roller weight and configuration must
complement each other to achieve maximum density and toughness.
Figure 2.3 Understressed and Overstressed Conditions (after Kari,[5])
MATERIALS EVALUATION AND THEIR AFFECT ON COMPACTION
Binder
The asphalt binder is considered a viscoelastic material because it exhibits properties of both a
viscous and an elastic material. As such, the asphalt binder affects compaction in a variety of
ways. The viscosity of asphalt is extremely temperature dependent: at room temperature asphalt
is virtually a solid, above 121 °C it is a fluid. Increasing the temperature of a mixture decreases
the binder’s viscosity causing a reduction in the overall stiffness of the mix. If a mix is too hot, it
will be tender and move laterally from underneath the roller. Conversely, as the mix cools, it
stiffens, requiring a greater compactive effort to densify it.
The influence of the binder on an asphalt mixture’s resistance to compaction was shown in a
study by McLeod [6]. A high viscosity asphalt cement at a typical placement temperature of
135 °C has a viscosity of approximately 5 poise. The viscosity of the same asphalt cement at
63 °C, when rolling often ends, was 5000 poise—a 1000-fold increase. The respective Marshall
stabilities of the mix at the two temperatures were 667 N and 6672 N - a 10-fold increase. In
only a 72 °C temperature difference, a 1000-fold increase in the binder’s viscosity resulted in a
10-fold increase in the mix’s strength.
6
Aggregate
Gradation, surface texture and angularity are the primary aggregate characteristics affecting the
workability and resistance to compaction of a mix. Larger aggregate sizes and/or higher coarse
aggregate percentages result in lower workability and higher compactive efforts. Likewise, a
rough surface texture, as opposed to a smooth, glassy texture, results in a stiffer, less workable
mix. Using highly angular coarse and fine aggregate results in a high degree of internal friction
(and thus, high shear strength), increasing the resistance of the mix to permanent deformation.
According to the Asphalt Institute [7], limiting the percentage of elongated particles minimizes
the potential for aggregate crushing during mixing and construction.
If workability is too low, rounded sands are often added to increase the mix’s workability.
However, too much rounded sand results in tender mixes—mixes with high workability but low
stability. Tender mixes are often easily overstressed by heavy rollers and over-rolling resulting
in the lateral movement of the mix from under the roller.
Filler
Fines, or filler content, affect the compactibility of a mix because they combine with the asphalt
cement to provide the binding, cohesive forces of the mix. Filler material increases the effective
viscosity of the binder matrix, effectively creating a mastic.
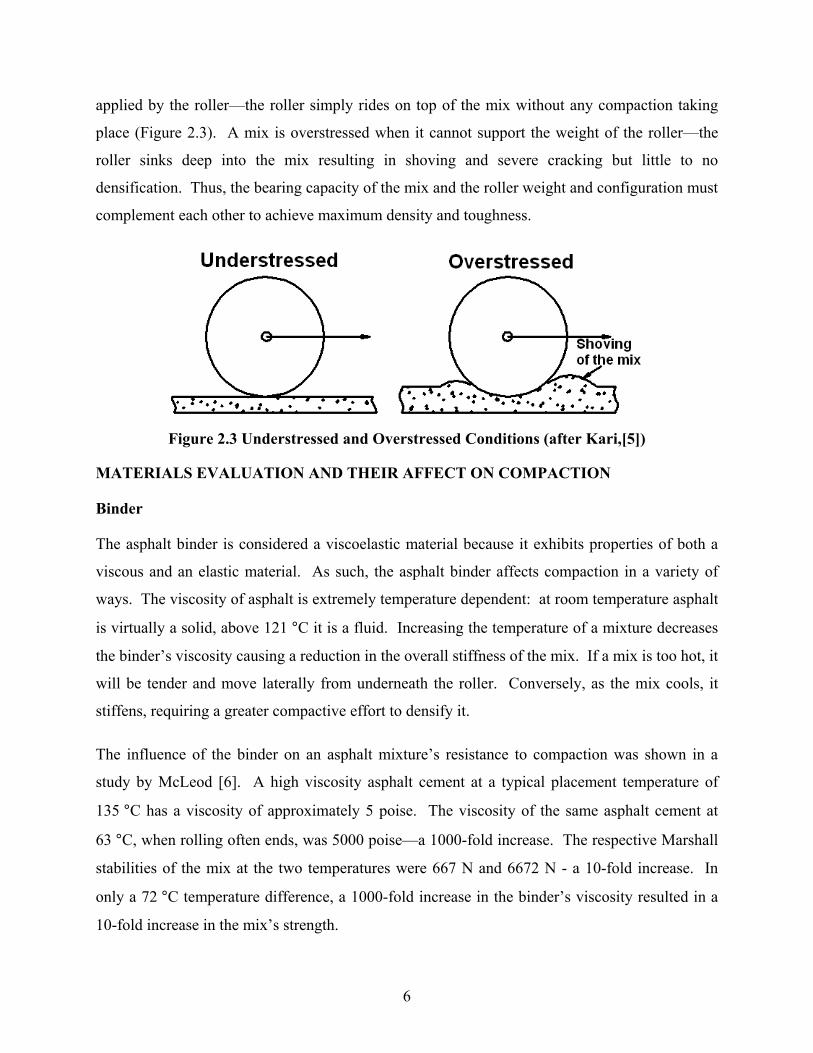
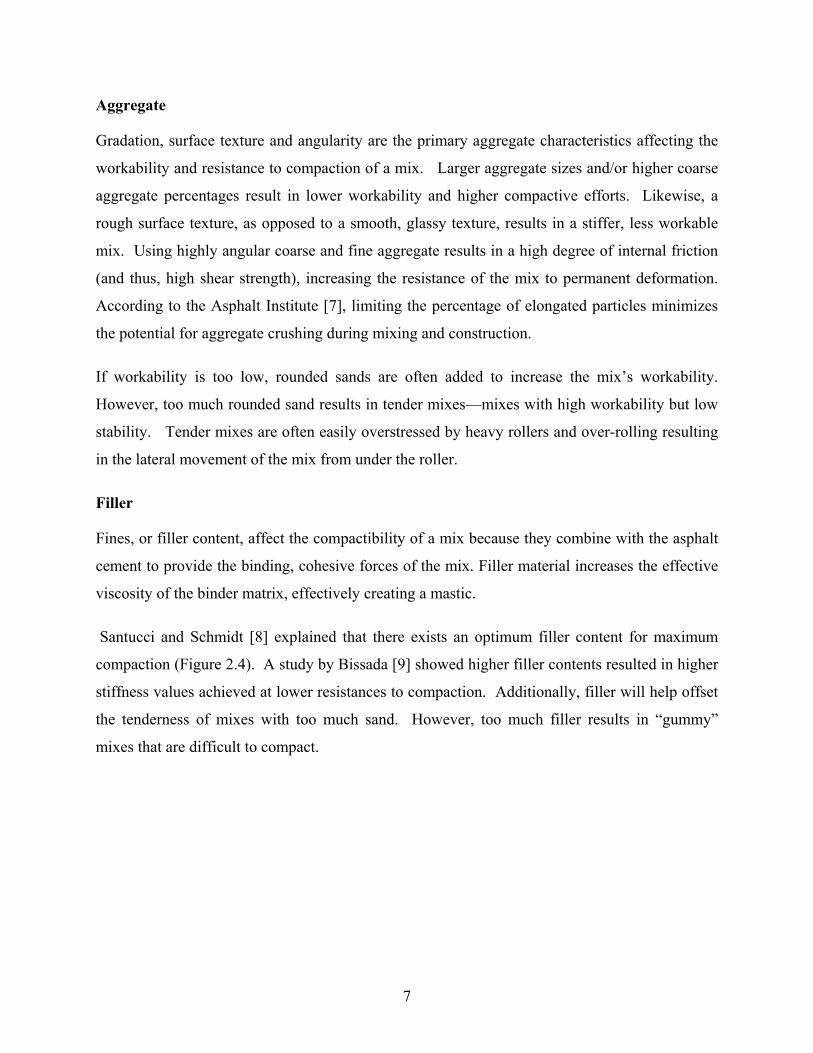
Santucci and Schmidt [8] explained that there exists an optimum filler content for maximum
compaction (Figure 2.4). A study by Bissada [9] showed higher filler contents resulted in higher
stiffness values achieved at lower resistances to compaction. Additionally, filler will help offset
the tenderness of mixes with too much sand. However, too much filler results in “gummy”
mixes that are difficult to compact.
7
CACHE CREEKROUNDED GRAVEL
FILLER PLUS ASPHALTVOLUM E = 15%
82
83
84
85
86
87
0 0.1 0.2 0.3 0.4 0.5 0.6
Filler to Asphalt Ratio (Volume Basis)
Figure 2.4 Influence of Filler on Compactive Effort (after Santucci & Schmidt [8])
FACTORS AFFECTING COMPACTION
Mix Properties
At higher temperatures, the lower viscosity of the asphalt cement causes it to act as a liquid,
allowing the aggregate particles to effectively interlock. At slightly lower temperatures, the
binder acts as a lubricant permitting the aggregate to shift and densify during compaction.
Further reduction in temperature results in a stiffening of the binder where its cohesion will
prevent further densification.
As the asphalt content increases, so does the film thickness of the asphalt on the aggregate. At
compaction temperatures, the thicker films increase the lubricating effect of the asphalt.
Additionally, a study by Harvey and Tsai [10] showed pavement overlay life increased 10 to 20
percent with each 0.5% increase in asphalt content (when compacted to the same air void
content) with respect to fatigue. If asphalt contents are excessive, however, the resulting tender
mix will bleed.
8
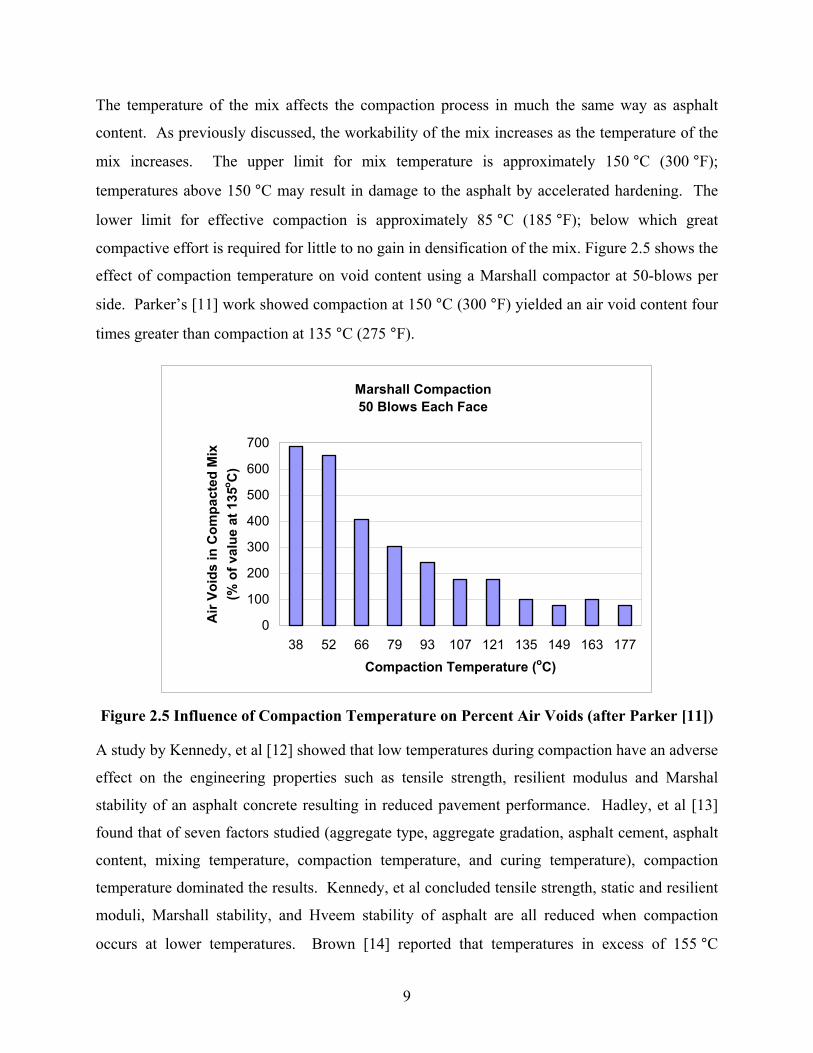
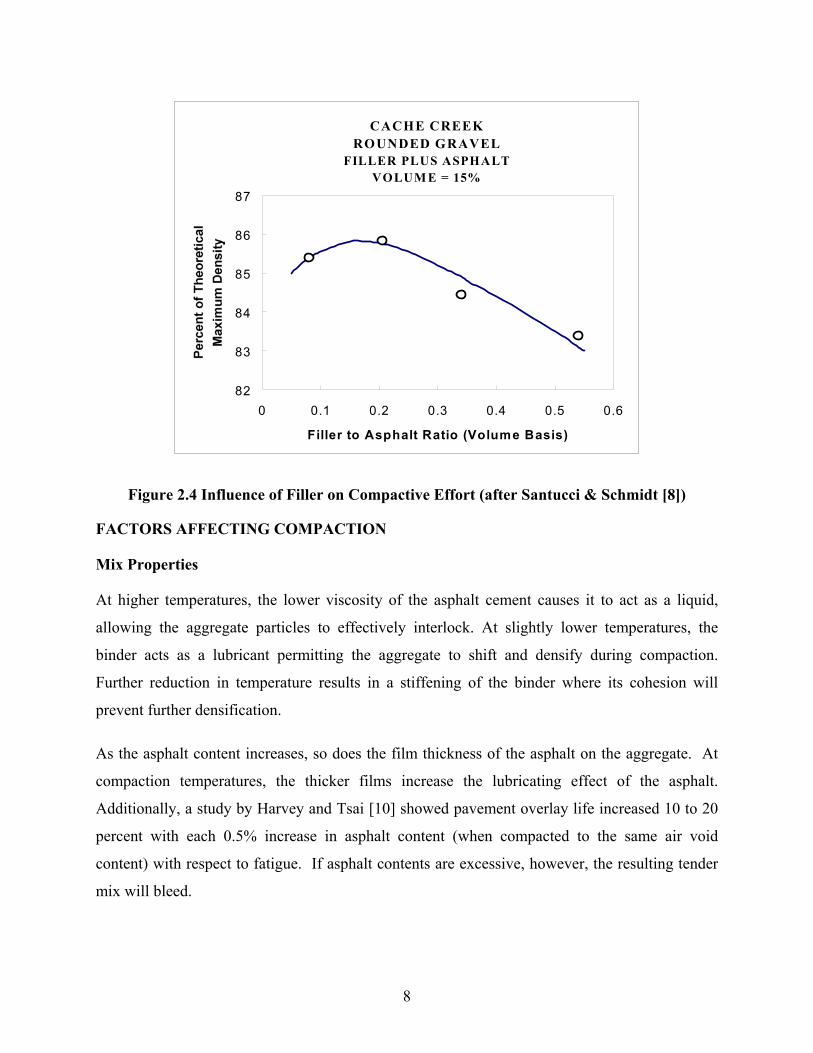
The temperature of the mix affects the compaction process in much the same way as asphalt
content. As previously discussed, the workability of the mix increases as the temperature of the
mix increases. The upper limit for mix temperature is approximately 150 °C (300 °F);
temperatures above 150 °C may result in damage to the asphalt by accelerated hardening. The
lower limit for effective compaction is approximately 85 °C (185 °F); below which great
compactive effort is required for little to no gain in densification of the mix. Figure 2.5 shows the
effect of compaction temperature on void content using a Marshall compactor at 50-blows per
side. Parker’s [11] work showed compaction at 150 °C (300 °F) yielded an air void content four
times greater than compaction at 135 °C (275 °F).
Marshall Compaction50 Blows Each Face
0
100
200
300
400
500
600
700
38 52 66 79 93 107 121 135 149 163 177Compaction Temperature (oC)
Air
Void
s in
Com
pact
ed M
ix
(% o
f val
ue a
t 135
o C)
Figure 2.5 Influence of Compaction Temperature on Percent Air Voids (after Parker [11])
A study by Kennedy, et al [12] showed that low temperatures during compaction have an adverse
effect on the engineering properties such as tensile strength, resilient modulus and Marshal
stability of an asphalt concrete resulting in reduced pavement performance. Hadley, et al [13]
found that of seven factors studied (aggregate type, aggregate gradation, asphalt cement, asphalt
content, mixing temperature, compaction temperature, and curing temperature), compaction
temperature dominated the results. Kennedy, et al concluded tensile strength, static and resilient
moduli, Marshall stability, and Hveem stability of asphalt are all reduced when compaction
occurs at lower temperatures. Brown [14] reported that temperatures in excess of 155 °C
9
(310 °F), however, can cause compaction problems (lateral movement) and increase oxidation of
the binder which can result in hard and brittle pavements.
Environmental
According to the Asphalt Institute [15], the rate at which an asphalt mix cools directly affects the
length of time during which density can and must be achieved. The ambient air temperature,
humidity, wind velocity and the surface temperature under the mix all affect the rate of cooling
of a freshly placed asphalt layer. Cool air temperatures, high humidity, strong winds, and cool
surfaces either alone or together adversely shrink the effective compaction window.
Layer (Lift) Thickness
Thicker asphalt layers retain heat longer. Therefore, less compactive effort is required to achieve
target density in thicker asphalt layers than in thinner layers. The heat-retaining ability of larger
lifts make their use desirable when placing stiffer mixes or when paving in adverse
environmental conditions. The Asphalt Institute [15] stated that retained heat of thicker lifts also
permits lower paving temperatures, so either lower mixing temperatures or longer hauling
distances are possible. A summary of the factors affecting compaction and their corrective
actions can be found in Table 2.1.
VOLUMETRIC PROPERTIES
Characterization of asphalt mixtures generally consists of several volumetric properties including
voids in the total mix (VTM), voids in the mineral aggregate (VMA) and voids filled with
asphalt (VFA). The most important property in construction is VTM, or air voids, a direct
relation to density. A mix having 4% air voids has a density of 96% of maximum. Research and
past performance have shown a final compacted void content of 4% is ideal for most dense-
graded mixtures. Generally, mixes having low compacted air voids (less than 3%) will be
unstable and exhibit premature rutting. Mixes having high air voids (greater than 8%) will
generally be permeable to water leading to an increased oxidation rate resulting in premature
raveling and/or cracking. It is important to note, however, that these figures are nothing more
than generalizations. It is quite possible to have an outstanding, long-lasting pavement that
compacted to 98% density (2% air voids).
10
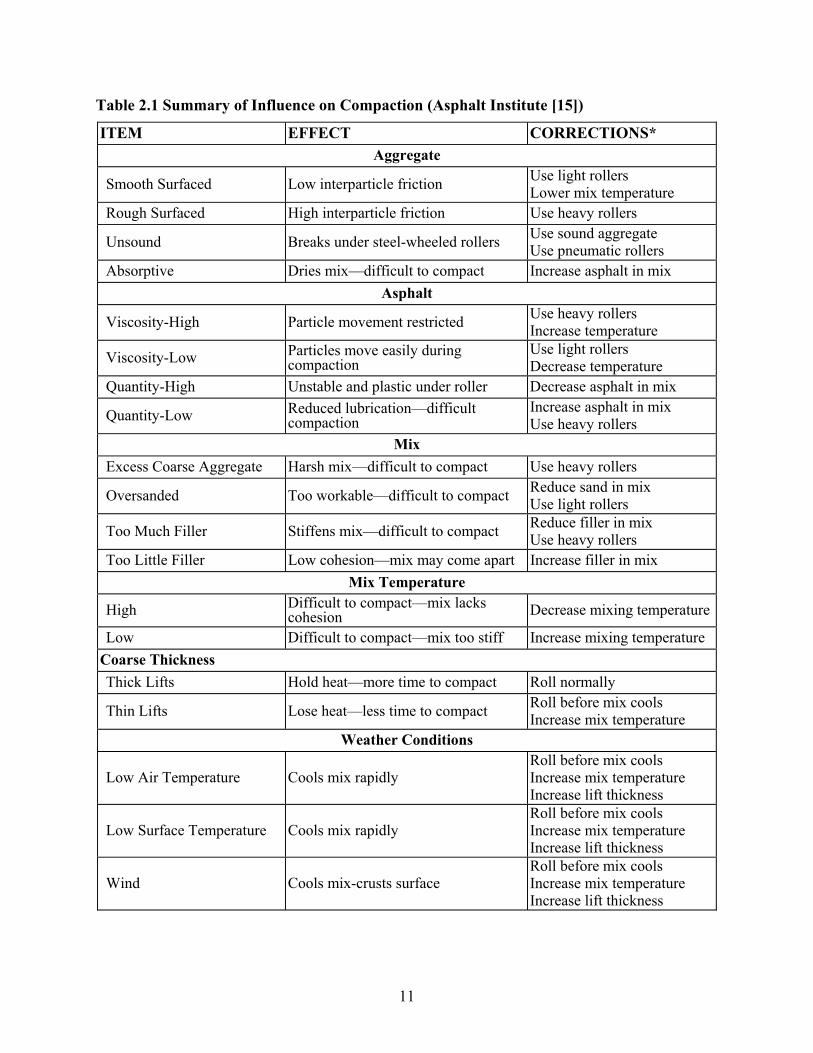
Table 2.1 Summary of Influence on Compaction (Asphalt Institute [15])
ITEM EFFECT CORRECTIONS* Aggregate
Smooth Surfaced Low interparticle friction Use light rollers Lower mix temperature
Rough Surfaced High interparticle friction Use heavy rollers
Unsound Breaks under steel-wheeled rollers Use sound aggregate Use pneumatic rollers
Absorptive Dries mix—difficult to compact Increase asphalt in mix Asphalt
Viscosity-High Particle movement restricted Use heavy rollers Increase temperature
Viscosity-Low Particles move easily during compaction
Use light rollers Decrease temperature
Quantity-High Unstable and plastic under roller Decrease asphalt in mix
Quantity-Low Reduced lubrication—difficult compaction
Increase asphalt in mix Use heavy rollers
Mix Excess Coarse Aggregate Harsh mix—difficult to compact Use heavy rollers
Oversanded Too workable—difficult to compact Reduce sand in mix Use light rollers
Too Much Filler Stiffens mix—difficult to compact Reduce filler in mix Use heavy rollers
Too Little Filler Low cohesion—mix may come apart Increase filler in mix Mix Temperature
High Difficult to compact—mix lacks cohesion Decrease mixing temperature
Low Difficult to compact—mix too stiff Increase mixing temperature Coarse Thickness Thick Lifts Hold heat—more time to compact Roll normally
Thin Lifts Lose heat—less time to compact Roll before mix cools Increase mix temperature
Weather Conditions
Low Air Temperature Cools mix rapidly Roll before mix cools Increase mix temperature Increase lift thickness
Low Surface Temperature Cools mix rapidly Roll before mix cools Increase mix temperature Increase lift thickness
Wind Cools mix-crusts surface Roll before mix cools Increase mix temperature Increase lift thickness
11
VMA, the void space in the aggregate, and probably the most important volumetric property in
design, is primarily a function of aggregate gradation, particle shape and surface texture. Since
VMA includes air voids (it is the sum of VTM and VFA), low VMA indicates low film coating
on the aggregate because there is not enough void space for the asphalt to adequately coat the
particles without overfilling the void space. Since overfilling the void space is the same as
having a low VTM, premature and excessive rutting can result.
Although of great importance in volumetric proportioning, as the difference between VTM and
VMA, VFA is typically not mentioned in volumetric discussions. However, for the purposes of
generalities, typical VFA values as reported by Roberts, et al [16], range from 50-70%. When
VFA exceeds 80-85%, the voids are considered overfilled (with asphalt) resulting in the low
stability problems explained above.
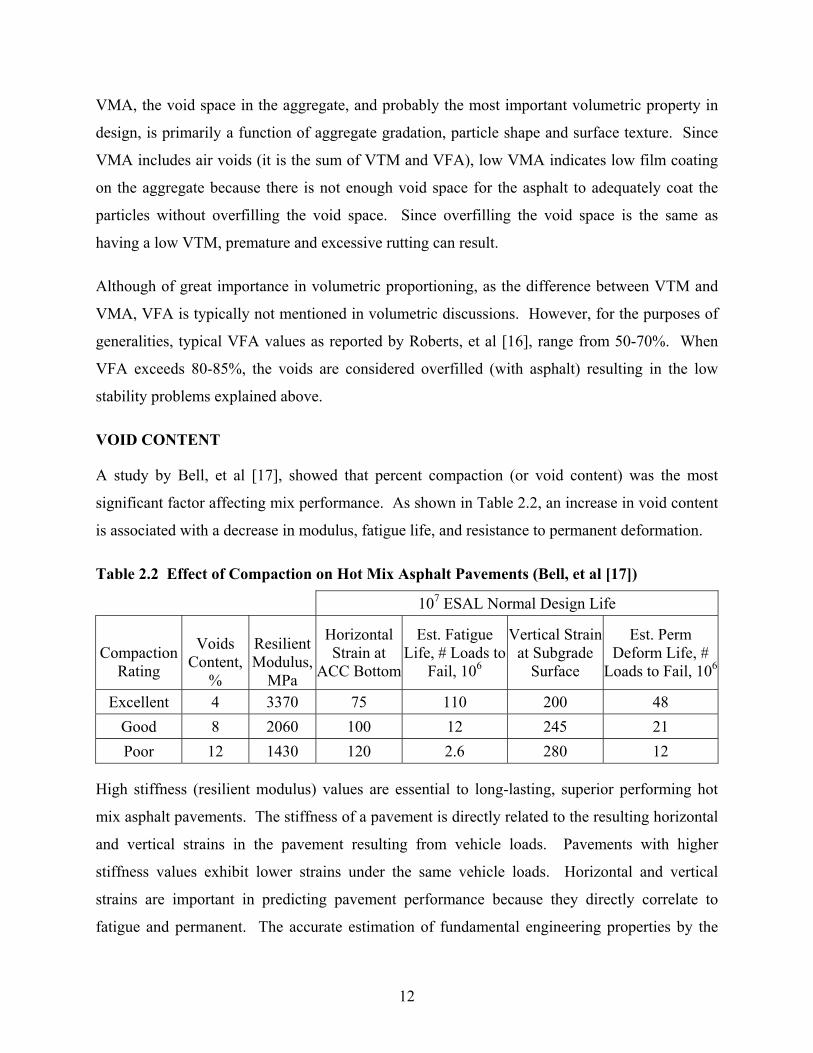
VOID CONTENT
A study by Bell, et al [17], showed that percent compaction (or void content) was the most
significant factor affecting mix performance. As shown in Table 2.2, an increase in void content
is associated with a decrease in modulus, fatigue life, and resistance to permanent deformation.
Table 2.2 Effect of Compaction on Hot Mix Asphalt Pavements (Bell, et al [17])
107 ESAL Normal Design Life
Compaction
Rating
Voids
Content, %
Resilient Modulus,
MPa
Horizontal Strain at
ACC Bottom
Est. Fatigue Life, # Loads to
Fail, 106
Vertical Strain at Subgrade
Surface
Est. Perm Deform Life, #
Loads to Fail, 106
Excellent 4 3370 75 110 200 48 Good 8 2060 100 12 245 21 Poor 12 1430 120 2.6 280 12
High stiffness (resilient modulus) values are essential to long-lasting, superior performing hot
mix asphalt pavements. The stiffness of a pavement is directly related to the resulting horizontal
and vertical strains in the pavement resulting from vehicle loads. Pavements with higher
stiffness values exhibit lower strains under the same vehicle loads. Horizontal and vertical
strains are important in predicting pavement performance because they directly correlate to
fatigue and permanent. The accurate estimation of fundamental engineering properties by the
12
consistent simulation of field compaction is key to a laboratory compaction method’s (Hveem,
Marshall, gyratory) value in the prediction of long-term pavement performance.
The Asphalt Institute found that changes in stiffness and void content affected fatigue life
according to the following expression:
(2.2) ( ) ( )854.029.331032.44.18 −−−××= ECN tf ε
Where: Nf = number of load applications to failure C = a factor dependent on the asphalt and void contents εt = tensile strain E = modulus of asphalt mixture
Bell, et al [17] used the above equation to calculate the fatigue values shown in Table 2.2. The
table clearly shows the profound effect void content has on fatigue life. A 50% reduction in void
content from eight to four percent air voids results in nearly a 10-fold increase in fatigue life.
Permanent deformation of flexible pavement may be due to either densification or shear
deformation. Densification, or further compaction by traffic, can be reduced by ensuring good
compaction during construction. Shear deformation occurs when one or more pavement layers
lack bearing capacity. Vertical pressure in unstable layers can be reduced by using stiffer mixes
resulting from better compaction. Bell et al [17] found a two-fold increase in the estimated
permanent deformation lives of a pavement when reducing the void content from eight to four
percent (see Table 2.2).
MIX DESIGN PROCEDURES
Hveem
The basic philosophy of the Hveem method of mix design is summarized by Roberts et al [16]:
1. It should provide sufficient asphalt cement for aggregate absorption and to produce an optimum film content of asphalt cement on the aggregate.
2. It should produce a compacted aggregate-asphalt cement mixture with sufficient stability to resist traffic.
3. It should contain enough asphalt cement for durability from weathering including the effects of oxidation and moisture susceptibility.
13
In short, the Hveem method of mix design attempts to maximize durability by selecting the
highest asphalt content while still exceeding the minimum stability requirements. The Hveem
method has two primary advantages. First, the kneading action of laboratory densification
(achieved by a rotating ram having about 1/4 the contact area of the 101.6 mm (4”) diameter
mold) simulates the densification characteristics of hot mix asphalt compacted in the field.
Second, Hveem stability is a direct measurement of the internal friction component of shear
strength because it measures the ability of a test specimen to resist lateral displacement from
application of a vertical load. However, the Hveem compactor is somewhat expensive, large,
and not very portable. Furthermore, the important mixture volumetric properties described
above are not routinely determined as part of the Hveem procedure.
The Hveem method uses the oil soak and Centrifuge Kerosene Equivalent (CKE) tests to aid in
determining fine and coarse aggregate absorption for use in estimating the initial asphalt
requirements of the mix. Once the initial asphalt content (IAC) is determined, test specimens are
prepared containing the IAC, 0.5% and 1.0% above the IAC and 0.5% below the IAC.
Compacted samples are put through stabilometer and cohesiometer tests to measure stiffness, a
swell test to measure the mix’s resistance to moisture, and a density-voids analysis. The
optimum asphalt content is determined via a convoluted process involving a highly complex
chart requiring several inputs and correction factors.
Marshall
A primary advantage of the Marshall method is the attention given to density and voids
properties of asphalt mixtures. This analysis ensures the proper volumetric proportions of
mixture materials for achieving a durable hot mix asphalt. Additionally, the required equipment
is inexpensive and portable thereby lending itself to quality control operations. The Marshall
hammer used in the Marshall method is repeatedly dropped onto a sample a prescribed number
of times dependent on the estimated traffic level. However, without a kneading action imparting
the horizontal shear forces created by rollers, the Marshall hammer does not simulate mixture
densification as it occurs in the field. Furthermore, as explained by Brown, et al [18], the high
variability of results and limited ability to simulate field conditions (temperature, load rate, tire
pressures, etc.) of Marshall stability does not adequately estimate the shear strength of hot mix
14
asphalt. The Asphalt Institute [7] stated that these two situations make it difficult to ensure
rutting resistance of the designed mixture.
The two principle features of the Marshall method of mix design are a density-voids analysis and
a stability-flow test of the compacted test specimens. The stability of the test specimens is the
maximum load resistance in Newtons (lb.) that the standard test specimen will develop at 60 °C
(140 °F). The flow value is the total movement or strain, in units of 0.25 mm (1/100 in.),
occurring in the specimen between no load and maximum load during the stability. After
determination of an optimum asphalt content, the density-voids analyses and the stability-flow
tests are completed on five sets of three samples containing the optimum content, and 0.5 % and
1.0 % above and below optimum.
In the Marshall method, the mix is compacted using a 101.6 mm (4 in.) diameter by 75 mm (3
in.) high mold and a 4.5 kg (10 lb.) compaction hammer constructed to obtain a 457 mm (18 in.)
drop height. Depending on design traffic load, the weight is dropped from its 457 mm height 35
times (light traffic), 50 times (medium traffic) or 75 times (heavy traffic). The mold is inverted
and the same number of blows are repeated.
Brown [14] found that the advent of the mechanical Marshall hammer actually decreased the
effectiveness of Marshall compaction in simulating field compaction. Prior to the advent of
mechanical compactors, the top of the hammer was held with one hand while the hammer was
raised and dropped with the other. The inability to keep the hammer perfectly vertical resulted in
a kneading action. Guides on mechanical hammers reduce the kneading action resulting in
substantially different laboratory densities. The Marshall compactor is effective in achieving
densification from grain fracturing and particle layer distortion but without a kneading action,
densification through particle reorientation is minimal. On examining density-voids
relationships of airfield pavements in Kuwait, Bissada [9] found that even the 75-blow Marshall
compaction effort was inadequate as a realistic standard for predicting future densification under
traffic. The characteristics of Marshall compacted specimens were not necessarily representative
of their lifetime service performance.
15
Superpave
The Strategic Highway Research Program (SHRP) spent five years developing a new mix design
methodology, named Superior Performing Pavements, or Superpave. Roberts, et al [16]
described several differences between Superpave and the Marshall and Hveem methods: it uses a
new “Performance Grade” system for grading asphalt cement; it uses consensus properties for
aggregate selection; and it contains new mix design and mixture analysis procedures. The
Asphalt Institute [8] described Superpave as a performance-based system because the mixture
tests and analyses have direct relationships to field performance.
Traditional grading of asphalts, such as penetration or viscosity graded asphalts, were based on
physical properties at standard temperatures. However, such grading systems have two
important shortcomings. First, their empirical nature limits their applicability beyond those
conditions in which it was developed. A second limitation of previous grading systems is the
lack of performance testing over the same temperature range the asphalt will likely see in the
field. Superpave’s performance graded asphalt system differs from previous grading systems in
that the tests measure physical properties that can be directly related to field performance by
engineering principles. Another unique feature of the Superpave binder specification system is
that instead of performing a test at a constant temperature and varying the specified value, the
specified value is constant and the temperature at which this value must be achieved is varied.
The result is an identification system comprised of two numbers: the high temperature grade and
the low temperature. For example, a PG 52-34 asphalt binder must posses adequate physical
properties at the high temperature, 52 °C (126 °F), and at the low temperature, -34 °C (-29 °F).
Another new feature of the Superpave mix design system is the concept of a restricted zone in
the aggregate gradation. Brown, et al [14] described the purpose of the restricted zone as a way
to help ensure that too much rounded, natural sand is not used in the mixture and to help ensure
that the minimum VMA requirement is achieved. For blends with nominal sizes 25 mm (1 in.)
and greater, the restricted zone boundaries are placed on the 4.75 mm (No. 4), 2.36 mm (No. 8),
1.18 mm (No. 16), 0.60 mm (No. 30), and 0.30 mm (No. 50) sieve sizes. For blends with
nominal maximum aggregate sizes of 19 mm (3/4 in.) and less, the 4.75 mm (No. 4) sieve limits
are omitted. It is important to note, however, that the restricted zone is just a guide. It is
possible to use aggregate blends that pass through the restricted zone that still function
16
satisfactorily. The Superpave system also uses upper and lower control points on the 0.075 mm
(No. 200), 2.36 mm (No. 8), and the nominal sieve size of the blend. Additionally, a lower
control limit is placed on the sieve size one size lower than the nominal size. Control and
restricted zone limits for all nominal maximum aggregate sizes can be found in sources such as
the Asphalt Institute’s Superpave Series No. 2 (SP-2) manual [7].
Recognizing the importance of volumetric proportioning, Superpave incorporated aggregate
criteria directly into its design procedures. Superpave has two forms of aggregate criteria:
consensus properties (aggregate angularity, flat and elongated particles, and sand equivalent or
clay content) and source properties (toughness, soundness and deleterious materials). Following
is the rationale behind determining the aggregate properties and the test procedures used to
determine the properties as given by the SP-2 manual. A complete listing of the minimum
required values for the following consensus property tests can be found in the SP-2 manual.
Fine aggregate angularity (FAA) testing is done to ensure a high degree of internal friction and
rutting resistance. FAA is defined by the percent of air voids in loosely compacted aggregate
smaller than the 2.36 mm (No. 8) sieve. The procedure for FAA testing is outlined in Amercian
Association of State Highway and Transportation Officials (AASHTO) TP 33, “Test Method for
Uncompacted Void Content of Fine Aggregate (as Influenced by Particle Shape, Surface
Texture, & Grading)” (ASTM C1252). A sample of fine washed aggregate is poured into a
small, calibrated cylinder through a standard funnel. By measuring the mass of fine aggregate in
the filled cylinder of known volume, the void content can be calculated as the difference between
the cylinder volume and fine aggregate volume collected in the cylinder. Superpave requires a
minimum FAA value of 40 for use in mixes placed less than 100 mm (4 in.) from the surface.
Coarse aggregate angularity (fractured faces), ensures a high degree of aggregate internal friction
and rutting resistance. It is defined as the percent by weight of aggregate larger than the 4.75
mm (No. 4) sieve with one or more fractured faces. The procedure for determining coarse
aggregate angularity is given in ASTM D5821-95, “Determining the Percentage of Fractured
Particles in Coarse Aggregate.” The value is typically expressed as the percent with one or more
fractured faces over the percent with two or more fractured faces. Superpave minimum CAA
17
requirements range from 55/(unspecified) for low volume roads to 100/100 for high volume
roads.
Flat and elongated coarse aggregate particles are undesirable because they have a tendency to
break during construction and under traffic. The fracturing of aggregate is a concern because it
can reduce mixture stability and in extreme situations may actually make the gradation finer
affecting the optimum asphalt content. The flat and elongated coarse aggregate property is
expressed as the percentage by mass of coarse aggregate having a maximum to minimum
dimension ratio greater than five to one. It is determined according to ASTM D4791, “Flat or
Elongated Particles in Coarse Aggregate” on particles larger than 4.75 mm (0.187 in.).
Superpave does not limit the percent of flat and elongated particles for low-volume mix designs,
but limits their use to ten percent for all other design levels.
The sand equivalency test is a measure of the clay content in the fraction of the fine aggregate
smaller than the 4.75 mm (No. 4) sieve. Sand equivalency is determined by the method in
AASHTO T176, “Plastic Fines in Graded Aggregates and Soils by Use of the Sand Equivalent
Test” (ASTM D2419). In the sand equivalency test, a sample of fine aggregate is mixed with a
flocculating solution in a graduated cylinder and agitated to loosen the clayey fines and force
them into suspension above the granular aggregate. After a settling period, the cylinder heights
of the suspended clay and settled sand are measured. The sand equivalent value is the ratio of
sand to clay height readings. Minimum Superpave requirements range from 40 percent for low
volume roads to 50 percent for high volume.
Samples are compacted in the Superpave gyratory compactor (SGC) and the asphalt content is
selected on the basis of volumetric design requirements (the goal being 4% air voids). In its
SP-2 manual, the Asphalt Institute [7] identifies several goals of the SHRP efforts in designing
the SGC:
• Realistically compact mix specimens to densities achieved under actual pavement climate and loading conditions.
• Accommodate large aggregate sizes.
• Measure compactibility so potential tender mix behavior could be identified.
• Portable enough for use in mixing facility quality control operations.
18
The loading ram on an SGC produces a constant 600 kPa (87 psi) vertical compaction pressure
on a sample contained in a 150-mm (6 in.) diameter mold (which can accommodate mixes
having up to 50-mm (2 in.) maximum size aggregate). The base of the SGC rotates at a constant
rate of 30 revolutions per minute with the mold positioned at a 1.25° compaction angle. Density
can be estimated at any time during the compaction process because the position of the ram is
continually recorded as it compacts the specimen (the mass of the mix inside the mold and the
mold’s diameter are constant). The 1.25° compaction angle coupled with the revolving base
enables the SGC to impart a kneading action on the specimen much like it would undergo in the
field. The kneading action enables further densification of the specimen through rearrangement
of the aggregate particles.
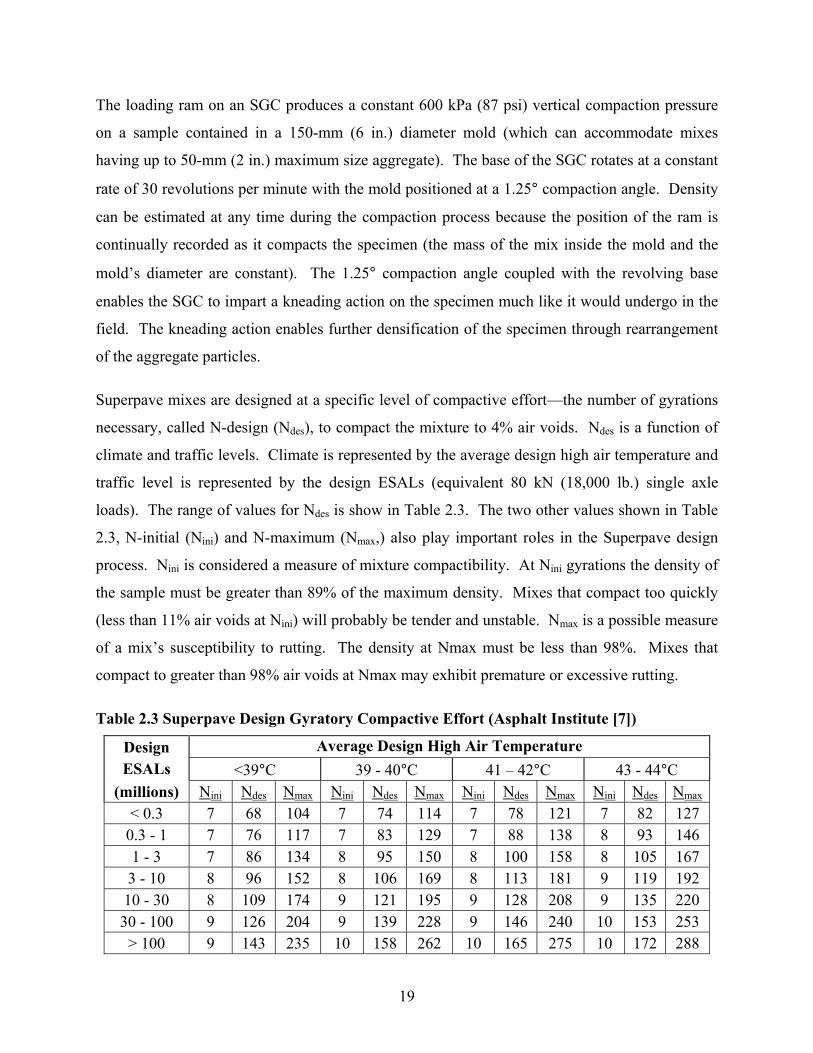
Superpave mixes are designed at a specific level of compactive effort—the number of gyrations
necessary, called N-design (Ndes), to compact the mixture to 4% air voids. Ndes is a function of
climate and traffic levels. Climate is represented by the average design high air temperature and
traffic level is represented by the design ESALs (equivalent 80 kN (18,000 lb.) single axle
loads). The range of values for Ndes is show in Table 2.3. The two other values shown in Table
2.3, N-initial (Nini) and N-maximum (Nmax,) also play important roles in the Superpave design
process. Nini is considered a measure of mixture compactibility. At Nini gyrations the density of
the sample must be greater than 89% of the maximum density. Mixes that compact too quickly
(less than 11% air voids at Nini) will probably be tender and unstable. Nmax is a possible measure
of a mix’s susceptibility to rutting. The density at Nmax must be less than 98%. Mixes that
compact to greater than 98% air voids at Nmax may exhibit premature or excessive rutting.
Table 2.3 Superpave Design Gyratory Compactive Effort (Asphalt Institute [7])
Design Average Design High Air Temperature ESALs <39°C 39 - 40°C 41 – 42°C 43 - 44°C
(millions) Nini Ndes Nmax Nini Ndes Nmax Nini Ndes Nmax Nini Ndes Nmax < 0.3 7 68 104 7 74 114 7 78 121 7 82 127
0.3 - 1 7 76 117 7 83 129 7 88 138 8 93 146 1 - 3 7 86 134 8 95 150 8 100 158 8 105 167 3 - 10 8 96 152 8 106 169 8 113 181 9 119 192 10 - 30 8 109 174 9 121 195 9 128 208 9 135 220 30 - 100 9 126 204 9 139 228 9 146 240 10 153 253
> 100 9 143 235 10 158 262 10 165 275 10 172 288
19
Use in Quality Control
A key part of any mixture design system is its ease and reliability when used in the construction
process as part of production quality control. Roberts, et al [16] cited the Federal Highway
Administration (FHWA) Demonstration Project No. 74’s clear indication that significant
differences exist between the volumetric properties of the laboratory designed and plant
produced mixtures. Consequently, production quality control is performed by the contractor
(typically in on-site laboratories) to ensure the plant is performing as anticipated, and by the
owner (typically in mobile laboratories) to ensure production of a consistent, quality product.
The first step in production quality control consists of periodic sampling of the material from
either behind the paver (preferred) or from the bed of a hauling truck. The sample is then taken
to the lab where it is compacted and its volumetric properties are determined. The values are
then used to ensure mix production remains within set control limits, and to look for trends
signifying the production is out of control (unacceptably large variations) and/or tending towards
exceeding a control limit. Without production quality control, there is no means of verifying the
product is indeed the consistent, high quality product desired.
When first instituted, the large size and expense of Hveem compactors made efficient production
quality control difficult. Furthermore, the absence of routine volumetric property determination
in the Hveem method exacerbated problems when volumetric analyses became the primary
means of production quality control. The smaller, less costly Marshall hammer, however, was
much more suited to on-site laboratories. This situation was acceptable when the majority of
mixes were designed using the Marshall method. However, the increasing use of Superpave in
the design of asphalt mixtures has brought with it an important question in the quality control
process: Can a Marshall compactor (still found in most on-site laboratories) be used to perform
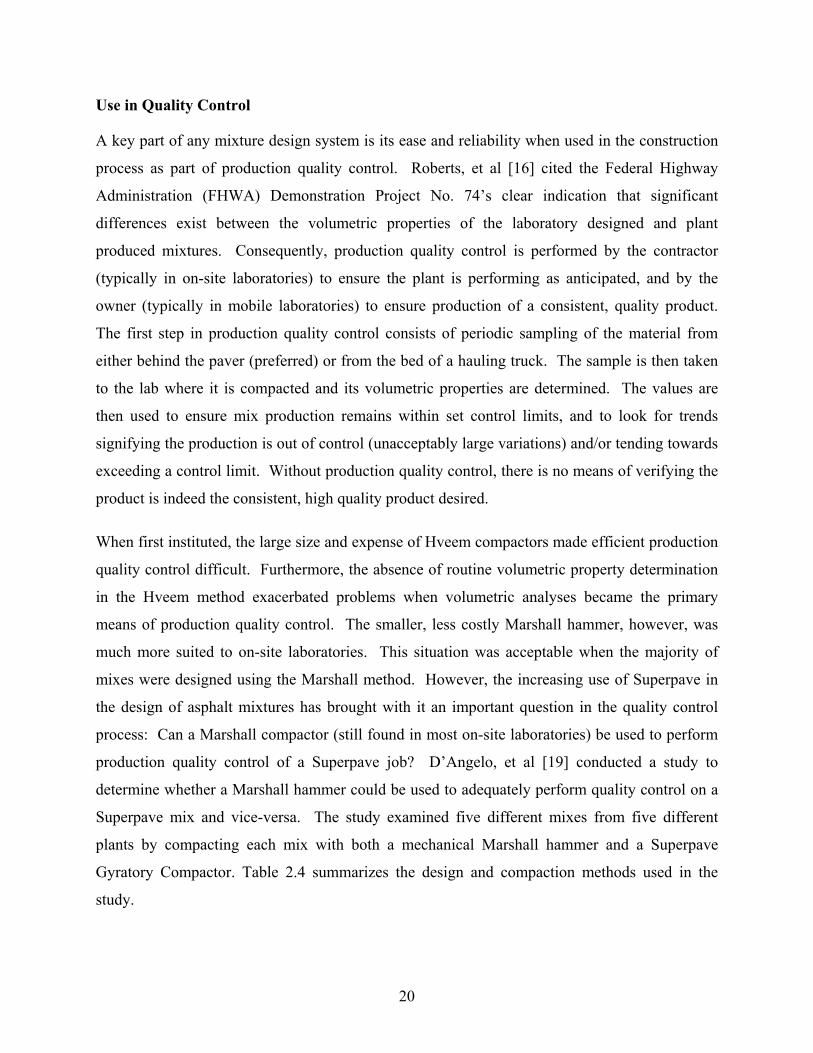
production quality control of a Superpave job? D’Angelo, et al [19] conducted a study to
determine whether a Marshall hammer could be used to adequately perform quality control on a
Superpave mix and vice-versa. The study examined five different mixes from five different
plants by compacting each mix with both a mechanical Marshall hammer and a Superpave
Gyratory Compactor. Table 2.4 summarizes the design and compaction methods used in the
study.
20
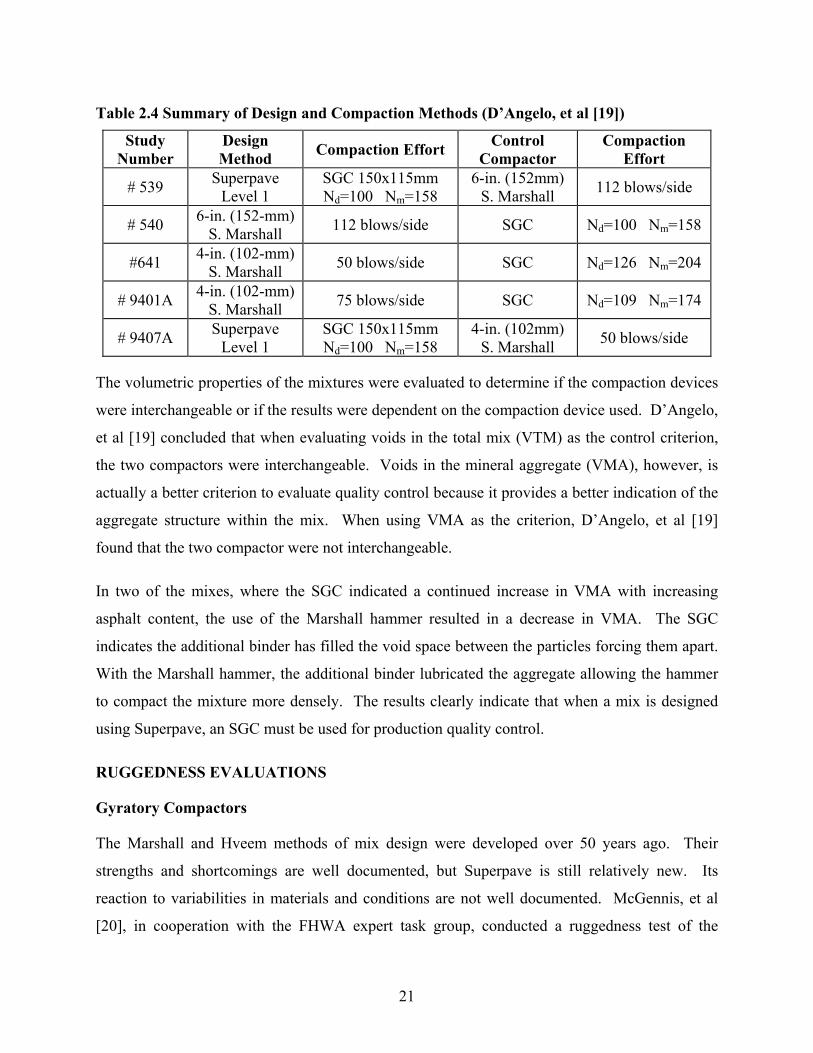
Table 2.4 Summary of Design and Compaction Methods (D’Angelo, et al [19])
Study Number
Design Method Compaction Effort Control
Compactor Compaction
Effort
# 539 Superpave Level 1
SGC 150x115mm Nd=100 Nm=158
6-in. (152mm) S. Marshall 112 blows/side
# 540 6-in. (152-mm) S. Marshall 112 blows/side SGC Nd=100 Nm=158
#641 4-in. (102-mm) S. Marshall 50 blows/side SGC Nd=126 Nm=204
# 9401A 4-in. (102-mm) S. Marshall 75 blows/side SGC Nd=109 Nm=174
# 9407A Superpave Level 1
SGC 150x115mm Nd=100 Nm=158
4-in. (102mm) S. Marshall 50 blows/side
The volumetric properties of the mixtures were evaluated to determine if the compaction devices
were interchangeable or if the results were dependent on the compaction device used. D’Angelo,
et al [19] concluded that when evaluating voids in the total mix (VTM) as the control criterion,
the two compactors were interchangeable. Voids in the mineral aggregate (VMA), however, is
actually a better criterion to evaluate quality control because it provides a better indication of the
aggregate structure within the mix. When using VMA as the criterion, D’Angelo, et al [19]
found that the two compactor were not interchangeable.
In two of the mixes, where the SGC indicated a continued increase in VMA with increasing
asphalt content, the use of the Marshall hammer resulted in a decrease in VMA. The SGC
indicates the additional binder has filled the void space between the particles forcing them apart.
With the Marshall hammer, the additional binder lubricated the aggregate allowing the hammer
to compact the mixture more densely. The results clearly indicate that when a mix is designed
using Superpave, an SGC must be used for production quality control.
RUGGEDNESS EVALUATIONS
Gyratory Compactors
The Marshall and Hveem methods of mix design were developed over 50 years ago. Their
strengths and shortcomings are well documented, but Superpave is still relatively new. Its
reaction to variabilities in materials and conditions are not well documented. McGennis, et al
[20], in cooperation with the FHWA expert task group, conducted a ruggedness test of the
21
American Association of State Highway and Transportation Officials (AASHTO) Test Method
TP4 to evaluate the extent to which variations in test parameters cause variations in test results.
AASHTO TP4 is the provisional standard governing the preparation of test specimens with the
Superpave Gyratory Compactor. The experiment was conducted using two SGCs that FHWA
experiments determined were substantially equivalent: the Pine and Troxler SGCs (D’Angelo,
1995). Table 2.5 shows the seven primary factors and their levels of variation evaluated in the
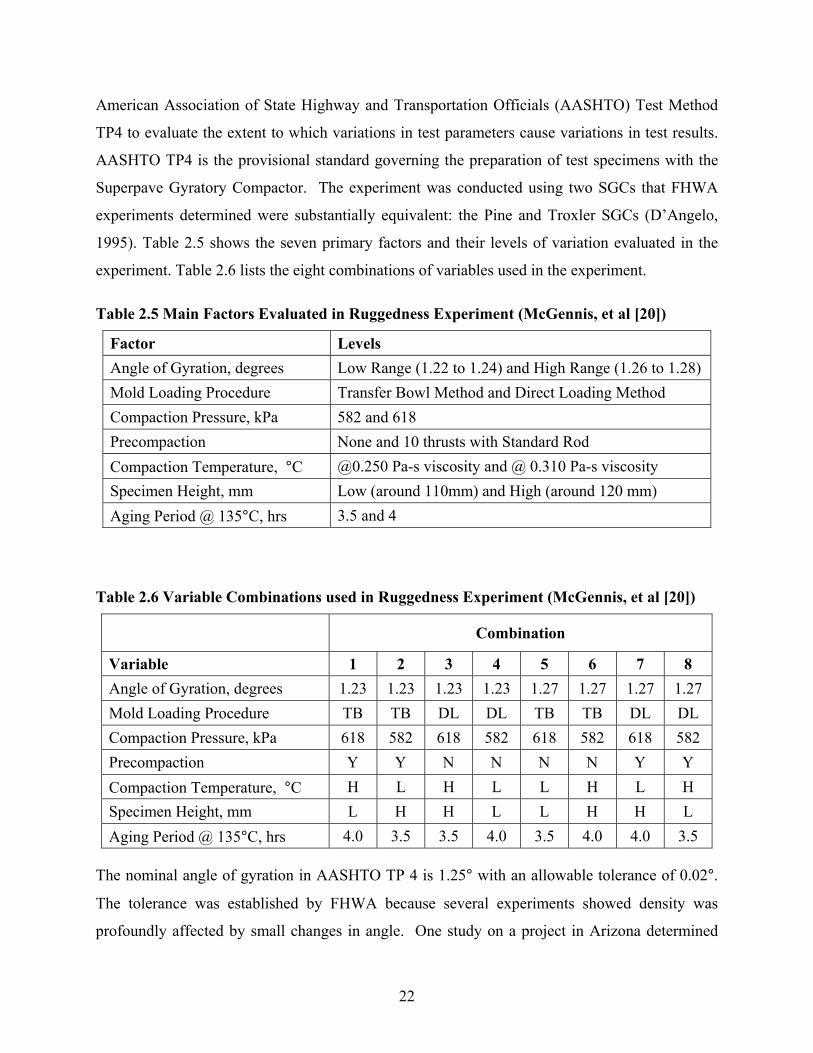
experiment. Table 2.6 lists the eight combinations of variables used in the experiment.
Table 2.5 Main Factors Evaluated in Ruggedness Experiment (McGennis, et al [20])
Factor Levels Angle of Gyration, degrees Low Range (1.22 to 1.24) and High Range (1.26 to 1.28) Mold Loading Procedure Transfer Bowl Method and Direct Loading Method Compaction Pressure, kPa 582 and 618 Precompaction None and 10 thrusts with Standard Rod Compaction Temperature, °C @0.250 Pa-s viscosity and @ 0.310 Pa-s viscosity Specimen Height, mm Low (around 110mm) and High (around 120 mm) Aging Period @ 135°C, hrs 3.5 and 4
Table 2.6 Variable Combinations used in Ruggedness Experiment (McGennis, et al [20])
Combination
Variable 1 2 3 4 5 6 7 8 Angle of Gyration, degrees 1.23 1.23 1.23 1.23 1.27 1.27 1.27 1.27 Mold Loading Procedure TB TB DL DL TB TB DL DL Compaction Pressure, kPa 618 582 618 582 618 582 618 582 Precompaction Y Y N N N N Y Y Compaction Temperature, °C H L H L L H L H Specimen Height, mm L H H L L H H L Aging Period @ 135°C, hrs 4.0 3.5 3.5 4.0 3.5 4.0 4.0 3.5
The nominal angle of gyration in AASHTO TP 4 is 1.25° with an allowable tolerance of 0.02°.
The tolerance was established by FHWA because several experiments showed density was
profoundly affected by small changes in angle. One study on a project in Arizona determined
22
that a 0.25° change in angle of gyration resulted in a four percent change in void content.
However, across the 0.04° range of compaction angles evaluated, the trend toward an increase in
density was not significant. Less than one percent of the variation was explained by compaction
angle.
Although AASHTO TP4 vaguely informs the operator to “place the mixture in the mold in one
lift,” experience by the Colorado and Texas DOTs has shown that the method of mold loading
has a significant influence on specimen density. The experiences of McGennis, et al [20]
suggested two extremes of mold loading: loading the bowl with a specially designed “gyro
loader” transfer bowl; and using a scoop to load the mold directly from the aging pan. Results of
this experiment indicate the mold loading procedure does not have a clear, consistent influence
on SGC test specimens.
AASHTO TP4 requires a nominal compactive pressure of 600 kPa (87 psi). The allowable three
percent tolerance results in test pressures of 582 (84.4 psi) and 618 kPa (89.6 psi). Results
indicate a significant difference in density between the two pressures. However, pressure
tolerance is not significant since SGCs have transducers enabling operators to set the pressure at
exactly 600 kPa (87 psi).
Although TP4 does not require precompaction (the rodding of the mixture prior to compaction),
most previous mix design methods such as the Marshall and Hveem methods have required it.
Consequently, it is very likely SGC operators would precompact the mix out of habit.
Experience has shown it can take as many as 20 gyrations for the compaction pressure to
stabilize at 600 kPa (87 psi). It was hypothesized precompaction would enable quicker pressure
stabilization resulting in different measured bulk specific gravity. However, results showed the
two extremes (zero and 10 rodding strokes) had no significant effect.
AASHTO TP4 specifies mixtures be compacted within a temperature range that results in a
binder viscosity between 0.250 Pa-s (2.5 poise) and 0.310 Pa-s (3.1 poise). For the binder in the
McGinnis, et al [20] evaluation, a PG 64-22, the resulting compaction temperatures were 141 °C
(286 °F) and 146 °C (295 °F). Results indicated compaction temperatures at the extremes of
141 °C (286 °F) and 146 °C (295 °F) do not have a significant effect.
23
McGennis, et al [20] discovered the 100-mm (3.94 in.) nominal specimen height requirement of
AASHTO TP4 (Edition 1B, September, 1993), is actually incorrect. Most SHRP research had
been completed on specimens with a 115-mm (4.53 in.) nominal height. Additionally, the
required ± 1 mm (0.0394 in.) tolerance is counter-productive as it is extremely difficult to
achieve on the initial compaction and may simply be too stringent. Consequently, McGennis, et
al [20] chose to use a tolerance level of ± 5 mm (0.2 in.). Results showed a significant variability
when the height difference of fine graded mixtures exceeded ± 12 mm (0.47 in.). Coarse
mixtures did not exhibit a significant variability with respect to height. McGennis, et al
concluded a ± 5 mm (0.2 in.) tolerance ensures reasonable variability.
Although TP4 requires four hours of short-term oven aging at 135 °C (275 °F), required
compaction temperatures may sometimes be higher than 135 °C (275 °F). To achieve
compaction temperatures above 135 °C (275 °F), two ovens are often used. The first oven, set at
135 °C (275 °F), is used for short-term aging of the mix. The second oven is used to heat the
specimen up to the required compaction temperature. Two acceptable procedures exist for
achieving the increased temperature: placing the mixture in the second oven for up to the 30
allowable minutes after the four hours of short-term aging, or removing the mixture from the first
oven such that the increased temperature can be obtained within the required four hours of short-
term aging. Therefore, McGennis, et al [20] used 3.5 and 4.0 hours for the extremes of short-
term aging. Results indicated the extremes of the short-term aging protocols had an insignificant
effect. However, it is important to note this conclusion was reached based upon only one binder.
McGennis, et al advise binders exhibiting rapid aging characteristics may be more susceptible to
variations in short term aging times. In summary, McGennis, et al [20] concluded the Superpave
Gyratory Compactor is a rugged, dependable system that is not very susceptible to operating
variations.
CONCLUSION
The Marshall and Hveem methods of mix design are proven, 50 year-old design procedures.
However, they do have their shortcomings. Their primary material characterization tests
(Marshall stability and flow and Hveem stability) are not reliable when conditions are outside
those in which the tests were developed (i.e. the continuing increase in axle loads and tire
24
pressures). A hot mix asphalt design procedure that characterizes the mixed based on
performance-related fundamental engineering properties is required.
Superpave’s gyratory compactor plays an important role in producing laboratory- compacted hot
mix asphalt samples that are representative of field compaction. Shear and tensile tests are
useless if performed on a laboratory specimen that is not representative of a field specimen.
Researchers have concluded that as a gyratory compactor, the SGC does a better job of
simulating field compaction because its shearing action simulates the densification through
particle reorientation achieved by rollers in the field.
25
CHAPTER 3 RESEARCH METHODOLOGY
OVERVIEW
The previous section discussed the importance of compaction, the influence of mix properties on
volumetrics, and presented the Superpave method of mix design. This section describes the
equipment, materials, and procedures used in the production and analysis of mix specimens.
Once determined from the mix design, the optimum asphalt contents for the various mixtures
were used throughout the remainder of the project. Samples were created at the optimum asphalt
content (for 3 percent compacted air voids) for resilient modulus testing at –18, 0, 25, and 40 °C
(0, 34, 77, and 104 °F, respectively) to determine each mixture’s susceptibility to temperature
variation. Moisture sensitivity was evaluated by comparing the indirect tensile strengths
between unconditioned, control samples and vacuum-saturated, conditioned samples.
MIX DESIGN
Summary of Laboratory Mixes
Generally speaking, it is economically desirable to use low-cost, locally available materials for
roads with low traffic volumes. The fine aggregate (FA - passing the 4.75 mm (No.4) sieve)
used for every gradation was a sand from Lakeland, Minnesota. It is readily available at low
cost, but has a relatively rounded shape. The coarse aggregate (CA – retained on the 9.5 mm
(3/8 in.) and larger sieves) used in the project consisted of aggregate from four different sources:
Granite Falls (GF) granite, New Ulm (NU) quartzite, Kasota (KL) limestone, and Cedar Grove
(CG) gravel. Two different gradations, shown in Figure 3.1, were used in the project: a fine
gradation which ran above the Superpave restricted zone; and a coarse gradation which ran
below the restricted zone. Additionally, two different asphalt cement grades were evaluated: a
PG 52-34, the primary grade for the project, was used in all 8 mixes; a PG 58-40 cement was
used in the fine gradations for the New Ulm quartzite and Kasota limestone mixes.
Eight different aggregate gradations (four above, two through and two below the restricted zone)
using Granite Falls granite (CA) and Lakeland gravel (FA) were evaluated in the attempt to
satisfy the Superpave VMA criteria. None of the eight gradations resulted in a sample
27
compacted to 4% air voids having a VMA above the Superpave minimum requirement of 14%
for low volume roads (300,000 < ESALs < 1,000,000). In fact, the only time the VMA criterion
was satisfied was when the 2.36 mm (No. 8) and 1.18 mm (No. 16) Lakeland aggregate was
replaced with a Wisconsin, Dresser basalt aggregate having a greater degree of angularity. Since
the purpose of the project, however, is to use economical, locally available aggregate, the
Dresser aggregate was not used in this project. Instead, the coarse and fine gradations were
chosen on the basis of obtaining the best possible VMA/VFA results using a natural sand
aggregate source.
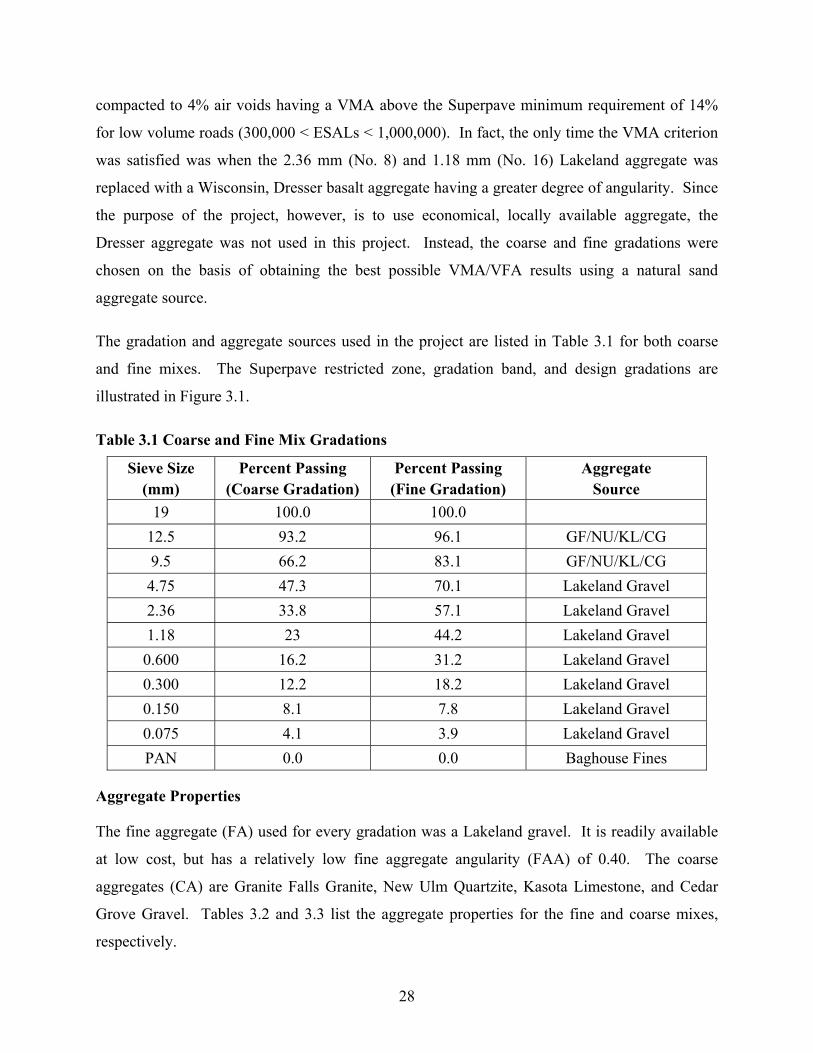
The gradation and aggregate sources used in the project are listed in Table 3.1 for both coarse
and fine mixes. The Superpave restricted zone, gradation band, and design gradations are
illustrated in Figure 3.1.
Table 3.1 Coarse and Fine Mix Gradations
Sieve Size (mm)
Percent Passing (Coarse Gradation)
Percent Passing (Fine Gradation)
Aggregate Source
19 100.0 100.0 12.5 93.2 96.1 GF/NU/KL/CG 9.5 66.2 83.1 GF/NU/KL/CG 4.75 47.3 70.1 Lakeland Gravel 2.36 33.8 57.1 Lakeland Gravel 1.18 23 44.2 Lakeland Gravel 0.600 16.2 31.2 Lakeland Gravel 0.300 12.2 18.2 Lakeland Gravel 0.150 8.1 7.8 Lakeland Gravel 0.075 4.1 3.9 Lakeland Gravel PAN 0.0 0.0 Baghouse Fines
Aggregate Properties
The fine aggregate (FA) used for every gradation was a Lakeland gravel. It is readily available
at low cost, but has a relatively low fine aggregate angularity (FAA) of 0.40. The coarse
aggregates (CA) are Granite Falls Granite, New Ulm Quartzite, Kasota Limestone, and Cedar
Grove Gravel. Tables 3.2 and 3.3 list the aggregate properties for the fine and coarse mixes,
respectively.
28
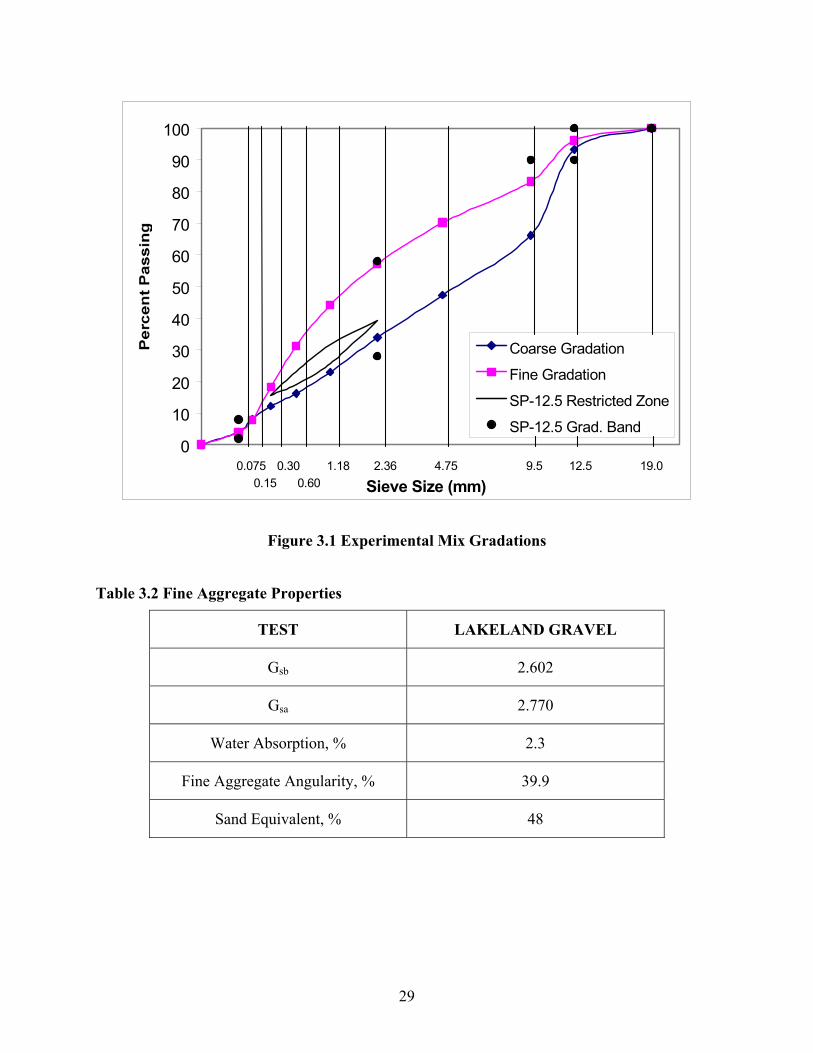
0
10
20
30
40
50
60
70
80
90
100
Sieve Size (mm)
Coarse Gradation
Fine Gradation
SP-12.5 Restricted Zone
SP-12.5 Grad. Band
1.180.60
0.300.15
9.54.752.360.075 12.5 19.0
Figure 3.1 Experimental Mix Gradations
Table 3.2 Fine Aggregate Properties
TEST LAKELAND GRAVEL
Gsb 2.602
Gsa 2.770
Water Absorption, % 2.3
Fine Aggregate Angularity, % 39.9
Sand Equivalent, % 48
29
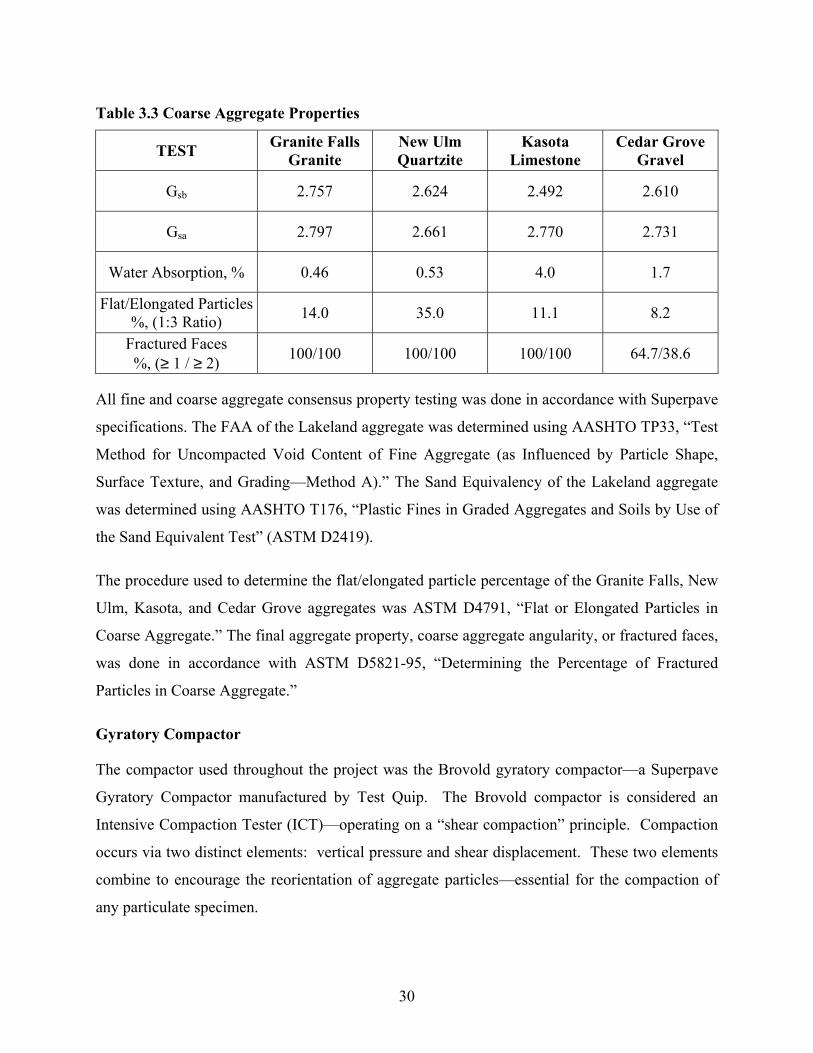
Table 3.3 Coarse Aggregate Properties
TEST Granite Falls Granite
New Ulm Quartzite
Kasota Limestone
Cedar Grove Gravel
Gsb 2.757 2.624 2.492 2.610
Gsa 2.797 2.661 2.770 2.731
Water Absorption, % 0.46 0.53 4.0 1.7
Flat/Elongated Particles%, (1:3 Ratio) 14.0 35.0 11.1 8.2
Fractured Faces %, (≥ 1 / ≥ 2) 100/100 100/100 100/100 64.7/38.6
All fine and coarse aggregate consensus property testing was done in accordance with Superpave
specifications. The FAA of the Lakeland aggregate was determined using AASHTO TP33, “Test
Method for Uncompacted Void Content of Fine Aggregate (as Influenced by Particle Shape,
Surface Texture, and Grading—Method A).” The Sand Equivalency of the Lakeland aggregate
was determined using AASHTO T176, “Plastic Fines in Graded Aggregates and Soils by Use of
the Sand Equivalent Test” (ASTM D2419).
The procedure used to determine the flat/elongated particle percentage of the Granite Falls, New
Ulm, Kasota, and Cedar Grove aggregates was ASTM D4791, “Flat or Elongated Particles in
Coarse Aggregate.” The final aggregate property, coarse aggregate angularity, or fractured faces,
was done in accordance with ASTM D5821-95, “Determining the Percentage of Fractured
Particles in Coarse Aggregate.”
Gyratory Compactor
The compactor used throughout the project was the Brovold gyratory compactor—a Superpave
Gyratory Compactor manufactured by Test Quip. The Brovold compactor is considered an
Intensive Compaction Tester (ICT)—operating on a “shear compaction” principle. Compaction
occurs via two distinct elements: vertical pressure and shear displacement. These two elements
combine to encourage the reorientation of aggregate particles—essential for the compaction of
any particulate specimen.
30
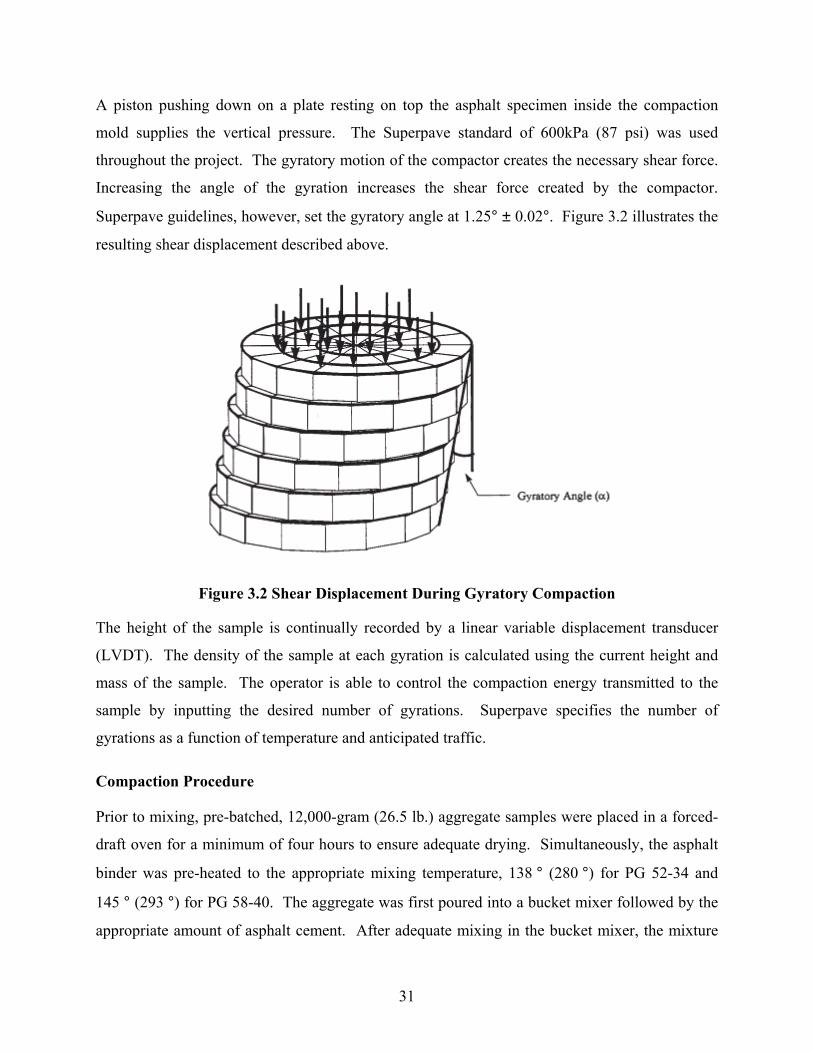
A piston pushing down on a plate resting on top the asphalt specimen inside the compaction
mold supplies the vertical pressure. The Superpave standard of 600kPa (87 psi) was used
throughout the project. The gyratory motion of the compactor creates the necessary shear force.
Increasing the angle of the gyration increases the shear force created by the compactor.
Superpave guidelines, however, set the gyratory angle at 1.25° ± 0.02°. Figure 3.2 illustrates the
resulting shear displacement described above.
Figure 3.2 Shear Displacement During Gyratory Compaction
The height of the sample is continually recorded by a linear variable displacement transducer
(LVDT). The density of the sample at each gyration is calculated using the current height and
mass of the sample. The operator is able to control the compaction energy transmitted to the
sample by inputting the desired number of gyrations. Superpave specifies the number of
gyrations as a function of temperature and anticipated traffic.
Compaction Procedure
Prior to mixing, pre-batched, 12,000-gram (26.5 lb.) aggregate samples were placed in a forced-
draft oven for a minimum of four hours to ensure adequate drying. Simultaneously, the asphalt
binder was pre-heated to the appropriate mixing temperature, 138 ° (280 °) for PG 52-34 and
145 ° (293 °) for PG 58-40. The aggregate was first poured into a bucket mixer followed by the
appropriate amount of asphalt cement. After adequate mixing in the bucket mixer, the mixture
31
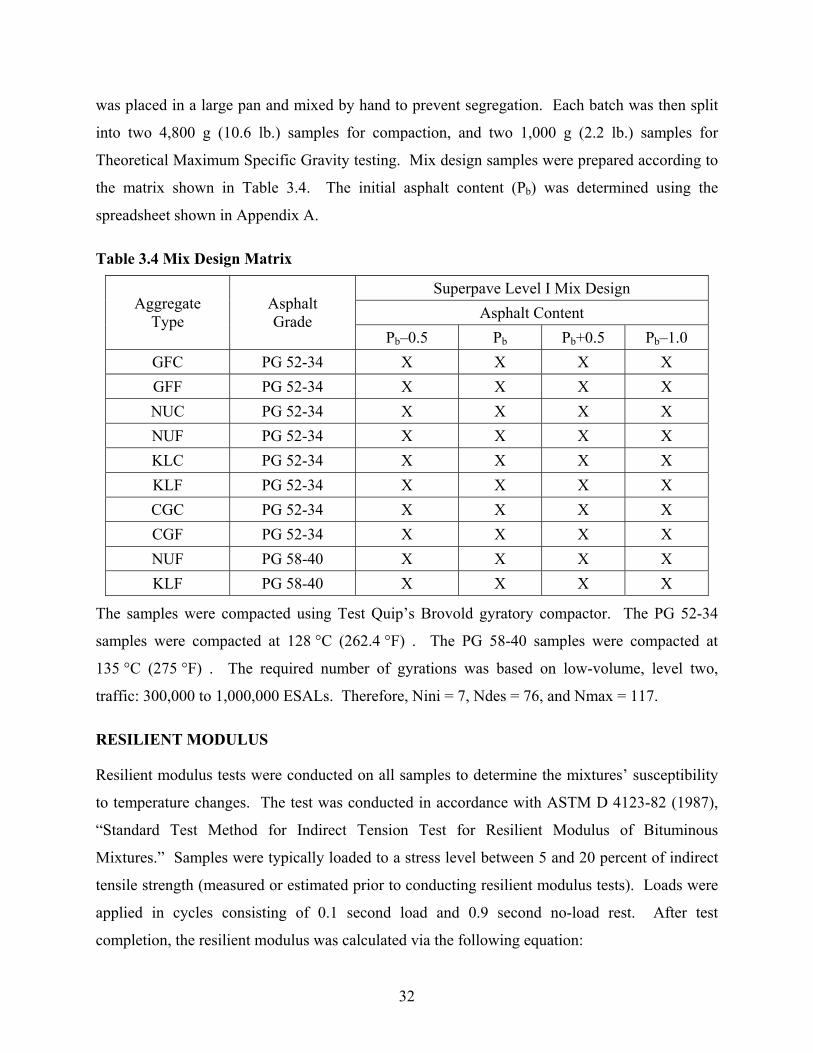
was placed in a large pan and mixed by hand to prevent segregation. Each batch was then split
into two 4,800 g (10.6 lb.) samples for compaction, and two 1,000 g (2.2 lb.) samples for
Theoretical Maximum Specific Gravity testing. Mix design samples were prepared according to
the matrix shown in Table 3.4. The initial asphalt content (Pb) was determined using the
spreadsheet shown in Appendix A.
Table 3.4 Mix Design Matrix
Superpave Level I Mix Design Asphalt Content Aggregate
Type Asphalt Grade
Pb–0.5 Pb Pb+0.5 Pb–1.0 GFC PG 52-34 X X X X GFF PG 52-34 X X X X NUC PG 52-34 X X X X NUF PG 52-34 X X X X KLC PG 52-34 X X X X KLF PG 52-34 X X X X CGC PG 52-34 X X X X CGF PG 52-34 X X X X NUF PG 58-40 X X X X KLF PG 58-40 X X X X
The samples were compacted using Test Quip’s Brovold gyratory compactor. The PG 52-34
samples were compacted at 128 °C (262.4 °F) . The PG 58-40 samples were compacted at
135 °C (275 °F) . The required number of gyrations was based on low-volume, level two,
traffic: 300,000 to 1,000,000 ESALs. Therefore, Nini = 7, Ndes = 76, and Nmax = 117.
RESILIENT MODULUS
Resilient modulus tests were conducted on all samples to determine the mixtures’ susceptibility
to temperature changes. The test was conducted in accordance with ASTM D 4123-82 (1987),
“Standard Test Method for Indirect Tension Test for Resilient Modulus of Bituminous
Mixtures.” Samples were typically loaded to a stress level between 5 and 20 percent of indirect
tensile strength (measured or estimated prior to conducting resilient modulus tests). Loads were
applied in cycles consisting of 0.1 second load and 0.9 second no-load rest. After test
completion, the resilient modulus was calculated via the following equation:
32
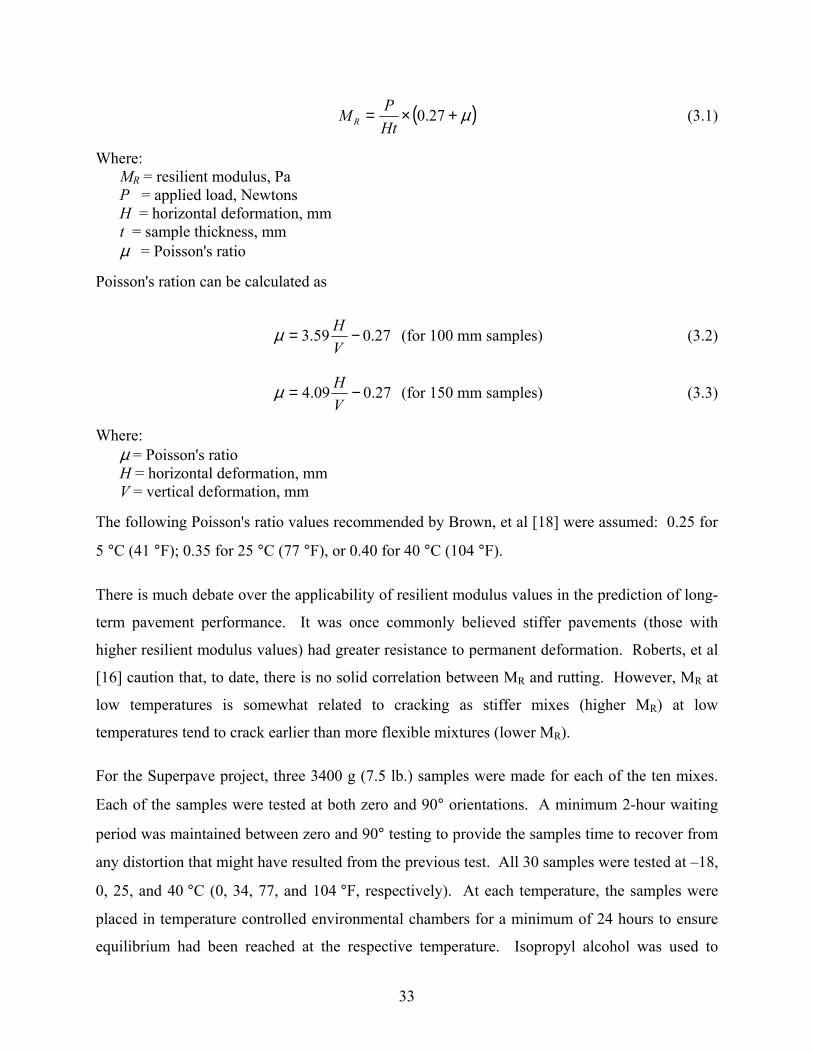
( µ+×= 27.0HtPM R ) (3.1)
Where: MR = resilient modulus, Pa P = applied load, Newtons H = horizontal deformation, mm t = sample thickness, mm µ = Poisson's ratio
Poisson's ration can be calculated as
27.059.3 −=VHµ (for 100 mm samples) (3.2)
27.009.4 −=VHµ (for 150 mm samples) (3.3)
Where: µ = Poisson's ratio H = horizontal deformation, mm V = vertical deformation, mm
The following Poisson's ratio values recommended by Brown, et al [18] were assumed: 0.25 for
5 °C (41 °F); 0.35 for 25 °C (77 °F), or 0.40 for 40 °C (104 °F).
There is much debate over the applicability of resilient modulus values in the prediction of long-
term pavement performance. It was once commonly believed stiffer pavements (those with
higher resilient modulus values) had greater resistance to permanent deformation. Roberts, et al
[16] caution that, to date, there is no solid correlation between MR and rutting. However, MR at
low temperatures is somewhat related to cracking as stiffer mixes (higher MR) at low
temperatures tend to crack earlier than more flexible mixtures (lower MR).
For the Superpave project, three 3400 g (7.5 lb.) samples were made for each of the ten mixes.
Each of the samples were tested at both zero and 90° orientations. A minimum 2-hour waiting
period was maintained between zero and 90° testing to provide the samples time to recover from
any distortion that might have resulted from the previous test. All 30 samples were tested at –18,
0, 25, and 40 °C (0, 34, 77, and 104 °F, respectively). At each temperature, the samples were
placed in temperature controlled environmental chambers for a minimum of 24 hours to ensure
equilibrium had been reached at the respective temperature. Isopropyl alcohol was used to
33
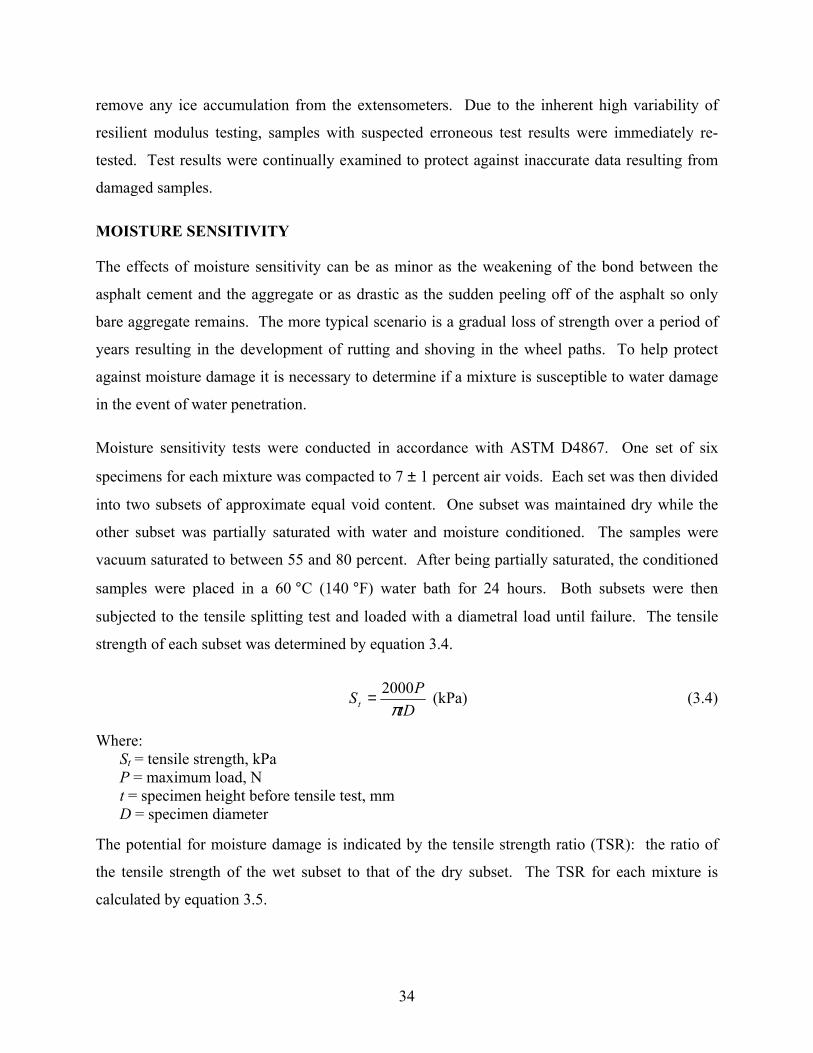
remove any ice accumulation from the extensometers. Due to the inherent high variability of
resilient modulus testing, samples with suspected erroneous test results were immediately re-
tested. Test results were continually examined to protect against inaccurate data resulting from
damaged samples.
MOISTURE SENSITIVITY
The effects of moisture sensitivity can be as minor as the weakening of the bond between the
asphalt cement and the aggregate or as drastic as the sudden peeling off of the asphalt so only
bare aggregate remains. The more typical scenario is a gradual loss of strength over a period of
years resulting in the development of rutting and shoving in the wheel paths. To help protect
against moisture damage it is necessary to determine if a mixture is susceptible to water damage
in the event of water penetration.
Moisture sensitivity tests were conducted in accordance with ASTM D4867. One set of six
specimens for each mixture was compacted to 7 ± 1 percent air voids. Each set was then divided
into two subsets of approximate equal void content. One subset was maintained dry while the
other subset was partially saturated with water and moisture conditioned. The samples were
vacuum saturated to between 55 and 80 percent. After being partially saturated, the conditioned
samples were placed in a 60 °C (140 °F) water bath for 24 hours. Both subsets were then
subjected to the tensile splitting test and loaded with a diametral load until failure. The tensile
strength of each subset was determined by equation 3.4.
tD
PSt π2000= (kPa) (3.4)
Where: St = tensile strength, kPa P = maximum load, N t = specimen height before tensile test, mm D = specimen diameter
The potential for moisture damage is indicated by the tensile strength ratio (TSR): the ratio of
the tensile strength of the wet subset to that of the dry subset. The TSR for each mixture is
calculated by equation 3.5.
34
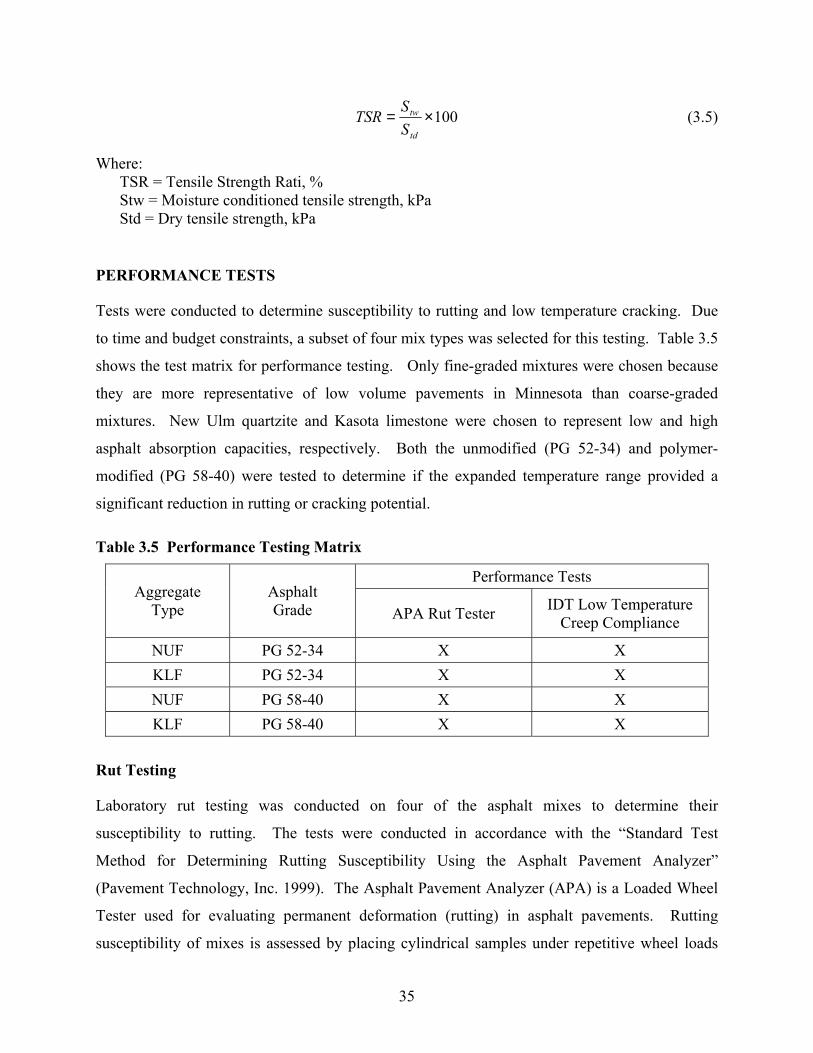
100×=td
tw
SS
TSR (3.5)
Where: TSR = Tensile Strength Rati, % Stw = Moisture conditioned tensile strength, kPa Std = Dry tensile strength, kPa
PERFORMANCE TESTS
Tests were conducted to determine susceptibility to rutting and low temperature cracking. Due
to time and budget constraints, a subset of four mix types was selected for this testing. Table 3.5
shows the test matrix for performance testing. Only fine-graded mixtures were chosen because
they are more representative of low volume pavements in Minnesota than coarse-graded
mixtures. New Ulm quartzite and Kasota limestone were chosen to represent low and high
asphalt absorption capacities, respectively. Both the unmodified (PG 52-34) and polymer-
modified (PG 58-40) were tested to determine if the expanded temperature range provided a
significant reduction in rutting or cracking potential.
Table 3.5 Performance Testing Matrix
Performance Tests Aggregate
Type Asphalt Grade APA Rut Tester IDT Low Temperature
Creep Compliance
NUF PG 52-34 X X KLF PG 52-34 X X NUF PG 58-40 X X KLF PG 58-40 X X
Rut Testing
Laboratory rut testing was conducted on four of the asphalt mixes to determine their
susceptibility to rutting. The tests were conducted in accordance with the “Standard Test
Method for Determining Rutting Susceptibility Using the Asphalt Pavement Analyzer”
(Pavement Technology, Inc. 1999). The Asphalt Pavement Analyzer (APA) is a Loaded Wheel
Tester used for evaluating permanent deformation (rutting) in asphalt pavements. Rutting
susceptibility of mixes is assessed by placing cylindrical samples under repetitive wheel loads
35
and measuring the amount of permanent deformation under the wheel path. The APA features
controllable wheel loads and contact pressure that are representative of actual field conditions,
and an environmental chamber allows for samples to be tested under controlled temperature
conditions.
The samples were preheated at 40 °C for 6 to 24 hours prior to testing. The testing chamber was
also preheated to this temperature. The samples were subject to a total of 8,000 cycles by the
APA. The rut depth was determined by subtracting the measurement for each cycle from the
initial measurement. Six samples were tested at one time, and they were arranged in front and
back and left, center, and right positions. The rut testing was performed by Koch Pavement
Solutions in Wichita, Kansas.
Low Temperature Creep Testing
Indirect tensile tests were performed to evaluate the thermal cracking susceptibility of the asphalt
mixtures. The Superpave Indirect Tensile Test (IDT) was used to determine the creep
compliance and indirect tensile strength of asphalt mixtures at low pavement temperatures. The
test results can be used in performance models to predict the low-temperature thermal cracking
potential and intermediate-temperature fatigue cracking potential of asphalt pavements. The
Superpave IDT consists of a vertical loading frame, specimen deformation measurement devices,
an environmental chamber, and a data acquisition and control system. The IDT loads a
cylindrical asphalt concrete specimen along its diametrical axis, and the resulting deformations
are used to determine the viscoelastic material properties. The test procedures are described in
the American Association of State Highway and Transportation Officials (AASHTO) provisional
standard TP 9-96, “Standard Test Method for Determining the Creep Compliance and Strength
of Hot Mix Asphalt (HMA) Using the Indirect Tensile Test Device.”
Creep compliance was tested at three temperatures: 0 °C, -10 °C, and -20 °C. The indirect
tensile strength was then tested at -10 °C for each sample.
For the creep compliance tests, the specimens were cooled to the desired temperature. A
preconditioning cycle was applied to each specimen consisting of 100 cycles of haversine load
with amplitude equivalent to 70 kPa tension. One load cycle consisted of 0.1 seconds of
36
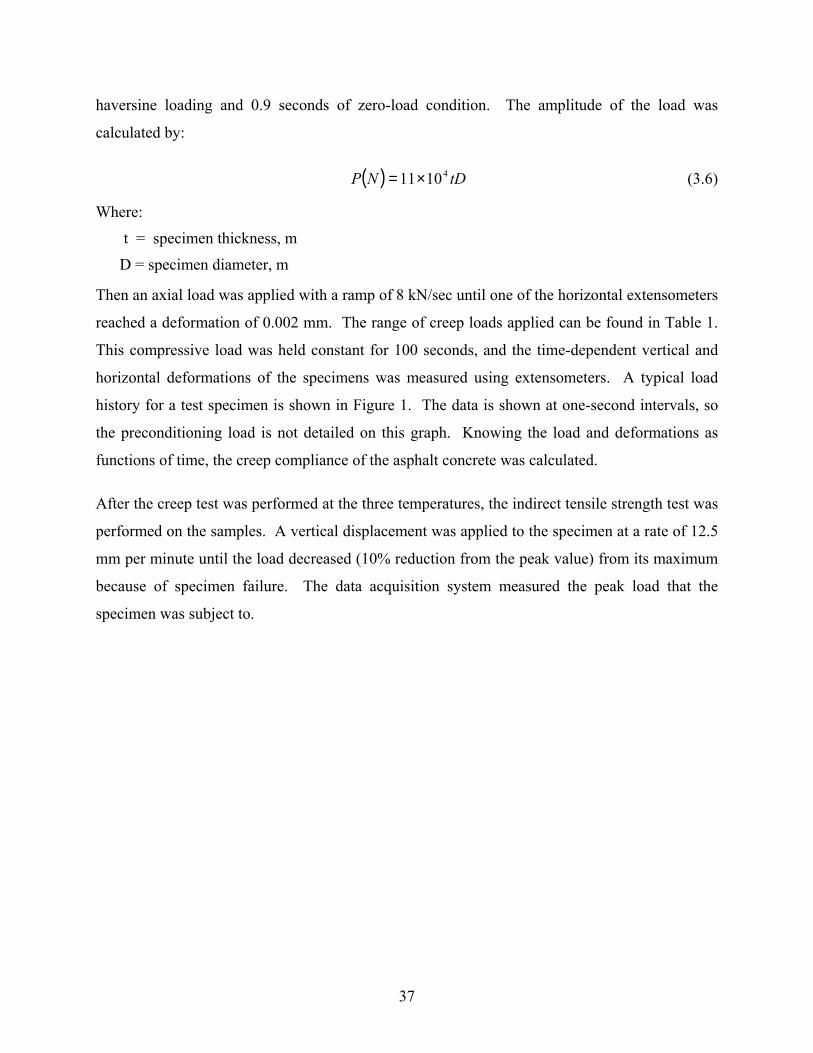
haversine loading and 0.9 seconds of zero-load condition. The amplitude of the load was
calculated by:
tDP (3.6) ( )N 41011×=
Where:
t = specimen thickness, m
D = specimen diameter, m
Then an axial load was applied with a ramp of 8 kN/sec until one of the horizontal extensometers
reached a deformation of 0.002 mm. The range of creep loads applied can be found in Table 1.
This compressive load was held constant for 100 seconds, and the time-dependent vertical and
horizontal deformations of the specimens was measured using extensometers. A typical load
history for a test specimen is shown in Figure 1. The data is shown at one-second intervals, so
the preconditioning load is not detailed on this graph. Knowing the load and deformations as
functions of time, the creep compliance of the asphalt concrete was calculated.
After the creep test was performed at the three temperatures, the indirect tensile strength test was
performed on the samples. A vertical displacement was applied to the specimen at a rate of 12.5
mm per minute until the load decreased (10% reduction from the peak value) from its maximum
because of specimen failure. The data acquisition system measured the peak load that the
specimen was subject to.
37
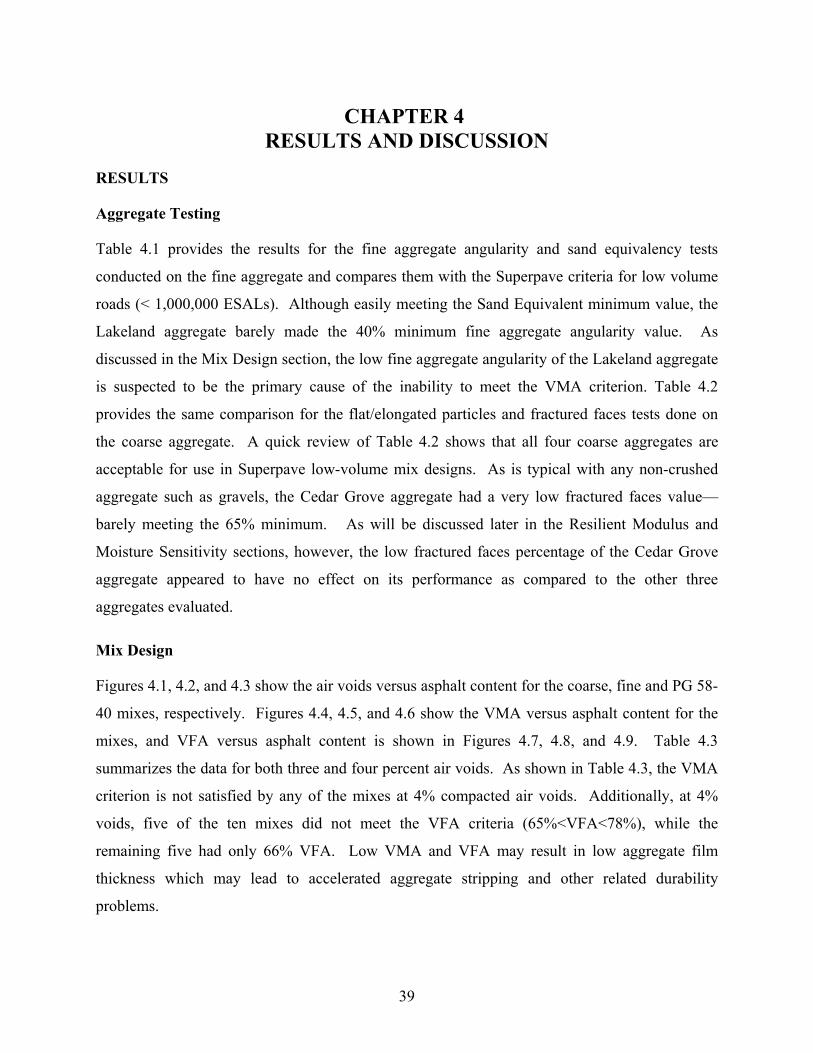
CHAPTER 4 RESULTS AND DISCUSSION
RESULTS
Aggregate Testing
Table 4.1 provides the results for the fine aggregate angularity and sand equivalency tests
conducted on the fine aggregate and compares them with the Superpave criteria for low volume
roads (< 1,000,000 ESALs). Although easily meeting the Sand Equivalent minimum value, the
Lakeland aggregate barely made the 40% minimum fine aggregate angularity value. As
discussed in the Mix Design section, the low fine aggregate angularity of the Lakeland aggregate
is suspected to be the primary cause of the inability to meet the VMA criterion. Table 4.2
provides the same comparison for the flat/elongated particles and fractured faces tests done on
the coarse aggregate. A quick review of Table 4.2 shows that all four coarse aggregates are
acceptable for use in Superpave low-volume mix designs. As is typical with any non-crushed
aggregate such as gravels, the Cedar Grove aggregate had a very low fractured faces value—
barely meeting the 65% minimum. As will be discussed later in the Resilient Modulus and
Moisture Sensitivity sections, however, the low fractured faces percentage of the Cedar Grove
aggregate appeared to have no effect on its performance as compared to the other three
aggregates evaluated.
Mix Design
Figures 4.1, 4.2, and 4.3 show the air voids versus asphalt content for the coarse, fine and PG 58-
40 mixes, respectively. Figures 4.4, 4.5, and 4.6 show the VMA versus asphalt content for the
mixes, and VFA versus asphalt content is shown in Figures 4.7, 4.8, and 4.9. Table 4.3
summarizes the data for both three and four percent air voids. As shown in Table 4.3, the VMA
criterion is not satisfied by any of the mixes at 4% compacted air voids. Additionally, at 4%
voids, five of the ten mixes did not meet the VFA criteria (65%<VFA<78%), while the
remaining five had only 66% VFA. Low VMA and VFA may result in low aggregate film
thickness which may lead to accelerated aggregate stripping and other related durability
problems.
39
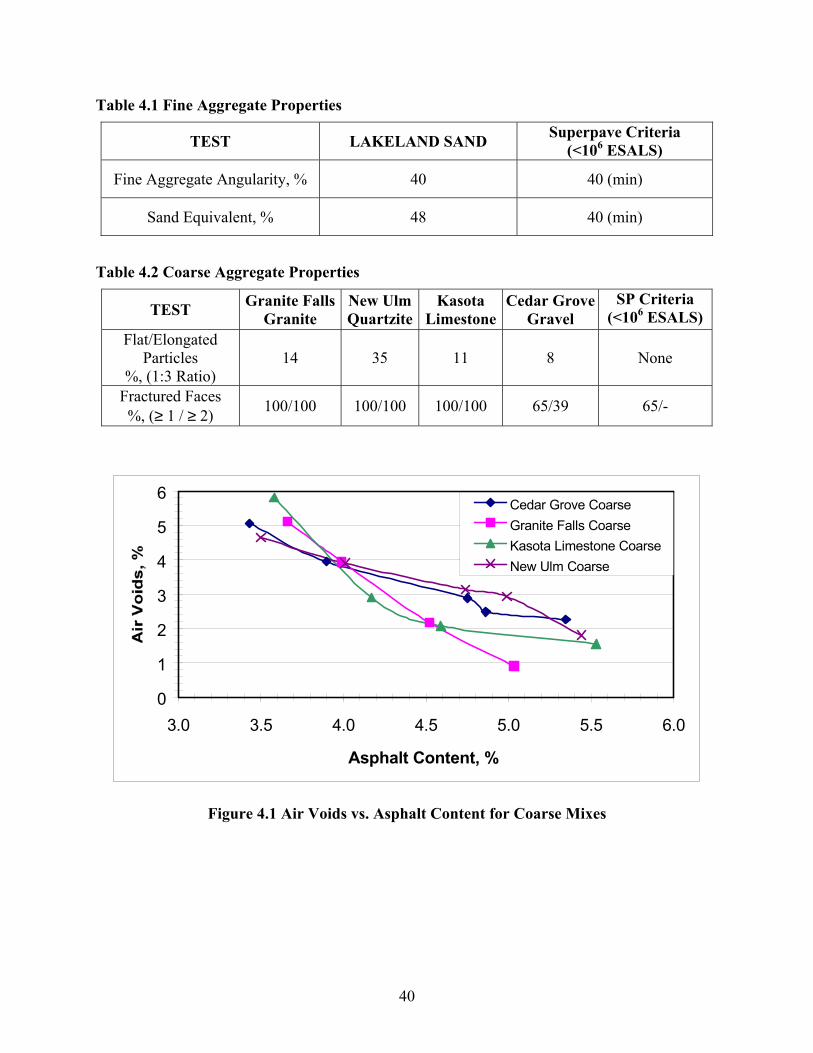
Table 4.1 Fine Aggregate Properties
TEST LAKELAND SAND Superpave Criteria (<106 ESALS)
Fine Aggregate Angularity, % 40 40 (min)
Sand Equivalent, % 48 40 (min)
Table 4.2 Coarse Aggregate Properties
TEST Granite FallsGranite
New UlmQuartzite
Kasota Limestone
Cedar GroveGravel
SP Criteria (<106 ESALS)
Flat/Elongated Particles
%, (1:3 Ratio) 14 35 11 8 None
Fractured Faces %, (≥ 1 / ≥ 2) 100/100 100/100 100/100 65/39 65/-
0
1
2
3
4
5
6
3.0 3.5 4.0 4.5 5.0 5.5 6.0
Asphalt Content, %
Cedar Grove CoarseGranite Falls CoarseKasota Limestone CoarseNew Ulm Coarse
Figure 4.1 Air Voids vs. Asphalt Content for Coarse Mixes
40
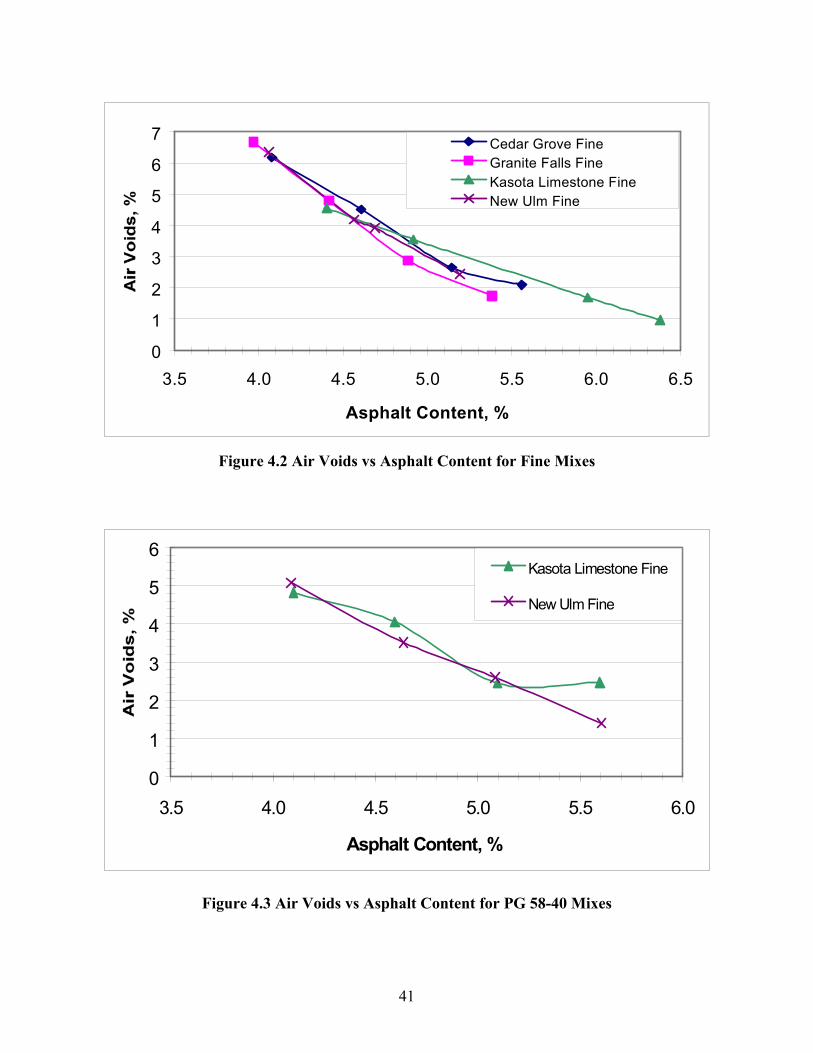
0
1
2
3
4
5
6
7
3.5 4.0 4.5 5.0 5.5 6.0 6.5
Asphalt Content, %
Cedar Grove FineGranite Falls FineKasota Limestone FineNew Ulm Fine
Figure 4.2 Air Voids vs Asphalt Content for Fine Mixes
0
1
2
3
4
5
6
3.5 4.0 4.5 5.0 5.5 6.0
Asphalt Content, %
Kasota Limestone Fine
New Ulm Fine
Figure 4.3 Air Voids vs Asphalt Content for PG 58-40 Mixes
41
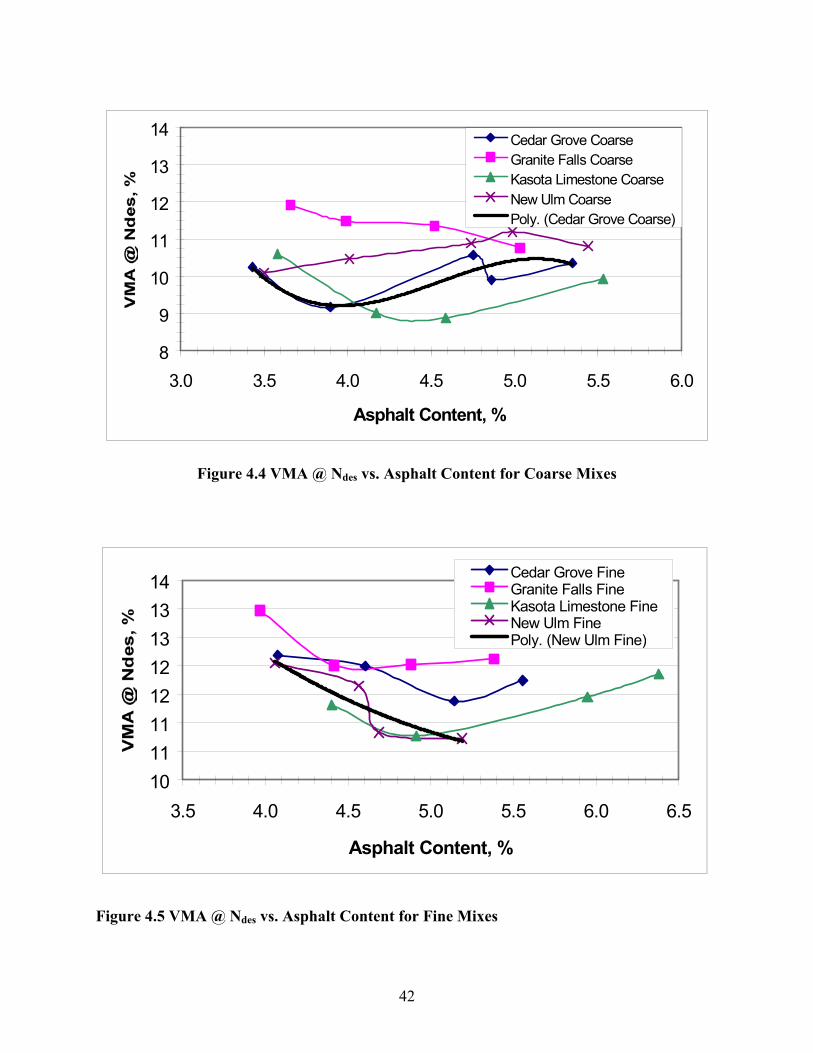
8
9
10
11
12
13
14
3.0 3.5 4.0 4.5 5.0 5.5 6.0
Asphalt Content, %
Cedar Grove CoarseGranite Falls CoarseKasota Limestone CoarseNew Ulm CoarsePoly. (Cedar Grove Coarse)
Figure 4.4 VMA @ Ndes vs. Asphalt Content for Coarse Mixes
1011111212131314
3.5 4.0 4.5 5.0 5.5 6.0 6.5
Asphalt Content, %
Cedar Grove FineGranite Falls FineKasota Limestone FineNew Ulm FinePoly. (New Ulm Fine)
Figure 4.5 VMA @ Ndes vs. Asphalt Content for Fine Mixes
42
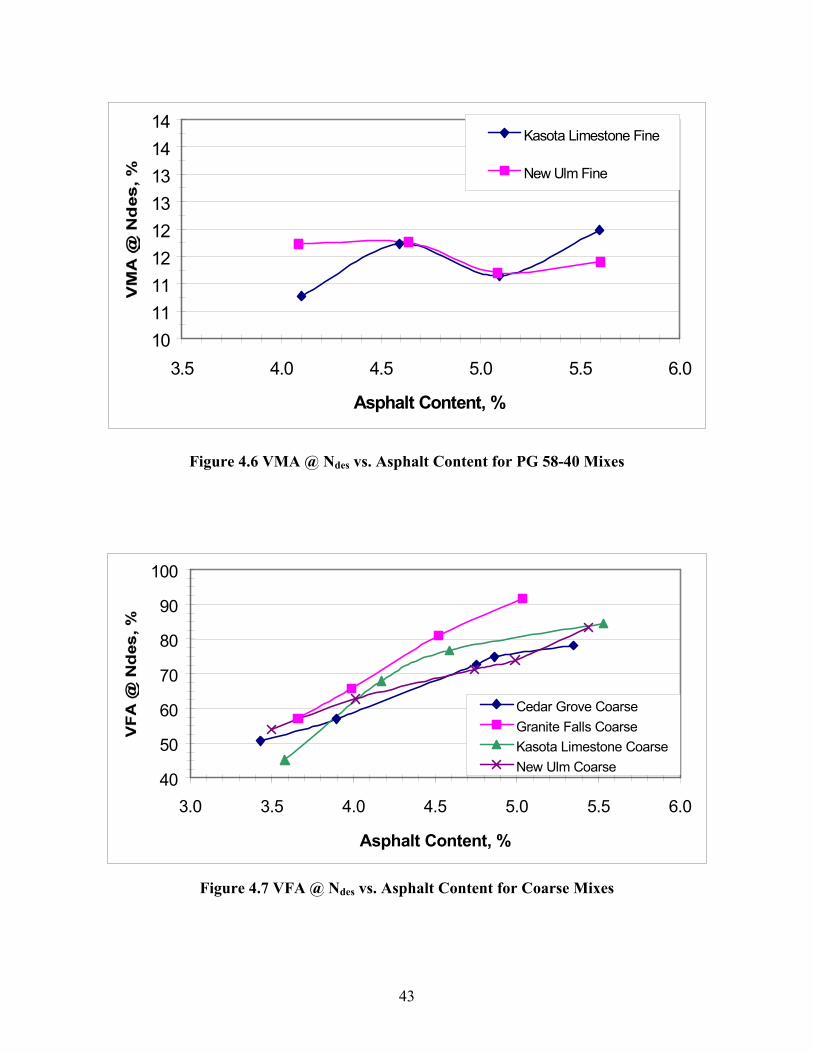
101111121213131414
3.5 4.0 4.5 5.0 5.5 6
Asphalt Content, %
.0
Kasota Limestone Fine
New Ulm Fine
Figure 4.6 VMA @ Ndes vs. Asphalt Content for PG 58-40 Mixes
40
50
60
70
80
90
100
3.0 3.5 4.0 4.5 5.0 5.5 6.0
Asphalt Content, %
Cedar Grove CoarseGranite Falls CoarseKasota Limestone CoarseNew Ulm Coarse
Figure 4.7 VFA @ Ndes vs. Asphalt Content for Coarse Mixes
43
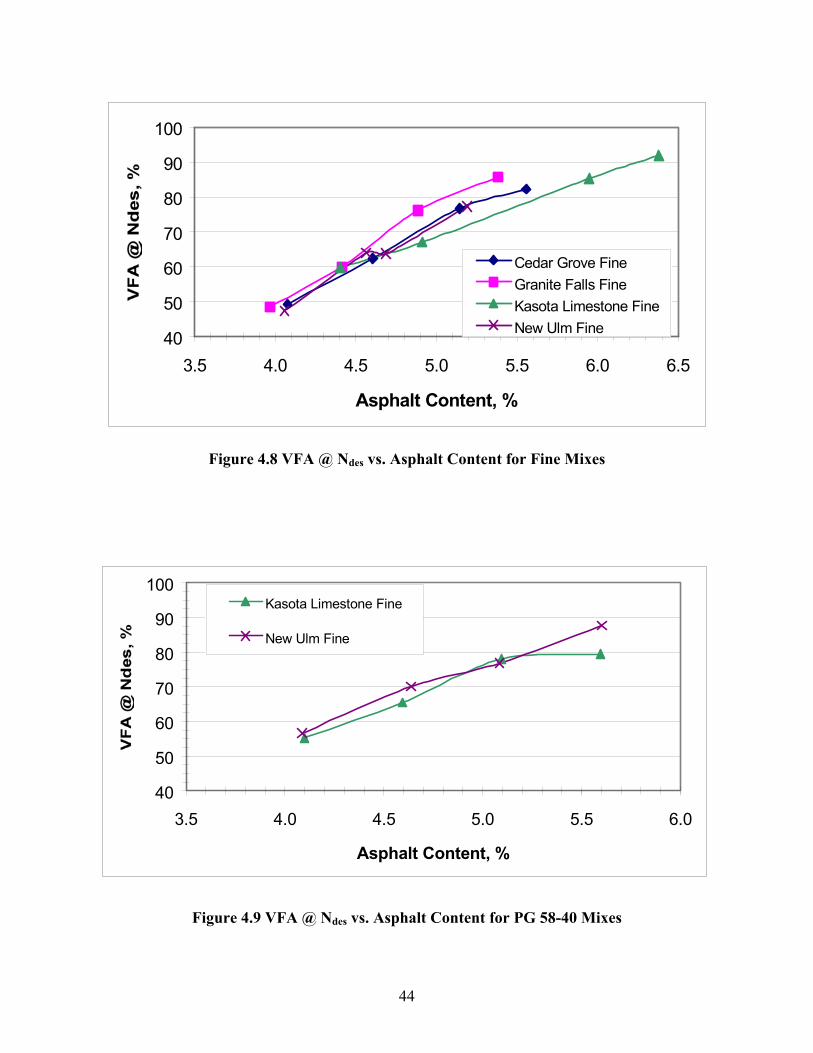
40
50
60
70
80
90
100
3.5 4.0 4.5 5.0 5.5 6.0 6.5
Asphalt Content, %
Cedar Grove FineGranite Falls FineKasota Limestone FineNew Ulm Fine
Figure 4.8 VFA @ Ndes vs. Asphalt Content for Fine Mixes
40
50
60
70
80
90
100
3.5 4.0 4.5 5.0 5.5 6.0
Asphalt Content, %
Kasota Limestone Fine
New Ulm Fine
Figure 4.9 VFA @ Ndes vs. Asphalt Content for PG 58-40 Mixes
44
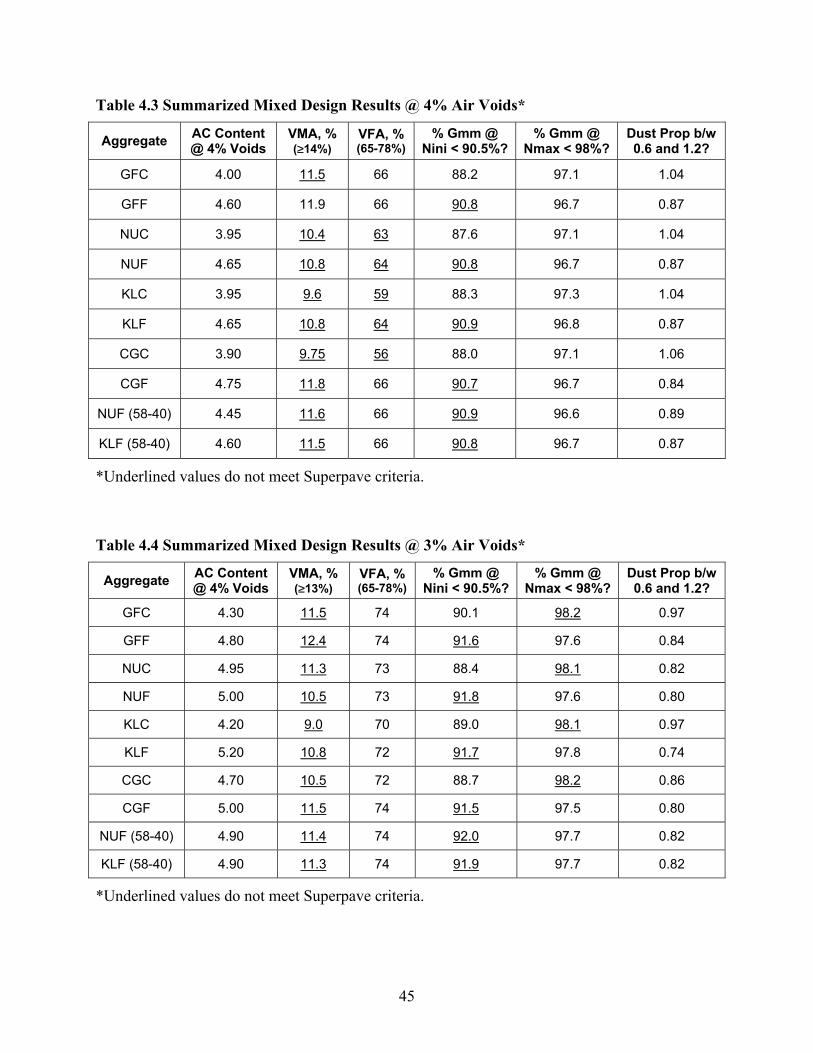
Table 4.3 Summarized Mixed Design Results @ 4% Air Voids*
Aggregate AC Content @ 4% Voids
VMA, % (≥14%)
VFA, % (65-78%)
% Gmm @ Nini < 90.5%?
% Gmm @ Nmax < 98%?
Dust Prop b/w 0.6 and 1.2?
GFC 4.00 11.5 66 88.2 97.1 1.04
GFF 4.60 11.9 66 90.8 96.7 0.87
NUC 3.95 10.4 63 87.6 97.1 1.04
NUF 4.65 10.8 64 90.8 96.7 0.87
KLC 3.95 9.6 59 88.3 97.3 1.04
KLF 4.65 10.8 64 90.9 96.8 0.87
CGC 3.90 9.75 56 88.0 97.1 1.06
CGF 4.75 11.8 66 90.7 96.7 0.84
NUF (58-40) 4.45 11.6 66 90.9 96.6 0.89
KLF (58-40) 4.60 11.5 66 90.8 96.7 0.87
*Underlined values do not meet Superpave criteria.
Table 4.4 Summarized Mixed Design Results @ 3% Air Voids*
Aggregate AC Content @ 4% Voids
VMA, % (≥13%)
VFA, % (65-78%)
% Gmm @ Nini < 90.5%?
% Gmm @ Nmax < 98%?
Dust Prop b/w 0.6 and 1.2?
GFC 4.30 11.5 74 90.1 98.2 0.97
GFF 4.80 12.4 74 91.6 97.6 0.84
NUC 4.95 11.3 73 88.4 98.1 0.82
NUF 5.00 10.5 73 91.8 97.6 0.80
KLC 4.20 9.0 70 89.0 98.1 0.97
KLF 5.20 10.8 72 91.7 97.8 0.74
CGC 4.70 10.5 72 88.7 98.2 0.86
CGF 5.00 11.5 74 91.5 97.5 0.80
NUF (58-40) 4.90 11.4 74 92.0 97.7 0.82
KLF (58-40) 4.90 11.3 74 91.9 97.7 0.82
*Underlined values do not meet Superpave criteria.
45
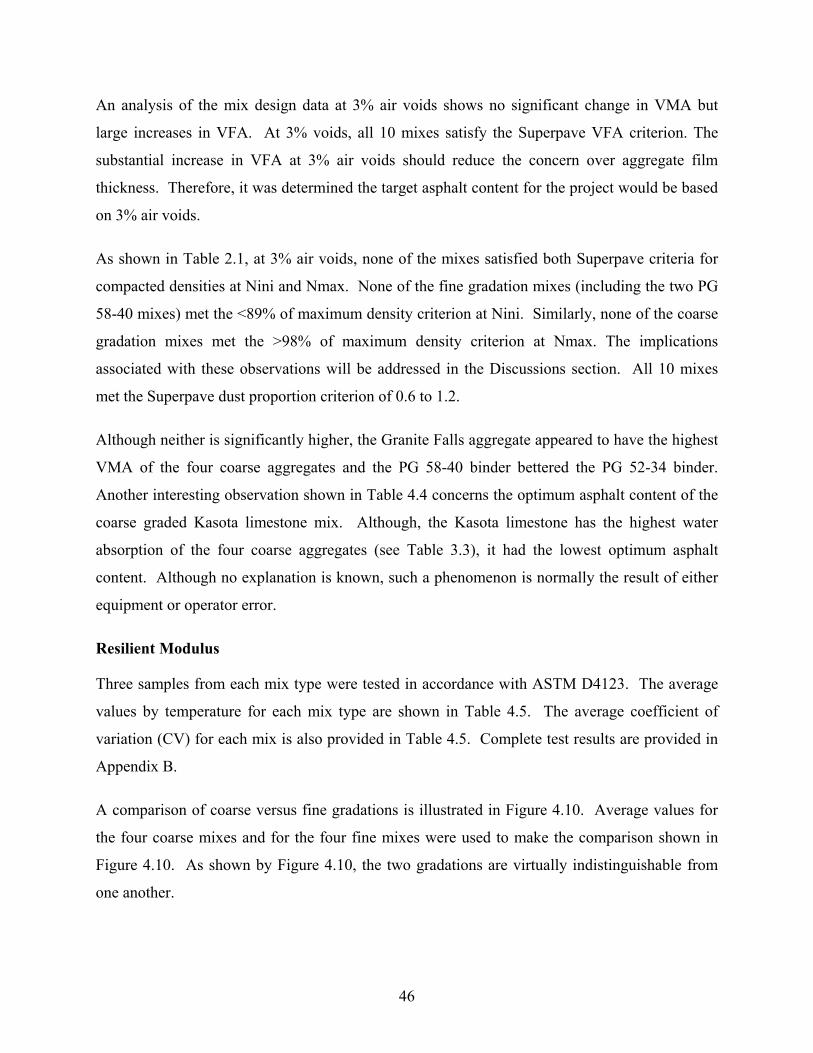
An analysis of the mix design data at 3% air voids shows no significant change in VMA but
large increases in VFA. At 3% voids, all 10 mixes satisfy the Superpave VFA criterion. The
substantial increase in VFA at 3% air voids should reduce the concern over aggregate film
thickness. Therefore, it was determined the target asphalt content for the project would be based
on 3% air voids.
As shown in Table 2.1, at 3% air voids, none of the mixes satisfied both Superpave criteria for
compacted densities at Nini and Nmax. None of the fine gradation mixes (including the two PG
58-40 mixes) met the <89% of maximum density criterion at Nini. Similarly, none of the coarse
gradation mixes met the >98% of maximum density criterion at Nmax. The implications
associated with these observations will be addressed in the Discussions section. All 10 mixes
met the Superpave dust proportion criterion of 0.6 to 1.2.
Although neither is significantly higher, the Granite Falls aggregate appeared to have the highest
VMA of the four coarse aggregates and the PG 58-40 binder bettered the PG 52-34 binder.
Another interesting observation shown in Table 4.4 concerns the optimum asphalt content of the
coarse graded Kasota limestone mix. Although, the Kasota limestone has the highest water
absorption of the four coarse aggregates (see Table 3.3), it had the lowest optimum asphalt
content. Although no explanation is known, such a phenomenon is normally the result of either
equipment or operator error.
Resilient Modulus
Three samples from each mix type were tested in accordance with ASTM D4123. The average
values by temperature for each mix type are shown in Table 4.5. The average coefficient of
variation (CV) for each mix is also provided in Table 4.5. Complete test results are provided in
Appendix B.
A comparison of coarse versus fine gradations is illustrated in Figure 4.10. Average values for
the four coarse mixes and for the four fine mixes were used to make the comparison shown in
Figure 4.10. As shown by Figure 4.10, the two gradations are virtually indistinguishable from
one another.
46
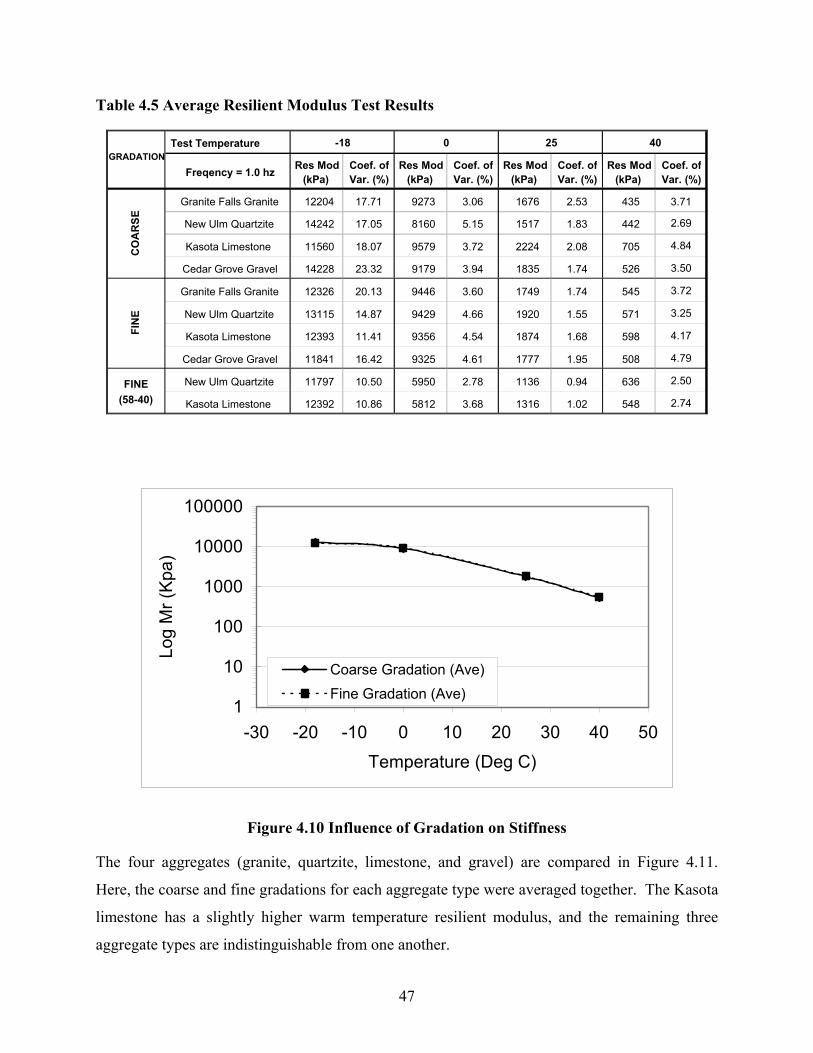
Table 4.5 Average Resilient Modulus Test Results
Test Temperature
Freqency = 1.0 hz Res Mod(kPa)
Coef. ofVar. (%)
Res Mod(kPa)
Coef. ofVar. (%)
Res Mod(kPa)
Coef. ofVar. (%)
Res Mod(kPa)
Coef. ofVar. (%)
Granite Falls Granite 12204 17.71 9273 3.06 1676 2.53 435 3.71
New Ulm Quartzite 14242 17.05 8160 5.15 1517 1.83 442 2.69
Kasota Limestone 11560 18.07 9579 3.72 2224 2.08 705 4.84
Cedar Grove Gravel 14228 23.32 9179 3.94 1835 1.74 526 3.50
Granite Falls Granite 12326 20.13 9446 3.60 1749 1.74 545 3.72
New Ulm Quartzite 13115 14.87 9429 4.66 1920 1.55 571 3.25
Kasota Limestone 12393 11.41 9356 4.54 1874 1.68 598 4.17
Cedar Grove Gravel 11841 16.42 9325 4.61 1777 1.95 508 4.79
New Ulm Quartzite 11797 10.50 5950 2.78 1136 0.94 636 2.50
Kasota Limestone 12392 10.86 5812 3.68 1316 1.02 548 2.74
40C
OA
RSE
FIN
E
FINE(58-40)
GRADATION-18 0 25
1
10
100
1000
10000
100000
-30 -20 -10 0 10 20 30 40 50Temperature (Deg C)
Log
Mr (
Kpa)
Coarse Gradation (Ave)Fine Gradation (Ave)
Figure 4.10 Influence of Gradation on Stiffness
The four aggregates (granite, quartzite, limestone, and gravel) are compared in Figure 4.11.
Here, the coarse and fine gradations for each aggregate type were averaged together. The Kasota
limestone has a slightly higher warm temperature resilient modulus, and the remaining three
aggregate types are indistinguishable from one another.
47
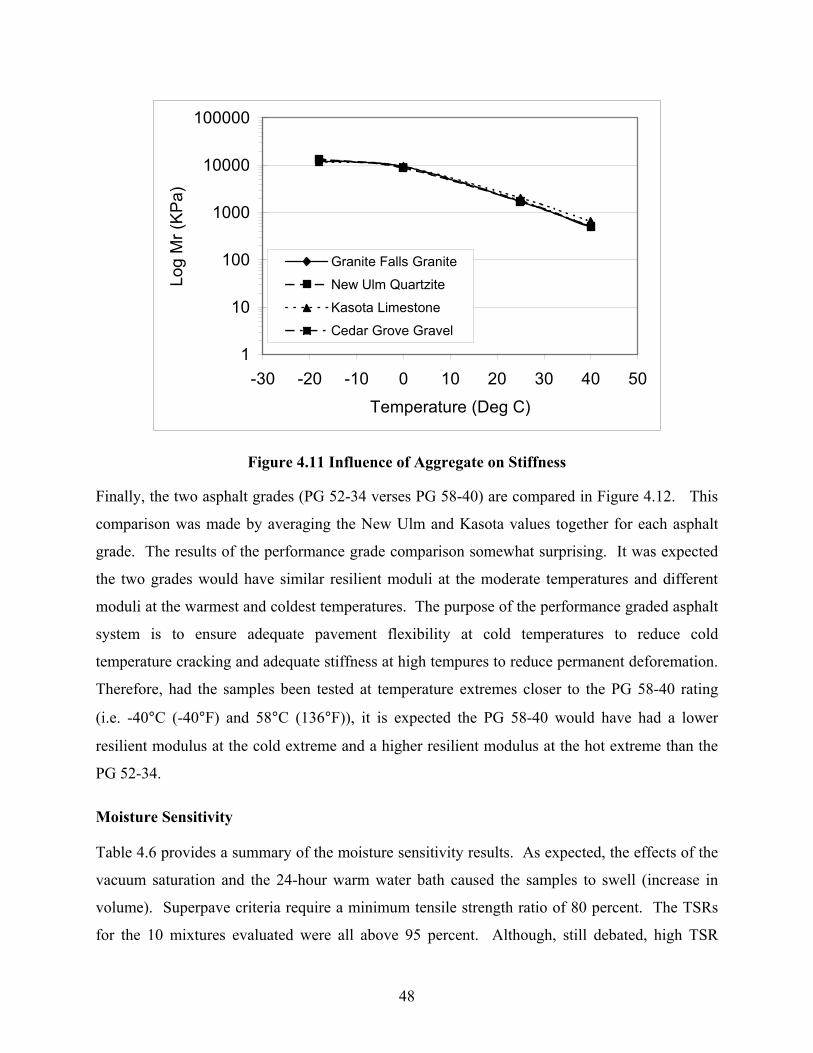
1
10
100
1000
10000
100000
-30 -20 -10 0 10 20 30 40 50Temperature (Deg C)
Log
Mr (
KPa)
Granite Falls GraniteNew Ulm QuartziteKasota LimestoneCedar Grove Gravel
Figure 4.11 Influence of Aggregate on Stiffness
Finally, the two asphalt grades (PG 52-34 verses PG 58-40) are compared in Figure 4.12. This
comparison was made by averaging the New Ulm and Kasota values together for each asphalt
grade. The results of the performance grade comparison somewhat surprising. It was expected
the two grades would have similar resilient moduli at the moderate temperatures and different
moduli at the warmest and coldest temperatures. The purpose of the performance graded asphalt
system is to ensure adequate pavement flexibility at cold temperatures to reduce cold
temperature cracking and adequate stiffness at high tempures to reduce permanent deforemation.
Therefore, had the samples been tested at temperature extremes closer to the PG 58-40 rating
(i.e. -40°C (-40°F) and 58°C (136°F)), it is expected the PG 58-40 would have had a lower
resilient modulus at the cold extreme and a higher resilient modulus at the hot extreme than the
PG 52-34.
Moisture Sensitivity
Table 4.6 provides a summary of the moisture sensitivity results. As expected, the effects of the
vacuum saturation and the 24-hour warm water bath caused the samples to swell (increase in
volume). Superpave criteria require a minimum tensile strength ratio of 80 percent. The TSRs
for the 10 mixtures evaluated were all above 95 percent. Although, still debated, high TSR
48
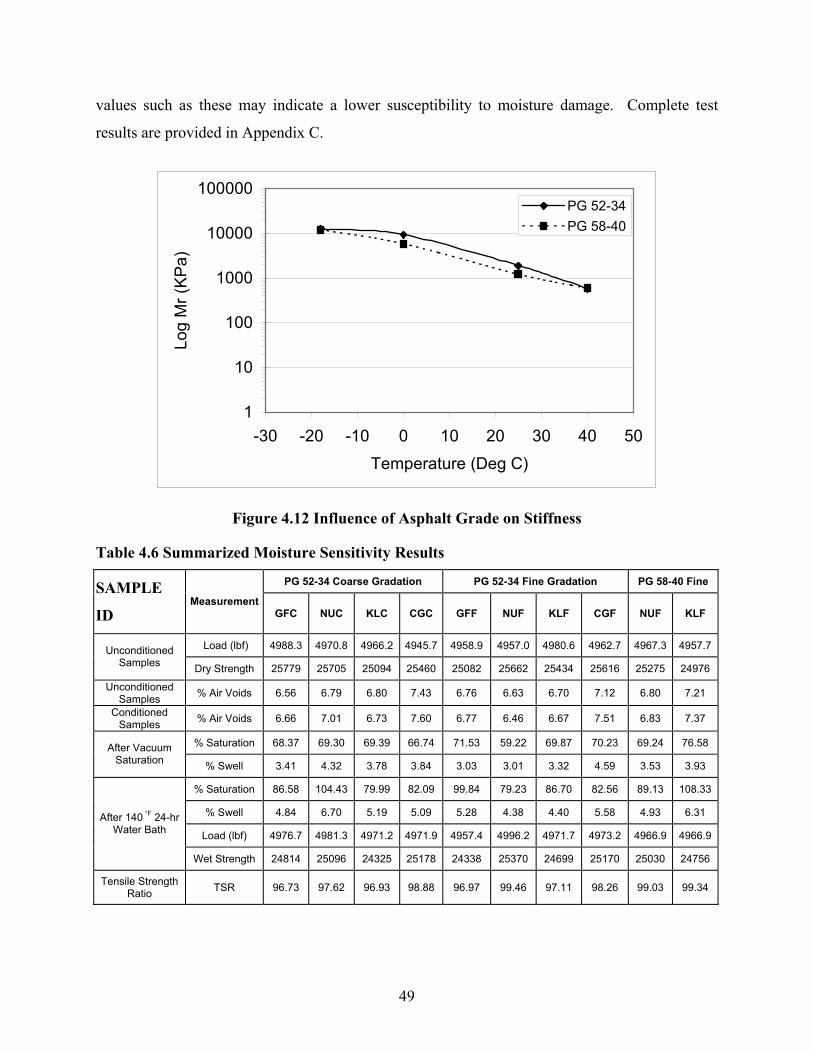
values such as these may indicate a lower susceptibility to moisture damage. Complete test
results are provided in Appendix C.
1
10
100
1000
10000
100000
-30 -20 -10 0 10 20 30 40 50Temperature (Deg C)
Log
Mr (
KPa)
PG 52-34PG 58-40
Figure 4.12 Influence of Asphalt Grade on Stiffness
Table 4.6 Summarized Moisture Sensitivity Results
PG 52-34 Coarse Gradation PG 52-34 Fine Gradation PG 58-40 Fine SAMPLE
ID Measurement
GFC NUC KLC CGC GFF NUF KLF CGF NUF KLF
Load (lbf) 4988.3 4970.8 4966.2 4945.7 4958.9 4957.0 4980.6 4962.7 4967.3 4957.7 Unconditioned Samples Dry Strength 25779 25705 25094 25460 25082 25662 25434 25616 25275 24976
Unconditioned Samples % Air Voids 6.56 6.79 6.80 7.43 6.76 6.63 6.70 7.12 6.80 7.21
Conditioned Samples % Air Voids 6.66 7.01 6.73 7.60 6.77 6.46 6.67 7.51 6.83 7.37
% Saturation 68.37 69.30 69.39 66.74 71.53 59.22 69.87 70.23 69.24 76.58 After Vacuum Saturation % Swell 3.41 4.32 3.78 3.84 3.03 3.01 3.32 4.59 3.53 3.93
% Saturation 86.58 104.43 79.99 82.09 99.84 79.23 86.70 82.56 89.13 108.33
% Swell 4.84 6.70 5.19 5.09 5.28 4.38 4.40 5.58 4.93 6.31
Load (lbf) 4976.7 4981.3 4971.2 4971.9 4957.4 4996.2 4971.7 4973.2 4966.9 4966.9
After 140 °F 24-hr Water Bath
Wet Strength 24814 25096 24325 25178 24338 25370 24699 25170 25030 24756
Tensile Strength Ratio TSR 96.73 97.62 96.93 98.88 96.97 99.46 97.11 98.26 99.03 99.34
49
Rut Testing
The Asphalt Pavement Analyzer tested six samples from each mix type. The mixes were all
tested at 40 °C, even though there were two different grades of asphalt binder. The average rut
depth measurements after 8000 cycles for each mix type are shown in Table 3. The average
coefficient of variation (COV) for each mix is also provided in Table 3.
A comparison of the four mix types is illustrated in Figure 6. The six samples were averaged for
each of the four mixes to make the rut depth comparisons in Figure 6. For the PG 58-40 binder,
the New Ulm quartzite and Kasota limestone had virtually the same rut depth. They both had
approximately 1 mm of rutting after 8000 cycles in the APA. The mixes using PG 52-34 asphalt
binders showed significantly more rutting. This behavior is expected since the PG 52-34 is a
lower grade binder. The Kasota Limestone PG 52-34 mix had the largest rut depths at over 6.5
mm.
Low Temperature Creep Testing
The Superpave Indirect Tensile Test (IDT) assessed the creep compliance and indirect tensile
strength on three samples of each of the four mixes. The creep compliance was tested at three
temperatures: 0 °C, -10 °C, and -20 °C. The strength was then tested at -10 °C. For each of the
four mixes, a plot of creep compliance vs. time was created. These plots are shown in Figures 2-
5.
For all of the mixes, as the test temperature decreases, the creep compliance also decreases. This
results in a stiffer mix at lower temperatures. In addition, Young’s modulus increases as the
temperature decreases. In the elastic range of the material (at time t = 0), the modulus is the
inverse of the creep compliance. Young’s modulus was not actually calculated, but can be
inferred qualitatively from Figures 2-5.
The indirect tensile strength of each mix is shown in Table 2. Also included is the Poisson’s
ratio calculated at half of the maximum load for each specimen. The indirect tensile strength
was tested at -10 °C.
50
DISCUSSION
Mix Design
One of the more important mix design issues to discuss is the difficulty in achieving the
minimum voids in the mineral aggregate (VMA) criterion. As described in the mix design
methodology, eight different gradations were tried in the attempt to meet the 14% Superpave
VMA criterion. In fact, this is not an isolated case. If there is a common theme in Superpave
experiences, it is a difficulty in achieving the minimum VMA criterion. Kandhal, et al [21]
attribute the problem to the increased compactive effort of the gyratory compactor and the
increased use of coarser aggregate mixes.
McLeod [6] first presented the concept of volumetric proportioning to the Highway Research
Board in 1956. He developed his volumetric criteria based on specimens compacted with a
Marshall hammer (75 blows on each side). McLeod [6] concluded that to ensure adequate
durability in a mixture compacted to 5 percent air voids, the mixture must contain a minimum
VMA of 15 percent and a minimum asphalt content of 4.5 percent. Further work by McLeod [6]
related minimum VMA criteria to nominal maximum particle size of the aggregate. Since VMA
is the sum of air voids and voids filled with asphalt, the minimum VMA criteria can be
extrapolated to 14 percent for four percent air voids, and 13 percent for three percent air voids.
McLeod’s original 15% minimum VMA criterion was adopted by the Asphalt Institute in 1964
and revised to include the extrapolated values in 1993 for their MS-2 manual [22]. The revised
minimum VMA requirements have also been included in the Superpave mix design. However,
the VMA criteria were developed for denser aggregate gradations commonly used in the
Marshall mix design. Therefore, it may be questionable to require coarser Superpave mixes to
meet the same VMA criteria as denser Marshall mixes.
The rationale behind specifying a minimum VMA percentage is to ensure that the mix contains
enough asphalt cement to adequately coat the aggregate particles. This asphalt coating of the
aggregate is known as the asphalt film thickness. Adequate film thickness is essential for a long-
lasting, durable mix. Campen, et al [23] demonstrated that thicker films produced mixes that
were flexible and durable. Thin films produced mixes that were brittle and exhibited excessive
cracking, raveling, poor performance, and reduced longevity. Research by Campen, et al [23]
51
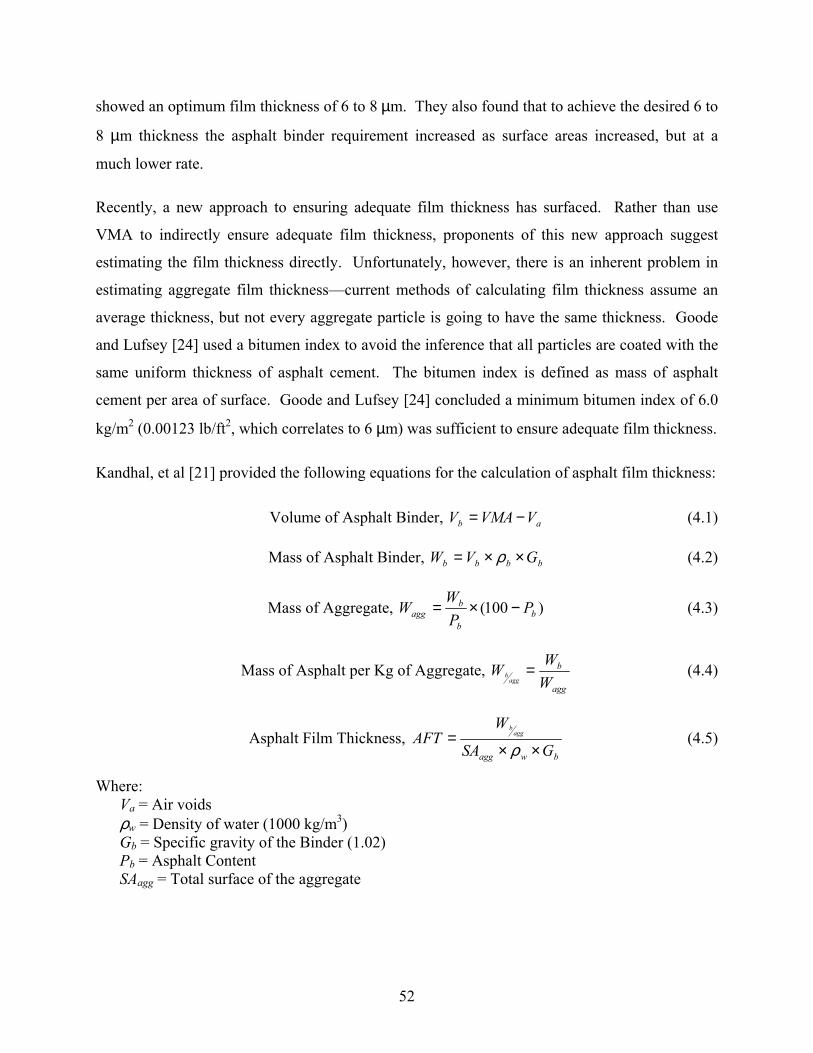
showed an optimum film thickness of 6 to 8 µm. They also found that to achieve the desired 6 to
8 µm thickness the asphalt binder requirement increased as surface areas increased, but at a
much lower rate.
Recently, a new approach to ensuring adequate film thickness has surfaced. Rather than use
VMA to indirectly ensure adequate film thickness, proponents of this new approach suggest
estimating the film thickness directly. Unfortunately, however, there is an inherent problem in
estimating aggregate film thickness—current methods of calculating film thickness assume an
average thickness, but not every aggregate particle is going to have the same thickness. Goode
and Lufsey [24] used a bitumen index to avoid the inference that all particles are coated with the
same uniform thickness of asphalt cement. The bitumen index is defined as mass of asphalt
cement per area of surface. Goode and Lufsey [24] concluded a minimum bitumen index of 6.0
kg/m2 (0.00123 lb/ft2, which correlates to 6 µm) was sufficient to ensure adequate film thickness.
Kandhal, et al [21] provided the following equations for the calculation of asphalt film thickness:
Volume of Asphalt Binder, V (4.1) ab VVMA −=
Mass of Asphalt Binder, W bbbb GV ××= ρ (4.2)
Mass of Aggregate, )100( bb
bagg P
PW
−×=W (4.3)
Mass of Asphalt per Kg of Aggregate, agg
b
WW
aggb =W (4.4)
Asphalt Film Thickness, bwagg GSA
WAFT agg
b
××=
ρ (4.5)
Where: Va = Air voids ρw = Density of water (1000 kg/m3) Gb = Specific gravity of the Binder (1.02) Pb = Asphalt Content SAagg = Total surface of the aggregate
52
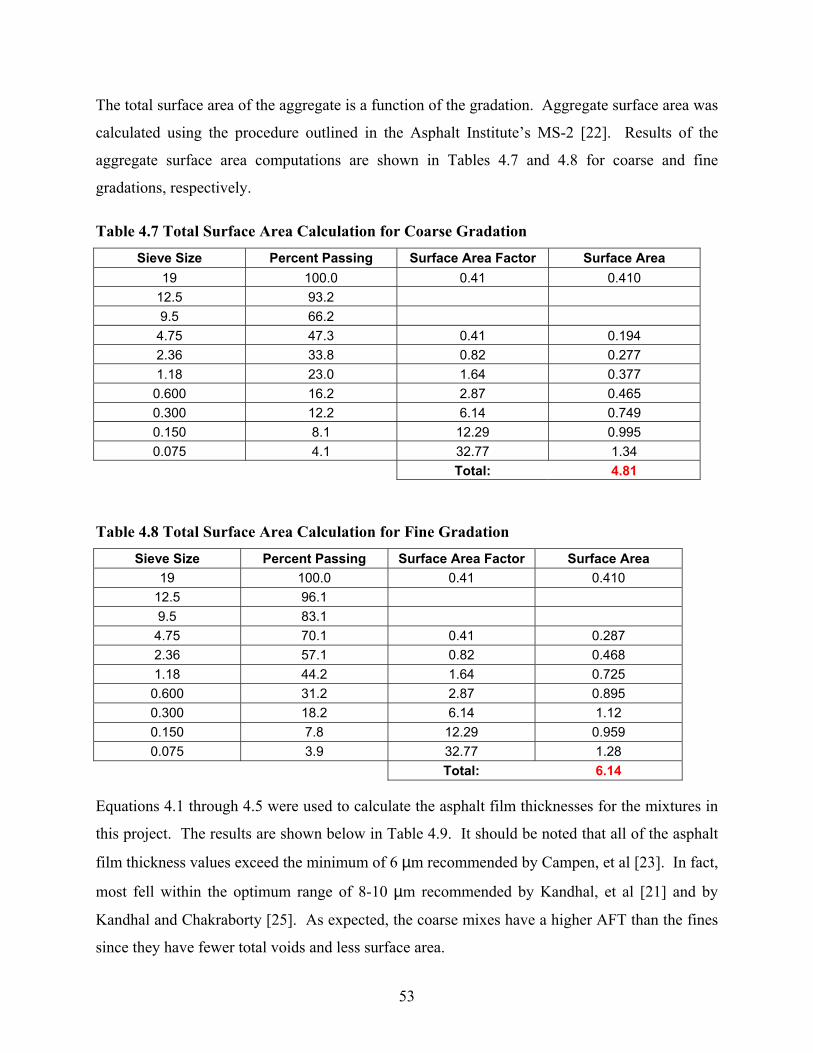
The total surface area of the aggregate is a function of the gradation. Aggregate surface area was
calculated using the procedure outlined in the Asphalt Institute’s MS-2 [22]. Results of the
aggregate surface area computations are shown in Tables 4.7 and 4.8 for coarse and fine
gradations, respectively.
Table 4.7 Total Surface Area Calculation for Coarse Gradation Sieve Size Percent Passing Surface Area Factor Surface Area
19 100.0 0.41 0.410 12.5 93.2 9.5 66.2
4.75 47.3 0.41 0.194 2.36 33.8 0.82 0.277 1.18 23.0 1.64 0.377 0.600 16.2 2.87 0.465 0.300 12.2 6.14 0.749 0.150 8.1 12.29 0.995 0.075 4.1 32.77 1.34
Total: 4.81
Table 4.8 Total Surface Area Calculation for Fine Gradation Sieve Size Percent Passing Surface Area Factor Surface Area
19 100.0 0.41 0.410 12.5 96.1 9.5 83.1 4.75 70.1 0.41 0.287 2.36 57.1 0.82 0.468 1.18 44.2 1.64 0.725
0.600 31.2 2.87 0.895 0.300 18.2 6.14 1.12 0.150 7.8 12.29 0.959 0.075 3.9 32.77 1.28
Total: 6.14
Equations 4.1 through 4.5 were used to calculate the asphalt film thicknesses for the mixtures in
this project. The results are shown below in Table 4.9. It should be noted that all of the asphalt
film thickness values exceed the minimum of 6 µm recommended by Campen, et al [23]. In fact,
most fell within the optimum range of 8-10 µm recommended by Kandhal, et al [21] and by
Kandhal and Chakraborty [25]. As expected, the coarse mixes have a higher AFT than the fines
since they have fewer total voids and less surface area.
53
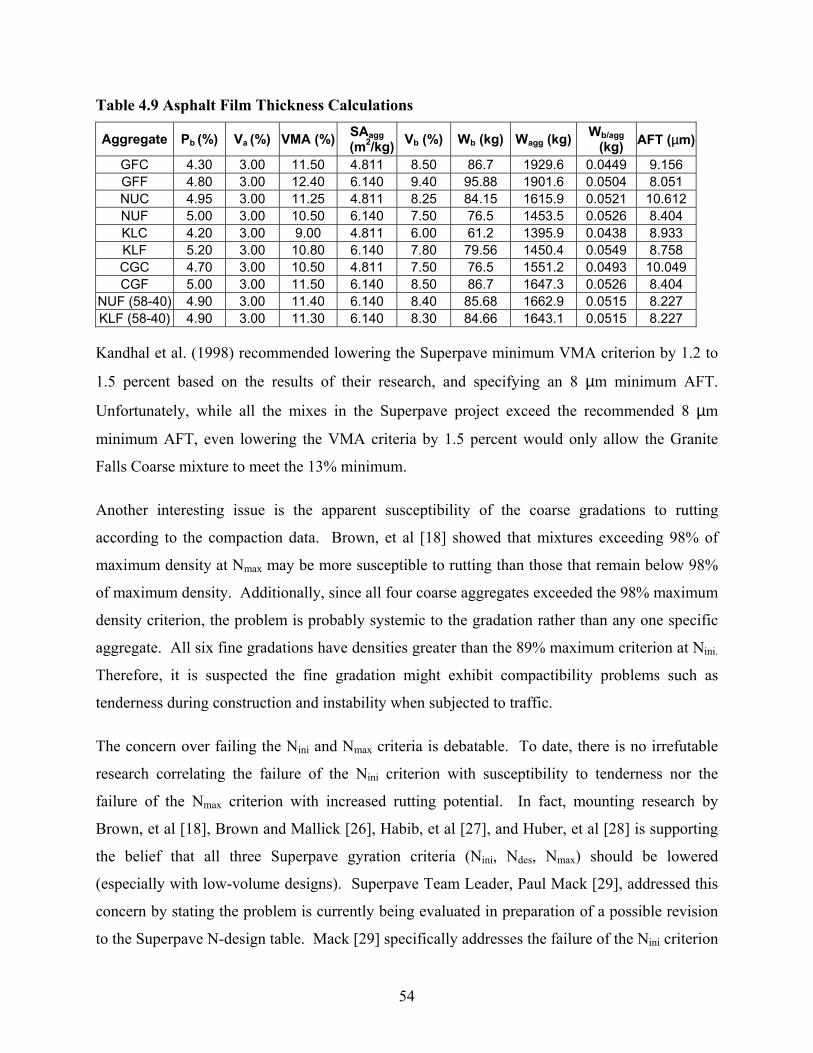
Table 4.9 Asphalt Film Thickness Calculations
Aggregate Pb (%) Va (%) VMA (%) SAagg (m2/kg) Vb (%) Wb (kg) Wagg (kg) Wb/agg
(kg) AFT (µm)
GFC 4.30 3.00 11.50 4.811 8.50 86.7 1929.6 0.0449 9.156 GFF 4.80 3.00 12.40 6.140 9.40 95.88 1901.6 0.0504 8.051 NUC 4.95 3.00 11.25 4.811 8.25 84.15 1615.9 0.0521 10.612 NUF 5.00 3.00 10.50 6.140 7.50 76.5 1453.5 0.0526 8.404 KLC 4.20 3.00 9.00 4.811 6.00 61.2 1395.9 0.0438 8.933 KLF 5.20 3.00 10.80 6.140 7.80 79.56 1450.4 0.0549 8.758 CGC 4.70 3.00 10.50 4.811 7.50 76.5 1551.2 0.0493 10.049 CGF 5.00 3.00 11.50 6.140 8.50 86.7 1647.3 0.0526 8.404
NUF (58-40) 4.90 3.00 11.40 6.140 8.40 85.68 1662.9 0.0515 8.227 KLF (58-40) 4.90 3.00 11.30 6.140 8.30 84.66 1643.1 0.0515 8.227
Kandhal et al. (1998) recommended lowering the Superpave minimum VMA criterion by 1.2 to
1.5 percent based on the results of their research, and specifying an 8 µm minimum AFT.
Unfortunately, while all the mixes in the Superpave project exceed the recommended 8 µm
minimum AFT, even lowering the VMA criteria by 1.5 percent would only allow the Granite
Falls Coarse mixture to meet the 13% minimum.
Another interesting issue is the apparent susceptibility of the coarse gradations to rutting
according to the compaction data. Brown, et al [18] showed that mixtures exceeding 98% of
maximum density at Nmax may be more susceptible to rutting than those that remain below 98%
of maximum density. Additionally, since all four coarse aggregates exceeded the 98% maximum
density criterion, the problem is probably systemic to the gradation rather than any one specific
aggregate. All six fine gradations have densities greater than the 89% maximum criterion at Nini.
Therefore, it is suspected the fine gradation might exhibit compactibility problems such as
tenderness during construction and instability when subjected to traffic.
The concern over failing the Nini and Nmax criteria is debatable. To date, there is no irrefutable
research correlating the failure of the Nini criterion with susceptibility to tenderness nor the
failure of the Nmax criterion with increased rutting potential. In fact, mounting research by
Brown, et al [18], Brown and Mallick [26], Habib, et al [27], and Huber, et al [28] is supporting
the belief that all three Superpave gyration criteria (Nini, Ndes, Nmax) should be lowered
(especially with low-volume designs). Superpave Team Leader, Paul Mack [29], addressed this
concern by stating the problem is currently being evaluated in preparation of a possible revision
to the Superpave N-design table. Mack [29] specifically addresses the failure of the Nini criterion
54
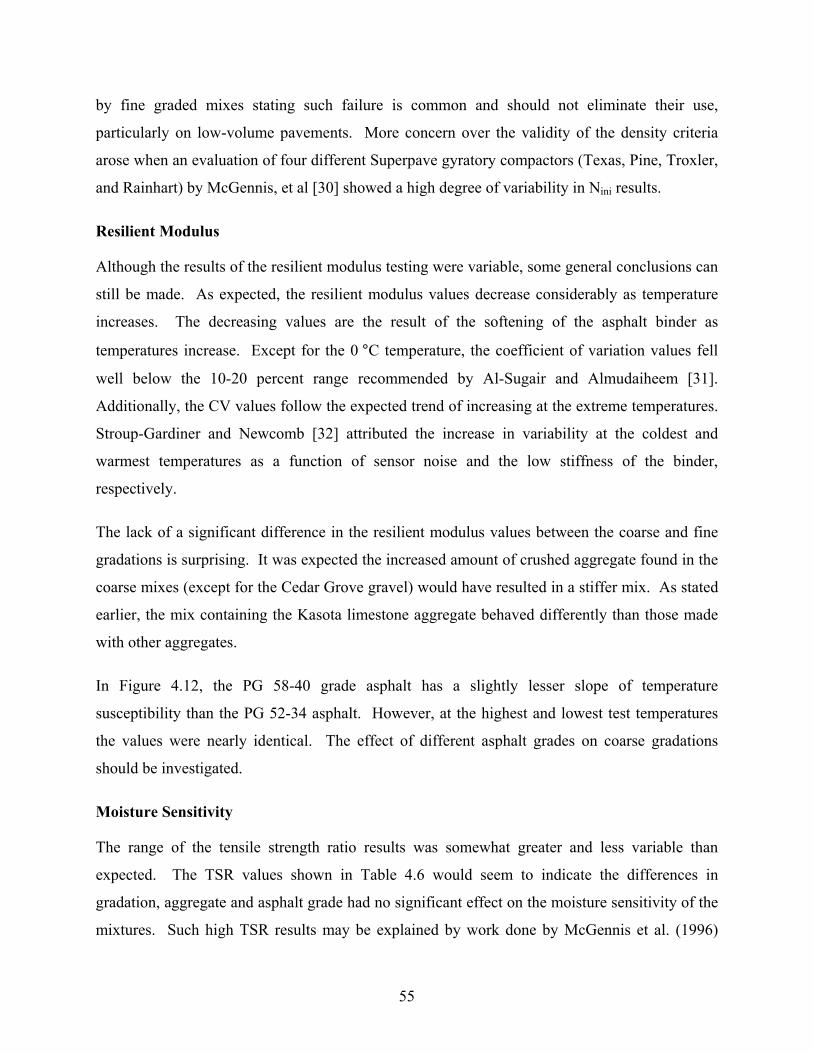
by fine graded mixes stating such failure is common and should not eliminate their use,
particularly on low-volume pavements. More concern over the validity of the density criteria
arose when an evaluation of four different Superpave gyratory compactors (Texas, Pine, Troxler,
and Rainhart) by McGennis, et al [30] showed a high degree of variability in Nini results.
Resilient Modulus
Although the results of the resilient modulus testing were variable, some general conclusions can
still be made. As expected, the resilient modulus values decrease considerably as temperature
increases. The decreasing values are the result of the softening of the asphalt binder as
temperatures increase. Except for the 0 °C temperature, the coefficient of variation values fell
well below the 10-20 percent range recommended by Al-Sugair and Almudaiheem [31].
Additionally, the CV values follow the expected trend of increasing at the extreme temperatures.
Stroup-Gardiner and Newcomb [32] attributed the increase in variability at the coldest and
warmest temperatures as a function of sensor noise and the low stiffness of the binder,
respectively.
The lack of a significant difference in the resilient modulus values between the coarse and fine
gradations is surprising. It was expected the increased amount of crushed aggregate found in the
coarse mixes (except for the Cedar Grove gravel) would have resulted in a stiffer mix. As stated
earlier, the mix containing the Kasota limestone aggregate behaved differently than those made
with other aggregates.
In Figure 4.12, the PG 58-40 grade asphalt has a slightly lesser slope of temperature
susceptibility than the PG 52-34 asphalt. However, at the highest and lowest test temperatures
the values were nearly identical. The effect of different asphalt grades on coarse gradations
should be investigated.
Moisture Sensitivity
The range of the tensile strength ratio results was somewhat greater and less variable than
expected. The TSR values shown in Table 4.6 would seem to indicate the differences in
gradation, aggregate and asphalt grade had no significant effect on the moisture sensitivity of the
mixtures. Such high TSR results may be explained by work done by McGennis et al. (1996)
55
who concluded specimens compacted with a Superpave gyratory compactor resulted in
significantly higher TSR values. Additionally, Brown, et al [18] noted the low reliability and
lack of a satisfactory relationship between laboratory and field conditions as a chronic problem
with moisture sensitivity tests.
Rut Testing
The asphalt mixes using PG 52-34 binder showed more rutting susceptibility than the mixes
using PG 58-40. At elevated temperatures, the asphalt binder softens and leads to more
permanent deformation. Except for the New Ulm Quartzite PG 52-34 mix, the coefficient of
variation values were very high. We would like to see much more consistent test results with the
APA.
It appears that after 8000 test cycles, the two PG 58-40 mixes have reached a plateau in their rut
depths. Conversely, the two PG 52-34 mixes appear to continue rutting in a fairly linear trend
with the number of cycles. The PG 58-40 mixes reached approximately 80% of their final rut
depths after about 1000 cycles. They did not rut significantly more in the remaining 7000 cycles.
Another interesting observation to note is the variation due to the Asphalt Pavement Analyzer
itself. For three out of the four mixes, the samples under the left wheel had the lowest rut depths
while the samples under the right wheel had the highest rut depths. When the APA device was
being developed, it went through a series of ruggedness studies at three different laboratories.
Randy West (1999) pointed out similar differences between the left, center, and right rut depth
measurements. He stated that although each wheel load is individually calibrated, the three
wheel loads are not necessarily independent. Observations may indicate that the wheel positions
do not apply uniform loads to the asphalt specimens.
Low Temperature Creep Testing
In holding the asphalt binder constant and varying the aggregate, there was virtually no
difference in creep compliance at -10 °C and -20 °C. For the PG 52-34 binder, the NU mix had
40% lower creep compliance than the KL mix at 0 °C. For the PG 58-40 binder, the KL mix had
20% lower creep compliance than the NU mix at 0 °C.
56
In holding the aggregate constant and varying the asphalt binder, the PG 52-34 mix had lower
creep compliance than the PG 58-40 mix. For the New Ulm quartzite aggregate, the PG 52-34
mix had a 50% lower creep compliance than the PG 58-40 mix at all three low temperatures. For
the Kasota limestone aggregate, the PG 52-34 mix had 30%-40% lower creep compliance than
the PG 58-40 mix at -10 °C and -20 °C. At 0 °C there was virtually no difference in creep
compliance between the two mixes.
From the above analysis, it was determined that the PG 52-34 mixes are stiffer at low
temperatures than PG 58-40 mixes. This was an expected behavior, based on the binder grades.
At -10 °C and -20 °C, the aggregate was found to have little influence on the creep compliance.
However, at 0 °C the aggregates did have an effect on the stiffness of the mix. In addition, the
asphalt binder was found to have an effect on creep compliance at all three low temperatures.
The PG 58-40 mixes have higher creep compliance than the PG 52-34 mixes.
From the IDT tests, Poisson’s ratio was determined to be rather low. However, it was well
within the range of possible values for µ. For the PG 52-34 binder, the NU mix had a slightly
higher strength than the KL mix. For the PG 58-40 binder, the two aggregates displayed the
same strength. The softer binder (PG 58-40) was less affected by aggregate type than the stiffer
binder (PG 52-34).
57
CHAPTER 5 - CONCLUSIONS AND RECOMMENDATIONS –
CONCLUSIONS
1. The locally available Minnesota aggregates Lakeland sand, Granite Falls granite, New Ulm
quartzite, Kasota limestone, and Cedar Grove gravel meet Superpave aggregate consensus
property criteria for low-volume roads (less than 1,000,000 ESALs). This corresponds to
Mn/DOT traffic levels 1 and 2.
2. Meeting Superpave’s minimum VMA and VFA criteria was very difficult possibly due to the
low angularity of the natural sand. Lowering the target air void content to 3% resulted in
compliant VFA, but all mixes still failed the VMA requirement. Use of a more angular fine
aggregate would help increase the VMA.
3. None of the six fine-graded mixtures met the Nini criterion (90.5 for Level 2 traffic)
indicating fine-graded mixtures produced with the natural sand may be susceptible to
tenderness problems. There appeared to be no significant difference in tenderness
susceptibility between the different coarse aggregates evaluated.
4. None of the coarse-graded mixtures met the Nmax criterion indicating coarse-graded mixtures
produced with the Lakeland sand may experience premature permanent deformation. All of
the fine-graded mixtures met the Nmax criterion. There appeared to be no significant
difference in susceptibility to permanent deformation between the four coarse aggregates
evaluated. Based on the gyratory compaction data, there was no significant difference in
indications of susceptibility to either tenderness or permanent deformation between the two
asphalt grades evaluated.
5. The results of the resilient modulus tests were highly variable. Although high variability is
not uncommon to resilient modulus testing, the 1 to 23 percent average coefficients of
variation range from this study was greater than the typical 6 to 20 percent range presented
by Timm [33].
59
6. Except for the Kasota limestone which produced slightly greater resilient modulus values, the
different coarse aggregates evaluated in this study had no significant effect on resilient
modulus. To date, however, no direct correlation has been made between resilient modulus
values and long-term susceptibility to permanent deformation.
7. There was no significant difference in resilient modulus values between the coarse and fine
gradations evaluated in this study.
8. Mixes produced with the PG 52-34 asphalt binder had higher resilient modulus results at
intermediate temperatures than those produced with the PG 58-40 binder. There was no
significant difference in resilient modulus values between the two binders at the highest and
lowest temperatures tested (40 and -18 °C, respectively). The fact that this temperature range
does not include the high and low temperature values for these PG binders may explain the
failure of the resilient modulus test to differentiate between the two binders.
9. All mixes evaluated met the Superpave moisture sensitivity criterion. The higher asphalt
contents associated with the relatively low 3% design air void content was the probable cause
for the high TSR values. High TSR values indicate the higher asphalt content associated
with the lower target air void content may improve the durability of low-volume road
mixtures.
10. There was no significant difference in moisture sensitivity results between the coarse and
fine gradations, coarse aggregate types, or asphalt grades evaluated in this study (values
ranged from 96.7 to 99.5%). An examination of the dry and wet tensile strength values also
revealed no significant differences - dry values ranged from 1110 to 1140 kPa (161 to 166
psi) and wet values ranged from 1080 to 1130 kPa (157 to 164 psi). As concluded by Stroup-
Gardiner and Newcomb [32], lack of a significant difference between material types
indicates moisture sensitivity may be more dependent on volumetric parameters than on
types of material.
11. The appropriate software for analyzing the low temperature creep compliance data was not
available at the time this report was written. For all four mixes (see Table 3.5), as the test
60
temperature decreased, the creep compliance also decreased and Young’s Modulus based on
the instantaneous loading portion of the creep compliance test increased.
12. Different aggregates had little effect on creep compliance. The PG 52-34 mixes had lower
creep compliance than the PG 58-40 mixes which suggests that the PG 52-34 mixes may be
more susceptible to low temperature cracking.
13. Based on the gyratory compaction data, there was no significant difference in indications of
susceptibility to either tenderness or permanent deformation between the two asphalt grades
evaluated (PG 52-34 and PG 58-40).
14. For a given coarse aggregate type, the PG 52-34 mixes showed more rutting than the PG 58-
40 mixes, indicating that increasing the upper grade of the binder may result in a more rut-
resistant pavement.
15. The type of aggregate had little effect on rutting in the PG 58-40 mixes. However, in the PG
52-34 mixes, the Kasota Limestone mixes had almost twice the rut depth of the New Ulm
Quartzite mixes.
16. Based on the results of the limited testing performed in this study, decreasing the lower PG
binder grade and increasing the upper PG binder grade can be effective in improving the low
temperature cracking resistance and rut resistance of a pavement, respectively.
RECOMMENDATIONS
1. Consider using a target air void content of three percent when the quality of available
aggregates makes it difficult to meet VMA requirements. The higher asphalt content
associated with a lower air void target would increase the long-term durability of the
pavement. The decrease in stability associated with pavements constructed with higher
asphalt contents is offset by the lower volume of heavy-truck traffic experienced on low-
volume roads.
2. Since the low angularity of the natural sand resulted in difficulties meeting Superpave
volumetric criteria, a more angular aggregate should be used to produce mixtures that can
61
meet the volumetric criteria. A study should be conducted to investigate the benefit of using a
more angular fine aggregate. This study should include an economic evaluation.
3. If volumetric criteria cannot be met, a possible solution would be to lower the target air void
content and take the necessary precautions to overcome any tenderness problems that may
result. Wolters [34] provides specific recommendations to overcome tenderness problems.
4. An economic analysis should be completed to determine whether the improvements in
predicted long-term pavement performance due to the use higher quality materials.
5. A full low-temperature cracking analysis should be performed and master creep compliance
curves generated when the software is available.
6. Performance testing (APA and creep compliance) should be conducted to evaluate the
difference between coarse and fine aggregate gradations.
7. Further testing should be conducted to evaluate the benefits of decreasing the lower PG grade
and increasing the upper PG grade.
62
REFERENCES 1. Marker, V., “Introduction to the Compaction of Asphalt Concrete Symposium,”
Proceedings: Association of Asphalt Paving Technologists, Vol. 36, 1967, pp. 288-294.
2. Sowers, G.F., “Introductory Soil Mechanics and Foundations: Geotechnical Engineering,” 4th Ed., Macmillan Publishing Co., Inc., New York, 1979.
3. Geller, M.., “Compaction Equipment for Asphalt Mixtures,” Placement and Compaction of Asphalt Mixtures, ASTM STP 829, F.T. Wagner, Ed., American Society for Testing and Materials, 1984, pp. 28-47.
4. Nijboer, L.W., Plasticity as a Factor in the Design of Dense Bituminous Road Carpets, Elsevier Publishing, New York, 1948.
5. Kari, W.J., “Mix Properties as They Affect Compaction,” Proceedings: Association of Asphalt Paving Technologists, Vol. 36, 1967, pp. 295-309.
6. McLeod, N.W., “Influence of Viscosity of Asphalt Cements on Compaction of Paving Mixtures in the Field,” Highway Research Record No. 158, Highway Research Board National Academy of Sciences, Washington D.C., 1960.
7. Asphalt Institute, “Superpave Series No. 2 (SP-2): Superpave Mix Design,” The Asphalt Institute, Lexington, KY, 1996.
8. Santucci, L.E. and Schmidt, R.J., “Setting Rate of Asphalt Concrete,” Highway Research Bulletin No. 333, Highway Research Board, Washington, D.C., 1962.
9. Bissada, A.F., “Resistance to Compaction of Asphalt Mixtures and Its Relationship to Stiffness,” Placement and Compaction of Asphalt Mixtures, ASTM STP 829, F.T. Wagner, Ed., American Society for Testing and Materials, 1984, pp. 131-145.
10. Harvey, J.T., and Tsai, B-W., “Effects of Asphalt Content and Air Void Content on Mix Fatigue and Stiffness,” Transportation Research Record 1543: Design and Construction of Asphalt Overlays and Hot-Mix Asphalt Construction Practices, Transportation Research Board, National Academy Press, Washington D.C., 1996, pp. 38-45.
11. Parker, C.F., “Steel-Tired Rollers,” Highway Research Bulletin No. 246, Highway Research Board, Washington D.C., 1960.
12. Kennedy, T.W., Roberts, F.L., and McGennis, R.B., “Effects of Compaction Temperature and Effort on the Engineering Properties of Asphalt Concrete Mixtures,” Placement and Compaction of Asphalt Mixtures, ASTM STP 829, F.T. Wagner, Ed., American Society for Testing and Materials, 1984, pp. 48-66.
13. Hadley, W.O., Hudson, W.R., Kennedy, T.W., “Correlation of Indirect Tensile Test Results with Stability and Cohesiometer Values for Asphalt-Treated Materials and
63
64
Discussion,” Proceedings: Association of Asphalt Paving Technologists, Vol. 39, 1970, pp. 745-765.
14. Brown, E.R., “Experiences of Corps of Engineers in Compaction of Hot Asphalt Mixtures,” Placement and Compaction of Asphalt Mixtures, ASTM STP 829, F.T. Wagner, Ed., American Society for Testing and Materials, 1984, pp. 67-79.
15. Asphalt Institute, “Manual Series No. 4 (MS-4), 1989 Ed.: The Asphalt Handbook,” The Asphalt Institute, Lexington, KY, 1989.
16. Roberts, F.L., Kandhal, P.S., Brown, E.R., Lee, D., and Kennedy, T.W., “Hot Mix Asphalt Materials, Mixture Design, and Construction,” 2nd Ed., NAPA Education Foundation, Lanhan Maryland, 1996.
17. Bell, C.A., Hicks, G.R., and Wilson, J.E., Effect of Percent Compaction on Asphalt Mixture Life,” Placement and Compaction of Asphalt Mixtures, ASTM STP 829, F.T. Wagner, Ed., American Society for Testing and Materials, 1984, pp. 107-130.
18. Brown, E.R., Hanson, D.I., and Mallick, R.B., “Evaluation of Superpave Gyratory Compaction of Hot Mix Asphalt,” Transportation Research Record 1543, Transportation Research Board, National Research Council, Washington, D.C., 1996, pp. 145-150.
19. D’Angelo, J.A., Paugh, C., Harman, T.P., and Bukowski, J., “Comnparison of the Superpave Gyratory Compactor to the Marshall for Field Quality Control,” Proceedings: Association of Asphalt Paving Technologists, Vol. 64, 1995, pp. 611-635.
20. McGennis, R., Kennedy, T.W., Anderson V.L., and Perdomo, D., “Ruggedness Evaluation of AASHTO TP4 The Superpave Gyratory Compactor,” Proceedings: Association of Asphalt Paving Technologists, Vol. 66, 1997, pp. 277-311.
21. Kandhal, P.S., Foo, K.Y., and Mallick, R.B., “Critical Review of Voids in Mineral Aggregate Requirements in Superpave,” Transportation Research Record 1609, Transportation Research Board, National Research Council, Washington, D.C., 1998, pp. 21-27.
22. Asphalt Institute, “Manual Series No. 2 (MS-2), 6th Ed.: Mix Design Methods,” The Asphalt Institute, Lexington, KY, 1989.
23. Campen, J.F., Smith, J.R., Erickson, L.G., and Mertz, L.R., “The Relationships Between Voids, Surface Area, Film Thickness and Stability in Bituminous Paving Mixtures,” Proceedings: Association of Asphalt Paving Technologists, Vol. 28, 1959, pp. 149-178.
24. Goode, J.F. and Lufsey, L.A., “Voids, Permeability, Film Thickness vs. Asphalt Hardening,” Proceedings: Association of Asphalt Paving Technologists, Vol. 34, 1965, pp. 430-463.
65
25. Kandhal, P.S. and Chakraborty, S., “Effect of Asphalt Film Thickness on Short- and
Long-Term Aging of Asphalt Paving Mixtures,” Transportation Research Record 1535, Transportation Research Board, National Research Council, Washington, D.C., 1996, pp. 83-90.
26. Brown, E.R. and Mallick, R.B., “An Initial Evaluation for Ndesign Superpave Gyratory Compactor,”, Proceedings: Association of Asphalt Paving Technologists, Vol. 67, 1998, pp. 101-124.
27. Habib, A., Hossain, M., Kaldate, R., and Fager, G.A., “Comparison of Superpave and Marshall Mixtures for Low-Volume Roads and Shoulders,” Transportation Research Record 1609, Transportation Research Board, National Research Council, Washington, D.C., 1998, pp. 44-50.
28. Huber, G.A., Zhang, X., and Fontaine, R., “Superpave Models: Predicting Performance During Design and Construction,” Transportation Research Record 1545, Transportation Research Board, National Research Council, Washington D.C., 1996, pp. 105-112.
29. Mack, P.J., “Newsbrief: 1998 AASHTO Superpave Lead State Guidance,” Superpave Lead State Program, North Central Superpave Center, 10 Jun 1998.
30. McGennis, R.B., Anderson, R.M., Perdomo, D., and Turner, P., “Issues Pertaining to Use of Superpave Gyratory Compactor,” Transportation Research Record 1543, Transportation Research Board, National Research Council, Washington D.C., 1996, pp. 139-144.
31. Al-Sugair, F.H. and Almudaiheem, J.A., “Variations in Measured Resilient Modulus of Aspahlt Mixes,” Journal of Materials in Civil Engineering, Vol. 4, No. 4, November 1992, pp. 343-352.
32. Stroup-Gardiner, M., and Newcomb, D., “Physio-Chemical Evaluation of Asphalt-Aggregate Interaction,” University of Minnesota, Department of Civil Engineering, Minneapolis, MN, May 94.
33. Timm, D.H., “Incorporation of Reliability in Mechanistic-Empirical Flexible Pavement Thickness Design,” University of Minnesota, Department of Civil Engineering, Minneapolis, MN, December 1997.
34. Wolters, R.O., “Tenderness of Hot Mix Asphalt,” Minnesota Asphalt Pavement Association, Minneapolis, MN, September 1998.

APPENDIX A MIX DESIGN
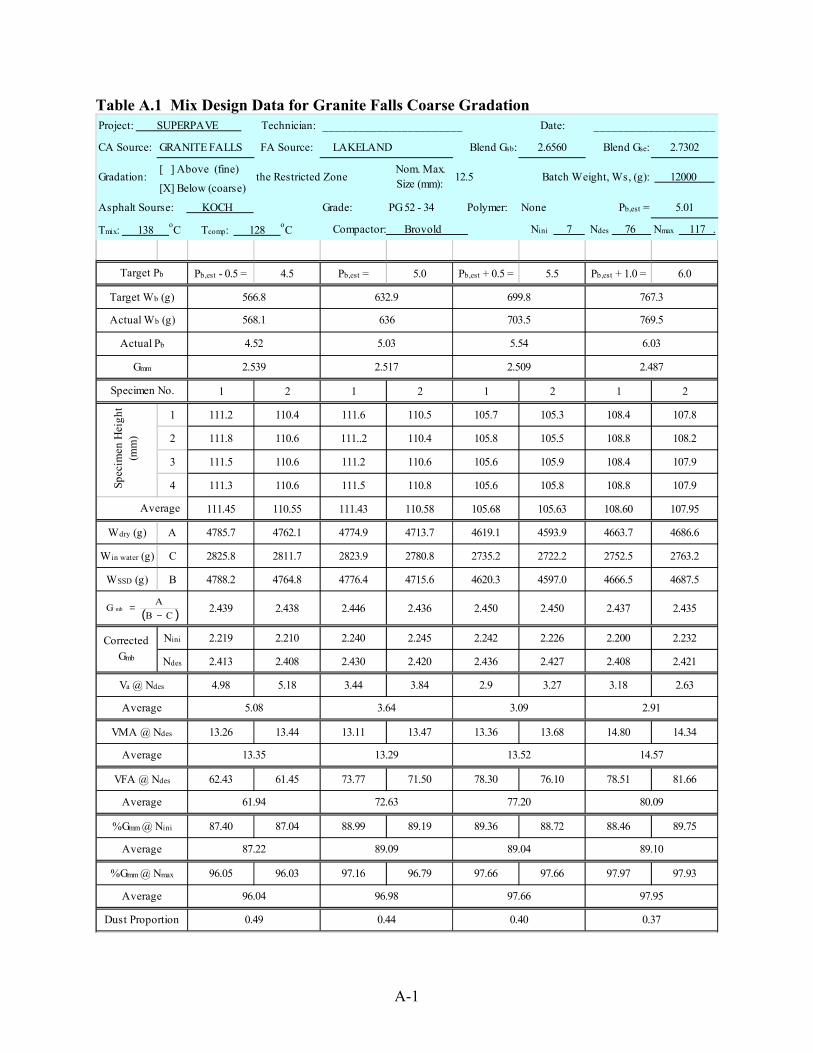
Table A.1 Mix Design Data for Granite Falls Coarse Gradation Project: SUPERPAVE Technician: _______________________ Date: ____________________
CA Source: GRANITE FALLS FA Source: LAKELAND Blend Gsb: 2.6560 Blend Gse: 2.7302
[ ] Above (fine)
[X] Below (coarse)
Asphalt Sourse: KOCH Grade: PG 52 - 34 Polymer: None Pb,est = 5.01
Tmix: 138 oC Tcomp: 128 oC Compactor: Brovold Nini 7 Ndes 76 Nmax 117 .
Pb,est - 0.5 = 4.5 Pb,est = 5.0 Pb,est + 0.5 = 5.5 Pb,est + 1.0 = 6.0
1 2 1 2 1 2 1 2
1 111.2 110.4 111.6 110.5 105.7 105.3 108.4 107.8
2 111.8 110.6 111..2 110.4 105.8 105.5 108.8 108.2
3 111.5 110.6 111.2 110.6 105.6 105.9 108.4 107.9
4 111.3 110.6 111.5 110.8 105.6 105.8 108.8 107.9
111.45 110.55 111.43 110.58 105.68 105.63 108.60 107.95
Wdry (g) A 4785.7 4762.1 4774.9 4713.7 4619.1 4593.9 4663.7 4686.6
Win water (g) C 2825.8 2811.7 2823.9 2780.8 2735.2 2722.2 2752.5 2763.2
WSSD (g) B 4788.2 4764.8 4776.4 4715.6 4620.3 4597.0 4666.5 4687.5
2.439 2.438 2.446 2.436 2.450 2.450 2.437 2.435
Nini 2.219 2.210 2.240 2.245 2.242 2.226 2.200 2.232
Ndes 2.413 2.408 2.430 2.420 2.436 2.427 2.408 2.421
4.98 5.18 3.44 3.84 2.9 3.27 3.18 2.63
13.26 13.44 13.11 13.47 13.36 13.68 14.80 14.34
62.43 61.45 73.77 71.50 78.30 76.10 78.51 81.66
87.40 87.04 88.99 89.19 89.36 88.72 88.46 89.75
96.05 96.03 97.16 96.79 97.66 97.66 97.97 97.93
0.44 0.40 0.37
Average 13.35 13.29 13.52 14.57
VFA @ Ndes
Average
89.09 89.04 89.10
96.04 96.98 97.66 97.95
87.22
Average
Dust Proportion
566.8
568.1
2.539
Average
Actual Pb
0.49
VMA @ Ndes
%Gmm @ Nini
%Gmm @ Nmax
Average
Va @ Ndes
Average
699.8
703.5
2.509
4.52 5.03 5.54
632.9
636
2.517
Specimen No.
Corrected Gmb
Spec
imen
Hei
ght
(mm
)
Target Pb
Target Wb (g)
Actual Wb (g)
Gmm
767.3
769.5
2.487
Gradation: 12.5 12000 the Restricted Zone Nom. Max. Size (mm):
6.03
Batch Weight, Ws, (g):
5.08 3.64 3.09 2.91
61.94 72.63 77.20 80.09
( )CBA
G mb−
=
A-1
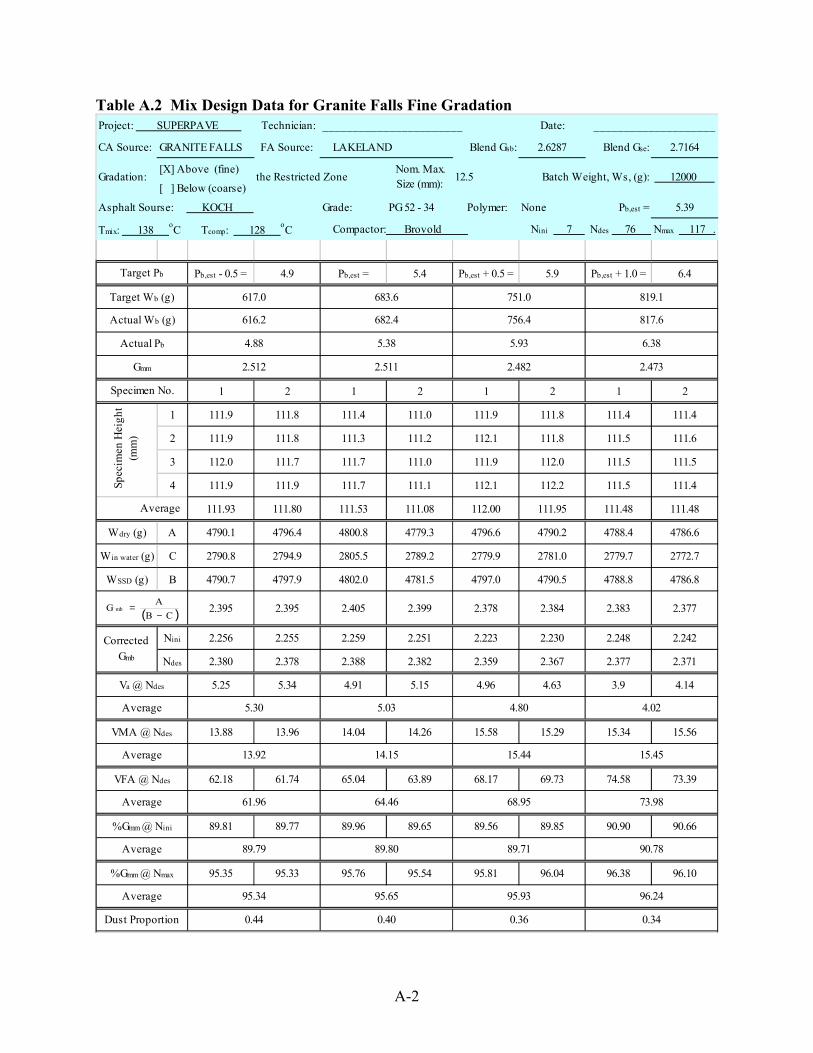
Table A.2 Mix Design Data for Granite Falls Fine Gradation Project: SUPERPAVE Technician: _______________________ Date: ____________________
CA Source: GRANITE FALLS FA Source: LAKELAND Blend Gsb: 2.6287 Blend Gse: 2.7164
[X] Above (fine)
[ ] Below (coarse)
Asphalt Sourse: KOCH Grade: PG 52 - 34 Polymer: None Pb,est = 5.39
Tmix: 138 oC Tcomp: 128 oC Compactor: Brovold Nini 7 Ndes 76 Nmax 117 .
Pb,est - 0.5 = 4.9 Pb,est = 5.4 Pb,est + 0.5 = 5.9 Pb,est + 1.0 = 6.4
1 2 1 2 1 2 1 2
1 111.9 111.8 111.4 111.0 111.9 111.8 111.4 111.4
2 111.9 111.8 111.3 111.2 112.1 111.8 111.5 111.6
3 112.0 111.7 111.7 111.0 111.9 112.0 111.5 111.5
4 111.9 111.9 111.7 111.1 112.1 112.2 111.5 111.4
111.93 111.80 111.53 111.08 112.00 111.95 111.48 111.48
Wdry (g) A 4790.1 4796.4 4800.8 4779.3 4796.6 4790.2 4788.4 4786.6
Win water (g) C 2790.8 2794.9 2805.5 2789.2 2779.9 2781.0 2779.7 2772.7
WSSD (g) B 4790.7 4797.9 4802.0 4781.5 4797.0 4790.5 4788.8 4786.8
2.395 2.395 2.405 2.399 2.378 2.384 2.383 2.377
Nini 2.256 2.255 2.259 2.251 2.223 2.230 2.248 2.242
Ndes 2.380 2.378 2.388 2.382 2.359 2.367 2.377 2.371
5.25 5.34 4.91 5.15 4.96 4.63 3.9 4.14
13.88 13.96 14.04 14.26 15.58 15.29 15.34 15.56
62.18 61.74 65.04 63.89 68.17 69.73 74.58 73.39
89.81 89.77 89.96 89.65 89.56 89.85 90.90 90.66
95.35 95.33 95.76 95.54 95.81 96.04 96.38 96.10
61.96 64.46 68.95 73.98
13.92 14.15 15.44 15.45
5.30 5.03 4.80 4.02
819.1
817.6
2.473
Gradation: 12.5 12000 the Restricted Zone Nom. Max. Size (mm):
6.38
Batch Weight, Ws, (g):
Corrected Gmb
Spec
imen
Hei
ght
(mm
)
Target Pb
Target Wb (g)
Actual Wb (g)
Gmm
Va @ Ndes
Average
VMA @ Ndes
751.0
756.4
2.482
4.88 5.38 5.93
Specimen No.
%Gmm @ Nini
%Gmm @ Nmax
Average
Average
Average
VFA @ Ndes
Average
Dust Proportion
617.0 683.6
616.2
2.512
682.4
2.511
Average
Actual Pb
89.79 89.80 89.71 90.78
95.34 95.65 95.93 96.24
0.44 0.40 0.36 0.34
( )CBA
G mb−
=
A-2
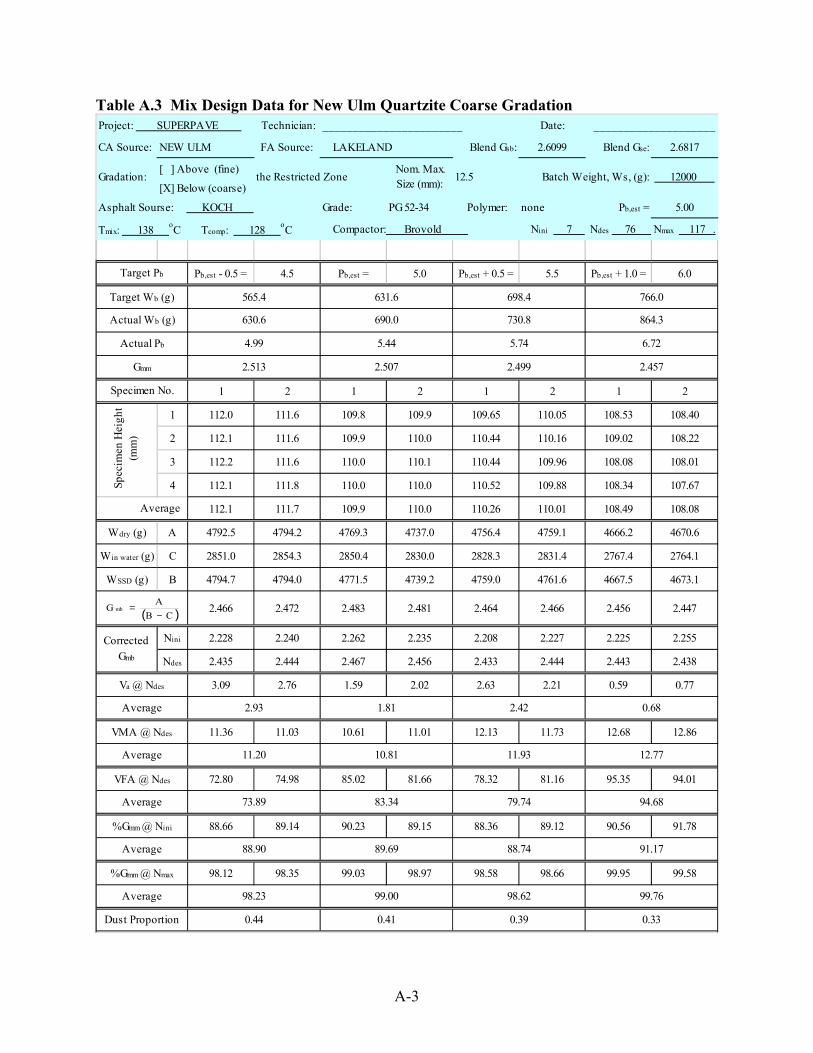
Table A.3 Mix Design Data for New Ulm Quartzite Coarse Gradation Project: SUPERPAVE Technician: _______________________ Date: ____________________
CA Source: NEW ULM FA Source: LAKELAND Blend Gsb: 2.6099 Blend Gse: 2.6817
[ ] Above (fine)
[X] Below (coarse)
Asphalt Sourse: KOCH Grade: PG 52-34 Polymer: none Pb,est = 5.00
Tmix: 138 oC Tcomp: 128 oC Compactor: Brovold Nini 7 Ndes 76 Nmax 117 .
Pb,est - 0.5 = 4.5 Pb,est = 5.0 Pb,est + 0.5 = 5.5 Pb,est + 1.0 = 6.0
1 2 1 2 1 2 1 2
1 112.0 111.6 109.8 109.9 109.65 110.05 108.53 108.40
2 112.1 111.6 109.9 110.0 110.44 110.16 109.02 108.22
3 112.2 111.6 110.0 110.1 110.44 109.96 108.08 108.01
4 112.1 111.8 110.0 110.0 110.52 109.88 108.34 107.67
112.1 111.7 109.9 110.0 110.26 110.01 108.49 108.08
Wdry (g) A 4792.5 4794.2 4769.3 4737.0 4756.4 4759.1 4666.2 4670.6
Win water (g) C 2851.0 2854.3 2850.4 2830.0 2828.3 2831.4 2767.4 2764.1
WSSD (g) B 4794.7 4794.0 4771.5 4739.2 4759.0 4761.6 4667.5 4673.1
2.466 2.472 2.483 2.481 2.464 2.466 2.456 2.447
Nini 2.228 2.240 2.262 2.235 2.208 2.227 2.225 2.255
Ndes 2.435 2.444 2.467 2.456 2.433 2.444 2.443 2.438
3.09 2.76 1.59 2.02 2.63 2.21 0.59 0.77
11.36 11.03 10.61 11.01 12.13 11.73 12.68 12.86
72.80 74.98 85.02 81.66 78.32 81.16 95.35 94.01
88.66 89.14 90.23 89.15 88.36 89.12 90.56 91.78
98.12 98.35 99.03 98.97 98.58 98.66 99.95 99.58
0.41 0.39 0.33
631.6 698.4 766.0
5.44 5.74 6.72
1.81
89.69 88.74 91.17
98.23 99.00 98.62 99.76
88.90
Dust Proportion
565.4
630.6
2.513
Average
Actual Pb
0.44
11.20
%Gmm @ Nmax
Average
Average
%Gmm @ Nini
Average
Va @ Ndes
Average
VMA @ Ndes
VFA @ Ndes
Average
730.8
2.499
4.99
690.0
2.507
Actual Wb (g)
Gmm
Specimen No.
Corrected Gmb
Spec
imen
Hei
ght
(mm
)
864.3
2.457
Gradation: 12.5 12000 the Restricted Zone Nom. Max. Size (mm): Batch Weight, Ws, (g):
Target Pb
Target Wb (g)
2.93 2.42 0.68
10.81 11.93 12.77
73.89 83.34 79.74 94.68
( )CBA
G mb−
=
A-3
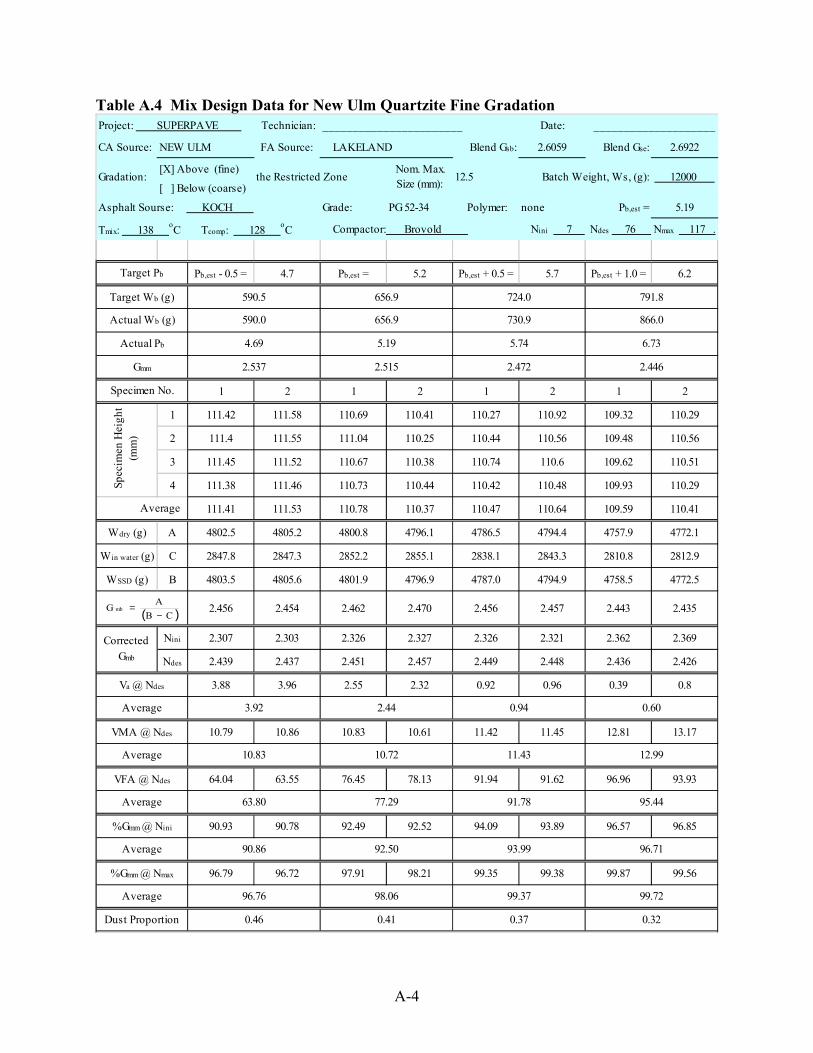
Table A.4 Mix Design Data for New Ulm Quartzite Fine Gradation Project: SUPERPAVE Technician: _______________________ Date: ____________________
CA Source: NEW ULM FA Source: LAKELAND Blend Gsb: 2.6059 Blend Gse: 2.6922
[X] Above (fine)
[ ] Below (coarse)
Asphalt Sourse: KOCH Grade: PG 52-34 Polymer: none Pb,est = 5.19
Tmix: 138 oC Tcomp: 128 oC Compactor: Brovold Nini 7 Ndes 76 Nmax 117 .
Pb,est - 0.5 = 4.7 Pb,est = 5.2 Pb,est + 0.5 = 5.7 Pb,est + 1.0 = 6.2
1 2 1 2 1 2 1 2
1 111.42 111.58 110.69 110.41 110.27 110.92 109.32 110.29
2 111.4 111.55 111.04 110.25 110.44 110.56 109.48 110.56
3 111.45 111.52 110.67 110.38 110.74 110.6 109.62 110.51
4 111.38 111.46 110.73 110.44 110.42 110.48 109.93 110.29
111.41 111.53 110.78 110.37 110.47 110.64 109.59 110.41
Wdry (g) A 4802.5 4805.2 4800.8 4796.1 4786.5 4794.4 4757.9 4772.1
Win water (g) C 2847.8 2847.3 2852.2 2855.1 2838.1 2843.3 2810.8 2812.9
WSSD (g) B 4803.5 4805.6 4801.9 4796.9 4787.0 4794.9 4758.5 4772.5
2.456 2.454 2.462 2.470 2.456 2.457 2.443 2.435
Nini 2.307 2.303 2.326 2.327 2.326 2.321 2.362 2.369
Ndes 2.439 2.437 2.451 2.457 2.449 2.448 2.436 2.426
3.88 3.96 2.55 2.32 0.92 0.96 0.39 0.8
10.79 10.86 10.83 10.61 11.42 11.45 12.81 13.17
64.04 63.55 76.45 78.13 91.94 91.62 96.96 93.93
90.93 90.78 92.49 92.52 94.09 93.89 96.57 96.85
96.79 96.72 97.91 98.21 99.35 99.38 99.87 99.56
63.80 77.29 91.78 95.44
3.92 0.94 0.60
10.72 11.43 12.99
866.0
2.446
Gradation: 12.5 12000 the Restricted Zone Nom. Max. Size (mm): Batch Weight, Ws, (g):
Target Pb
Target Wb (g)
Actual Wb (g)
Gmm
Specimen No.
Corrected Gmb
Spec
imen
Hei
ght
(mm
)
730.9
2.472
4.69
656.9
2.515
Average
%Gmm @ Nini
Average
Va @ Ndes
Average
VMA @ Ndes
VFA @ Ndes
Average
Dust Proportion
590.5
590.0
2.537
Average
Actual Pb
0.46
10.83
%Gmm @ Nmax
Average
92.50 93.99 96.71
96.76 98.06 99.37 99.72
90.86
0.41 0.37 0.32
656.9 724.0 791.8
5.19 5.74 6.73
2.44
( )CBA
G mb−
=
A-4
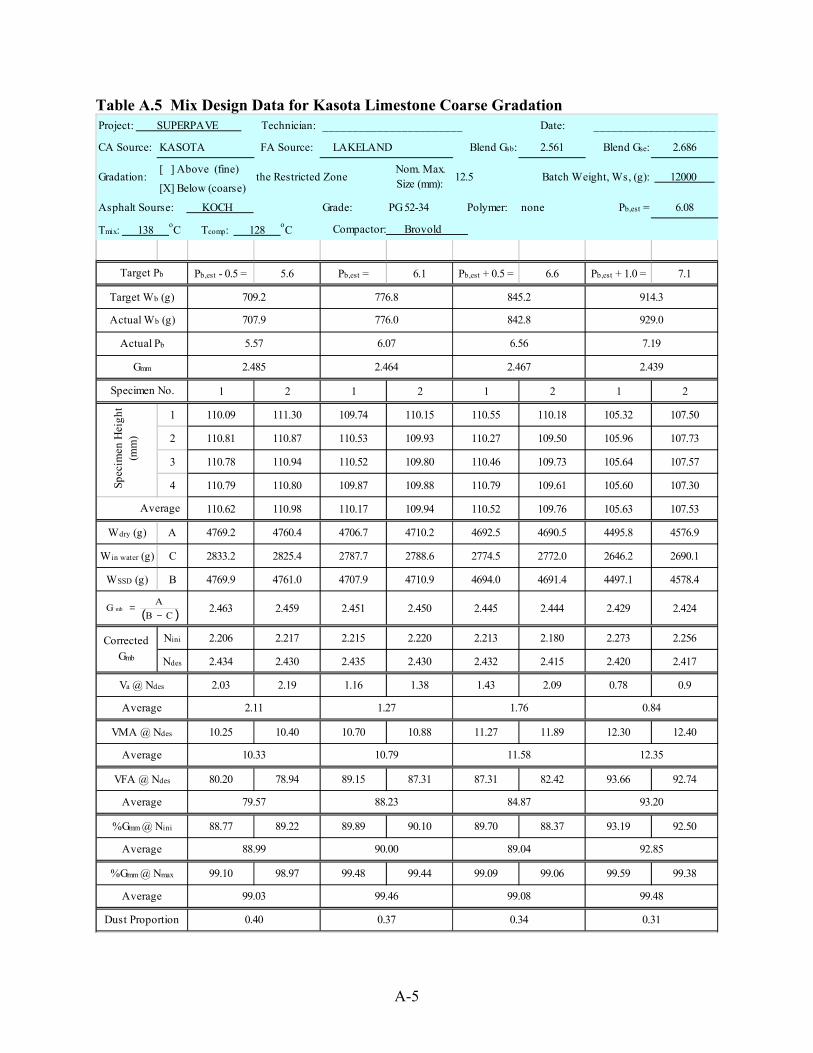
Table A.5 Mix Design Data for Kasota Limestone Coarse Gradation Project: SUPERPAVE Technician: _______________________ Date: ____________________
CA Source: KASOTA FA Source: LAKELAND Blend Gsb: 2.561 Blend Gse: 2.686
[ ] Above (fine)
[X] Below (coarse)
Asphalt Sourse: KOCH Grade: PG 52-34 Polymer: none Pb,est = 6.08
Tmix: 138 oC Tcomp: 128 oC Compactor: Brovold
Pb,est - 0.5 = 5.6 Pb,est = 6.1 Pb,est + 0.5 = 6.6 Pb,est + 1.0 = 7.1
1 2 1 2 1 2 1 2
1 110.09 111.30 109.74 110.15 110.55 110.18 105.32 107.50
2 110.81 110.87 110.53 109.93 110.27 109.50 105.96 107.73
3 110.78 110.94 110.52 109.80 110.46 109.73 105.64 107.57
4 110.79 110.80 109.87 109.88 110.79 109.61 105.60 107.30
110.62 110.98 110.17 109.94 110.52 109.76 105.63 107.53
Wdry (g) A 4769.2 4760.4 4706.7 4710.2 4692.5 4690.5 4495.8 4576.9
Win water (g) C 2833.2 2825.4 2787.7 2788.6 2774.5 2772.0 2646.2 2690.1
WSSD (g) B 4769.9 4761.0 4707.9 4710.9 4694.0 4691.4 4497.1 4578.4
2.463 2.459 2.451 2.450 2.445 2.444 2.429 2.424
Nini 2.206 2.217 2.215 2.220 2.213 2.180 2.273 2.256
Ndes 2.434 2.430 2.435 2.430 2.432 2.415 2.420 2.417
2.03 2.19 1.16 1.38 1.43 2.09 0.78 0.9
10.25 10.40 10.70 10.88 11.27 11.89 12.30 12.40
80.20 78.94 89.15 87.31 87.31 82.42 93.66 92.74
88.77 89.22 89.89 90.10 89.70 88.37 93.19 92.50
99.10 98.97 99.48 99.44 99.09 99.06 99.59 99.38
0.37 0.34 0.31
776.8 845.2 914.3
6.07 6.56 7.19
1.27
90.00 89.04 92.85
99.03 99.46 99.08 99.48
88.99
Dust Proportion
709.2
707.9
2.485
Average
Actual Pb
0.40
10.33
%Gmm @ Nmax
Average
Average
%Gmm @ Nini
Average
Va @ Ndes
Average
VMA @ Ndes
VFA @ Ndes
Average
842.8
2.467
5.57
776.0
2.464
Actual Wb (g)
Gmm
Specimen No.
Corrected Gmb
Spec
imen
Hei
ght
(mm
)
929.0
2.439
Gradation: 12.5 12000 the Restricted Zone Nom. Max. Size (mm): Batch Weight, Ws, (g):
Target Pb
Target Wb (g)
2.11 1.76 0.84
10.79 11.58 12.35
79.57 88.23 84.87 93.20
( )CBA
G mb−
=
A-5
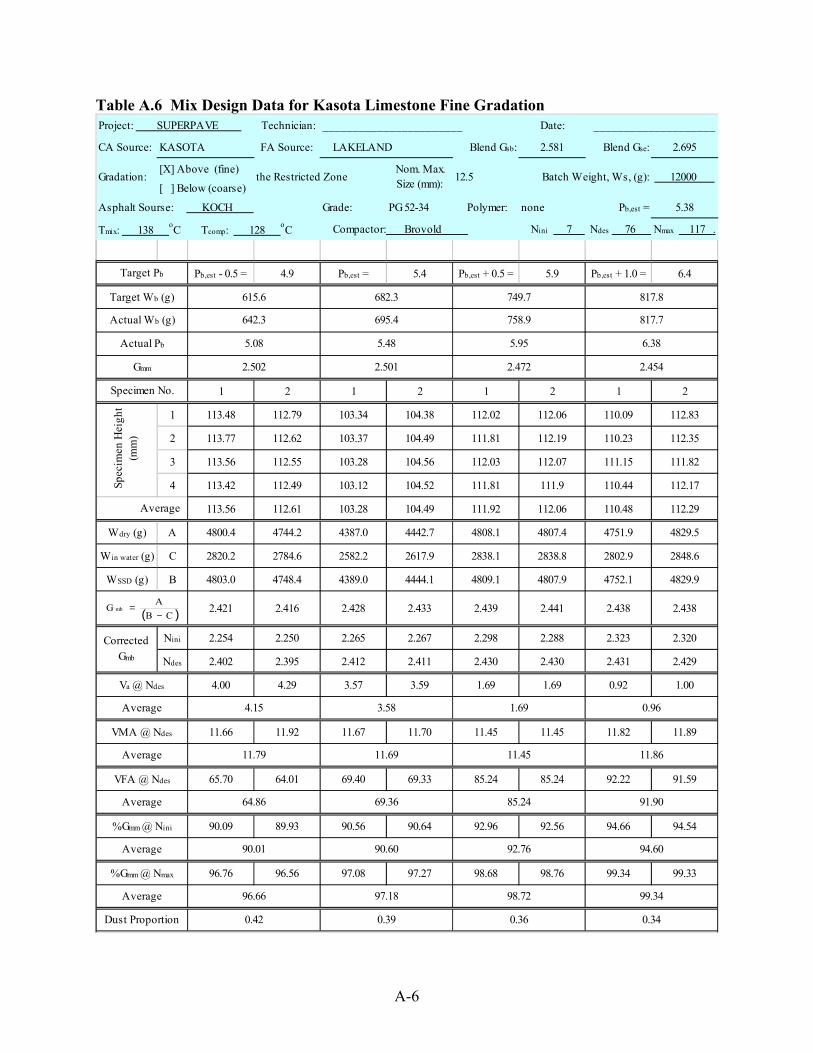
Table A.6 Mix Design Data for Kasota Limestone Fine Gradation Project: SUPERPAVE Technician: _______________________ Date: ____________________
CA Source: KASOTA FA Source: LAKELAND Blend Gsb: 2.581 Blend Gse: 2.695
[X] Above (fine)
[ ] Below (coarse)
Asphalt Sourse: KOCH Grade: PG 52-34 Polymer: none Pb,est = 5.38
Tmix: 138 oC Tcomp: 128 oC Compactor: Brovold Nini 7 Ndes 76 Nmax 117 .
Pb,est - 0.5 = 4.9 Pb,est = 5.4 Pb,est + 0.5 = 5.9 Pb,est + 1.0 = 6.4
1 2 1 2 1 2 1 2
1 113.48 112.79 103.34 104.38 112.02 112.06 110.09 112.83
2 113.77 112.62 103.37 104.49 111.81 112.19 110.23 112.35
3 113.56 112.55 103.28 104.56 112.03 112.07 111.15 111.82
4 113.42 112.49 103.12 104.52 111.81 111.9 110.44 112.17
113.56 112.61 103.28 104.49 111.92 112.06 110.48 112.29
Wdry (g) A 4800.4 4744.2 4387.0 4442.7 4808.1 4807.4 4751.9 4829.5
Win water (g) C 2820.2 2784.6 2582.2 2617.9 2838.1 2838.8 2802.9 2848.6
WSSD (g) B 4803.0 4748.4 4389.0 4444.1 4809.1 4807.9 4752.1 4829.9
2.421 2.416 2.428 2.433 2.439 2.441 2.438 2.438
Nini 2.254 2.250 2.265 2.267 2.298 2.288 2.323 2.320
Ndes 2.402 2.395 2.412 2.411 2.430 2.430 2.431 2.429
4.00 4.29 3.57 3.59 1.69 1.69 0.92 1.00
11.66 11.92 11.67 11.70 11.45 11.45 11.82 11.89
65.70 64.01 69.40 69.33 85.24 85.24 92.22 91.59
90.09 89.93 90.56 90.64 92.96 92.56 94.66 94.54
96.76 96.56 97.08 97.27 98.68 98.76 99.34 99.33
64.86 69.36 85.24 91.90
4.15 1.69 0.96
11.69 11.45 11.86
817.7
2.454
Gradation: 12.5 12000 the Restricted Zone Nom. Max. Size (mm): Batch Weight, Ws, (g):
Target Pb
Target Wb (g)
Actual Wb (g)
Gmm
Specimen No.
Corrected Gmb
Spec
imen
Hei
ght
(mm
)
758.9
2.472
5.08
695.4
2.501
Average
%Gmm @ Nini
Average
Va @ Ndes
Average
VMA @ Ndes
VFA @ Ndes
Average
Dust Proportion
615.6
642.3
2.502
Average
Actual Pb
0.42
11.79
%Gmm @ Nmax
Average
90.60 92.76 94.60
96.66 97.18 98.72 99.34
90.01
0.39 0.36 0.34
682.3 749.7 817.8
5.48 5.95 6.38
3.58
( )CBA
G mb−
=
A-6
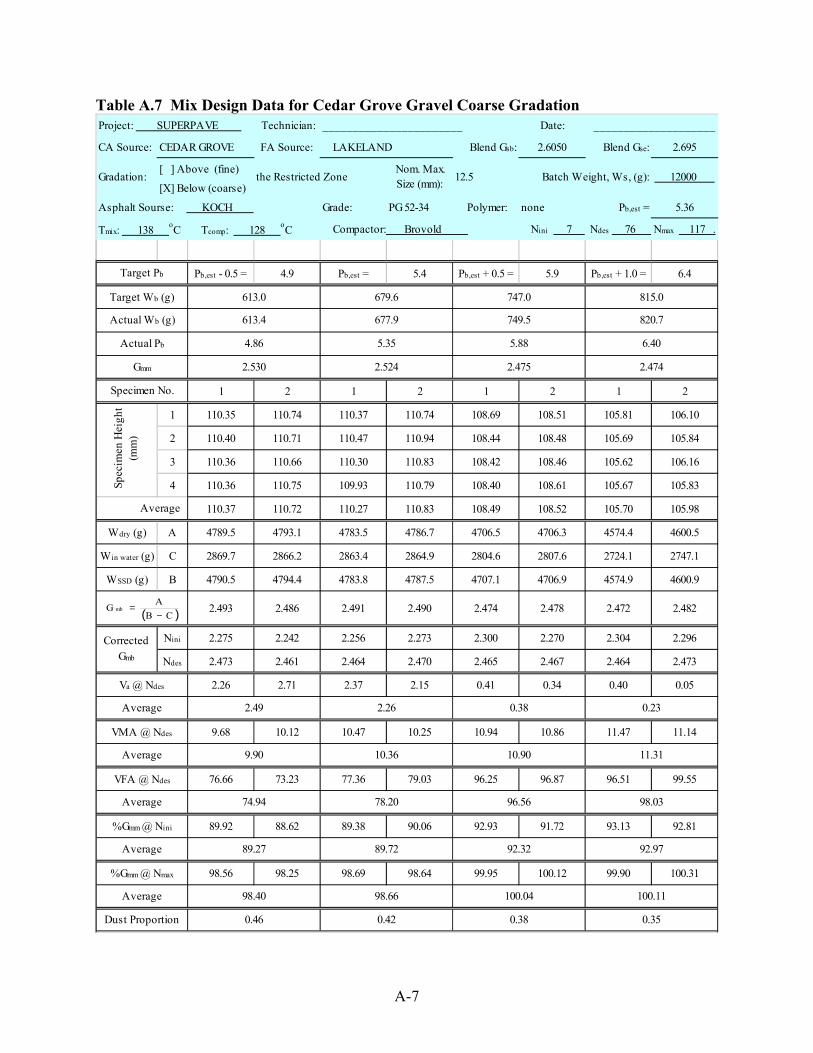
Table A.7 Mix Design Data for Cedar Grove Gravel Coarse Gradation Project: SUPERPAVE Technician: _______________________ Date: ____________________
CA Source: CEDAR GROVE FA Source: LAKELAND Blend Gsb: 2.6050 Blend Gse: 2.695
[ ] Above (fine)
[X] Below (coarse)
Asphalt Sourse: KOCH Grade: PG 52-34 Polymer: none Pb,est = 5.36
Tmix: 138 oC Tcomp: 128 oC Compactor: Brovold Nini 7 Ndes 76 Nmax 117 .
Pb,est - 0.5 = 4.9 Pb,est = 5.4 Pb,est + 0.5 = 5.9 Pb,est + 1.0 = 6.4
1 2 1 2 1 2 1 2
1 110.35 110.74 110.37 110.74 108.69 108.51 105.81 106.10
2 110.40 110.71 110.47 110.94 108.44 108.48 105.69 105.84
3 110.36 110.66 110.30 110.83 108.42 108.46 105.62 106.16
4 110.36 110.75 109.93 110.79 108.40 108.61 105.67 105.83
110.37 110.72 110.27 110.83 108.49 108.52 105.70 105.98
Wdry (g) A 4789.5 4793.1 4783.5 4786.7 4706.5 4706.3 4574.4 4600.5
Win water (g) C 2869.7 2866.2 2863.4 2864.9 2804.6 2807.6 2724.1 2747.1
WSSD (g) B 4790.5 4794.4 4783.8 4787.5 4707.1 4706.9 4574.9 4600.9
2.493 2.486 2.491 2.490 2.474 2.478 2.472 2.482
Nini 2.275 2.242 2.256 2.273 2.300 2.270 2.304 2.296
Ndes 2.473 2.461 2.464 2.470 2.465 2.467 2.464 2.473
2.26 2.71 2.37 2.15 0.41 0.34 0.40 0.05
9.68 10.12 10.47 10.25 10.94 10.86 11.47 11.14
76.66 73.23 77.36 79.03 96.25 96.87 96.51 99.55
89.92 88.62 89.38 90.06 92.93 91.72 93.13 92.81
98.56 98.25 98.69 98.64 99.95 100.12 99.90 100.31
74.94 78.20 96.56 98.03
2.49 0.38 0.23
10.36 10.90 11.31
820.7
2.474
Gradation: 12.5 12000 the Restricted Zone Nom. Max. Size (mm): Batch Weight, Ws, (g):
Target Pb
Target Wb (g)
Actual Wb (g)
Gmm
Specimen No.
Corrected Gmb
Spec
imen
Hei
ght
(mm
)
749.5
2.475
4.86
677.9
2.524
Average
%Gmm @ Nini
Average
Va @ Ndes
Average
VMA @ Ndes
VFA @ Ndes
Average
Dust Proportion
613.0
613.4
2.530
Average
Actual Pb
0.46
9.90
%Gmm @ Nmax
Average
89.72 92.32 92.97
98.40 98.66 100.04 100.11
89.27
0.42 0.38 0.35
679.6 747.0 815.0
5.35 5.88 6.40
2.26
( )CBA
G mb−
=
A-7
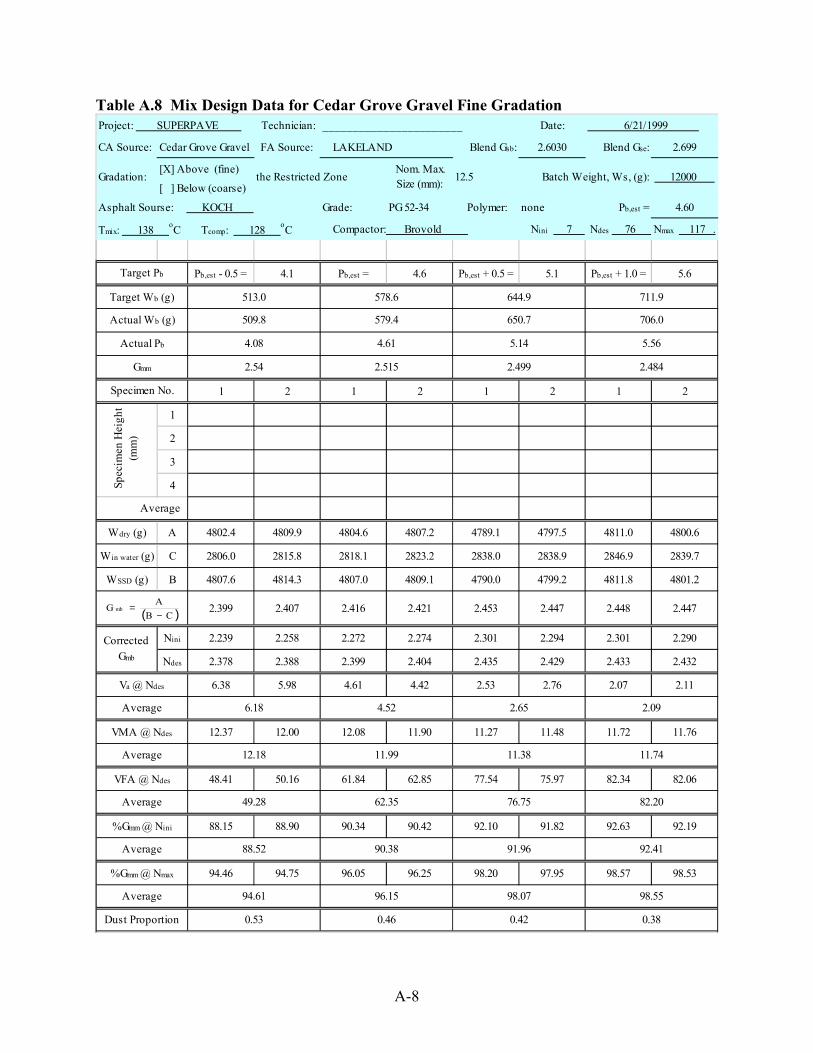
Table A.8 Mix Design Data for Cedar Grove Gravel Fine Gradation Project: SUPERPAVE Technician: _______________________ Date: 6/21/1999
CA Source: Cedar Grove Gravel FA Source: LAKELAND Blend Gsb: 2.6030 Blend Gse: 2.699
[X] Above (fine)
[ ] Below (coarse)
Asphalt Sourse: KOCH Grade: PG 52-34 Polymer: none Pb,est = 4.60
Tmix: 138 oC Tcomp: 128 oC Compactor: Brovold Nini 7 Ndes 76 Nmax 117 .
Pb,est - 0.5 = 4.1 Pb,est = 4.6 Pb,est + 0.5 = 5.1 Pb,est + 1.0 = 5.6
1 2 1 2 1 2 1 2
1
2
3
4
Wdry (g) A 4802.4 4809.9 4804.6 4807.2 4789.1 4797.5 4811.0 4800.6
Win water (g) C 2806.0 2815.8 2818.1 2823.2 2838.0 2838.9 2846.9 2839.7
WSSD (g) B 4807.6 4814.3 4807.0 4809.1 4790.0 4799.2 4811.8 4801.2
2.399 2.407 2.416 2.421 2.453 2.447 2.448 2.447
Nini 2.239 2.258 2.272 2.274 2.301 2.294 2.301 2.290
Ndes 2.378 2.388 2.399 2.404 2.435 2.429 2.433 2.432
6.38 5.98 4.61 4.42 2.53 2.76 2.07 2.11
12.37 12.00 12.08 11.90 11.27 11.48 11.72 11.76
48.41 50.16 61.84 62.85 77.54 75.97 82.34 82.06
88.15 88.90 90.34 90.42 92.10 91.82 92.63 92.19
94.46 94.75 96.05 96.25 98.20 97.95 98.57 98.53
49.28 62.35 76.75 82.20
6.18 2.65 2.09
11.99 11.38 11.74
706.0
2.484
Gradation: 12.5 12000 the Restricted Zone Nom. Max. Size (mm): Batch Weight, Ws, (g):
Target Pb
Target Wb (g)
Actual Wb (g)
Gmm
Specimen No.
Corrected Gmb
Spec
imen
Hei
ght
(mm
)
650.7
2.499
4.08
579.4
2.515
Average
%Gmm @ Nini
Average
Va @ Ndes
Average
VMA @ Ndes
VFA @ Ndes
Average
Dust Proportion
513.0
509.8
2.54
Average
Actual Pb
0.53
12.18
%Gmm @ Nmax
Average
90.38 91.96 92.41
94.61 96.15 98.07 98.55
88.52
0.46 0.42 0.38
578.6 644.9 711.9
4.61 5.14 5.56
4.52
( )CBA
G mb−
=
A-8

Table A.9 Mix Design Data for New Ulm Quartzite Fine Gradation (PG 58-40) Project: SUPERPAVE Technician: _______________________ Date: 6/21/1999
CA Source: New Ulm Quartzite FA Source: LAKELAND Blend Gsb: 2.6060 Blend Gse: 2.6922
[X] Above (fine)
[ ] Below (coarse)
Asphalt Sourse: KOCH Grade: PG 58-40 Polymer: yes Pb,est = 4.60
Tmix: 145 oC Tcomp: 135 oC Compactor: Brovold Nini 7 Ndes 76 Nmax 117 .
Pb,est - 0.5 = 4.1 Pb,est = 4.6 Pb,est + 0.5 = 5.1 Pb,est + 1.0 = 5.6
1 2 1 2 1 2 1 2
1 113.67 113.42 112.97 112.93 111.87 111.78 111.16 111.35
2 113.66 113.55 112.93 112.97 111.66 111.92 111.01 111.04
3 113.87 113.59 112.84 112.76 111.79 111.70 111.11 111.06
4 113.94 113.75 113.22 112.83 111.78 111.75 111.16 111.17
113.79 113.58 112.99 112.87 111.78 111.79 111.11 111.16
Wdry (g) A 4808.5 4799.0 4805.6 4800.2 4799.2 4820.5 4789.5 4793.7
Win water (g) C 2825.3 2819.6 2830.7 2829.3 2843.1 2863.3 2839.1 2842.9
WSSD (g) B 4817.7 4807.3 4810.2 4805.7 4802.3 4823.7 4791.6 4796.8
2.413 2.414 2.428 2.429 2.450 2.459 2.453 2.453
Nini 2.272 2.269 2.284 2.286 2.308 2.321 2.329 2.331
Ndes 2.398 2.399 2.411 2.412 2.432 2.444 2.446 2.446
5.1 5.06 3.53 3.49 2.82 2.37 1.40 1.40
11.74 11.71 11.77 11.74 11.42 10.98 11.40 11.40
56.57 56.77 70.02 70.26 75.31 78.42 87.72 87.72
89.91 89.79 91.40 91.48 92.21 92.73 93.87 93.95
95.51 95.54 97.15 97.19 97.87 98.24 98.87 98.89
56.67 70.14 76.87 87.72
5.08 2.60 1.40
11.76 11.20 11.40
712.3
2.481
Gradation: 12.5 12000 the Restricted Zone Nom. Max. Size (mm): Batch Weight, Ws, (g):
Target Pb
Target Wb (g)
Actual Wb (g)
Gmm
Specimen No.
Corrected Gmb
Spec
imen
Hei
ght
(mm
)
642.8
2.503
4.09
583.6
2.499
Average
%Gmm @ Nini
Average
Va @ Ndes
Average
VMA @ Ndes
VFA @ Ndes
Average
Dust Proportion
513.0
511.4
2.527
Average
Actual Pb
0.52
11.72
%Gmm @ Nmax
Average
91.44 92.47 93.91
95.52 97.17 98.05 98.88
89.85
0.46 0.42 0.38
578.6 644.9 711.9
4.64 5.08 5.60
3.51
( )CBA
G mb−
=
A-9
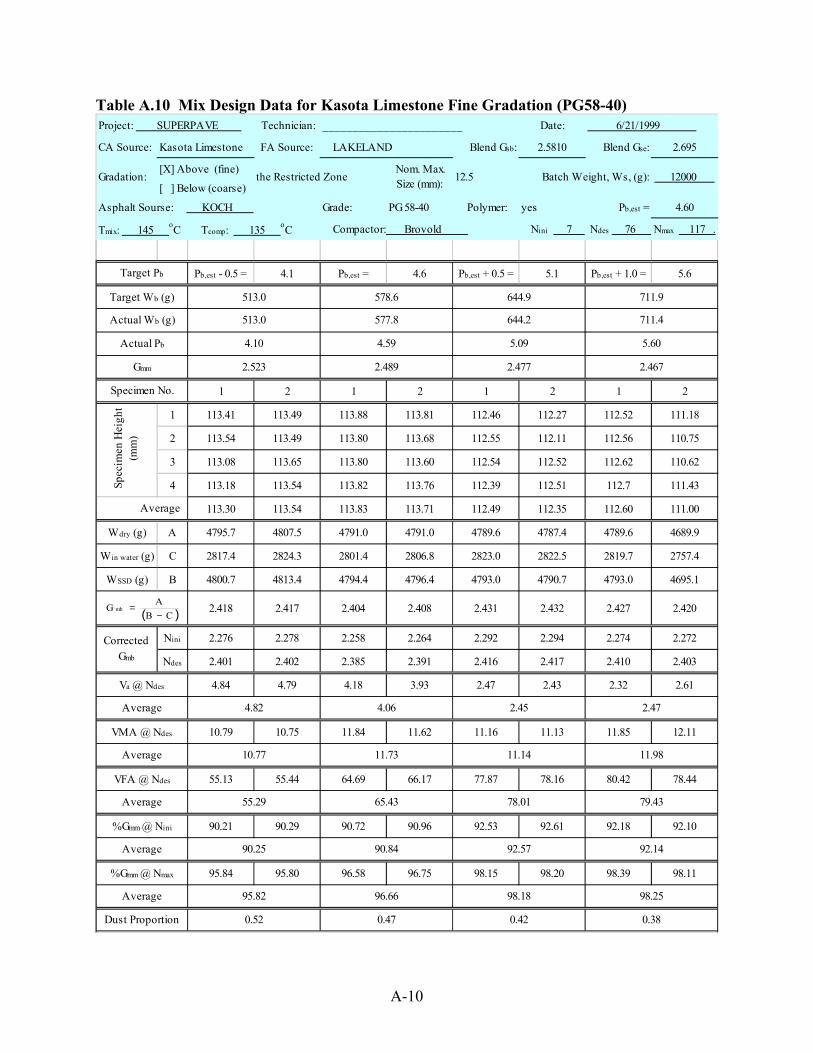
A-10
Table A.10 Mix Design Data for Kasota Limestone Fine Gradation (PG58-40) Project: SUPERPAVE Technician: _______________________ Date: 6/21/1999
CA Source: Kasota Limestone FA Source: LAKELAND Blend Gsb: 2.5810 Blend Gse: 2.695
[X] Above (fine)
[ ] Below (coarse)
Asphalt Sourse: KOCH Grade: PG 58-40 Polymer: yes Pb,est = 4.60
Tmix: 145 oC Tcomp: 135 oC Compactor: Brovold Nini 7 Ndes 76 Nmax 117 .
Pb,est - 0.5 = 4.1 Pb,est = 4.6 Pb,est + 0.5 = 5.1 Pb,est + 1.0 = 5.6
1 2 1 2 1 2 1 2
1 113.41 113.49 113.88 113.81 112.46 112.27 112.52 111.18
2 113.54 113.49 113.80 113.68 112.55 112.11 112.56 110.75
3 113.08 113.65 113.80 113.60 112.54 112.52 112.62 110.62
4 113.18 113.54 113.82 113.76 112.39 112.51 112.7 111.43
113.30 113.54 113.83 113.71 112.49 112.35 112.60 111.00
Wdry (g) A 4795.7 4807.5 4791.0 4791.0 4789.6 4787.4 4789.6 4689.9
Win water (g) C 2817.4 2824.3 2801.4 2806.8 2823.0 2822.5 2819.7 2757.4
WSSD (g) B 4800.7 4813.4 4794.4 4796.4 4793.0 4790.7 4793.0 4695.1
2.418 2.417 2.404 2.408 2.431 2.432 2.427 2.420
Nini 2.276 2.278 2.258 2.264 2.292 2.294 2.274 2.272
Ndes 2.401 2.402 2.385 2.391 2.416 2.417 2.410 2.403
4.84 4.79 4.18 3.93 2.47 2.43 2.32 2.61
10.79 10.75 11.84 11.62 11.16 11.13 11.85 12.11
55.13 55.44 64.69 66.17 77.87 78.16 80.42 78.44
90.21 90.29 90.72 90.96 92.53 92.61 92.18 92.10
95.84 95.80 96.58 96.75 98.15 98.20 98.39 98.11
55.29 65.43 78.01 79.43
4.82 2.45 2.47
11.73 11.14 11.98
711.4
2.467
Gradation: 12.5 12000 the Restricted Zone Nom. Max. Size (mm): Batch Weight, Ws, (g):
Target Pb
Target Wb (g)
Actual Wb (g)
Gmm
Specimen No.
Corrected Gmb
Spec
imen
Hei
ght
(mm
)
644.2
2.477
4.10
577.8
2.489
Average
%Gmm @ Nini
Average
Va @ Ndes
Average
VMA @ Ndes
VFA @ Ndes
Average
Dust Proportion
513.0
513.0
2.523
Average
Actual Pb
0.52
10.77
%Gmm @ Nmax
Average
90.84 92.57 92.14
95.82 96.66 98.18 98.25
90.25
0.47 0.42 0.38
578.6 644.9 711.9
4.59 5.09 5.60
4.06
( )CBA
G mb−
=
APPENDIX B RESILIENT MODULUS DATA
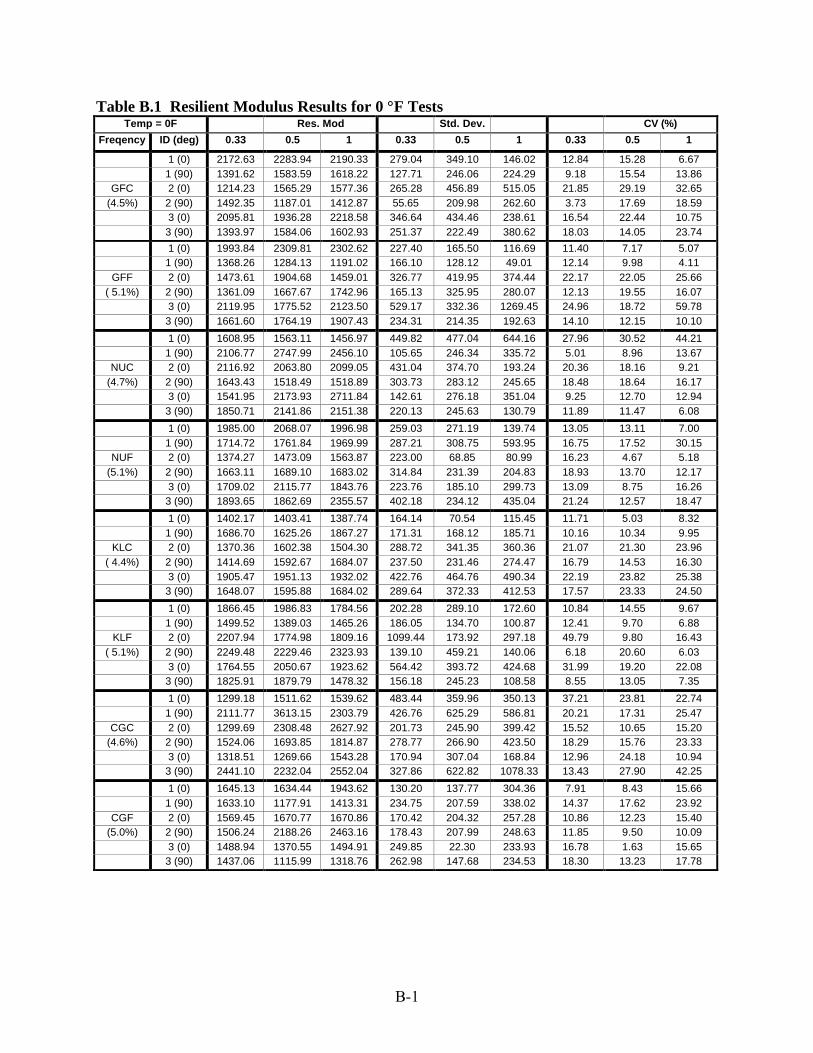
B-1
Table B.1 Resilient Modulus Results for 0 °F Tests Temp = 0F Res. Mod Std. Dev. CV (%)
Freqency ID (deg) 0.33 0.5 1 0.33 0.5 1 0.33 0.5 1
1 (0) 2172.63 2283.94 2190.33 279.04 349.10 146.02 12.84 15.28 6.67 1 (90) 1391.62 1583.59 1618.22 127.71 246.06 224.29 9.18 15.54 13.86
GFC 2 (0) 1214.23 1565.29 1577.36 265.28 456.89 515.05 21.85 29.19 32.65 (4.5%) 2 (90) 1492.35 1187.01 1412.87 55.65 209.98 262.60 3.73 17.69 18.59
3 (0) 2095.81 1936.28 2218.58 346.64 434.46 238.61 16.54 22.44 10.75 3 (90) 1393.97 1584.06 1602.93 251.37 222.49 380.62 18.03 14.05 23.74
1 (0) 1993.84 2309.81 2302.62 227.40 165.50 116.69 11.40 7.17 5.07 1 (90) 1368.26 1284.13 1191.02 166.10 128.12 49.01 12.14 9.98 4.11
GFF 2 (0) 1473.61 1904.68 1459.01 326.77 419.95 374.44 22.17 22.05 25.66 ( 5.1%) 2 (90) 1361.09 1667.67 1742.96 165.13 325.95 280.07 12.13 19.55 16.07
3 (0) 2119.95 1775.52 2123.50 529.17 332.36 1269.45 24.96 18.72 59.78 3 (90) 1661.60 1764.19 1907.43 234.31 214.35 192.63 14.10 12.15 10.10
1 (0) 1608.95 1563.11 1456.97 449.82 477.04 644.16 27.96 30.52 44.21 1 (90) 2106.77 2747.99 2456.10 105.65 246.34 335.72 5.01 8.96 13.67
NUC 2 (0) 2116.92 2063.80 2099.05 431.04 374.70 193.24 20.36 18.16 9.21 (4.7%) 2 (90) 1643.43 1518.49 1518.89 303.73 283.12 245.65 18.48 18.64 16.17
3 (0) 1541.95 2173.93 2711.84 142.61 276.18 351.04 9.25 12.70 12.94 3 (90) 1850.71 2141.86 2151.38 220.13 245.63 130.79 11.89 11.47 6.08
1 (0) 1985.00 2068.07 1996.98 259.03 271.19 139.74 13.05 13.11 7.00 1 (90) 1714.72 1761.84 1969.99 287.21 308.75 593.95 16.75 17.52 30.15
NUF 2 (0) 1374.27 1473.09 1563.87 223.00 68.85 80.99 16.23 4.67 5.18 (5.1%) 2 (90) 1663.11 1689.10 1683.02 314.84 231.39 204.83 18.93 13.70 12.17
3 (0) 1709.02 2115.77 1843.76 223.76 185.10 299.73 13.09 8.75 16.26 3 (90) 1893.65 1862.69 2355.57 402.18 234.12 435.04 21.24 12.57 18.47
1 (0) 1402.17 1403.41 1387.74 164.14 70.54 115.45 11.71 5.03 8.32 1 (90) 1686.70 1625.26 1867.27 171.31 168.12 185.71 10.16 10.34 9.95
KLC 2 (0) 1370.36 1602.38 1504.30 288.72 341.35 360.36 21.07 21.30 23.96 ( 4.4%) 2 (90) 1414.69 1592.67 1684.07 237.50 231.46 274.47 16.79 14.53 16.30
3 (0) 1905.47 1951.13 1932.02 422.76 464.76 490.34 22.19 23.82 25.38 3 (90) 1648.07 1595.88 1684.02 289.64 372.33 412.53 17.57 23.33 24.50
1 (0) 1866.45 1986.83 1784.56 202.28 289.10 172.60 10.84 14.55 9.67 1 (90) 1499.52 1389.03 1465.26 186.05 134.70 100.87 12.41 9.70 6.88
KLF 2 (0) 2207.94 1774.98 1809.16 1099.44 173.92 297.18 49.79 9.80 16.43 ( 5.1%) 2 (90) 2249.48 2229.46 2323.93 139.10 459.21 140.06 6.18 20.60 6.03
3 (0) 1764.55 2050.67 1923.62 564.42 393.72 424.68 31.99 19.20 22.08 3 (90) 1825.91 1879.79 1478.32 156.18 245.23 108.58 8.55 13.05 7.35
1 (0) 1299.18 1511.62 1539.62 483.44 359.96 350.13 37.21 23.81 22.74 1 (90) 2111.77 3613.15 2303.79 426.76 625.29 586.81 20.21 17.31 25.47
CGC 2 (0) 1299.69 2308.48 2627.92 201.73 245.90 399.42 15.52 10.65 15.20 (4.6%) 2 (90) 1524.06 1693.85 1814.87 278.77 266.90 423.50 18.29 15.76 23.33
3 (0) 1318.51 1269.66 1543.28 170.94 307.04 168.84 12.96 24.18 10.94 3 (90) 2441.10 2232.04 2552.04 327.86 622.82 1078.33 13.43 27.90 42.25
1 (0) 1645.13 1634.44 1943.62 130.20 137.77 304.36 7.91 8.43 15.66 1 (90) 1633.10 1177.91 1413.31 234.75 207.59 338.02 14.37 17.62 23.92
CGF 2 (0) 1569.45 1670.77 1670.86 170.42 204.32 257.28 10.86 12.23 15.40 (5.0%) 2 (90) 1506.24 2188.26 2463.16 178.43 207.99 248.63 11.85 9.50 10.09
3 (0) 1488.94 1370.55 1494.91 249.85 22.30 233.93 16.78 1.63 15.65 3 (90) 1437.06 1115.99 1318.76 262.98 147.68 234.53 18.30 13.23 17.78

B-2
Table B.1 Resilient Modulus Results for 0 °F Tests, continued Temp = 0F Res. Mod Std. Dev. CV (%)
Freqency ID (deg) 0.33 0.5 1 0.33 0.5 1 0.33 0.5 1
1 (0) 1859.03 1680.71 1923.09 696.01 228.76 200.71 37.44 13.61 10.44 1 (90) 1723.73 1561.61 1221.76 351.40 521.99 116.91 20.39 33.43 9.57
NUF 2 (0) 1308.80 1177.77 1412.09 104.70 128.39 153.85 8.00 10.90 10.89 (58-40) 2 (90) 1577.23 1553.64 1669.22 97.46 150.10 186.69 6.18 9.66 11.18 (4.9%) 3 (0) 2100.99 2167.08 2196.59 252.89 97.41 282.55 12.04 4.49 12.86
3 (90) 1800.88 1792.76 1842.92 218.50 161.63 148.51 12.13 9.02 8.06
1 (0) 1846.81 1836.68 1926.72 180.38 159.19 229.46 9.77 8.67 11.91 1 (90) 1864.91 2114.13 2103.62 103.07 140.20 86.16 5.53 6.63 4.10
KLF 2 (0) 1830.09 1699.25 1864.09 254.89 177.33 221.06 13.93 10.44 11.86 (58-40) 2 (90) 1941.27 1895.34 1820.74 251.63 176.33 64.18 12.96 9.30 3.52 (4.9%) 3 (0) 1427.18 1116.37 1173.38 358.89 235.26 257.48 25.15 21.07 21.94
3 (90) 1697.17 2005.81 1895.63 247.75 770.66 224.73 14.60 38.42 11.86
Key
Abbreviation Mix Type Binder
GFC Granite Falls granite, coarse gradation, PG 52-34
GFF Granite Falls granite, fine gradation, PG 52-34
NUC New Ulm quartzite, coarse gradation PG 52-34
NUF New Ulm quartzite, fine gradation PG 52-34
KLC Kasota limestone, coarse gradation PG 52-34
KLF Kasota limestone, fine gradation PG 52-34
CGC Cedar Grove gravel, coarse gradation PG 52-34
CGF Cedar Grove gravel, fine gradation PG 52-34
NUF (58-40) New Ulm quartzite, fine gradation PG 58-40
KLF (58-40) Kasota limestone, fine gradation PG 58-40
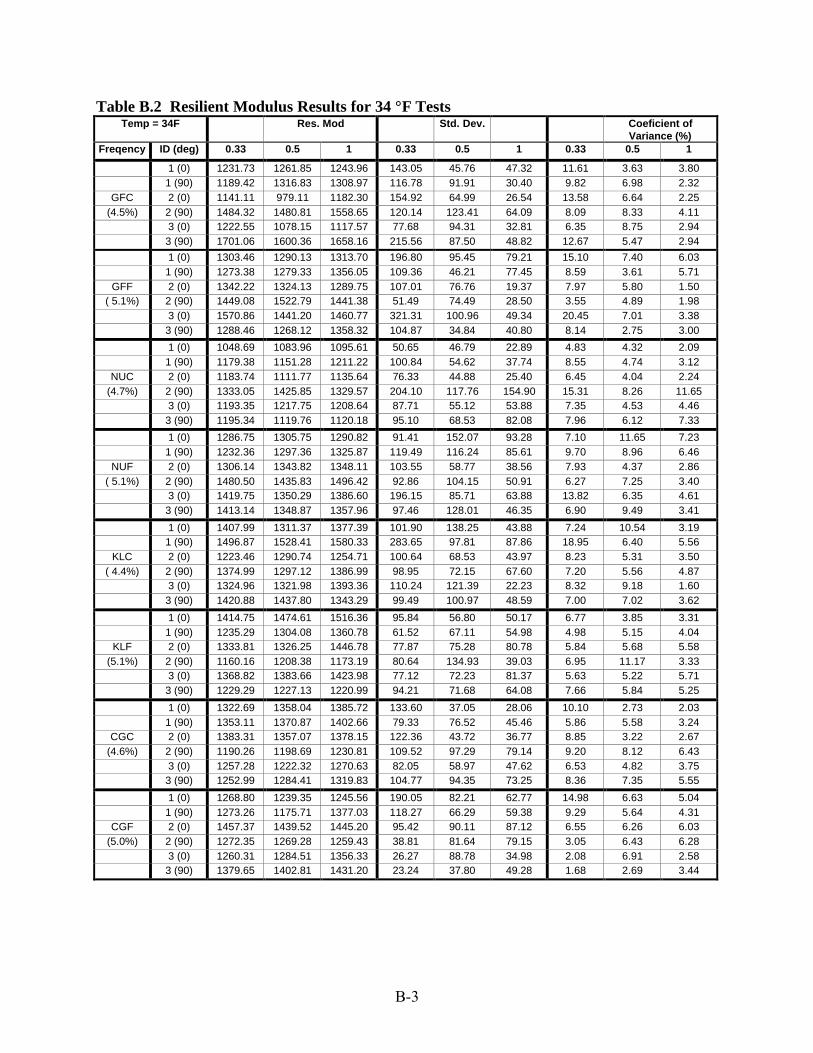
B-3
Table B.2 Resilient Modulus Results for 34 °F Tests Temp = 34F Res. Mod Std. Dev. Coeficient of
Variance (%) Freqency ID (deg) 0.33 0.5 1 0.33 0.5 1 0.33 0.5 1
1 (0) 1231.73 1261.85 1243.96 143.05 45.76 47.32 11.61 3.63 3.80 1 (90) 1189.42 1316.83 1308.97 116.78 91.91 30.40 9.82 6.98 2.32
GFC 2 (0) 1141.11 979.11 1182.30 154.92 64.99 26.54 13.58 6.64 2.25 (4.5%) 2 (90) 1484.32 1480.81 1558.65 120.14 123.41 64.09 8.09 8.33 4.11
3 (0) 1222.55 1078.15 1117.57 77.68 94.31 32.81 6.35 8.75 2.94 3 (90) 1701.06 1600.36 1658.16 215.56 87.50 48.82 12.67 5.47 2.94
1 (0) 1303.46 1290.13 1313.70 196.80 95.45 79.21 15.10 7.40 6.03 1 (90) 1273.38 1279.33 1356.05 109.36 46.21 77.45 8.59 3.61 5.71
GFF 2 (0) 1342.22 1324.13 1289.75 107.01 76.76 19.37 7.97 5.80 1.50 ( 5.1%) 2 (90) 1449.08 1522.79 1441.38 51.49 74.49 28.50 3.55 4.89 1.98
3 (0) 1570.86 1441.20 1460.77 321.31 100.96 49.34 20.45 7.01 3.38 3 (90) 1288.46 1268.12 1358.32 104.87 34.84 40.80 8.14 2.75 3.00
1 (0) 1048.69 1083.96 1095.61 50.65 46.79 22.89 4.83 4.32 2.09 1 (90) 1179.38 1151.28 1211.22 100.84 54.62 37.74 8.55 4.74 3.12
NUC 2 (0) 1183.74 1111.77 1135.64 76.33 44.88 25.40 6.45 4.04 2.24 (4.7%) 2 (90) 1333.05 1425.85 1329.57 204.10 117.76 154.90 15.31 8.26 11.65
3 (0) 1193.35 1217.75 1208.64 87.71 55.12 53.88 7.35 4.53 4.46 3 (90) 1195.34 1119.76 1120.18 95.10 68.53 82.08 7.96 6.12 7.33
1 (0) 1286.75 1305.75 1290.82 91.41 152.07 93.28 7.10 11.65 7.23 1 (90) 1232.36 1297.36 1325.87 119.49 116.24 85.61 9.70 8.96 6.46
NUF 2 (0) 1306.14 1343.82 1348.11 103.55 58.77 38.56 7.93 4.37 2.86 ( 5.1%) 2 (90) 1480.50 1435.83 1496.42 92.86 104.15 50.91 6.27 7.25 3.40
3 (0) 1419.75 1350.29 1386.60 196.15 85.71 63.88 13.82 6.35 4.61 3 (90) 1413.14 1348.87 1357.96 97.46 128.01 46.35 6.90 9.49 3.41
1 (0) 1407.99 1311.37 1377.39 101.90 138.25 43.88 7.24 10.54 3.19 1 (90) 1496.87 1528.41 1580.33 283.65 97.81 87.86 18.95 6.40 5.56
KLC 2 (0) 1223.46 1290.74 1254.71 100.64 68.53 43.97 8.23 5.31 3.50 ( 4.4%) 2 (90) 1374.99 1297.12 1386.99 98.95 72.15 67.60 7.20 5.56 4.87
3 (0) 1324.96 1321.98 1393.36 110.24 121.39 22.23 8.32 9.18 1.60 3 (90) 1420.88 1437.80 1343.29 99.49 100.97 48.59 7.00 7.02 3.62
1 (0) 1414.75 1474.61 1516.36 95.84 56.80 50.17 6.77 3.85 3.31 1 (90) 1235.29 1304.08 1360.78 61.52 67.11 54.98 4.98 5.15 4.04
KLF 2 (0) 1333.81 1326.25 1446.78 77.87 75.28 80.78 5.84 5.68 5.58 (5.1%) 2 (90) 1160.16 1208.38 1173.19 80.64 134.93 39.03 6.95 11.17 3.33
3 (0) 1368.82 1383.66 1423.98 77.12 72.23 81.37 5.63 5.22 5.71 3 (90) 1229.29 1227.13 1220.99 94.21 71.68 64.08 7.66 5.84 5.25
1 (0) 1322.69 1358.04 1385.72 133.60 37.05 28.06 10.10 2.73 2.03 1 (90) 1353.11 1370.87 1402.66 79.33 76.52 45.46 5.86 5.58 3.24
CGC 2 (0) 1383.31 1357.07 1378.15 122.36 43.72 36.77 8.85 3.22 2.67 (4.6%) 2 (90) 1190.26 1198.69 1230.81 109.52 97.29 79.14 9.20 8.12 6.43
3 (0) 1257.28 1222.32 1270.63 82.05 58.97 47.62 6.53 4.82 3.75 3 (90) 1252.99 1284.41 1319.83 104.77 94.35 73.25 8.36 7.35 5.55
1 (0) 1268.80 1239.35 1245.56 190.05 82.21 62.77 14.98 6.63 5.04 1 (90) 1273.26 1175.71 1377.03 118.27 66.29 59.38 9.29 5.64 4.31
CGF 2 (0) 1457.37 1439.52 1445.20 95.42 90.11 87.12 6.55 6.26 6.03 (5.0%) 2 (90) 1272.35 1269.28 1259.43 38.81 81.64 79.15 3.05 6.43 6.28
3 (0) 1260.31 1284.51 1356.33 26.27 88.78 34.98 2.08 6.91 2.58 3 (90) 1379.65 1402.81 1431.20 23.24 37.80 49.28 1.68 2.69 3.44
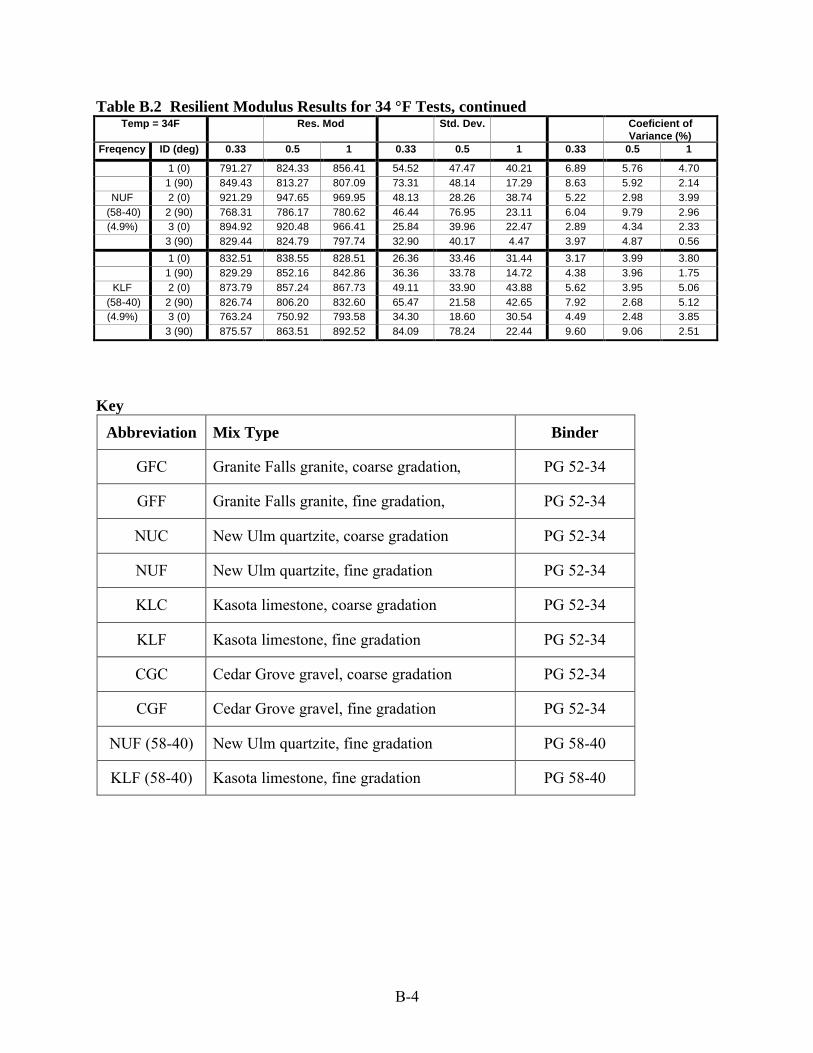
B-4
Table B.2 Resilient Modulus Results for 34 °F Tests, continued Temp = 34F Res. Mod Std. Dev. Coeficient of
Variance (%) Freqency ID (deg) 0.33 0.5 1 0.33 0.5 1 0.33 0.5 1
1 (0) 791.27 824.33 856.41 54.52 47.47 40.21 6.89 5.76 4.70 1 (90) 849.43 813.27 807.09 73.31 48.14 17.29 8.63 5.92 2.14
NUF 2 (0) 921.29 947.65 969.95 48.13 28.26 38.74 5.22 2.98 3.99 (58-40) 2 (90) 768.31 786.17 780.62 46.44 76.95 23.11 6.04 9.79 2.96 (4.9%) 3 (0) 894.92 920.48 966.41 25.84 39.96 22.47 2.89 4.34 2.33
3 (90) 829.44 824.79 797.74 32.90 40.17 4.47 3.97 4.87 0.56
1 (0) 832.51 838.55 828.51 26.36 33.46 31.44 3.17 3.99 3.80 1 (90) 829.29 852.16 842.86 36.36 33.78 14.72 4.38 3.96 1.75
KLF 2 (0) 873.79 857.24 867.73 49.11 33.90 43.88 5.62 3.95 5.06 (58-40) 2 (90) 826.74 806.20 832.60 65.47 21.58 42.65 7.92 2.68 5.12 (4.9%) 3 (0) 763.24 750.92 793.58 34.30 18.60 30.54 4.49 2.48 3.85
3 (90) 875.57 863.51 892.52 84.09 78.24 22.44 9.60 9.06 2.51
Key
Abbreviation Mix Type Binder
GFC Granite Falls granite, coarse gradation, PG 52-34
GFF Granite Falls granite, fine gradation, PG 52-34
NUC New Ulm quartzite, coarse gradation PG 52-34
NUF New Ulm quartzite, fine gradation PG 52-34
KLC Kasota limestone, coarse gradation PG 52-34
KLF Kasota limestone, fine gradation PG 52-34
CGC Cedar Grove gravel, coarse gradation PG 52-34
CGF Cedar Grove gravel, fine gradation PG 52-34
NUF (58-40) New Ulm quartzite, fine gradation PG 58-40
KLF (58-40) Kasota limestone, fine gradation PG 58-40
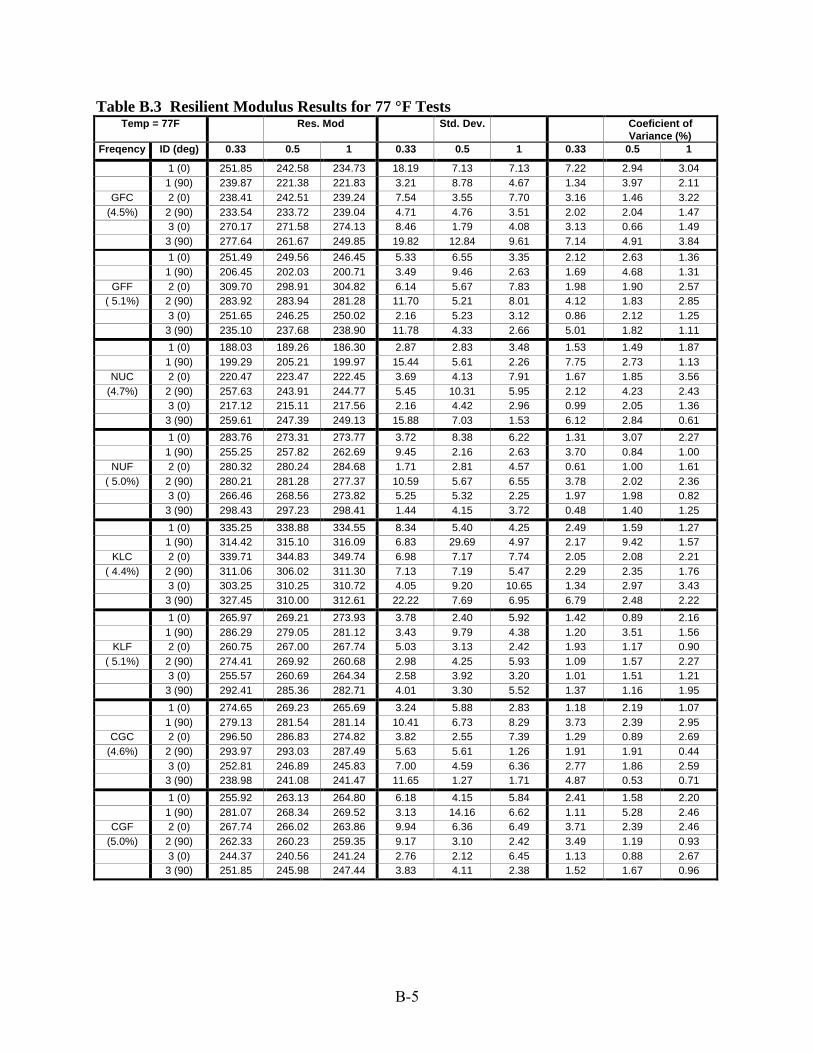
B-5
Table B.3 Resilient Modulus Results for 77 °F Tests Temp = 77F Res. Mod Std. Dev. Coeficient of
Variance (%) Freqency ID (deg) 0.33 0.5 1 0.33 0.5 1 0.33 0.5 1
1 (0) 251.85 242.58 234.73 18.19 7.13 7.13 7.22 2.94 3.04 1 (90) 239.87 221.38 221.83 3.21 8.78 4.67 1.34 3.97 2.11
GFC 2 (0) 238.41 242.51 239.24 7.54 3.55 7.70 3.16 1.46 3.22 (4.5%) 2 (90) 233.54 233.72 239.04 4.71 4.76 3.51 2.02 2.04 1.47
3 (0) 270.17 271.58 274.13 8.46 1.79 4.08 3.13 0.66 1.49 3 (90) 277.64 261.67 249.85 19.82 12.84 9.61 7.14 4.91 3.84
1 (0) 251.49 249.56 246.45 5.33 6.55 3.35 2.12 2.63 1.36 1 (90) 206.45 202.03 200.71 3.49 9.46 2.63 1.69 4.68 1.31
GFF 2 (0) 309.70 298.91 304.82 6.14 5.67 7.83 1.98 1.90 2.57 ( 5.1%) 2 (90) 283.92 283.94 281.28 11.70 5.21 8.01 4.12 1.83 2.85
3 (0) 251.65 246.25 250.02 2.16 5.23 3.12 0.86 2.12 1.25 3 (90) 235.10 237.68 238.90 11.78 4.33 2.66 5.01 1.82 1.11
1 (0) 188.03 189.26 186.30 2.87 2.83 3.48 1.53 1.49 1.87 1 (90) 199.29 205.21 199.97 15.44 5.61 2.26 7.75 2.73 1.13
NUC 2 (0) 220.47 223.47 222.45 3.69 4.13 7.91 1.67 1.85 3.56 (4.7%) 2 (90) 257.63 243.91 244.77 5.45 10.31 5.95 2.12 4.23 2.43
3 (0) 217.12 215.11 217.56 2.16 4.42 2.96 0.99 2.05 1.36 3 (90) 259.61 247.39 249.13 15.88 7.03 1.53 6.12 2.84 0.61
1 (0) 283.76 273.31 273.77 3.72 8.38 6.22 1.31 3.07 2.27 1 (90) 255.25 257.82 262.69 9.45 2.16 2.63 3.70 0.84 1.00
NUF 2 (0) 280.32 280.24 284.68 1.71 2.81 4.57 0.61 1.00 1.61 ( 5.0%) 2 (90) 280.21 281.28 277.37 10.59 5.67 6.55 3.78 2.02 2.36
3 (0) 266.46 268.56 273.82 5.25 5.32 2.25 1.97 1.98 0.82 3 (90) 298.43 297.23 298.41 1.44 4.15 3.72 0.48 1.40 1.25
1 (0) 335.25 338.88 334.55 8.34 5.40 4.25 2.49 1.59 1.27 1 (90) 314.42 315.10 316.09 6.83 29.69 4.97 2.17 9.42 1.57
KLC 2 (0) 339.71 344.83 349.74 6.98 7.17 7.74 2.05 2.08 2.21 ( 4.4%) 2 (90) 311.06 306.02 311.30 7.13 7.19 5.47 2.29 2.35 1.76
3 (0) 303.25 310.25 310.72 4.05 9.20 10.65 1.34 2.97 3.43 3 (90) 327.45 310.00 312.61 22.22 7.69 6.95 6.79 2.48 2.22
1 (0) 265.97 269.21 273.93 3.78 2.40 5.92 1.42 0.89 2.16 1 (90) 286.29 279.05 281.12 3.43 9.79 4.38 1.20 3.51 1.56
KLF 2 (0) 260.75 267.00 267.74 5.03 3.13 2.42 1.93 1.17 0.90 ( 5.1%) 2 (90) 274.41 269.92 260.68 2.98 4.25 5.93 1.09 1.57 2.27
3 (0) 255.57 260.69 264.34 2.58 3.92 3.20 1.01 1.51 1.21 3 (90) 292.41 285.36 282.71 4.01 3.30 5.52 1.37 1.16 1.95
1 (0) 274.65 269.23 265.69 3.24 5.88 2.83 1.18 2.19 1.07 1 (90) 279.13 281.54 281.14 10.41 6.73 8.29 3.73 2.39 2.95
CGC 2 (0) 296.50 286.83 274.82 3.82 2.55 7.39 1.29 0.89 2.69 (4.6%) 2 (90) 293.97 293.03 287.49 5.63 5.61 1.26 1.91 1.91 0.44
3 (0) 252.81 246.89 245.83 7.00 4.59 6.36 2.77 1.86 2.59 3 (90) 238.98 241.08 241.47 11.65 1.27 1.71 4.87 0.53 0.71
1 (0) 255.92 263.13 264.80 6.18 4.15 5.84 2.41 1.58 2.20 1 (90) 281.07 268.34 269.52 3.13 14.16 6.62 1.11 5.28 2.46
CGF 2 (0) 267.74 266.02 263.86 9.94 6.36 6.49 3.71 2.39 2.46 (5.0%) 2 (90) 262.33 260.23 259.35 9.17 3.10 2.42 3.49 1.19 0.93
3 (0) 244.37 240.56 241.24 2.76 2.12 6.45 1.13 0.88 2.67 3 (90) 251.85 245.98 247.44 3.83 4.11 2.38 1.52 1.67 0.96

B-6
Table B.3 Resilient Modulus Results for 77 °F Tests, continued Temp = 77F Res. Mod Std. Dev. Coeficient of
Variance (%) Freqency ID (deg) 0.33 0.5 1 0.33 0.5 1 0.33 0.5 1
1 (0) 158.15 159.38 164.03 2.94 2.32 0.35 1.86 1.45 0.21 1 (90) 166.26 164.04 165.88 1.27 2.94 1.04 0.76 1.79 0.62
NUF 2 (0) 169.20 172.30 169.70 6.21 0.80 1.52 3.67 0.46 0.89 (58-40) 2 (90) 161.25 165.93 164.69 2.87 2.96 2.46 1.78 1.78 1.49 (4.9%) 3 (0) 151.70 155.86 156.40 1.02 0.74 0.78 0.68 0.48 0.50
3 (90) 163.38 164.07 167.23 9.08 3.65 3.18 5.56 2.22 1.90
1 (0) 173.99 175.18 180.01 4.11 4.10 2.24 2.36 2.34 1.24 1 (90) 176.72 176.03 177.59 3.16 2.63 2.45 1.79 1.49 1.38
KLF 2 (0) 193.18 197.13 197.78 7.06 2.00 1.48 3.66 1.01 0.75 (58-40) 2 (90) 194.56 191.79 192.88 1.93 3.31 2.31 0.99 1.73 1.20 (4.9%) 3 (0) 200.62 204.18 204.12 6.23 1.97 1.88 3.11 0.97 0.92
3 (90) 191.50 187.49 192.46 3.25 4.67 1.21 1.70 2.49 0.63
Key
Abbreviation Mix Type Binder
GFC Granite Falls granite, coarse gradation, PG 52-34
GFF Granite Falls granite, fine gradation, PG 52-34
NUC New Ulm quartzite, coarse gradation PG 52-34
NUF New Ulm quartzite, fine gradation PG 52-34
KLC Kasota limestone, coarse gradation PG 52-34
KLF Kasota limestone, fine gradation PG 52-34
CGC Cedar Grove gravel, coarse gradation PG 52-34
CGF Cedar Grove gravel, fine gradation PG 52-34
NUF (58-40) New Ulm quartzite, fine gradation PG 58-40
KLF (58-40) Kasota limestone, fine gradation PG 58-40
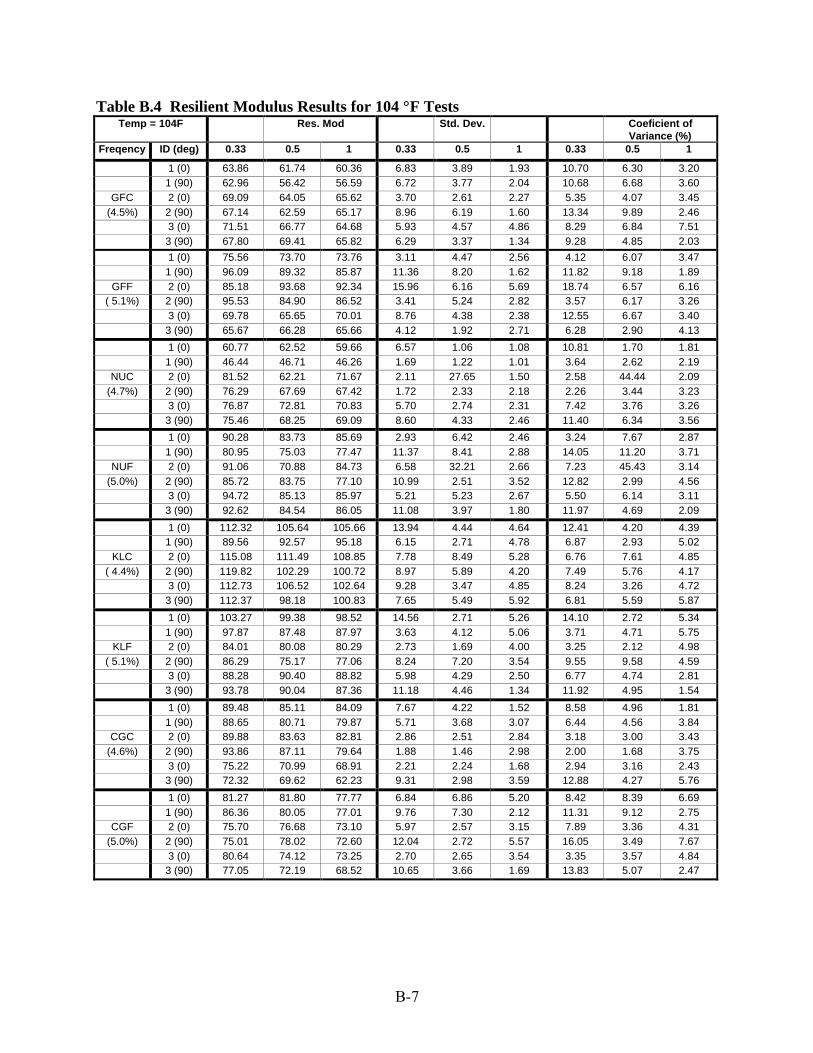
B-7
Table B.4 Resilient Modulus Results for 104 °F Tests Temp = 104F Res. Mod Std. Dev. Coeficient of
Variance (%) Freqency ID (deg) 0.33 0.5 1 0.33 0.5 1 0.33 0.5 1
1 (0) 63.86 61.74 60.36 6.83 3.89 1.93 10.70 6.30 3.20 1 (90) 62.96 56.42 56.59 6.72 3.77 2.04 10.68 6.68 3.60
GFC 2 (0) 69.09 64.05 65.62 3.70 2.61 2.27 5.35 4.07 3.45 (4.5%) 2 (90) 67.14 62.59 65.17 8.96 6.19 1.60 13.34 9.89 2.46
3 (0) 71.51 66.77 64.68 5.93 4.57 4.86 8.29 6.84 7.51 3 (90) 67.80 69.41 65.82 6.29 3.37 1.34 9.28 4.85 2.03
1 (0) 75.56 73.70 73.76 3.11 4.47 2.56 4.12 6.07 3.47 1 (90) 96.09 89.32 85.87 11.36 8.20 1.62 11.82 9.18 1.89
GFF 2 (0) 85.18 93.68 92.34 15.96 6.16 5.69 18.74 6.57 6.16 ( 5.1%) 2 (90) 95.53 84.90 86.52 3.41 5.24 2.82 3.57 6.17 3.26
3 (0) 69.78 65.65 70.01 8.76 4.38 2.38 12.55 6.67 3.40 3 (90) 65.67 66.28 65.66 4.12 1.92 2.71 6.28 2.90 4.13
1 (0) 60.77 62.52 59.66 6.57 1.06 1.08 10.81 1.70 1.81 1 (90) 46.44 46.71 46.26 1.69 1.22 1.01 3.64 2.62 2.19
NUC 2 (0) 81.52 62.21 71.67 2.11 27.65 1.50 2.58 44.44 2.09 (4.7%) 2 (90) 76.29 67.69 67.42 1.72 2.33 2.18 2.26 3.44 3.23
3 (0) 76.87 72.81 70.83 5.70 2.74 2.31 7.42 3.76 3.26 3 (90) 75.46 68.25 69.09 8.60 4.33 2.46 11.40 6.34 3.56
1 (0) 90.28 83.73 85.69 2.93 6.42 2.46 3.24 7.67 2.87 1 (90) 80.95 75.03 77.47 11.37 8.41 2.88 14.05 11.20 3.71
NUF 2 (0) 91.06 70.88 84.73 6.58 32.21 2.66 7.23 45.43 3.14 (5.0%) 2 (90) 85.72 83.75 77.10 10.99 2.51 3.52 12.82 2.99 4.56
3 (0) 94.72 85.13 85.97 5.21 5.23 2.67 5.50 6.14 3.11 3 (90) 92.62 84.54 86.05 11.08 3.97 1.80 11.97 4.69 2.09
1 (0) 112.32 105.64 105.66 13.94 4.44 4.64 12.41 4.20 4.39 1 (90) 89.56 92.57 95.18 6.15 2.71 4.78 6.87 2.93 5.02
KLC 2 (0) 115.08 111.49 108.85 7.78 8.49 5.28 6.76 7.61 4.85 ( 4.4%) 2 (90) 119.82 102.29 100.72 8.97 5.89 4.20 7.49 5.76 4.17
3 (0) 112.73 106.52 102.64 9.28 3.47 4.85 8.24 3.26 4.72 3 (90) 112.37 98.18 100.83 7.65 5.49 5.92 6.81 5.59 5.87
1 (0) 103.27 99.38 98.52 14.56 2.71 5.26 14.10 2.72 5.34 1 (90) 97.87 87.48 87.97 3.63 4.12 5.06 3.71 4.71 5.75
KLF 2 (0) 84.01 80.08 80.29 2.73 1.69 4.00 3.25 2.12 4.98 ( 5.1%) 2 (90) 86.29 75.17 77.06 8.24 7.20 3.54 9.55 9.58 4.59
3 (0) 88.28 90.40 88.82 5.98 4.29 2.50 6.77 4.74 2.81 3 (90) 93.78 90.04 87.36 11.18 4.46 1.34 11.92 4.95 1.54
1 (0) 89.48 85.11 84.09 7.67 4.22 1.52 8.58 4.96 1.81 1 (90) 88.65 80.71 79.87 5.71 3.68 3.07 6.44 4.56 3.84
CGC 2 (0) 89.88 83.63 82.81 2.86 2.51 2.84 3.18 3.00 3.43 (4.6%) 2 (90) 93.86 87.11 79.64 1.88 1.46 2.98 2.00 1.68 3.75
3 (0) 75.22 70.99 68.91 2.21 2.24 1.68 2.94 3.16 2.43 3 (90) 72.32 69.62 62.23 9.31 2.98 3.59 12.88 4.27 5.76
1 (0) 81.27 81.80 77.77 6.84 6.86 5.20 8.42 8.39 6.69 1 (90) 86.36 80.05 77.01 9.76 7.30 2.12 11.31 9.12 2.75
CGF 2 (0) 75.70 76.68 73.10 5.97 2.57 3.15 7.89 3.36 4.31 (5.0%) 2 (90) 75.01 78.02 72.60 12.04 2.72 5.57 16.05 3.49 7.67
3 (0) 80.64 74.12 73.25 2.70 2.65 3.54 3.35 3.57 4.84 3 (90) 77.05 72.19 68.52 10.65 3.66 1.69 13.83 5.07 2.47
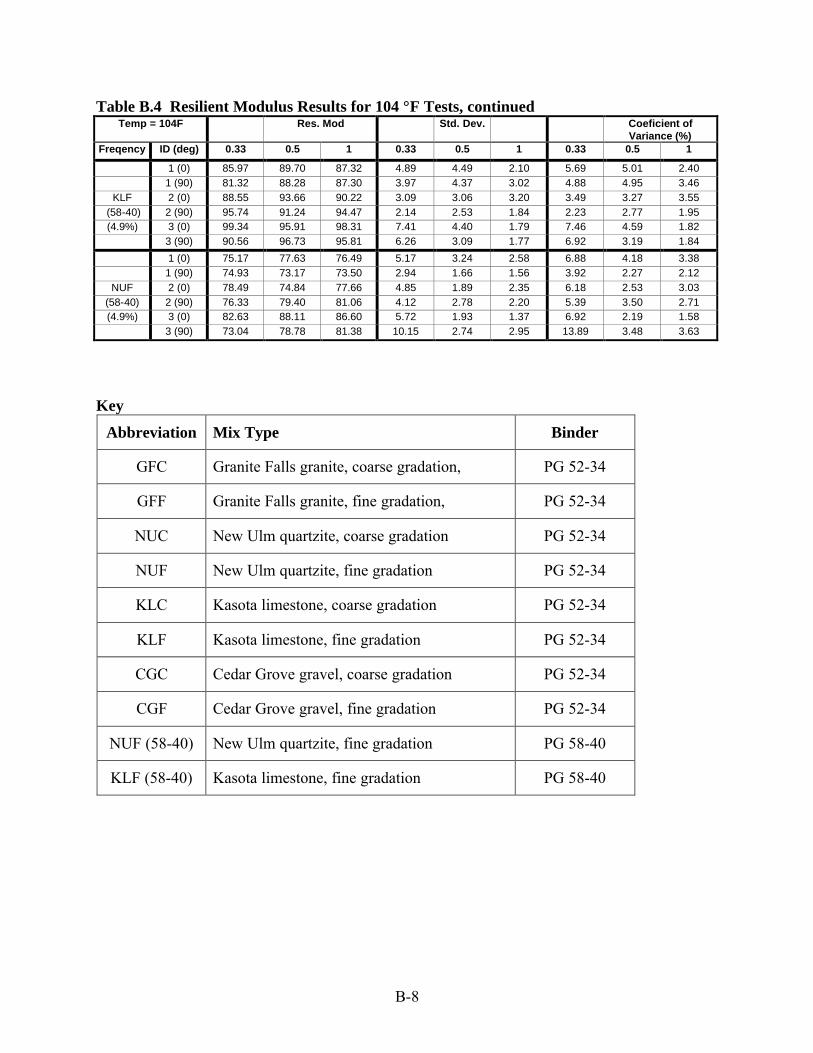
B-8
Table B.4 Resilient Modulus Results for 104 °F Tests, continued Temp = 104F Res. Mod Std. Dev. Coeficient of
Variance (%) Freqency ID (deg) 0.33 0.5 1 0.33 0.5 1 0.33 0.5 1
1 (0) 85.97 89.70 87.32 4.89 4.49 2.10 5.69 5.01 2.40 1 (90) 81.32 88.28 87.30 3.97 4.37 3.02 4.88 4.95 3.46
KLF 2 (0) 88.55 93.66 90.22 3.09 3.06 3.20 3.49 3.27 3.55 (58-40) 2 (90) 95.74 91.24 94.47 2.14 2.53 1.84 2.23 2.77 1.95 (4.9%) 3 (0) 99.34 95.91 98.31 7.41 4.40 1.79 7.46 4.59 1.82
3 (90) 90.56 96.73 95.81 6.26 3.09 1.77 6.92 3.19 1.84
1 (0) 75.17 77.63 76.49 5.17 3.24 2.58 6.88 4.18 3.38 1 (90) 74.93 73.17 73.50 2.94 1.66 1.56 3.92 2.27 2.12
NUF 2 (0) 78.49 74.84 77.66 4.85 1.89 2.35 6.18 2.53 3.03 (58-40) 2 (90) 76.33 79.40 81.06 4.12 2.78 2.20 5.39 3.50 2.71 (4.9%) 3 (0) 82.63 88.11 86.60 5.72 1.93 1.37 6.92 2.19 1.58
3 (90) 73.04 78.78 81.38 10.15 2.74 2.95 13.89 3.48 3.63
Key
Abbreviation Mix Type Binder
GFC Granite Falls granite, coarse gradation, PG 52-34
GFF Granite Falls granite, fine gradation, PG 52-34
NUC New Ulm quartzite, coarse gradation PG 52-34
NUF New Ulm quartzite, fine gradation PG 52-34
KLC Kasota limestone, coarse gradation PG 52-34
KLF Kasota limestone, fine gradation PG 52-34
CGC Cedar Grove gravel, coarse gradation PG 52-34
CGF Cedar Grove gravel, fine gradation PG 52-34
NUF (58-40) New Ulm quartzite, fine gradation PG 58-40
KLF (58-40) Kasota limestone, fine gradation PG 58-40

APPENDIX C
APA RUT TEST PROCEDURE
III-115M Page 1 of 8
C-1
GDT-115M METHOD OF TEST FOR DETERMINING
RUTTING SUSCEPTIBILITY USING THE ASPHALT PAVEMENT ANALYZER
A. SCOPE: The Asphalt Pavement Analyzer will be used to test the rutting susceptibility of asphalt
concrete mixtures. B. APPARATUS: 1. 16,000 gram scale, accurate to 0.1 gram. 2. Mixer. 3. Mixing utensils (bowls, spoon, spatula). 4. Astec Vibratory Compactor (Model AVC II). 5. 125 mm wide x 300 mm long beam mold with base plate and 150 mm diameter mold
with base plate for AVC II. 6. 125 mm x 300 mm beam specimen compaction head and 150 mm diameter cylinder
compaction head for AVC II. 7. 125 mm x 300 mm x 2 mm beam sample support plates for beam specimens and 150
mm diameter x 2 mm sample support plates for cylindrical specimens. 8. 75 mm high calibration blocks for beam and pill compaction heads for the AVC II 9. Astec Asphalt Pavement Analyzer II. 10. Heating ovens for aggregate and asphalt cement. Capable of maintaining at least 200
°C and holding a set temperature ± 2 °C. 11. Polyethylene restraint molds for sample testing. 12. Measuring template for rut measurement. 13. Digital Indicator (accurate to 0.1 mm). 14. 150 mm diameter paper disks for cylindrical AVC II Molds.
III-115M Page 2 of 8
C-2
C. Preparation of Sample: 1. Asphalt mixes should be batched with asphalt and aggregate to meet actual laboratory
density at optimum asphalt cement content according to Section F below. The target voids of the compacted mix should be 7.0% ± 1.0%, unless specified otherwise.
2. Preheat aggregate, liquid asphalt, compaction molds, and utensils to the specified
temperatures. Temperatures for heating and mixing aggregate and asphalt cement should conform to the Superpave Performance Grade mixing and compaction binder requirement.
3. Dry mix, aggregates and hydrated lime or other admixtures, if required, then add the
optimum percentage of asphalt cement and mix. 4. If additional heating is necessary, place entire mixture in one gallon cans, close lids and
place in an oven set on approximately 176 °C. Heat until mixture meets required compaction temperature. The mixture shall not be heated at the compaction temperature for more than one (1) hour.
D. Sample Compaction: 1. Astec Vibratory Compactor (Model AVC II) a. The following steps should be completed before starting the specimen compaction
operation: 1) To set the height of specimen to be compacted at 75 mm, place the calibration
block under the compaction head on the specimen supporting base. On the control unit, with the VIBRATION switch to OFF and the MODE switch to MANUAL, simultaneously press the GREEN PALM buttons to lower the compaction head onto the calibration block. For height calibration, the compaction head should be making full contact with the face of the block. Hand tighten the compaction head assembly bolts in this position. Raise the compaction head assembly for adequate clearance to tighten the bolts to the appropriate torque.
2) Adjust the compaction force and the vibration time, depending on the type of
mix. The amount of compaction effort that can be delivered by this compaction machine depends on the static compaction force and the duration of vibrating action which can be adjusted. The static compaction force can be controlled by the compaction pressure (system pressure on the right) and the counter balance pressure (on the left). The relationship between these two pressure readings and the net compaction pressure are shown in Table 3-1, below:
III-115M Page 3 of 8
C-3
Table 3-1 SPECIMEN SYSTEM COUNTER BAL. VIBRATING TYPE PRESSURE PRESSURE TIME, sec.* 150 mm dia. Cylinder specimen 700 kPa 420 kPa 30 - 60 125 mm x 300 mm beam specimen 700 kPa 210 kPa 30 - 60 * Vibrating time can be adjusted from the CYCLE TIME counter on the control unit. The
VIBRATING TIME will be 50% of the maximum total CYCLE TIME. 3) Heat the specimen mold assembly in an oven to a temperature of 150 °C. The
mold needs to be heated once at the beginning of the specimen compaction operation.
b. The following specimen compaction procedures can be used for compacting
cylinder specimen and beam specimen: 1) Place the specimen mold on top of a counter adjacent to the compaction
machine. Insert a preheated sample support plate into the mold. Apply a light coat of release agent on the inside surfaces of the mold and the sample support plate. If compacting a cylinder specimen, place a paper disk in the bottom of the mold.
2) Place the entire batch of mixture in the mold and spade the mixture vigorously
with a heated spatula twenty (20) times evenly around the perimeter and twenty (20) times evenly in the interior of the beam mold, or, ten (10) times around the perimeter and ten (10) times evenly in the interior of the cylindrical mold. Then form the sample surface to a dome shape. Measure the temperature in the mixture. Temperature at the start of the compaction procedure should be within 3 °C of the specified compaction temperature for the mixture. If it is not, place the sample and mold in oven until the specified compaction temperature is reached.
3) Transfer the specimen mold to the supporting base of the machine and fit it in
the recessed area. Apply a light coat of release agent on the compaction head. 4) On the control unit, set CYCLE TIME from one (1) minute to two (2) minutes
(depending on the VIBRATING TIME), turn MODE switch to AUTO, VIBRATING switch to AUTO, and pull up (disable) the EMERGENCY STOP.
III-115M Page 4 of 8
C-4
5) Depress both GREEN PALM buttons simultaneously (you do not need to hold down the palm buttons). This will cause the compaction head assembly to move downward automatically, and when it drops to a specified position, the vibrating action will be activated automatically. Under the static compression force and the vibrating actions, the compaction head will move downward to compact the loose asphalt mixture confined in the specimen mold for thirty (30) seconds to sixty (60) seconds. After the selected VIBRATING TIME (50% of the CYCLE TIME), turn the VIBRATING switch “OFF”, allowing the specimens to remain under static compression force only, for the remaining 50% of the CYCLE TIME. At the end of the CYCLE TIME, the compaction head assembly will automatically retract. Additional vibrating compaction can be applied by increasing the vibrating time.
6) Lift the specimen mold from the compaction position, move forward and slide
the edges of the specimen mold under the restraining brackets and position the specimen mold in the recessed area at the extruding support base.
7) On the control unit, turn the MODE switch to EJECT. Press and hold down
both GREEN PALM buttons to raise the extrusion cylinder head to extrude the specimen out from the mold. Allow the specimen to cool for a few minutes, then remove the compacted specimen with the sample support plate together from the base plate of the mold and place them on a firm counter top. Press the OPEN button on the control unit to retract the extrusion cylinder head. Then remove the specimen mold from the supporting base plate.
E. Rut Testing Procedure 1. Method “A” - Laboratory Compacted Specimen a. Asphalt Pavement Analyzer II 1) Rut Testing (Dry) a) Preset chamber temperature as follows: For SMA and Superpave mixes
use 50 °C, for conventional mixes use 40 °C. During testing these temperatures are to be maintained within ± 1 °C.
b) Open the front doors, unlock the toggle clamps and pull out the sample
tray. c) Loosen and remove the bolts and the restraining brackets at the front ends
of the three PVC molds that have been secured on the sample tray. Remove the molds from the sample tray and place them on a firm counter top for installing asphalt samples in the sample mold.
III-115M Page 5 of 8
C-5
d) After installing the samples into the molds, transfer the sample molds to the sample tray, one at a time, making sure to fit the recessed area of the sample mold to the rear end restraining bracket. Do the same for all three molds. Place and tighten the restraining brackets on the front end of the sample molds, fitting the bracket into the recessed area of the sample mold to restrain the sample molds from lateral movement.
e) Allow the machine to stroke through a maximum of 100 cycles to assure
that the specimen are seated well in the molds or between the restraint brackets and that there is no build-up asphalt binder film thickness on the sample surface.
f) Measure and record the initial gauge readings for each sample by taking
indicator readings at all five slots for beam samples, or by taking indicator readings using the two end slots on each end of the template for cylindrical samples. Record the readings and average on the data sheet.
g) Perform the rutting test. It is assumed that the chamber temperature has
been brought to the preset test temperature and the test samples have been conditioned under the test temperature for a minimum of four (4) hours.
h) After closing the front door, allow the test samples to be stabilized at the
test temperature for ten (10) minutes before starting the rutting test. The STROKE ON DELAY timer can be used to set the delay start time.
i) Set the PRESET counter to the number of repetitions for the test to be run.
Reset the TOTALIZING counters too zero, turn the cylinder operation mode control switch to AUTO, and check the pressure gauge readings to be corresponding to the wheel load. Do this for all three (3) cylinders.
j) Press the green rectangular STROKE TEST START button to start the rut
testing. This will start the automatic rut testing sequence. After completing the preset number of repetitions, the machine automatically stops the reciprocating motion and retracts the wheels. A complete test will take approximately 3.5 hours.
k) Measure the rut depth and record the results on the data sheet as in step
1.e., above. 2) Rut Testing (Submerged) a) Precondition samples by vacuum saturation in accordance with GDT-66.
Calculate the percent saturation.
III-115M Page 6 of 8
C-6
b) Place and secure specimen in the sample molds, same as the procedure used in 1.a). to 1.e)., above.
c) Perform the rutting test. It is important to remember that the water tray
should be empty before raising or lowering to prevent spillage of water inside the cabinet.
d) After closing the front door, raise the water tray and turn on the water
pump to flood the test samples. Use the STROKE ON DELAY timer and set the soaking time at 30 minutes to allow the test samples to be stabilized at the test temperature before starting the rut testing.
e) Set the PRESET counter to the number of repetitions for the test to be run.
Reset the TOTALIZING counter to zero, turn the cylinder operation mode control switch to AUTO and check the pressure gauge reading which should correspond to the specified test wheel load.
f) Press the green rectangular STROKE TEST START button to start the rut
testing. This will start the automatic rut testing sequence. After completing the preset number of repetitions, the machine will automatically stop the reciprocating motion and retract the wheels.
g) Drain the water in the water tray then lower the water tray. h) Open the front doors, release the toggle clamps and pull out the sample
tray. i) Measure the rut depth and record the results on the data sheet as in step
1.e., above. 3) Method “B” - Roadway Specimen a) 300 mm or 150 mm roadway cores are used in this method for evaluation. b) 150 mm diameter cores must be sawed to a thickness of 75 mm high.
300 mm core must be sawed to give a sample specimen 75 mm thickness x 125 mm wide x 225 mm long.
F. Calculations: 1. Calculation of Specimen Mass: a. Volume of Specimen [cm3]: 1) Beam: V = L x w x h
III-115M Page 7 of 8
C-7
2) Cylindrical Specimen: V = πD2 x 0.001 cm3/mm3 x h 4 b. Target Mass of Specimen [g]: 1) Beam: Wmb = ρopt x V 2) Cylindrical Specimen: Wmb = Gmm (1g/cm3) x % Gmm x V Where, L = Length of beam specimen, cm w = Width of beam specimen, cm h = Height of specimen, cm (7.5 cm) D = Diameter of cylindrical mold, mm (15.0 cm) V = Volume of specimen, cm3 (30.0 cm x 12.5 cm x 7.5 cm = 2812.5 cm3 for laboratory beam specimen, 22.5 cm x 12.5 cm x 7.5 cm = 2109.4 cm3 for field beam specimen, [π (15.0 cm)2]/4 x 7.5 cm = 1325.4 cm3 for cylindrical specimen) ρopt = Density @ optimum asphalt content, g/cm3 Gmm = Theoretical maximum specific gravity @ optimum asphalt content % Gmm = 1.0 - Target % air voids 100 (1 g/ cm3) = Density of water Wmb = Target mass of specimen, g. 2. Calculation of Rut Depth: a. The rut depth at each location is determined by subtracting the final measurement
from the initial measurement. b. Determine the average rut depth for each specimen. c. The rut depth for the mixture is the average of the specimen rut depths as
determined above in 2.b. G. Report: The test report shall include at least the following information: a. The project name, location, date of sampling and date of testing.

III-115M Page 8 of 8
C-8
b. The mixture type and description (or mix I.D. no.). c. The specimen type and method of compaction. d. The asphaltic cement binder performance grade, percentage in sample and source. e. The aggregate source and location. f. The average air void content of the test specimens. g. The test temperature. h. The maximum theoretical specific gravity, Gmm, of the mixture. i. The average rut depth to the nearest 0.1 mm. j. Description of any special conditioning or preparation for the test specimens (or
references to a test procedure number). If the average rut depth of the specimens exceeds 5.0 mm for Superpave or SMA asphalt mixes or 8.0 mm for conventional asphalt mixes, it shall be reported as failing.
APPENDIX D APA RUT DATA
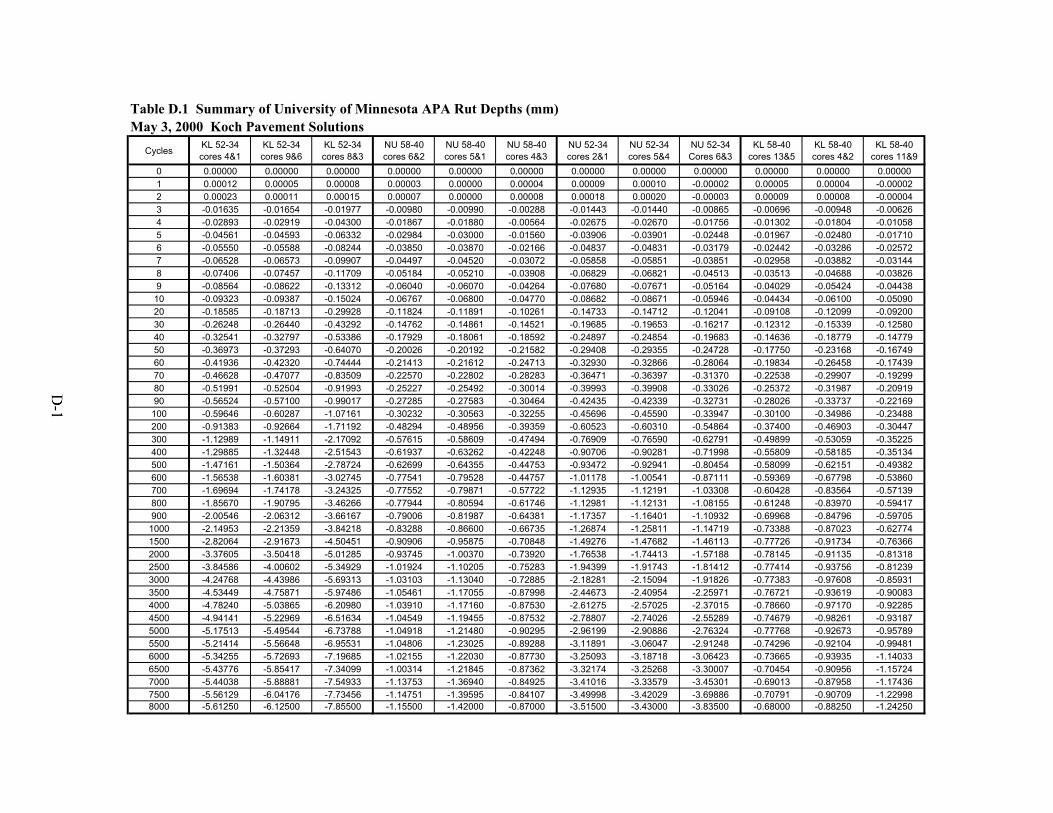
Table D.1 Summary of University of Minnesota APA Rut Depths (mm)May 3, 2000 Koch Pavement Solutions
Cycles KL 52-34 cores 4&1
KL 52-34 cores 9&6
KL 52-34 cores 8&3
NU 58-40 cores 6&2
NU 58-40 cores 5&1
NU 58-40 cores 4&3
NU 52-34 cores 2&1
NU 52-34 cores 5&4
NU 52-34 Cores 6&3
KL 58-40 cores 13&5
KL 58-40 cores 4&2
KL 58-40 cores 11&9
0 0.00000 0.00000 0.00000 0.00000 0.00000 0.00000 0.00000 0.00000 0.00000 0.00000 0.00000 0.000001 0.00012 0.00005 0.00008 0.00003 0.00000 0.00004 0.00009 0.00010 -0.00002 0.00005 0.00004 -0.000022 0.00023 0.00011 0.00015 0.00007 0.00000 0.00008 0.00018 0.00020 -0.00003 0.00009 0.00008 -0.000043 -0.01635 -0.01654 -0.01977 -0.00980 -0.00990 -0.00288 -0.01443 -0.01440 -0.00865 -0.00696 -0.00948 -0.006264 -0.02893 -0.02919 -0.04300 -0.01867 -0.01880 -0.00564 -0.02675 -0.02670 -0.01756 -0.01302 -0.01804 -0.010585 -0.04561 -0.04593 -0.06332 -0.02984 -0.03000 -0.01560 -0.03906 -0.03901 -0.02448 -0.01967 -0.02480 -0.017106 -0.05550 -0.05588 -0.08244 -0.03850 -0.03870 -0.02166 -0.04837 -0.04831 -0.03179 -0.02442 -0.03286 -0.025727 -0.06528 -0.06573 -0.09907 -0.04497 -0.04520 -0.03072 -0.05858 -0.05851 -0.03851 -0.02958 -0.03882 -0.031448 -0.07406 -0.07457 -0.11709 -0.05184 -0.05210 -0.03908 -0.06829 -0.06821 -0.04513 -0.03513 -0.04688 -0.038269 -0.08564 -0.08622 -0.13312 -0.06040 -0.06070 -0.04264 -0.07680 -0.07671 -0.05164 -0.04029 -0.05424 -0.0443810 -0.09323 -0.09387 -0.15024 -0.06767 -0.06800 -0.04770 -0.08682 -0.08671 -0.05946 -0.04434 -0.06100 -0.0509020 -0.18585 -0.18713 -0.29928 -0.11824 -0.11891 -0.10261 -0.14733 -0.14712 -0.12041 -0.09108 -0.12099 -0.0920030 -0.26248 -0.26440 -0.43292 -0.14762 -0.14861 -0.14521 -0.19685 -0.19653 -0.16217 -0.12312 -0.15339 -0.1258040 -0.32541 -0.32797 -0.53386 -0.17929 -0.18061 -0.18592 -0.24897 -0.24854 -0.19683 -0.14636 -0.18779 -0.1477950 -0.36973 -0.37293 -0.64070 -0.20026 -0.20192 -0.21582 -0.29408 -0.29355 -0.24728 -0.17750 -0.23168 -0.1674960 -0.41936 -0.42320 -0.74444 -0.21413 -0.21612 -0.24713 -0.32930 -0.32866 -0.28064 -0.19834 -0.26458 -0.1743970 -0.46628 -0.47077 -0.83509 -0.22570 -0.22802 -0.28283 -0.36471 -0.36397 -0.31370 -0.22538 -0.29907 -0.1929980 -0.51991 -0.52504 -0.91993 -0.25227 -0.25492 -0.30014 -0.39993 -0.39908 -0.33026 -0.25372 -0.31987 -0.2091990 -0.56524 -0.57100 -0.99017 -0.27285 -0.27583 -0.30464 -0.42435 -0.42339 -0.32731 -0.28026 -0.33737 -0.22169100 -0.59646 -0.60287 -1.07161 -0.30232 -0.30563 -0.32255 -0.45696 -0.45590 -0.33947 -0.30100 -0.34986 -0.23488200 -0.91383 -0.92664 -1.71192 -0.48294 -0.48956 -0.39359 -0.60523 -0.60310 -0.54864 -0.37400 -0.46903 -0.30447300 -1.12989 -1.14911 -2.17092 -0.57615 -0.58609 -0.47494 -0.76909 -0.76590 -0.62791 -0.49899 -0.53059 -0.35225400 -1.29885 -1.32448 -2.51543 -0.61937 -0.63262 -0.42248 -0.90706 -0.90281 -0.71998 -0.55809 -0.58185 -0.35134500 -1.47161 -1.50364 -2.78724 -0.62699 -0.64355 -0.44753 -0.93472 -0.92941 -0.80454 -0.58099 -0.62151 -0.49382600 -1.56538 -1.60381 -3.02745 -0.77541 -0.79528 -0.44757 -1.01178 -1.00541 -0.87111 -0.59369 -0.67798 -0.53860700 -1.69694 -1.74178 -3.24325 -0.77552 -0.79871 -0.57722 -1.12935 -1.12191 -1.03308 -0.60428 -0.83564 -0.57139800 -1.85670 -1.90795 -3.46266 -0.77944 -0.80594 -0.61746 -1.12981 -1.12131 -1.08155 -0.61248 -0.83970 -0.59417900 -2.00546 -2.06312 -3.66167 -0.79006 -0.81987 -0.64381 -1.17357 -1.16401 -1.10932 -0.69968 -0.84796 -0.597051000 -2.14953 -2.21359 -3.84218 -0.83288 -0.86600 -0.66735 -1.26874 -1.25811 -1.14719 -0.73388 -0.87023 -0.627741500 -2.82064 -2.91673 -4.50451 -0.90906 -0.95875 -0.70848 -1.49276 -1.47682 -1.46113 -0.77726 -0.91734 -0.763662000 -3.37605 -3.50418 -5.01285 -0.93745 -1.00370 -0.73920 -1.76538 -1.74413 -1.57188 -0.78145 -0.91135 -0.813182500 -3.84586 -4.00602 -5.34929 -1.01924 -1.10205 -0.75283 -1.94399 -1.91743 -1.81412 -0.77414 -0.93756 -0.812393000 -4.24768 -4.43986 -5.69313 -1.03103 -1.13040 -0.72885 -2.18281 -2.15094 -1.91826 -0.77383 -0.97608 -0.859313500 -4.53449 -4.75871 -5.97486 -1.05461 -1.17055 -0.87998 -2.44673 -2.40954 -2.25971 -0.76721 -0.93619 -0.900834000 -4.78240 -5.03865 -6.20980 -1.03910 -1.17160 -0.87530 -2.61275 -2.57025 -2.37015 -0.78660 -0.97170 -0.922854500 -4.94141 -5.22969 -6.51634 -1.04549 -1.19455 -0.87532 -2.78807 -2.74026 -2.55289 -0.74679 -0.98261 -0.931875000 -5.17513 -5.49544 -6.73788 -1.04918 -1.21480 -0.90295 -2.96199 -2.90886 -2.76324 -0.77768 -0.92673 -0.957895500 -5.21414 -5.56648 -6.95531 -1.04806 -1.23025 -0.89288 -3.11891 -3.06047 -2.91248 -0.74296 -0.92104 -0.994816000 -5.34255 -5.72693 -7.19685 -1.02155 -1.22030 -0.87730 -3.25093 -3.18718 -3.06423 -0.73665 -0.93935 -1.140336500 -5.43776 -5.85417 -7.34099 -1.00314 -1.21845 -0.87362 -3.32174 -3.25268 -3.30007 -0.70454 -0.90956 -1.157247000 -5.44038 -5.88881 -7.54933 -1.13753 -1.36940 -0.84925 -3.41016 -3.33579 -3.45301 -0.69013 -0.87958 -1.174367500 -5.56129 -6.04176 -7.73456 -1.14751 -1.39595 -0.84107 -3.49998 -3.42029 -3.69886 -0.70791 -0.90709 -1.229988000 -5.61250 -6.12500 -7.85500 -1.15500 -1.42000 -0.87000 -3.51500 -3.43000 -3.83500 -0.68000 -0.88250 -1.24250
APPENDIX E IDT CREEP DATA
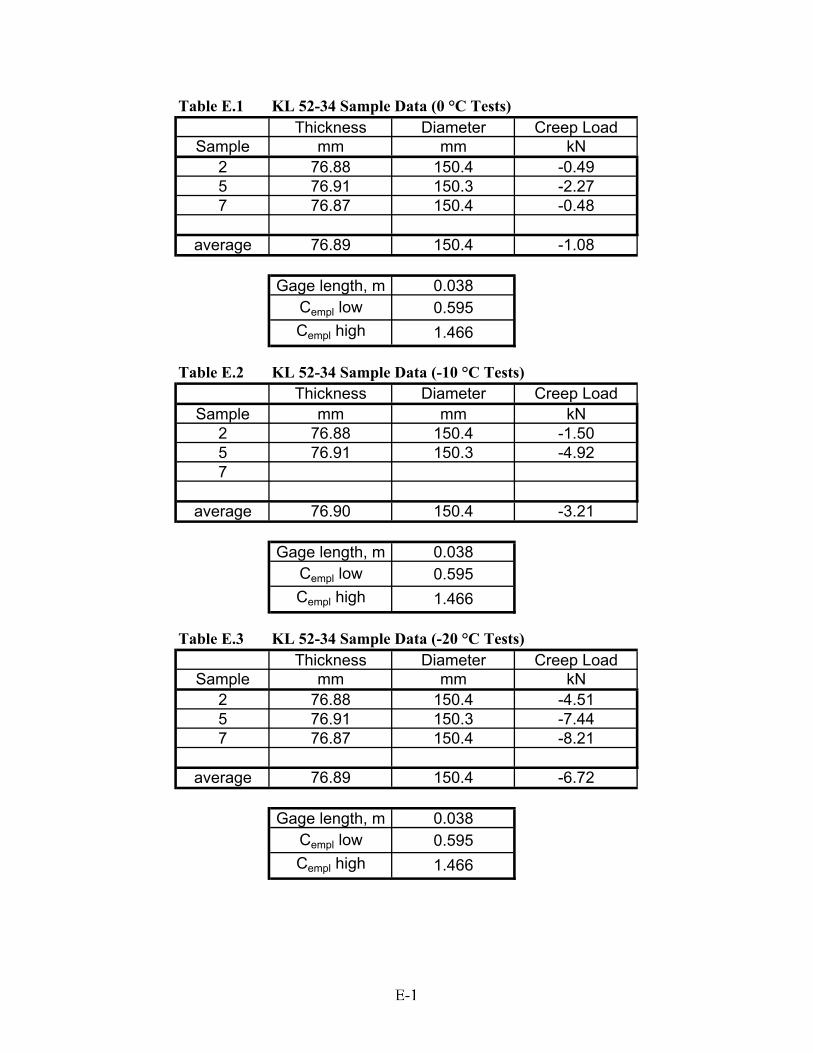
Table E.1 KL 52-34 Sample Data (0 °C Tests)Thickness Diameter Creep Load
Sample mm mm kN2 76.88 150.4 -0.495 76.91 150.3 -2.277 76.87 150.4 -0.48
average 76.89 150.4 -1.08
Gage length, m 0.038Cempl low 0.595Cempl high 1.466
Table E.2 KL 52-34 Sample Data (-10 °C Tests)Thickness Diameter Creep Load
Sample mm mm kN2 76.88 150.4 -1.505 76.91 150.3 -4.927
average 76.90 150.4 -3.21
Gage length, m 0.038Cempl low 0.595Cempl high 1.466
Table E.3 KL 52-34 Sample Data (-20 °C Tests)Thickness Diameter Creep Load
Sample mm mm kN2 76.88 150.4 -4.515 76.91 150.3 -7.447 76.87 150.4 -8.21
average 76.89 150.4 -6.72
Gage length, m 0.038Cempl low 0.595Cempl high 1.466
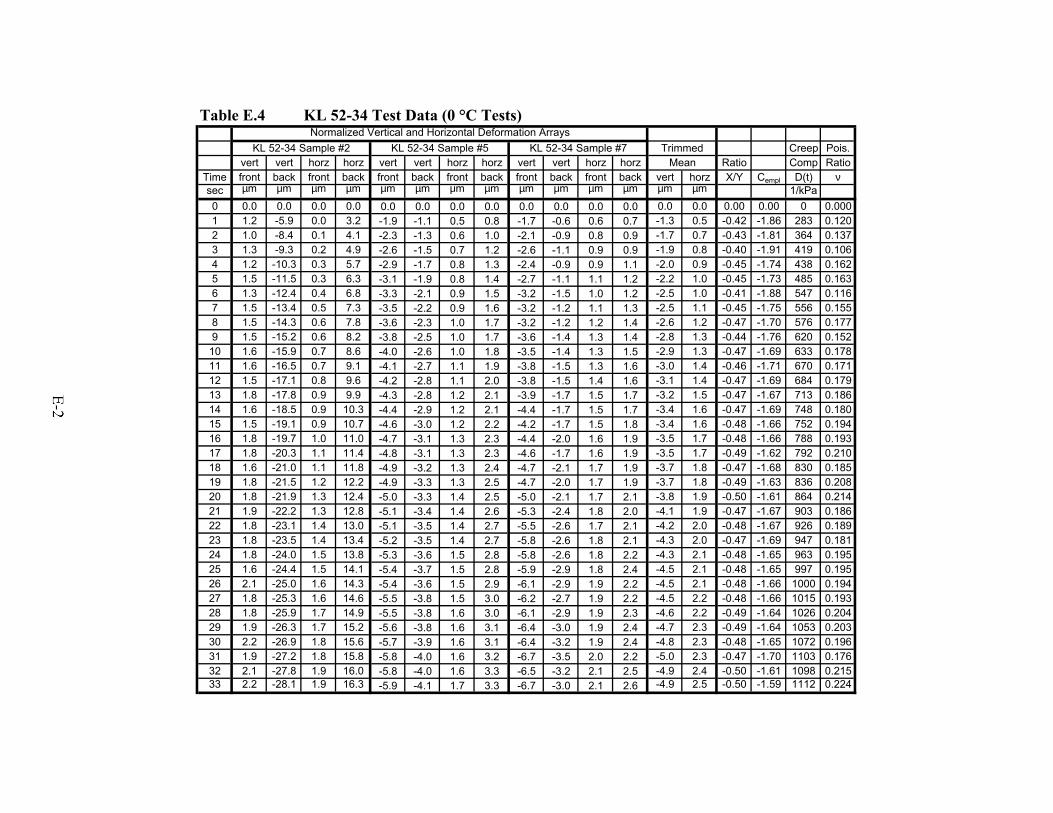
Table E.4 KL 52-34 Test Data (0 °C Tests)
Creep Pois.vert vert horz horz vert vert horz horz vert vert horz horz Ratio Comp Ratio
Time front back front back front back front back front back front back vert horz X/Y Cempl D(t) νsec µm µm µm µm µm µm µm µm µm µm µm µm µm µm 1/kPa0 0.0 0.0 0.0 0.0 0.0 0.0 0.0 0.0 0.0 0.0 0.0 0.0 0.0 0.0 0.00 0.00 0 0.0001 1.2 -5.9 0.0 3.2 -1.9 -1.1 0.5 0.8 -1.7 -0.6 0.6 0.7 -1.3 0.5 -0.42 -1.86 283 0.1202 1.0 -8.4 0.1 4.1 -2.3 -1.3 0.6 1.0 -2.1 -0.9 0.8 0.9 -1.7 0.7 -0.43 -1.81 364 0.1373 1.3 -9.3 0.2 4.9 -2.6 -1.5 0.7 1.2 -2.6 -1.1 0.9 0.9 -1.9 0.8 -0.40 -1.91 419 0.1064 1.2 -10.3 0.3 5.7 -2.9 -1.7 0.8 1.3 -2.4 -0.9 0.9 1.1 -2.0 0.9 -0.45 -1.74 438 0.1625 1.5 -11.5 0.3 6.3 -3.1 -1.9 0.8 1.4 -2.7 -1.1 1.1 1.2 -2.2 1.0 -0.45 -1.73 485 0.1636 1.3 -12.4 0.4 6.8 -3.3 -2.1 0.9 1.5 -3.2 -1.5 1.0 1.2 -2.5 1.0 -0.41 -1.88 547 0.1167 1.5 -13.4 0.5 7.3 -3.5 -2.2 0.9 1.6 -3.2 -1.2 1.1 1.3 -2.5 1.1 -0.45 -1.75 556 0.1558 1.5 -14.3 0.6 7.8 -3.6 -2.3 1.0 1.7 -3.2 -1.2 1.2 1.4 -2.6 1.2 -0.47 -1.70 576 0.1779 1.5 -15.2 0.6 8.2 -3.8 -2.5 1.0 1.7 -3.6 -1.4 1.3 1.4 -2.8 1.3 -0.44 -1.76 620 0.152
10 1.6 -15.9 0.7 8.6 -4.0 -2.6 1.0 1.8 -3.5 -1.4 1.3 1.5 -2.9 1.3 -0.47 -1.69 633 0.17811 1.6 -16.5 0.7 9.1 -4.1 -2.7 1.1 1.9 -3.8 -1.5 1.3 1.6 -3.0 1.4 -0.46 -1.71 670 0.17112 1.5 -17.1 0.8 9.6 -4.2 -2.8 1.1 2.0 -3.8 -1.5 1.4 1.6 -3.1 1.4 -0.47 -1.69 684 0.17913 1.8 -17.8 0.9 9.9 -4.3 -2.8 1.2 2.1 -3.9 -1.7 1.5 1.7 -3.2 1.5 -0.47 -1.67 713 0.18614 1.6 -18.5 0.9 10.3 -4.4 -2.9 1.2 2.1 -4.4 -1.7 1.5 1.7 -3.4 1.6 -0.47 -1.69 748 0.18015 1.5 -19.1 0.9 10.7 -4.6 -3.0 1.2 2.2 -4.2 -1.7 1.5 1.8 -3.4 1.6 -0.48 -1.66 752 0.19416 1.8 -19.7 1.0 11.0 -4.7 -3.1 1.3 2.3 -4.4 -2.0 1.6 1.9 -3.5 1.7 -0.48 -1.66 788 0.19317 1.8 -20.3 1.1 11.4 -4.8 -3.1 1.3 2.3 -4.6 -1.7 1.6 1.9 -3.5 1.7 -0.49 -1.62 792 0.21018 1.6 -21.0 1.1 11.8 -4.9 -3.2 1.3 2.4 -4.7 -2.1 1.7 1.9 -3.7 1.8 -0.47 -1.68 830 0.18519 1.8 -21.5 1.2 12.2 -4.9 -3.3 1.3 2.5 -4.7 -2.0 1.7 1.9 -3.7 1.8 -0.49 -1.63 836 0.20820 1.8 -21.9 1.3 12.4 -5.0 -3.3 1.4 2.5 -5.0 -2.1 1.7 2.1 -3.8 1.9 -0.50 -1.61 864 0.21421 1.9 -22.2 1.3 12.8 -5.1 -3.4 1.4 2.6 -5.3 -2.4 1.8 2.0 -4.1 1.9 -0.47 -1.67 903 0.18622 1.8 -23.1 1.4 13.0 -5.1 -3.5 1.4 2.7 -5.5 -2.6 1.7 2.1 -4.2 2.0 -0.48 -1.67 926 0.18923 1.8 -23.5 1.4 13.4 -5.2 -3.5 1.4 2.7 -5.8 -2.6 1.8 2.1 -4.3 2.0 -0.47 -1.69 947 0.18124 1.8 -24.0 1.5 13.8 -5.3 -3.6 1.5 2.8 -5.8 -2.6 1.8 2.2 -4.3 2.1 -0.48 -1.65 963 0.19525 1.6 -24.4 1.5 14.1 -5.4 -3.7 1.5 2.8 -5.9 -2.9 1.8 2.4 -4.5 2.1 -0.48 -1.65 997 0.19526 2.1 -25.0 1.6 14.3 -5.4 -3.6 1.5 2.9 -6.1 -2.9 1.9 2.2 -4.5 2.1 -0.48 -1.66 1000 0.19427 1.8 -25.3 1.6 14.6 -5.5 -3.8 1.5 3.0 -6.2 -2.7 1.9 2.2 -4.5 2.2 -0.48 -1.66 1015 0.19328 1.8 -25.9 1.7 14.9 -5.5 -3.8 1.6 3.0 -6.1 -2.9 1.9 2.3 -4.6 2.2 -0.49 -1.64 1026 0.20429 1.9 -26.3 1.7 15.2 -5.6 -3.8 1.6 3.1 -6.4 -3.0 1.9 2.4 -4.7 2.3 -0.49 -1.64 1053 0.20330 2.2 -26.9 1.8 15.6 -5.7 -3.9 1.6 3.1 -6.4 -3.2 1.9 2.4 -4.8 2.3 -0.48 -1.65 1072 0.19631 1.9 -27.2 1.8 15.8 -5.8 -4.0 1.6 3.2 -6.7 -3.5 2.0 2.2 -5.0 2.3 -0.47 -1.70 1103 0.17632 2.1 -27.8 1.9 16.0 -5.8 -4.0 1.6 3.3 -6.5 -3.2 2.1 2.5 -4.9 2.4 -0.50 -1.61 1098 0.21533 2.2 -28.1 1.9 16.3 -5.9 -4.1 1.7 3.3 -6.7 -3.0 2.1 2.6 -4.9 2.5 -0.50 -1.59 1112 0.224
Mean
Normalized Vertical and Horizontal Deformation ArraysKL 52-34 Sample #2 KL 52-34 Sample #5 KL 52-34 Sample #7 Trimmed
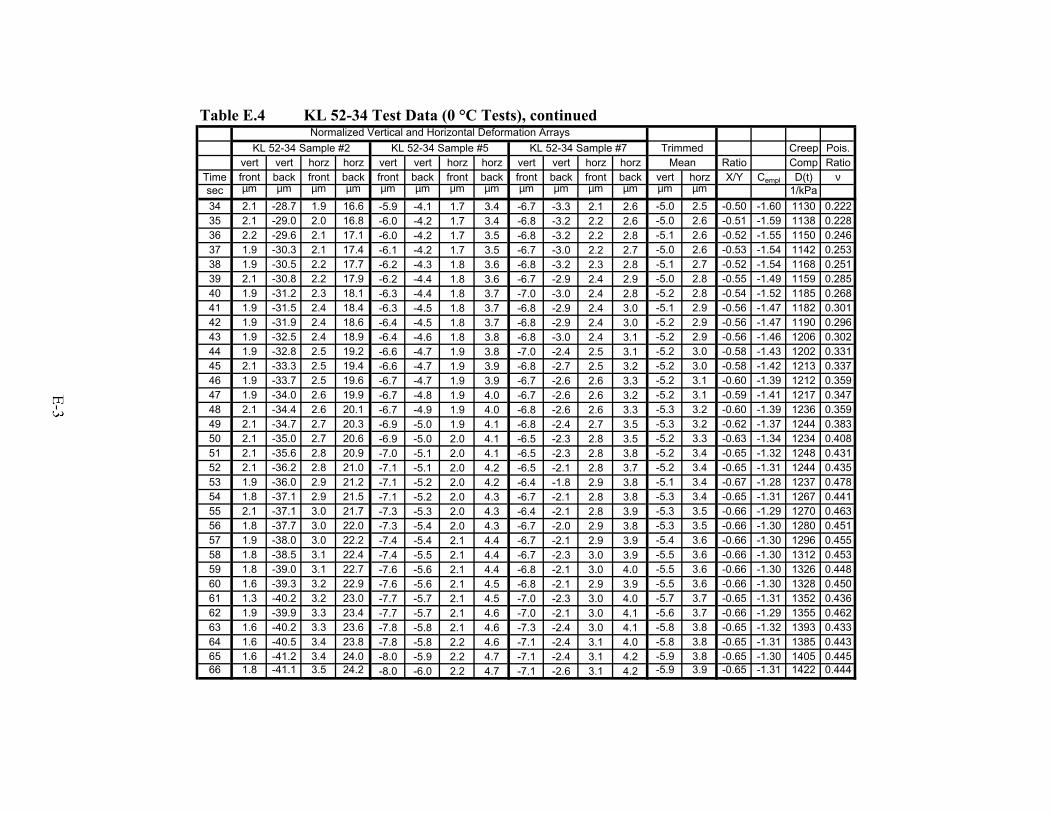
Table E.4 KL 52-34 Test Data (0 °C Tests), continued
Creep Pois.vert vert horz horz vert vert horz horz vert vert horz horz Ratio Comp Ratio
Time front back front back front back front back front back front back vert horz X/Y Cempl D(t) νsec µm µm µm µm µm µm µm µm µm µm µm µm µm µm 1/kPa34 2.1 -28.7 1.9 16.6 -5.9 -4.1 1.7 3.4 -6.7 -3.3 2.1 2.6 -5.0 2.5 -0.50 -1.60 1130 0.22235 2.1 -29.0 2.0 16.8 -6.0 -4.2 1.7 3.4 -6.8 -3.2 2.2 2.6 -5.0 2.6 -0.51 -1.59 1138 0.22836 2.2 -29.6 2.1 17.1 -6.0 -4.2 1.7 3.5 -6.8 -3.2 2.2 2.8 -5.1 2.6 -0.52 -1.55 1150 0.24637 1.9 -30.3 2.1 17.4 -6.1 -4.2 1.7 3.5 -6.7 -3.0 2.2 2.7 -5.0 2.6 -0.53 -1.54 1142 0.25338 1.9 -30.5 2.2 17.7 -6.2 -4.3 1.8 3.6 -6.8 -3.2 2.3 2.8 -5.1 2.7 -0.52 -1.54 1168 0.25139 2.1 -30.8 2.2 17.9 -6.2 -4.4 1.8 3.6 -6.7 -2.9 2.4 2.9 -5.0 2.8 -0.55 -1.49 1159 0.28540 1.9 -31.2 2.3 18.1 -6.3 -4.4 1.8 3.7 -7.0 -3.0 2.4 2.8 -5.2 2.8 -0.54 -1.52 1185 0.26841 1.9 -31.5 2.4 18.4 -6.3 -4.5 1.8 3.7 -6.8 -2.9 2.4 3.0 -5.1 2.9 -0.56 -1.47 1182 0.30142 1.9 -31.9 2.4 18.6 -6.4 -4.5 1.8 3.7 -6.8 -2.9 2.4 3.0 -5.2 2.9 -0.56 -1.47 1190 0.29643 1.9 -32.5 2.4 18.9 -6.4 -4.6 1.8 3.8 -6.8 -3.0 2.4 3.1 -5.2 2.9 -0.56 -1.46 1206 0.30244 1.9 -32.8 2.5 19.2 -6.6 -4.7 1.9 3.8 -7.0 -2.4 2.5 3.1 -5.2 3.0 -0.58 -1.43 1202 0.33145 2.1 -33.3 2.5 19.4 -6.6 -4.7 1.9 3.9 -6.8 -2.7 2.5 3.2 -5.2 3.0 -0.58 -1.42 1213 0.33746 1.9 -33.7 2.5 19.6 -6.7 -4.7 1.9 3.9 -6.7 -2.6 2.6 3.3 -5.2 3.1 -0.60 -1.39 1212 0.35947 1.9 -34.0 2.6 19.9 -6.7 -4.8 1.9 4.0 -6.7 -2.6 2.6 3.2 -5.2 3.1 -0.59 -1.41 1217 0.34748 2.1 -34.4 2.6 20.1 -6.7 -4.9 1.9 4.0 -6.8 -2.6 2.6 3.3 -5.3 3.2 -0.60 -1.39 1236 0.35949 2.1 -34.7 2.7 20.3 -6.9 -5.0 1.9 4.1 -6.8 -2.4 2.7 3.5 -5.3 3.2 -0.62 -1.37 1244 0.38350 2.1 -35.0 2.7 20.6 -6.9 -5.0 2.0 4.1 -6.5 -2.3 2.8 3.5 -5.2 3.3 -0.63 -1.34 1234 0.40851 2.1 -35.6 2.8 20.9 -7.0 -5.1 2.0 4.1 -6.5 -2.3 2.8 3.8 -5.2 3.4 -0.65 -1.32 1248 0.43152 2.1 -36.2 2.8 21.0 -7.1 -5.1 2.0 4.2 -6.5 -2.1 2.8 3.7 -5.2 3.4 -0.65 -1.31 1244 0.43553 1.9 -36.0 2.9 21.2 -7.1 -5.2 2.0 4.2 -6.4 -1.8 2.9 3.8 -5.1 3.4 -0.67 -1.28 1237 0.47854 1.8 -37.1 2.9 21.5 -7.1 -5.2 2.0 4.3 -6.7 -2.1 2.8 3.8 -5.3 3.4 -0.65 -1.31 1267 0.44155 2.1 -37.1 3.0 21.7 -7.3 -5.3 2.0 4.3 -6.4 -2.1 2.8 3.9 -5.3 3.5 -0.66 -1.29 1270 0.46356 1.8 -37.7 3.0 22.0 -7.3 -5.4 2.0 4.3 -6.7 -2.0 2.9 3.8 -5.3 3.5 -0.66 -1.30 1280 0.45157 1.9 -38.0 3.0 22.2 -7.4 -5.4 2.1 4.4 -6.7 -2.1 2.9 3.9 -5.4 3.6 -0.66 -1.30 1296 0.45558 1.8 -38.5 3.1 22.4 -7.4 -5.5 2.1 4.4 -6.7 -2.3 3.0 3.9 -5.5 3.6 -0.66 -1.30 1312 0.45359 1.8 -39.0 3.1 22.7 -7.6 -5.6 2.1 4.4 -6.8 -2.1 3.0 4.0 -5.5 3.6 -0.66 -1.30 1326 0.44860 1.6 -39.3 3.2 22.9 -7.6 -5.6 2.1 4.5 -6.8 -2.1 2.9 3.9 -5.5 3.6 -0.66 -1.30 1328 0.45061 1.3 -40.2 3.2 23.0 -7.7 -5.7 2.1 4.5 -7.0 -2.3 3.0 4.0 -5.7 3.7 -0.65 -1.31 1352 0.43662 1.9 -39.9 3.3 23.4 -7.7 -5.7 2.1 4.6 -7.0 -2.1 3.0 4.1 -5.6 3.7 -0.66 -1.29 1355 0.46263 1.6 -40.2 3.3 23.6 -7.8 -5.8 2.1 4.6 -7.3 -2.4 3.0 4.1 -5.8 3.8 -0.65 -1.32 1393 0.43364 1.6 -40.5 3.4 23.8 -7.8 -5.8 2.2 4.6 -7.1 -2.4 3.1 4.0 -5.8 3.8 -0.65 -1.31 1385 0.44365 1.6 -41.2 3.4 24.0 -8.0 -5.9 2.2 4.7 -7.1 -2.4 3.1 4.2 -5.9 3.8 -0.65 -1.30 1405 0.44566 1.8 -41.1 3.5 24.2 -8.0 -6.0 2.2 4.7 -7.1 -2.6 3.1 4.2 -5.9 3.9 -0.65 -1.31 1422 0.444
Mean
Normalized Vertical and Horizontal Deformation ArraysKL 52-34 Sample #2 KL 52-34 Sample #5 KL 52-34 Sample #7 Trimmed
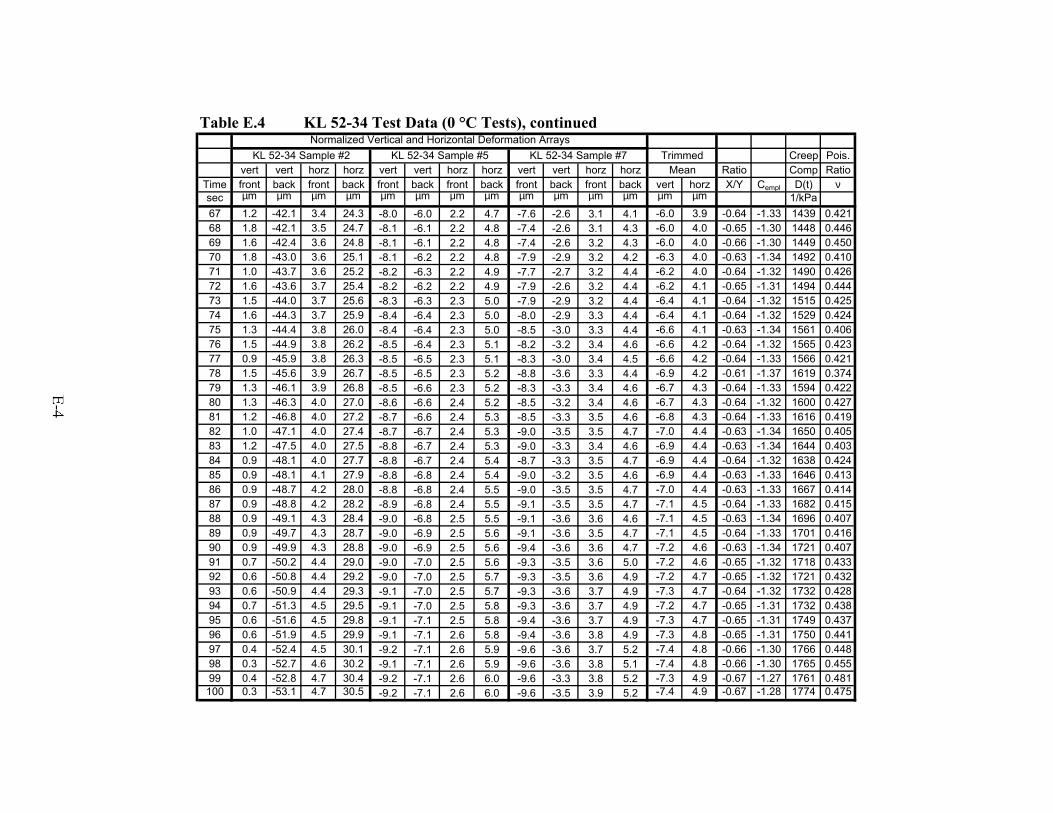
Table E.4 KL 52-34 Test Data (0 °C Tests), continued
Creep Pois.vert vert horz horz vert vert horz horz vert vert horz horz Ratio Comp Ratio
Time front back front back front back front back front back front back vert horz X/Y Cempl D(t) νsec µm µm µm µm µm µm µm µm µm µm µm µm µm µm 1/kPa67 1.2 -42.1 3.4 24.3 -8.0 -6.0 2.2 4.7 -7.6 -2.6 3.1 4.1 -6.0 3.9 -0.64 -1.33 1439 0.42168 1.8 -42.1 3.5 24.7 -8.1 -6.1 2.2 4.8 -7.4 -2.6 3.1 4.3 -6.0 4.0 -0.65 -1.30 1448 0.44669 1.6 -42.4 3.6 24.8 -8.1 -6.1 2.2 4.8 -7.4 -2.6 3.2 4.3 -6.0 4.0 -0.66 -1.30 1449 0.45070 1.8 -43.0 3.6 25.1 -8.1 -6.2 2.2 4.8 -7.9 -2.9 3.2 4.2 -6.3 4.0 -0.63 -1.34 1492 0.41071 1.0 -43.7 3.6 25.2 -8.2 -6.3 2.2 4.9 -7.7 -2.7 3.2 4.4 -6.2 4.0 -0.64 -1.32 1490 0.42672 1.6 -43.6 3.7 25.4 -8.2 -6.2 2.2 4.9 -7.9 -2.6 3.2 4.4 -6.2 4.1 -0.65 -1.31 1494 0.44473 1.5 -44.0 3.7 25.6 -8.3 -6.3 2.3 5.0 -7.9 -2.9 3.2 4.4 -6.4 4.1 -0.64 -1.32 1515 0.42574 1.6 -44.3 3.7 25.9 -8.4 -6.4 2.3 5.0 -8.0 -2.9 3.3 4.4 -6.4 4.1 -0.64 -1.32 1529 0.42475 1.3 -44.4 3.8 26.0 -8.4 -6.4 2.3 5.0 -8.5 -3.0 3.3 4.4 -6.6 4.1 -0.63 -1.34 1561 0.40676 1.5 -44.9 3.8 26.2 -8.5 -6.4 2.3 5.1 -8.2 -3.2 3.4 4.6 -6.6 4.2 -0.64 -1.32 1565 0.42377 0.9 -45.9 3.8 26.3 -8.5 -6.5 2.3 5.1 -8.3 -3.0 3.4 4.5 -6.6 4.2 -0.64 -1.33 1566 0.42178 1.5 -45.6 3.9 26.7 -8.5 -6.5 2.3 5.2 -8.8 -3.6 3.3 4.4 -6.9 4.2 -0.61 -1.37 1619 0.37479 1.3 -46.1 3.9 26.8 -8.5 -6.6 2.3 5.2 -8.3 -3.3 3.4 4.6 -6.7 4.3 -0.64 -1.33 1594 0.42280 1.3 -46.3 4.0 27.0 -8.6 -6.6 2.4 5.2 -8.5 -3.2 3.4 4.6 -6.7 4.3 -0.64 -1.32 1600 0.42781 1.2 -46.8 4.0 27.2 -8.7 -6.6 2.4 5.3 -8.5 -3.3 3.5 4.6 -6.8 4.3 -0.64 -1.33 1616 0.41982 1.0 -47.1 4.0 27.4 -8.7 -6.7 2.4 5.3 -9.0 -3.5 3.5 4.7 -7.0 4.4 -0.63 -1.34 1650 0.40583 1.2 -47.5 4.0 27.5 -8.8 -6.7 2.4 5.3 -9.0 -3.3 3.4 4.6 -6.9 4.4 -0.63 -1.34 1644 0.40384 0.9 -48.1 4.0 27.7 -8.8 -6.7 2.4 5.4 -8.7 -3.3 3.5 4.7 -6.9 4.4 -0.64 -1.32 1638 0.42485 0.9 -48.1 4.1 27.9 -8.8 -6.8 2.4 5.4 -9.0 -3.2 3.5 4.6 -6.9 4.4 -0.63 -1.33 1646 0.41386 0.9 -48.7 4.2 28.0 -8.8 -6.8 2.4 5.5 -9.0 -3.5 3.5 4.7 -7.0 4.4 -0.63 -1.33 1667 0.41487 0.9 -48.8 4.2 28.2 -8.9 -6.8 2.4 5.5 -9.1 -3.5 3.5 4.7 -7.1 4.5 -0.64 -1.33 1682 0.41588 0.9 -49.1 4.3 28.4 -9.0 -6.8 2.5 5.5 -9.1 -3.6 3.6 4.6 -7.1 4.5 -0.63 -1.34 1696 0.40789 0.9 -49.7 4.3 28.7 -9.0 -6.9 2.5 5.6 -9.1 -3.6 3.5 4.7 -7.1 4.5 -0.64 -1.33 1701 0.41690 0.9 -49.9 4.3 28.8 -9.0 -6.9 2.5 5.6 -9.4 -3.6 3.6 4.7 -7.2 4.6 -0.63 -1.34 1721 0.40791 0.7 -50.2 4.4 29.0 -9.0 -7.0 2.5 5.6 -9.3 -3.5 3.6 5.0 -7.2 4.6 -0.65 -1.32 1718 0.43392 0.6 -50.8 4.4 29.2 -9.0 -7.0 2.5 5.7 -9.3 -3.5 3.6 4.9 -7.2 4.7 -0.65 -1.32 1721 0.43293 0.6 -50.9 4.4 29.3 -9.1 -7.0 2.5 5.7 -9.3 -3.6 3.7 4.9 -7.3 4.7 -0.64 -1.32 1732 0.42894 0.7 -51.3 4.5 29.5 -9.1 -7.0 2.5 5.8 -9.3 -3.6 3.7 4.9 -7.2 4.7 -0.65 -1.31 1732 0.43895 0.6 -51.6 4.5 29.8 -9.1 -7.1 2.5 5.8 -9.4 -3.6 3.7 4.9 -7.3 4.7 -0.65 -1.31 1749 0.43796 0.6 -51.9 4.5 29.9 -9.1 -7.1 2.6 5.8 -9.4 -3.6 3.8 4.9 -7.3 4.8 -0.65 -1.31 1750 0.44197 0.4 -52.4 4.5 30.1 -9.2 -7.1 2.6 5.9 -9.6 -3.6 3.7 5.2 -7.4 4.8 -0.66 -1.30 1766 0.44898 0.3 -52.7 4.6 30.2 -9.1 -7.1 2.6 5.9 -9.6 -3.6 3.8 5.1 -7.4 4.8 -0.66 -1.30 1765 0.45599 0.4 -52.8 4.7 30.4 -9.2 -7.1 2.6 6.0 -9.6 -3.3 3.8 5.2 -7.3 4.9 -0.67 -1.27 1761 0.481100 0.3 -53.1 4.7 30.5 -9.2 -7.1 2.6 6.0 -9.6 -3.5 3.9 5.2 -7.4 4.9 -0.67 -1.28 1774 0.475
Mean
Normalized Vertical and Horizontal Deformation ArraysKL 52-34 Sample #2 KL 52-34 Sample #5 KL 52-34 Sample #7 Trimmed
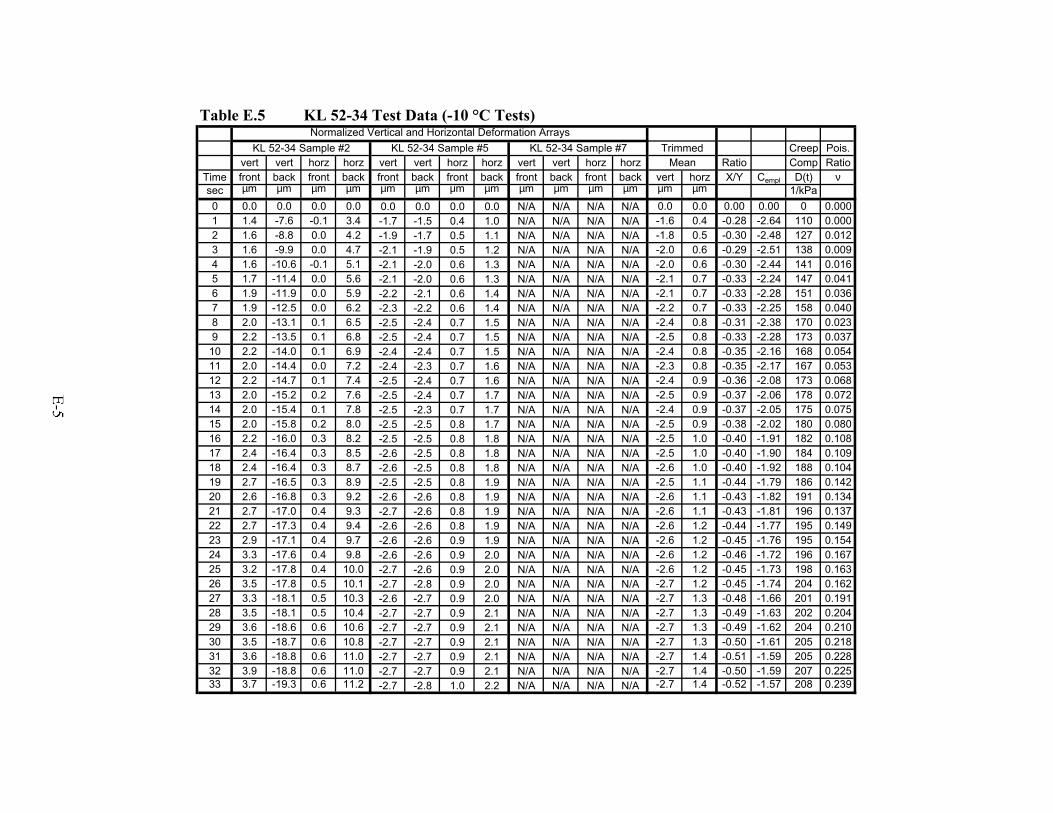
Table E.5 KL 52-34 Test Data (-10 °C Tests)
Creep Pois.vert vert horz horz vert vert horz horz vert vert horz horz Ratio Comp Ratio
Time front back front back front back front back front back front back vert horz X/Y Cempl D(t) νsec µm µm µm µm µm µm µm µm µm µm µm µm µm µm 1/kPa0 0.0 0.0 0.0 0.0 0.0 0.0 0.0 0.0 N/A N/A N/A N/A 0.0 0.0 0.00 0.00 0 0.0001 1.4 -7.6 -0.1 3.4 -1.7 -1.5 0.4 1.0 N/A N/A N/A N/A -1.6 0.4 -0.28 -2.64 110 0.0002 1.6 -8.8 0.0 4.2 -1.9 -1.7 0.5 1.1 N/A N/A N/A N/A -1.8 0.5 -0.30 -2.48 127 0.0123 1.6 -9.9 0.0 4.7 -2.1 -1.9 0.5 1.2 N/A N/A N/A N/A -2.0 0.6 -0.29 -2.51 138 0.0094 1.6 -10.6 -0.1 5.1 -2.1 -2.0 0.6 1.3 N/A N/A N/A N/A -2.0 0.6 -0.30 -2.44 141 0.0165 1.7 -11.4 0.0 5.6 -2.1 -2.0 0.6 1.3 N/A N/A N/A N/A -2.1 0.7 -0.33 -2.24 147 0.0416 1.9 -11.9 0.0 5.9 -2.2 -2.1 0.6 1.4 N/A N/A N/A N/A -2.1 0.7 -0.33 -2.28 151 0.0367 1.9 -12.5 0.0 6.2 -2.3 -2.2 0.6 1.4 N/A N/A N/A N/A -2.2 0.7 -0.33 -2.25 158 0.0408 2.0 -13.1 0.1 6.5 -2.5 -2.4 0.7 1.5 N/A N/A N/A N/A -2.4 0.8 -0.31 -2.38 170 0.0239 2.2 -13.5 0.1 6.8 -2.5 -2.4 0.7 1.5 N/A N/A N/A N/A -2.5 0.8 -0.33 -2.28 173 0.037
10 2.2 -14.0 0.1 6.9 -2.4 -2.4 0.7 1.5 N/A N/A N/A N/A -2.4 0.8 -0.35 -2.16 168 0.05411 2.0 -14.4 0.0 7.2 -2.4 -2.3 0.7 1.6 N/A N/A N/A N/A -2.3 0.8 -0.35 -2.17 167 0.05312 2.2 -14.7 0.1 7.4 -2.5 -2.4 0.7 1.6 N/A N/A N/A N/A -2.4 0.9 -0.36 -2.08 173 0.06813 2.0 -15.2 0.2 7.6 -2.5 -2.4 0.7 1.7 N/A N/A N/A N/A -2.5 0.9 -0.37 -2.06 178 0.07214 2.0 -15.4 0.1 7.8 -2.5 -2.3 0.7 1.7 N/A N/A N/A N/A -2.4 0.9 -0.37 -2.05 175 0.07515 2.0 -15.8 0.2 8.0 -2.5 -2.5 0.8 1.7 N/A N/A N/A N/A -2.5 0.9 -0.38 -2.02 180 0.08016 2.2 -16.0 0.3 8.2 -2.5 -2.5 0.8 1.8 N/A N/A N/A N/A -2.5 1.0 -0.40 -1.91 182 0.10817 2.4 -16.4 0.3 8.5 -2.6 -2.5 0.8 1.8 N/A N/A N/A N/A -2.5 1.0 -0.40 -1.90 184 0.10918 2.4 -16.4 0.3 8.7 -2.6 -2.5 0.8 1.8 N/A N/A N/A N/A -2.6 1.0 -0.40 -1.92 188 0.10419 2.7 -16.5 0.3 8.9 -2.5 -2.5 0.8 1.9 N/A N/A N/A N/A -2.5 1.1 -0.44 -1.79 186 0.14220 2.6 -16.8 0.3 9.2 -2.6 -2.6 0.8 1.9 N/A N/A N/A N/A -2.6 1.1 -0.43 -1.82 191 0.13421 2.7 -17.0 0.4 9.3 -2.7 -2.6 0.8 1.9 N/A N/A N/A N/A -2.6 1.1 -0.43 -1.81 196 0.13722 2.7 -17.3 0.4 9.4 -2.6 -2.6 0.8 1.9 N/A N/A N/A N/A -2.6 1.2 -0.44 -1.77 195 0.14923 2.9 -17.1 0.4 9.7 -2.6 -2.6 0.9 1.9 N/A N/A N/A N/A -2.6 1.2 -0.45 -1.76 195 0.15424 3.3 -17.6 0.4 9.8 -2.6 -2.6 0.9 2.0 N/A N/A N/A N/A -2.6 1.2 -0.46 -1.72 196 0.16725 3.2 -17.8 0.4 10.0 -2.7 -2.6 0.9 2.0 N/A N/A N/A N/A -2.6 1.2 -0.45 -1.73 198 0.16326 3.5 -17.8 0.5 10.1 -2.7 -2.8 0.9 2.0 N/A N/A N/A N/A -2.7 1.2 -0.45 -1.74 204 0.16227 3.3 -18.1 0.5 10.3 -2.6 -2.7 0.9 2.0 N/A N/A N/A N/A -2.7 1.3 -0.48 -1.66 201 0.19128 3.5 -18.1 0.5 10.4 -2.7 -2.7 0.9 2.1 N/A N/A N/A N/A -2.7 1.3 -0.49 -1.63 202 0.20429 3.6 -18.6 0.6 10.6 -2.7 -2.7 0.9 2.1 N/A N/A N/A N/A -2.7 1.3 -0.49 -1.62 204 0.21030 3.5 -18.7 0.6 10.8 -2.7 -2.7 0.9 2.1 N/A N/A N/A N/A -2.7 1.3 -0.50 -1.61 205 0.21831 3.6 -18.8 0.6 11.0 -2.7 -2.7 0.9 2.1 N/A N/A N/A N/A -2.7 1.4 -0.51 -1.59 205 0.22832 3.9 -18.8 0.6 11.0 -2.7 -2.7 0.9 2.1 N/A N/A N/A N/A -2.7 1.4 -0.50 -1.59 207 0.22533 3.7 -19.3 0.6 11.2 -2.7 -2.8 1.0 2.2 N/A N/A N/A N/A -2.7 1.4 -0.52 -1.57 208 0.239
Mean
Normalized Vertical and Horizontal Deformation ArraysKL 52-34 Sample #2 KL 52-34 Sample #5 KL 52-34 Sample #7 Trimmed
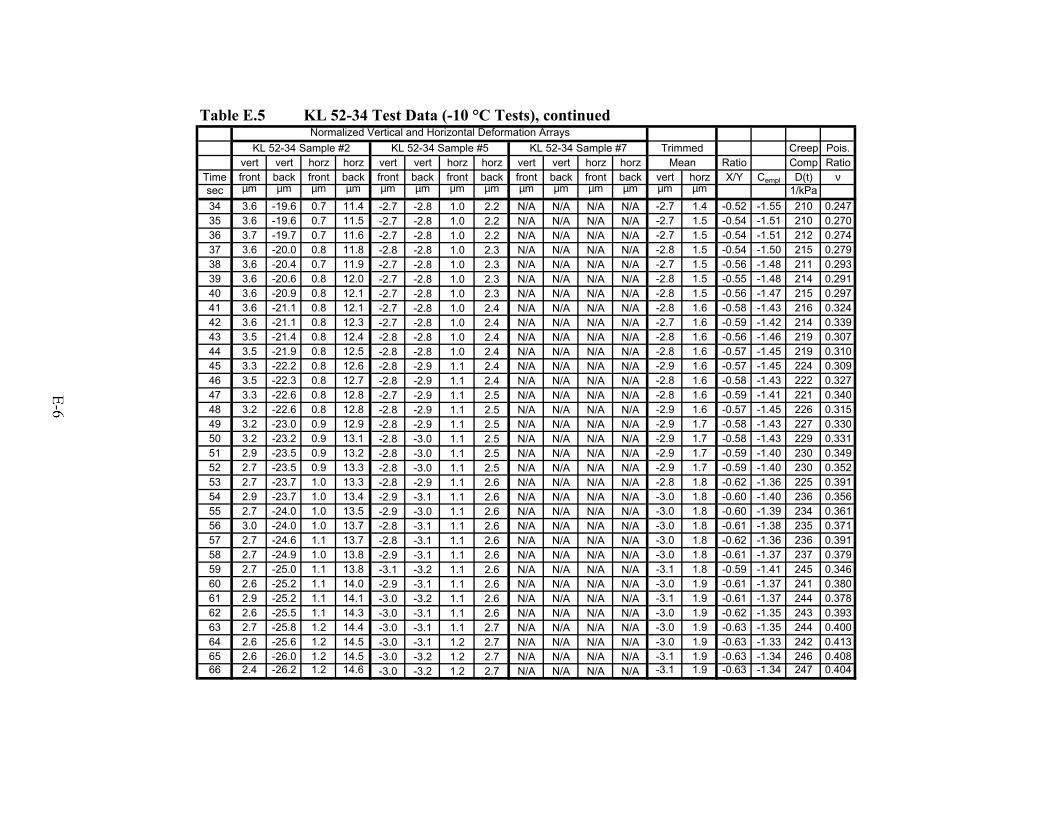
Table E.5 KL 52-34 Test Data (-10 °C Tests), continued
Creep Pois.vert vert horz horz vert vert horz horz vert vert horz horz Ratio Comp Ratio
Time front back front back front back front back front back front back vert horz X/Y Cempl D(t) νsec µm µm µm µm µm µm µm µm µm µm µm µm µm µm 1/kPa34 3.6 -19.6 0.7 11.4 -2.7 -2.8 1.0 2.2 N/A N/A N/A N/A -2.7 1.4 -0.52 -1.55 210 0.24735 3.6 -19.6 0.7 11.5 -2.7 -2.8 1.0 2.2 N/A N/A N/A N/A -2.7 1.5 -0.54 -1.51 210 0.27036 3.7 -19.7 0.7 11.6 -2.7 -2.8 1.0 2.2 N/A N/A N/A N/A -2.7 1.5 -0.54 -1.51 212 0.27437 3.6 -20.0 0.8 11.8 -2.8 -2.8 1.0 2.3 N/A N/A N/A N/A -2.8 1.5 -0.54 -1.50 215 0.27938 3.6 -20.4 0.7 11.9 -2.7 -2.8 1.0 2.3 N/A N/A N/A N/A -2.7 1.5 -0.56 -1.48 211 0.29339 3.6 -20.6 0.8 12.0 -2.7 -2.8 1.0 2.3 N/A N/A N/A N/A -2.8 1.5 -0.55 -1.48 214 0.29140 3.6 -20.9 0.8 12.1 -2.7 -2.8 1.0 2.3 N/A N/A N/A N/A -2.8 1.5 -0.56 -1.47 215 0.29741 3.6 -21.1 0.8 12.1 -2.7 -2.8 1.0 2.4 N/A N/A N/A N/A -2.8 1.6 -0.58 -1.43 216 0.32442 3.6 -21.1 0.8 12.3 -2.7 -2.8 1.0 2.4 N/A N/A N/A N/A -2.7 1.6 -0.59 -1.42 214 0.33943 3.5 -21.4 0.8 12.4 -2.8 -2.8 1.0 2.4 N/A N/A N/A N/A -2.8 1.6 -0.56 -1.46 219 0.30744 3.5 -21.9 0.8 12.5 -2.8 -2.8 1.0 2.4 N/A N/A N/A N/A -2.8 1.6 -0.57 -1.45 219 0.31045 3.3 -22.2 0.8 12.6 -2.8 -2.9 1.1 2.4 N/A N/A N/A N/A -2.9 1.6 -0.57 -1.45 224 0.30946 3.5 -22.3 0.8 12.7 -2.8 -2.9 1.1 2.4 N/A N/A N/A N/A -2.8 1.6 -0.58 -1.43 222 0.32747 3.3 -22.6 0.8 12.8 -2.7 -2.9 1.1 2.5 N/A N/A N/A N/A -2.8 1.6 -0.59 -1.41 221 0.34048 3.2 -22.6 0.8 12.8 -2.8 -2.9 1.1 2.5 N/A N/A N/A N/A -2.9 1.6 -0.57 -1.45 226 0.31549 3.2 -23.0 0.9 12.9 -2.8 -2.9 1.1 2.5 N/A N/A N/A N/A -2.9 1.7 -0.58 -1.43 227 0.33050 3.2 -23.2 0.9 13.1 -2.8 -3.0 1.1 2.5 N/A N/A N/A N/A -2.9 1.7 -0.58 -1.43 229 0.33151 2.9 -23.5 0.9 13.2 -2.8 -3.0 1.1 2.5 N/A N/A N/A N/A -2.9 1.7 -0.59 -1.40 230 0.34952 2.7 -23.5 0.9 13.3 -2.8 -3.0 1.1 2.5 N/A N/A N/A N/A -2.9 1.7 -0.59 -1.40 230 0.35253 2.7 -23.7 1.0 13.3 -2.8 -2.9 1.1 2.6 N/A N/A N/A N/A -2.8 1.8 -0.62 -1.36 225 0.39154 2.9 -23.7 1.0 13.4 -2.9 -3.1 1.1 2.6 N/A N/A N/A N/A -3.0 1.8 -0.60 -1.40 236 0.35655 2.7 -24.0 1.0 13.5 -2.9 -3.0 1.1 2.6 N/A N/A N/A N/A -3.0 1.8 -0.60 -1.39 234 0.36156 3.0 -24.0 1.0 13.7 -2.8 -3.1 1.1 2.6 N/A N/A N/A N/A -3.0 1.8 -0.61 -1.38 235 0.37157 2.7 -24.6 1.1 13.7 -2.8 -3.1 1.1 2.6 N/A N/A N/A N/A -3.0 1.8 -0.62 -1.36 236 0.39158 2.7 -24.9 1.0 13.8 -2.9 -3.1 1.1 2.6 N/A N/A N/A N/A -3.0 1.8 -0.61 -1.37 237 0.37959 2.7 -25.0 1.1 13.8 -3.1 -3.2 1.1 2.6 N/A N/A N/A N/A -3.1 1.8 -0.59 -1.41 245 0.34660 2.6 -25.2 1.1 14.0 -2.9 -3.1 1.1 2.6 N/A N/A N/A N/A -3.0 1.9 -0.61 -1.37 241 0.38061 2.9 -25.2 1.1 14.1 -3.0 -3.2 1.1 2.6 N/A N/A N/A N/A -3.1 1.9 -0.61 -1.37 244 0.37862 2.6 -25.5 1.1 14.3 -3.0 -3.1 1.1 2.6 N/A N/A N/A N/A -3.0 1.9 -0.62 -1.35 243 0.39363 2.7 -25.8 1.2 14.4 -3.0 -3.1 1.1 2.7 N/A N/A N/A N/A -3.0 1.9 -0.63 -1.35 244 0.40064 2.6 -25.6 1.2 14.5 -3.0 -3.1 1.2 2.7 N/A N/A N/A N/A -3.0 1.9 -0.63 -1.33 242 0.41365 2.6 -26.0 1.2 14.5 -3.0 -3.2 1.2 2.7 N/A N/A N/A N/A -3.1 1.9 -0.63 -1.34 246 0.40866 2.4 -26.2 1.2 14.6 -3.0 -3.2 1.2 2.7 N/A N/A N/A N/A -3.1 1.9 -0.63 -1.34 247 0.404
Mean
Normalized Vertical and Horizontal Deformation ArraysKL 52-34 Sample #2 KL 52-34 Sample #5 KL 52-34 Sample #7 Trimmed
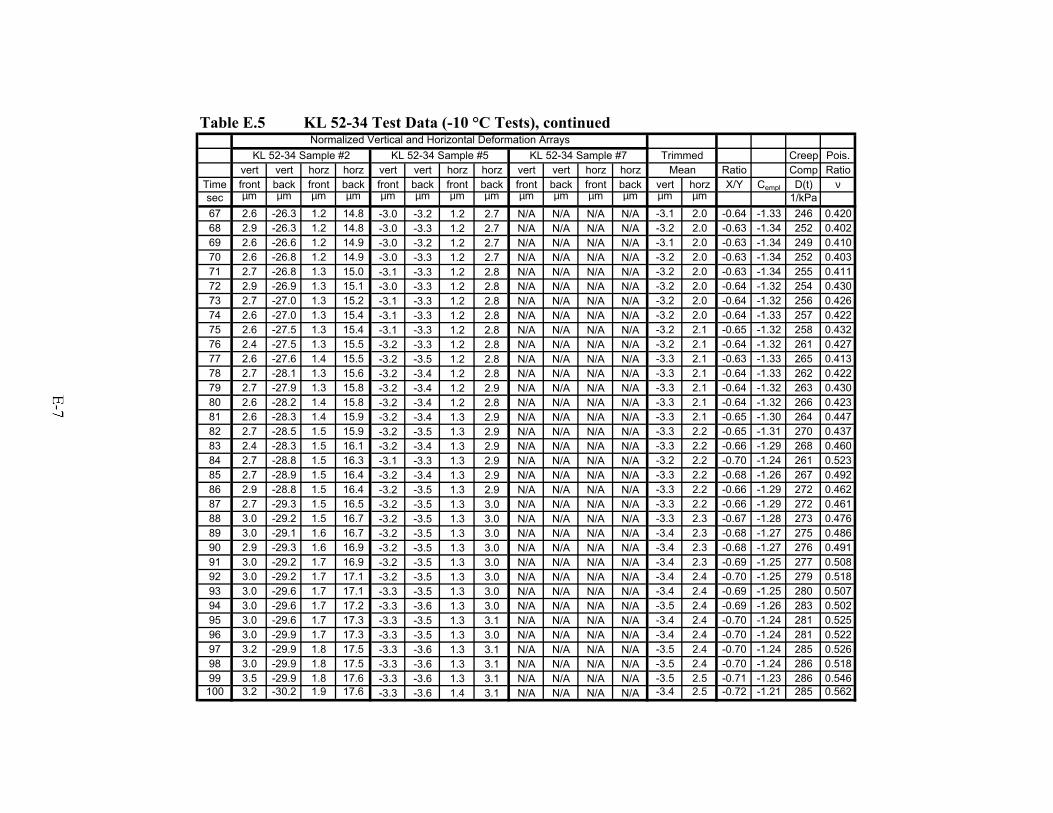
Table E.5 KL 52-34 Test Data (-10 °C Tests), continued
Creep Pois.vert vert horz horz vert vert horz horz vert vert horz horz Ratio Comp Ratio
Time front back front back front back front back front back front back vert horz X/Y Cempl D(t) νsec µm µm µm µm µm µm µm µm µm µm µm µm µm µm 1/kPa67 2.6 -26.3 1.2 14.8 -3.0 -3.2 1.2 2.7 N/A N/A N/A N/A -3.1 2.0 -0.64 -1.33 246 0.42068 2.9 -26.3 1.2 14.8 -3.0 -3.3 1.2 2.7 N/A N/A N/A N/A -3.2 2.0 -0.63 -1.34 252 0.40269 2.6 -26.6 1.2 14.9 -3.0 -3.2 1.2 2.7 N/A N/A N/A N/A -3.1 2.0 -0.63 -1.34 249 0.41070 2.6 -26.8 1.2 14.9 -3.0 -3.3 1.2 2.7 N/A N/A N/A N/A -3.2 2.0 -0.63 -1.34 252 0.40371 2.7 -26.8 1.3 15.0 -3.1 -3.3 1.2 2.8 N/A N/A N/A N/A -3.2 2.0 -0.63 -1.34 255 0.41172 2.9 -26.9 1.3 15.1 -3.0 -3.3 1.2 2.8 N/A N/A N/A N/A -3.2 2.0 -0.64 -1.32 254 0.43073 2.7 -27.0 1.3 15.2 -3.1 -3.3 1.2 2.8 N/A N/A N/A N/A -3.2 2.0 -0.64 -1.32 256 0.42674 2.6 -27.0 1.3 15.4 -3.1 -3.3 1.2 2.8 N/A N/A N/A N/A -3.2 2.0 -0.64 -1.33 257 0.42275 2.6 -27.5 1.3 15.4 -3.1 -3.3 1.2 2.8 N/A N/A N/A N/A -3.2 2.1 -0.65 -1.32 258 0.43276 2.4 -27.5 1.3 15.5 -3.2 -3.3 1.2 2.8 N/A N/A N/A N/A -3.2 2.1 -0.64 -1.32 261 0.42777 2.6 -27.6 1.4 15.5 -3.2 -3.5 1.2 2.8 N/A N/A N/A N/A -3.3 2.1 -0.63 -1.33 265 0.41378 2.7 -28.1 1.3 15.6 -3.2 -3.4 1.2 2.8 N/A N/A N/A N/A -3.3 2.1 -0.64 -1.33 262 0.42279 2.7 -27.9 1.3 15.8 -3.2 -3.4 1.2 2.9 N/A N/A N/A N/A -3.3 2.1 -0.64 -1.32 263 0.43080 2.6 -28.2 1.4 15.8 -3.2 -3.4 1.2 2.8 N/A N/A N/A N/A -3.3 2.1 -0.64 -1.32 266 0.42381 2.6 -28.3 1.4 15.9 -3.2 -3.4 1.3 2.9 N/A N/A N/A N/A -3.3 2.1 -0.65 -1.30 264 0.44782 2.7 -28.5 1.5 15.9 -3.2 -3.5 1.3 2.9 N/A N/A N/A N/A -3.3 2.2 -0.65 -1.31 270 0.43783 2.4 -28.3 1.5 16.1 -3.2 -3.4 1.3 2.9 N/A N/A N/A N/A -3.3 2.2 -0.66 -1.29 268 0.46084 2.7 -28.8 1.5 16.3 -3.1 -3.3 1.3 2.9 N/A N/A N/A N/A -3.2 2.2 -0.70 -1.24 261 0.52385 2.7 -28.9 1.5 16.4 -3.2 -3.4 1.3 2.9 N/A N/A N/A N/A -3.3 2.2 -0.68 -1.26 267 0.49286 2.9 -28.8 1.5 16.4 -3.2 -3.5 1.3 2.9 N/A N/A N/A N/A -3.3 2.2 -0.66 -1.29 272 0.46287 2.7 -29.3 1.5 16.5 -3.2 -3.5 1.3 3.0 N/A N/A N/A N/A -3.3 2.2 -0.66 -1.29 272 0.46188 3.0 -29.2 1.5 16.7 -3.2 -3.5 1.3 3.0 N/A N/A N/A N/A -3.3 2.3 -0.67 -1.28 273 0.47689 3.0 -29.1 1.6 16.7 -3.2 -3.5 1.3 3.0 N/A N/A N/A N/A -3.4 2.3 -0.68 -1.27 275 0.48690 2.9 -29.3 1.6 16.9 -3.2 -3.5 1.3 3.0 N/A N/A N/A N/A -3.4 2.3 -0.68 -1.27 276 0.49191 3.0 -29.2 1.7 16.9 -3.2 -3.5 1.3 3.0 N/A N/A N/A N/A -3.4 2.3 -0.69 -1.25 277 0.50892 3.0 -29.2 1.7 17.1 -3.2 -3.5 1.3 3.0 N/A N/A N/A N/A -3.4 2.4 -0.70 -1.25 279 0.51893 3.0 -29.6 1.7 17.1 -3.3 -3.5 1.3 3.0 N/A N/A N/A N/A -3.4 2.4 -0.69 -1.25 280 0.50794 3.0 -29.6 1.7 17.2 -3.3 -3.6 1.3 3.0 N/A N/A N/A N/A -3.5 2.4 -0.69 -1.26 283 0.50295 3.0 -29.6 1.7 17.3 -3.3 -3.5 1.3 3.1 N/A N/A N/A N/A -3.4 2.4 -0.70 -1.24 281 0.52596 3.0 -29.9 1.7 17.3 -3.3 -3.5 1.3 3.0 N/A N/A N/A N/A -3.4 2.4 -0.70 -1.24 281 0.52297 3.2 -29.9 1.8 17.5 -3.3 -3.6 1.3 3.1 N/A N/A N/A N/A -3.5 2.4 -0.70 -1.24 285 0.52698 3.0 -29.9 1.8 17.5 -3.3 -3.6 1.3 3.1 N/A N/A N/A N/A -3.5 2.4 -0.70 -1.24 286 0.51899 3.5 -29.9 1.8 17.6 -3.3 -3.6 1.3 3.1 N/A N/A N/A N/A -3.5 2.5 -0.71 -1.23 286 0.546100 3.2 -30.2 1.9 17.6 -3.3 -3.6 1.4 3.1 N/A N/A N/A N/A -3.4 2.5 -0.72 -1.21 285 0.562
Mean
Normalized Vertical and Horizontal Deformation ArraysKL 52-34 Sample #2 KL 52-34 Sample #5 KL 52-34 Sample #7 Trimmed
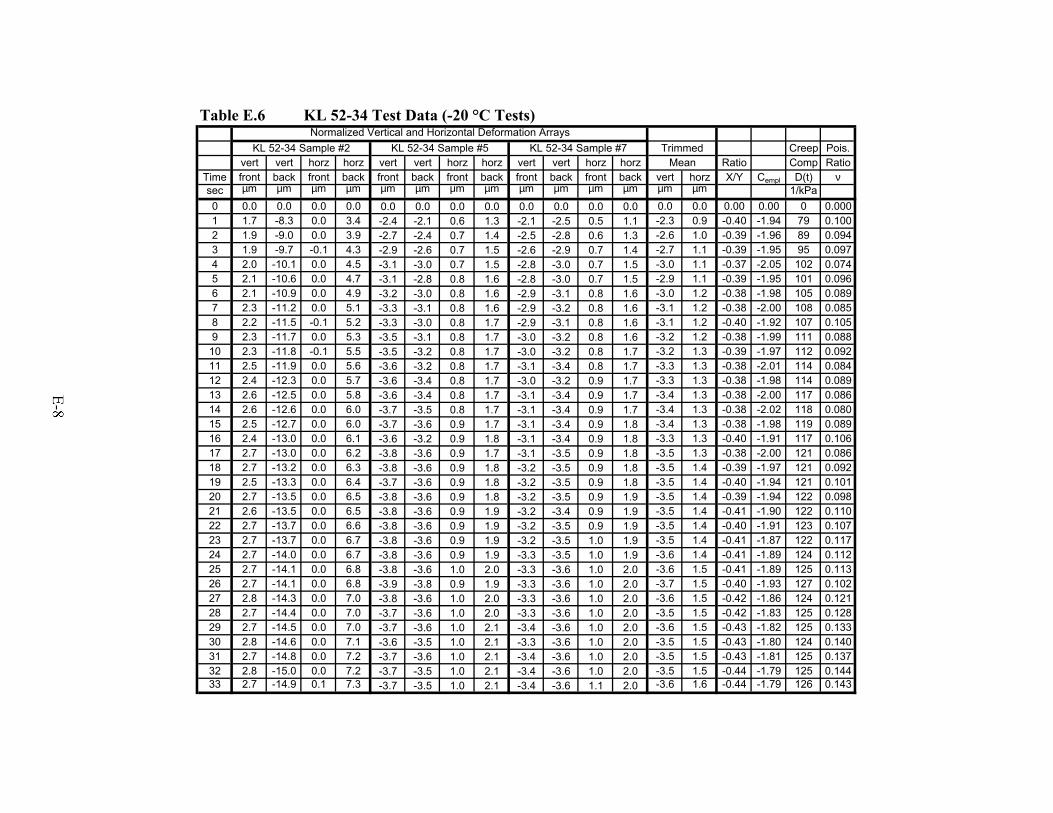
Table E.6 KL 52-34 Test Data (-20 °C Tests)
Creep Pois.vert vert horz horz vert vert horz horz vert vert horz horz Ratio Comp Ratio
Time front back front back front back front back front back front back vert horz X/Y Cempl D(t) νsec µm µm µm µm µm µm µm µm µm µm µm µm µm µm 1/kPa0 0.0 0.0 0.0 0.0 0.0 0.0 0.0 0.0 0.0 0.0 0.0 0.0 0.0 0.0 0.00 0.00 0 0.0001 1.7 -8.3 0.0 3.4 -2.4 -2.1 0.6 1.3 -2.1 -2.5 0.5 1.1 -2.3 0.9 -0.40 -1.94 79 0.1002 1.9 -9.0 0.0 3.9 -2.7 -2.4 0.7 1.4 -2.5 -2.8 0.6 1.3 -2.6 1.0 -0.39 -1.96 89 0.0943 1.9 -9.7 -0.1 4.3 -2.9 -2.6 0.7 1.5 -2.6 -2.9 0.7 1.4 -2.7 1.1 -0.39 -1.95 95 0.0974 2.0 -10.1 0.0 4.5 -3.1 -3.0 0.7 1.5 -2.8 -3.0 0.7 1.5 -3.0 1.1 -0.37 -2.05 102 0.0745 2.1 -10.6 0.0 4.7 -3.1 -2.8 0.8 1.6 -2.8 -3.0 0.7 1.5 -2.9 1.1 -0.39 -1.95 101 0.0966 2.1 -10.9 0.0 4.9 -3.2 -3.0 0.8 1.6 -2.9 -3.1 0.8 1.6 -3.0 1.2 -0.38 -1.98 105 0.0897 2.3 -11.2 0.0 5.1 -3.3 -3.1 0.8 1.6 -2.9 -3.2 0.8 1.6 -3.1 1.2 -0.38 -2.00 108 0.0858 2.2 -11.5 -0.1 5.2 -3.3 -3.0 0.8 1.7 -2.9 -3.1 0.8 1.6 -3.1 1.2 -0.40 -1.92 107 0.1059 2.3 -11.7 0.0 5.3 -3.5 -3.1 0.8 1.7 -3.0 -3.2 0.8 1.6 -3.2 1.2 -0.38 -1.99 111 0.088
10 2.3 -11.8 -0.1 5.5 -3.5 -3.2 0.8 1.7 -3.0 -3.2 0.8 1.7 -3.2 1.3 -0.39 -1.97 112 0.09211 2.5 -11.9 0.0 5.6 -3.6 -3.2 0.8 1.7 -3.1 -3.4 0.8 1.7 -3.3 1.3 -0.38 -2.01 114 0.08412 2.4 -12.3 0.0 5.7 -3.6 -3.4 0.8 1.7 -3.0 -3.2 0.9 1.7 -3.3 1.3 -0.38 -1.98 114 0.08913 2.6 -12.5 0.0 5.8 -3.6 -3.4 0.8 1.7 -3.1 -3.4 0.9 1.7 -3.4 1.3 -0.38 -2.00 117 0.08614 2.6 -12.6 0.0 6.0 -3.7 -3.5 0.8 1.7 -3.1 -3.4 0.9 1.7 -3.4 1.3 -0.38 -2.02 118 0.08015 2.5 -12.7 0.0 6.0 -3.7 -3.6 0.9 1.7 -3.1 -3.4 0.9 1.8 -3.4 1.3 -0.38 -1.98 119 0.08916 2.4 -13.0 0.0 6.1 -3.6 -3.2 0.9 1.8 -3.1 -3.4 0.9 1.8 -3.3 1.3 -0.40 -1.91 117 0.10617 2.7 -13.0 0.0 6.2 -3.8 -3.6 0.9 1.7 -3.1 -3.5 0.9 1.8 -3.5 1.3 -0.38 -2.00 121 0.08618 2.7 -13.2 0.0 6.3 -3.8 -3.6 0.9 1.8 -3.2 -3.5 0.9 1.8 -3.5 1.4 -0.39 -1.97 121 0.09219 2.5 -13.3 0.0 6.4 -3.7 -3.6 0.9 1.8 -3.2 -3.5 0.9 1.8 -3.5 1.4 -0.40 -1.94 121 0.10120 2.7 -13.5 0.0 6.5 -3.8 -3.6 0.9 1.8 -3.2 -3.5 0.9 1.9 -3.5 1.4 -0.39 -1.94 122 0.09821 2.6 -13.5 0.0 6.5 -3.8 -3.6 0.9 1.9 -3.2 -3.4 0.9 1.9 -3.5 1.4 -0.41 -1.90 122 0.11022 2.7 -13.7 0.0 6.6 -3.8 -3.6 0.9 1.9 -3.2 -3.5 0.9 1.9 -3.5 1.4 -0.40 -1.91 123 0.10723 2.7 -13.7 0.0 6.7 -3.8 -3.6 0.9 1.9 -3.2 -3.5 1.0 1.9 -3.5 1.4 -0.41 -1.87 122 0.11724 2.7 -14.0 0.0 6.7 -3.8 -3.6 0.9 1.9 -3.3 -3.5 1.0 1.9 -3.6 1.4 -0.41 -1.89 124 0.11225 2.7 -14.1 0.0 6.8 -3.8 -3.6 1.0 2.0 -3.3 -3.6 1.0 2.0 -3.6 1.5 -0.41 -1.89 125 0.11326 2.7 -14.1 0.0 6.8 -3.9 -3.8 0.9 1.9 -3.3 -3.6 1.0 2.0 -3.7 1.5 -0.40 -1.93 127 0.10227 2.8 -14.3 0.0 7.0 -3.8 -3.6 1.0 2.0 -3.3 -3.6 1.0 2.0 -3.6 1.5 -0.42 -1.86 124 0.12128 2.7 -14.4 0.0 7.0 -3.7 -3.6 1.0 2.0 -3.3 -3.6 1.0 2.0 -3.5 1.5 -0.42 -1.83 125 0.12829 2.7 -14.5 0.0 7.0 -3.7 -3.6 1.0 2.1 -3.4 -3.6 1.0 2.0 -3.6 1.5 -0.43 -1.82 125 0.13330 2.8 -14.6 0.0 7.1 -3.6 -3.5 1.0 2.1 -3.3 -3.6 1.0 2.0 -3.5 1.5 -0.43 -1.80 124 0.14031 2.7 -14.8 0.0 7.2 -3.7 -3.6 1.0 2.1 -3.4 -3.6 1.0 2.0 -3.5 1.5 -0.43 -1.81 125 0.13732 2.8 -15.0 0.0 7.2 -3.7 -3.5 1.0 2.1 -3.4 -3.6 1.0 2.0 -3.5 1.5 -0.44 -1.79 125 0.14433 2.7 -14.9 0.1 7.3 -3.7 -3.5 1.0 2.1 -3.4 -3.6 1.1 2.0 -3.6 1.6 -0.44 -1.79 126 0.143
Mean
Normalized Vertical and Horizontal Deformation ArraysKL 52-34 Sample #2 KL 52-34 Sample #5 KL 52-34 Sample #7 Trimmed
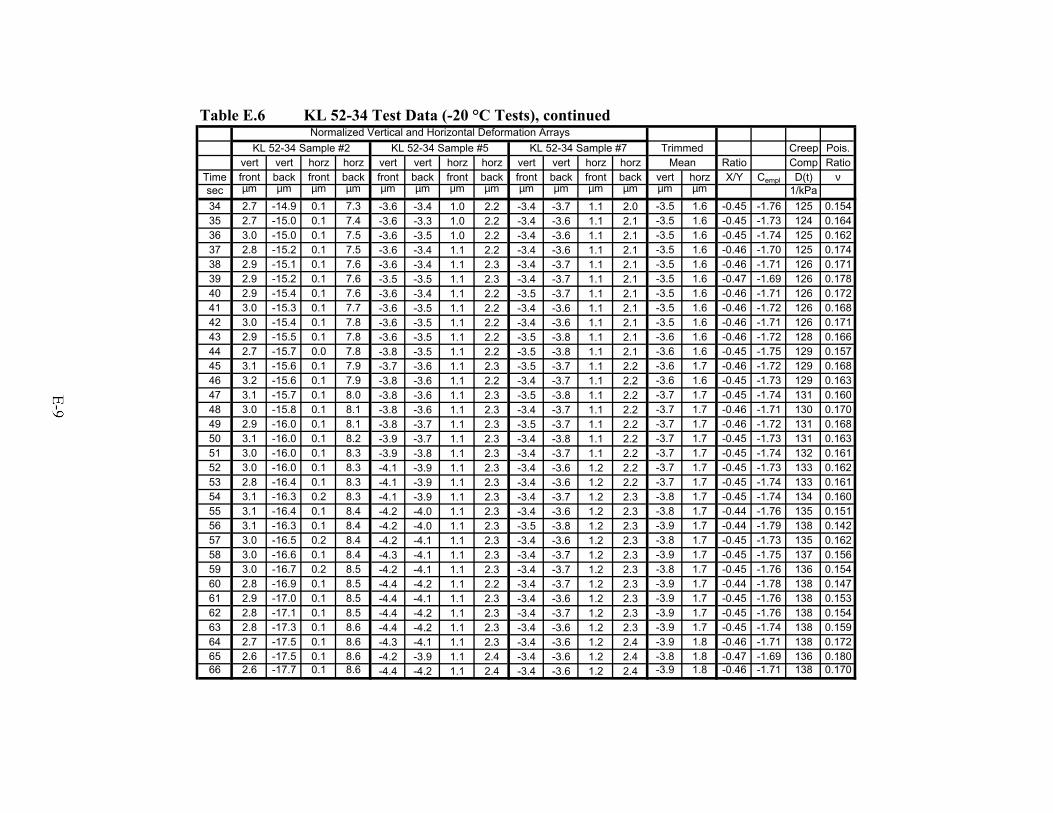
Table E.6 KL 52-34 Test Data (-20 °C Tests), continued
Creep Pois.vert vert horz horz vert vert horz horz vert vert horz horz Ratio Comp Ratio
Time front back front back front back front back front back front back vert horz X/Y Cempl D(t) νsec µm µm µm µm µm µm µm µm µm µm µm µm µm µm 1/kPa34 2.7 -14.9 0.1 7.3 -3.6 -3.4 1.0 2.2 -3.4 -3.7 1.1 2.0 -3.5 1.6 -0.45 -1.76 125 0.15435 2.7 -15.0 0.1 7.4 -3.6 -3.3 1.0 2.2 -3.4 -3.6 1.1 2.1 -3.5 1.6 -0.45 -1.73 124 0.16436 3.0 -15.0 0.1 7.5 -3.6 -3.5 1.0 2.2 -3.4 -3.6 1.1 2.1 -3.5 1.6 -0.45 -1.74 125 0.16237 2.8 -15.2 0.1 7.5 -3.6 -3.4 1.1 2.2 -3.4 -3.6 1.1 2.1 -3.5 1.6 -0.46 -1.70 125 0.17438 2.9 -15.1 0.1 7.6 -3.6 -3.4 1.1 2.3 -3.4 -3.7 1.1 2.1 -3.5 1.6 -0.46 -1.71 126 0.17139 2.9 -15.2 0.1 7.6 -3.5 -3.5 1.1 2.3 -3.4 -3.7 1.1 2.1 -3.5 1.6 -0.47 -1.69 126 0.17840 2.9 -15.4 0.1 7.6 -3.6 -3.4 1.1 2.2 -3.5 -3.7 1.1 2.1 -3.5 1.6 -0.46 -1.71 126 0.17241 3.0 -15.3 0.1 7.7 -3.6 -3.5 1.1 2.2 -3.4 -3.6 1.1 2.1 -3.5 1.6 -0.46 -1.72 126 0.16842 3.0 -15.4 0.1 7.8 -3.6 -3.5 1.1 2.2 -3.4 -3.6 1.1 2.1 -3.5 1.6 -0.46 -1.71 126 0.17143 2.9 -15.5 0.1 7.8 -3.6 -3.5 1.1 2.2 -3.5 -3.8 1.1 2.1 -3.6 1.6 -0.46 -1.72 128 0.16644 2.7 -15.7 0.0 7.8 -3.8 -3.5 1.1 2.2 -3.5 -3.8 1.1 2.1 -3.6 1.6 -0.45 -1.75 129 0.15745 3.1 -15.6 0.1 7.9 -3.7 -3.6 1.1 2.3 -3.5 -3.7 1.1 2.2 -3.6 1.7 -0.46 -1.72 129 0.16846 3.2 -15.6 0.1 7.9 -3.8 -3.6 1.1 2.2 -3.4 -3.7 1.1 2.2 -3.6 1.6 -0.45 -1.73 129 0.16347 3.1 -15.7 0.1 8.0 -3.8 -3.6 1.1 2.3 -3.5 -3.8 1.1 2.2 -3.7 1.7 -0.45 -1.74 131 0.16048 3.0 -15.8 0.1 8.1 -3.8 -3.6 1.1 2.3 -3.4 -3.7 1.1 2.2 -3.7 1.7 -0.46 -1.71 130 0.17049 2.9 -16.0 0.1 8.1 -3.8 -3.7 1.1 2.3 -3.5 -3.7 1.1 2.2 -3.7 1.7 -0.46 -1.72 131 0.16850 3.1 -16.0 0.1 8.2 -3.9 -3.7 1.1 2.3 -3.4 -3.8 1.1 2.2 -3.7 1.7 -0.45 -1.73 131 0.16351 3.0 -16.0 0.1 8.3 -3.9 -3.8 1.1 2.3 -3.4 -3.7 1.1 2.2 -3.7 1.7 -0.45 -1.74 132 0.16152 3.0 -16.0 0.1 8.3 -4.1 -3.9 1.1 2.3 -3.4 -3.6 1.2 2.2 -3.7 1.7 -0.45 -1.73 133 0.16253 2.8 -16.4 0.1 8.3 -4.1 -3.9 1.1 2.3 -3.4 -3.6 1.2 2.2 -3.7 1.7 -0.45 -1.74 133 0.16154 3.1 -16.3 0.2 8.3 -4.1 -3.9 1.1 2.3 -3.4 -3.7 1.2 2.3 -3.8 1.7 -0.45 -1.74 134 0.16055 3.1 -16.4 0.1 8.4 -4.2 -4.0 1.1 2.3 -3.4 -3.6 1.2 2.3 -3.8 1.7 -0.44 -1.76 135 0.15156 3.1 -16.3 0.1 8.4 -4.2 -4.0 1.1 2.3 -3.5 -3.8 1.2 2.3 -3.9 1.7 -0.44 -1.79 138 0.14257 3.0 -16.5 0.2 8.4 -4.2 -4.1 1.1 2.3 -3.4 -3.6 1.2 2.3 -3.8 1.7 -0.45 -1.73 135 0.16258 3.0 -16.6 0.1 8.4 -4.3 -4.1 1.1 2.3 -3.4 -3.7 1.2 2.3 -3.9 1.7 -0.45 -1.75 137 0.15659 3.0 -16.7 0.2 8.5 -4.2 -4.1 1.1 2.3 -3.4 -3.7 1.2 2.3 -3.8 1.7 -0.45 -1.76 136 0.15460 2.8 -16.9 0.1 8.5 -4.4 -4.2 1.1 2.2 -3.4 -3.7 1.2 2.3 -3.9 1.7 -0.44 -1.78 138 0.14761 2.9 -17.0 0.1 8.5 -4.4 -4.1 1.1 2.3 -3.4 -3.6 1.2 2.3 -3.9 1.7 -0.45 -1.76 138 0.15362 2.8 -17.1 0.1 8.5 -4.4 -4.2 1.1 2.3 -3.4 -3.7 1.2 2.3 -3.9 1.7 -0.45 -1.76 138 0.15463 2.8 -17.3 0.1 8.6 -4.4 -4.2 1.1 2.3 -3.4 -3.6 1.2 2.3 -3.9 1.7 -0.45 -1.74 138 0.15964 2.7 -17.5 0.1 8.6 -4.3 -4.1 1.1 2.3 -3.4 -3.6 1.2 2.4 -3.9 1.8 -0.46 -1.71 138 0.17265 2.6 -17.5 0.1 8.6 -4.2 -3.9 1.1 2.4 -3.4 -3.6 1.2 2.4 -3.8 1.8 -0.47 -1.69 136 0.18066 2.6 -17.7 0.1 8.6 -4.4 -4.2 1.1 2.4 -3.4 -3.6 1.2 2.4 -3.9 1.8 -0.46 -1.71 138 0.170
Mean
Normalized Vertical and Horizontal Deformation ArraysKL 52-34 Sample #2 KL 52-34 Sample #5 KL 52-34 Sample #7 Trimmed
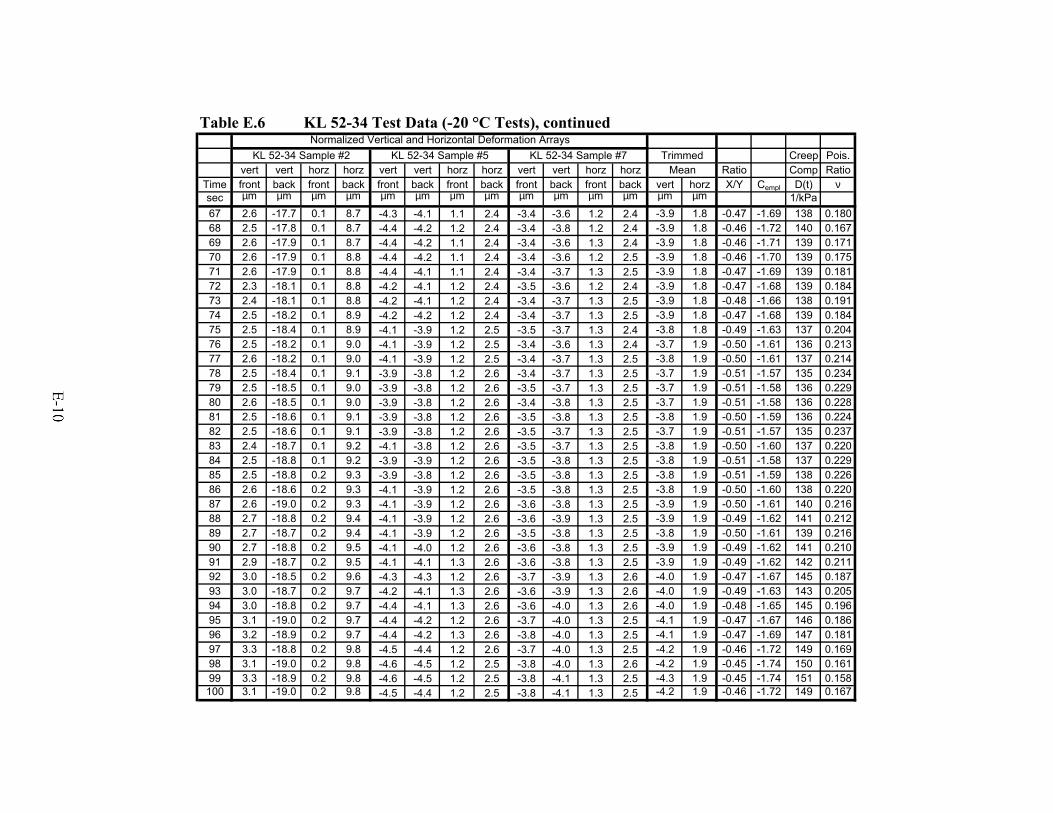
Table E.6 KL 52-34 Test Data (-20 °C Tests), continued
Creep Pois.vert vert horz horz vert vert horz horz vert vert horz horz Ratio Comp Ratio
Time front back front back front back front back front back front back vert horz X/Y Cempl D(t) νsec µm µm µm µm µm µm µm µm µm µm µm µm µm µm 1/kPa67 2.6 -17.7 0.1 8.7 -4.3 -4.1 1.1 2.4 -3.4 -3.6 1.2 2.4 -3.9 1.8 -0.47 -1.69 138 0.18068 2.5 -17.8 0.1 8.7 -4.4 -4.2 1.2 2.4 -3.4 -3.8 1.2 2.4 -3.9 1.8 -0.46 -1.72 140 0.16769 2.6 -17.9 0.1 8.7 -4.4 -4.2 1.1 2.4 -3.4 -3.6 1.3 2.4 -3.9 1.8 -0.46 -1.71 139 0.17170 2.6 -17.9 0.1 8.8 -4.4 -4.2 1.1 2.4 -3.4 -3.6 1.2 2.5 -3.9 1.8 -0.46 -1.70 139 0.17571 2.6 -17.9 0.1 8.8 -4.4 -4.1 1.1 2.4 -3.4 -3.7 1.3 2.5 -3.9 1.8 -0.47 -1.69 139 0.18172 2.3 -18.1 0.1 8.8 -4.2 -4.1 1.2 2.4 -3.5 -3.6 1.2 2.4 -3.9 1.8 -0.47 -1.68 139 0.18473 2.4 -18.1 0.1 8.8 -4.2 -4.1 1.2 2.4 -3.4 -3.7 1.3 2.5 -3.9 1.8 -0.48 -1.66 138 0.19174 2.5 -18.2 0.1 8.9 -4.2 -4.2 1.2 2.4 -3.4 -3.7 1.3 2.5 -3.9 1.8 -0.47 -1.68 139 0.18475 2.5 -18.4 0.1 8.9 -4.1 -3.9 1.2 2.5 -3.5 -3.7 1.3 2.4 -3.8 1.8 -0.49 -1.63 137 0.20476 2.5 -18.2 0.1 9.0 -4.1 -3.9 1.2 2.5 -3.4 -3.6 1.3 2.4 -3.7 1.9 -0.50 -1.61 136 0.21377 2.6 -18.2 0.1 9.0 -4.1 -3.9 1.2 2.5 -3.4 -3.7 1.3 2.5 -3.8 1.9 -0.50 -1.61 137 0.21478 2.5 -18.4 0.1 9.1 -3.9 -3.8 1.2 2.6 -3.4 -3.7 1.3 2.5 -3.7 1.9 -0.51 -1.57 135 0.23479 2.5 -18.5 0.1 9.0 -3.9 -3.8 1.2 2.6 -3.5 -3.7 1.3 2.5 -3.7 1.9 -0.51 -1.58 136 0.22980 2.6 -18.5 0.1 9.0 -3.9 -3.8 1.2 2.6 -3.4 -3.8 1.3 2.5 -3.7 1.9 -0.51 -1.58 136 0.22881 2.5 -18.6 0.1 9.1 -3.9 -3.8 1.2 2.6 -3.5 -3.8 1.3 2.5 -3.8 1.9 -0.50 -1.59 136 0.22482 2.5 -18.6 0.1 9.1 -3.9 -3.8 1.2 2.6 -3.5 -3.7 1.3 2.5 -3.7 1.9 -0.51 -1.57 135 0.23783 2.4 -18.7 0.1 9.2 -4.1 -3.8 1.2 2.6 -3.5 -3.7 1.3 2.5 -3.8 1.9 -0.50 -1.60 137 0.22084 2.5 -18.8 0.1 9.2 -3.9 -3.9 1.2 2.6 -3.5 -3.8 1.3 2.5 -3.8 1.9 -0.51 -1.58 137 0.22985 2.5 -18.8 0.2 9.3 -3.9 -3.8 1.2 2.6 -3.5 -3.8 1.3 2.5 -3.8 1.9 -0.51 -1.59 138 0.22686 2.6 -18.6 0.2 9.3 -4.1 -3.9 1.2 2.6 -3.5 -3.8 1.3 2.5 -3.8 1.9 -0.50 -1.60 138 0.22087 2.6 -19.0 0.2 9.3 -4.1 -3.9 1.2 2.6 -3.6 -3.8 1.3 2.5 -3.9 1.9 -0.50 -1.61 140 0.21688 2.7 -18.8 0.2 9.4 -4.1 -3.9 1.2 2.6 -3.6 -3.9 1.3 2.5 -3.9 1.9 -0.49 -1.62 141 0.21289 2.7 -18.7 0.2 9.4 -4.1 -3.9 1.2 2.6 -3.5 -3.8 1.3 2.5 -3.8 1.9 -0.50 -1.61 139 0.21690 2.7 -18.8 0.2 9.5 -4.1 -4.0 1.2 2.6 -3.6 -3.8 1.3 2.5 -3.9 1.9 -0.49 -1.62 141 0.21091 2.9 -18.7 0.2 9.5 -4.1 -4.1 1.3 2.6 -3.6 -3.8 1.3 2.5 -3.9 1.9 -0.49 -1.62 142 0.21192 3.0 -18.5 0.2 9.6 -4.3 -4.3 1.2 2.6 -3.7 -3.9 1.3 2.6 -4.0 1.9 -0.47 -1.67 145 0.18793 3.0 -18.7 0.2 9.7 -4.2 -4.1 1.3 2.6 -3.6 -3.9 1.3 2.6 -4.0 1.9 -0.49 -1.63 143 0.20594 3.0 -18.8 0.2 9.7 -4.4 -4.1 1.3 2.6 -3.6 -4.0 1.3 2.6 -4.0 1.9 -0.48 -1.65 145 0.19695 3.1 -19.0 0.2 9.7 -4.4 -4.2 1.2 2.6 -3.7 -4.0 1.3 2.5 -4.1 1.9 -0.47 -1.67 146 0.18696 3.2 -18.9 0.2 9.7 -4.4 -4.2 1.3 2.6 -3.8 -4.0 1.3 2.5 -4.1 1.9 -0.47 -1.69 147 0.18197 3.3 -18.8 0.2 9.8 -4.5 -4.4 1.2 2.6 -3.7 -4.0 1.3 2.5 -4.2 1.9 -0.46 -1.72 149 0.16998 3.1 -19.0 0.2 9.8 -4.6 -4.5 1.2 2.5 -3.8 -4.0 1.3 2.6 -4.2 1.9 -0.45 -1.74 150 0.16199 3.3 -18.9 0.2 9.8 -4.6 -4.5 1.2 2.5 -3.8 -4.1 1.3 2.5 -4.3 1.9 -0.45 -1.74 151 0.158100 3.1 -19.0 0.2 9.8 -4.5 -4.4 1.2 2.5 -3.8 -4.1 1.3 2.5 -4.2 1.9 -0.46 -1.72 149 0.167
Mean
Normalized Vertical and Horizontal Deformation ArraysKL 52-34 Sample #2 KL 52-34 Sample #5 KL 52-34 Sample #7 Trimmed
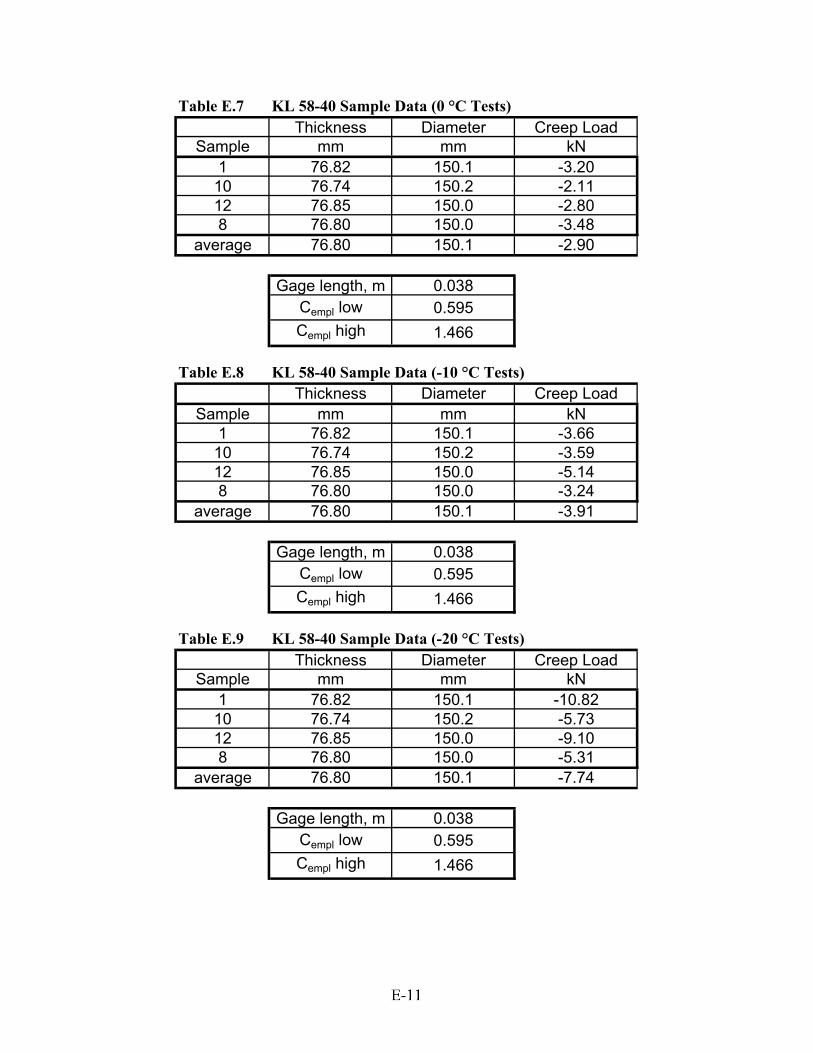
Table E.7 KL 58-40 Sample Data (0 °C Tests)Thickness Diameter Creep Load
Sample mm mm kN1 76.82 150.1 -3.20
10 76.74 150.2 -2.1112 76.85 150.0 -2.808 76.80 150.0 -3.48
average 76.80 150.1 -2.90
Gage length, m 0.038Cempl low 0.595Cempl high 1.466
Table E.8 KL 58-40 Sample Data (-10 °C Tests)Thickness Diameter Creep Load
Sample mm mm kN1 76.82 150.1 -3.66
10 76.74 150.2 -3.5912 76.85 150.0 -5.148 76.80 150.0 -3.24
average 76.80 150.1 -3.91
Gage length, m 0.038Cempl low 0.595Cempl high 1.466
Table E.9 KL 58-40 Sample Data (-20 °C Tests)Thickness Diameter Creep Load
Sample mm mm kN1 76.82 150.1 -10.82
10 76.74 150.2 -5.7312 76.85 150.0 -9.108 76.80 150.0 -5.31
average 76.80 150.1 -7.74
Gage length, m 0.038Cempl low 0.595Cempl high 1.466
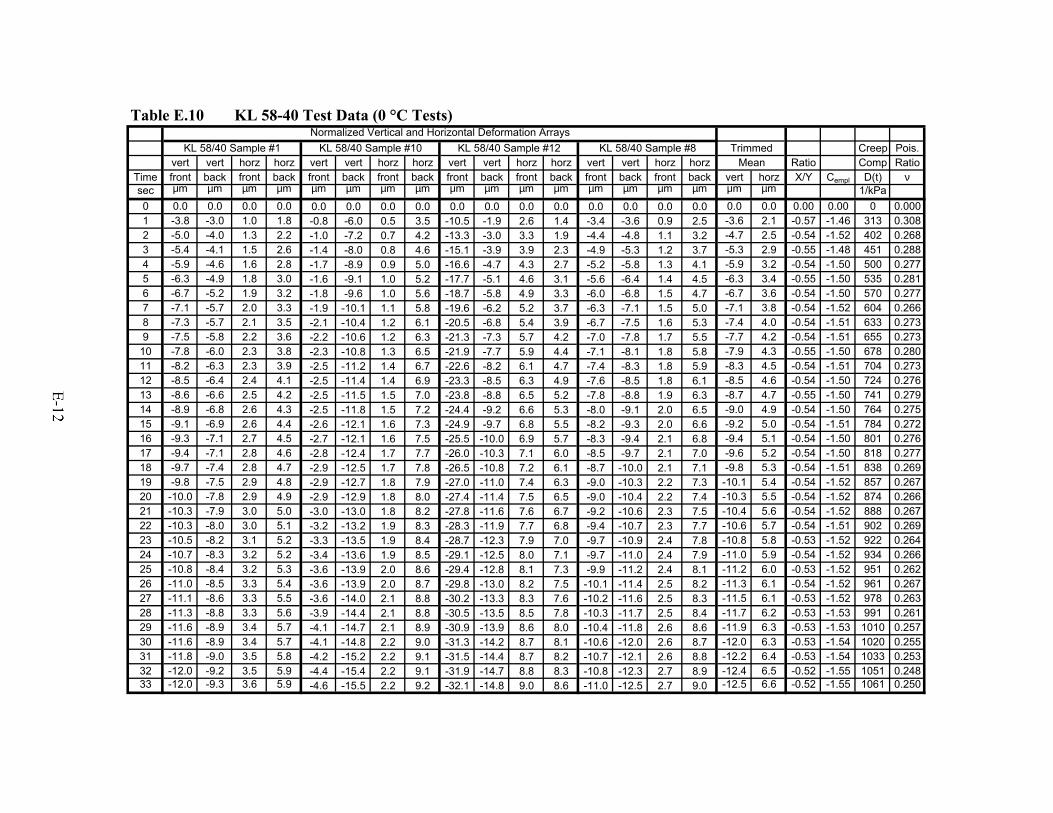
Table E.10 KL 58-40 Test Data (0 °C Tests)
Creep Pois.vert vert horz horz vert vert horz horz vert vert horz horz vert vert horz horz Ratio Comp Ratio
Time front back front back front back front back front back front back front back front back vert horz X/Y Cempl D(t) νsec µm µm µm µm µm µm µm µm µm µm µm µm µm µm µm µm µm µm 1/kPa0 0.0 0.0 0.0 0.0 0.0 0.0 0.0 0.0 0.0 0.0 0.0 0.0 0.0 0.0 0.0 0.0 0.0 0.0 0.00 0.00 0 0.0001 -3.8 -3.0 1.0 1.8 -0.8 -6.0 0.5 3.5 -10.5 -1.9 2.6 1.4 -3.4 -3.6 0.9 2.5 -3.6 2.1 -0.57 -1.46 313 0.3082 -5.0 -4.0 1.3 2.2 -1.0 -7.2 0.7 4.2 -13.3 -3.0 3.3 1.9 -4.4 -4.8 1.1 3.2 -4.7 2.5 -0.54 -1.52 402 0.2683 -5.4 -4.1 1.5 2.6 -1.4 -8.0 0.8 4.6 -15.1 -3.9 3.9 2.3 -4.9 -5.3 1.2 3.7 -5.3 2.9 -0.55 -1.48 451 0.2884 -5.9 -4.6 1.6 2.8 -1.7 -8.9 0.9 5.0 -16.6 -4.7 4.3 2.7 -5.2 -5.8 1.3 4.1 -5.9 3.2 -0.54 -1.50 500 0.2775 -6.3 -4.9 1.8 3.0 -1.6 -9.1 1.0 5.2 -17.7 -5.1 4.6 3.1 -5.6 -6.4 1.4 4.5 -6.3 3.4 -0.55 -1.50 535 0.2816 -6.7 -5.2 1.9 3.2 -1.8 -9.6 1.0 5.6 -18.7 -5.8 4.9 3.3 -6.0 -6.8 1.5 4.7 -6.7 3.6 -0.54 -1.50 570 0.2777 -7.1 -5.7 2.0 3.3 -1.9 -10.1 1.1 5.8 -19.6 -6.2 5.2 3.7 -6.3 -7.1 1.5 5.0 -7.1 3.8 -0.54 -1.52 604 0.2668 -7.3 -5.7 2.1 3.5 -2.1 -10.4 1.2 6.1 -20.5 -6.8 5.4 3.9 -6.7 -7.5 1.6 5.3 -7.4 4.0 -0.54 -1.51 633 0.2739 -7.5 -5.8 2.2 3.6 -2.2 -10.6 1.2 6.3 -21.3 -7.3 5.7 4.2 -7.0 -7.8 1.7 5.5 -7.7 4.2 -0.54 -1.51 655 0.273
10 -7.8 -6.0 2.3 3.8 -2.3 -10.8 1.3 6.5 -21.9 -7.7 5.9 4.4 -7.1 -8.1 1.8 5.8 -7.9 4.3 -0.55 -1.50 678 0.28011 -8.2 -6.3 2.3 3.9 -2.5 -11.2 1.4 6.7 -22.6 -8.2 6.1 4.7 -7.4 -8.3 1.8 5.9 -8.3 4.5 -0.54 -1.51 704 0.27312 -8.5 -6.4 2.4 4.1 -2.5 -11.4 1.4 6.9 -23.3 -8.5 6.3 4.9 -7.6 -8.5 1.8 6.1 -8.5 4.6 -0.54 -1.50 724 0.27613 -8.6 -6.6 2.5 4.2 -2.5 -11.5 1.5 7.0 -23.8 -8.8 6.5 5.2 -7.8 -8.8 1.9 6.3 -8.7 4.7 -0.55 -1.50 741 0.27914 -8.9 -6.8 2.6 4.3 -2.5 -11.8 1.5 7.2 -24.4 -9.2 6.6 5.3 -8.0 -9.1 2.0 6.5 -9.0 4.9 -0.54 -1.50 764 0.27515 -9.1 -6.9 2.6 4.4 -2.6 -12.1 1.6 7.3 -24.9 -9.7 6.8 5.5 -8.2 -9.3 2.0 6.6 -9.2 5.0 -0.54 -1.51 784 0.27216 -9.3 -7.1 2.7 4.5 -2.7 -12.1 1.6 7.5 -25.5 -10.0 6.9 5.7 -8.3 -9.4 2.1 6.8 -9.4 5.1 -0.54 -1.50 801 0.27617 -9.4 -7.1 2.8 4.6 -2.8 -12.4 1.7 7.7 -26.0 -10.3 7.1 6.0 -8.5 -9.7 2.1 7.0 -9.6 5.2 -0.54 -1.50 818 0.27718 -9.7 -7.4 2.8 4.7 -2.9 -12.5 1.7 7.8 -26.5 -10.8 7.2 6.1 -8.7 -10.0 2.1 7.1 -9.8 5.3 -0.54 -1.51 838 0.26919 -9.8 -7.5 2.9 4.8 -2.9 -12.7 1.8 7.9 -27.0 -11.0 7.4 6.3 -9.0 -10.3 2.2 7.3 -10.1 5.4 -0.54 -1.52 857 0.26720 -10.0 -7.8 2.9 4.9 -2.9 -12.9 1.8 8.0 -27.4 -11.4 7.5 6.5 -9.0 -10.4 2.2 7.4 -10.3 5.5 -0.54 -1.52 874 0.26621 -10.3 -7.9 3.0 5.0 -3.0 -13.0 1.8 8.2 -27.8 -11.6 7.6 6.7 -9.2 -10.6 2.3 7.5 -10.4 5.6 -0.54 -1.52 888 0.26722 -10.3 -8.0 3.0 5.1 -3.2 -13.2 1.9 8.3 -28.3 -11.9 7.7 6.8 -9.4 -10.7 2.3 7.7 -10.6 5.7 -0.54 -1.51 902 0.26923 -10.5 -8.2 3.1 5.2 -3.3 -13.5 1.9 8.4 -28.7 -12.3 7.9 7.0 -9.7 -10.9 2.4 7.8 -10.8 5.8 -0.53 -1.52 922 0.26424 -10.7 -8.3 3.2 5.2 -3.4 -13.6 1.9 8.5 -29.1 -12.5 8.0 7.1 -9.7 -11.0 2.4 7.9 -11.0 5.9 -0.54 -1.52 934 0.26625 -10.8 -8.4 3.2 5.3 -3.6 -13.9 2.0 8.6 -29.4 -12.8 8.1 7.3 -9.9 -11.2 2.4 8.1 -11.2 6.0 -0.53 -1.52 951 0.26226 -11.0 -8.5 3.3 5.4 -3.6 -13.9 2.0 8.7 -29.8 -13.0 8.2 7.5 -10.1 -11.4 2.5 8.2 -11.3 6.1 -0.54 -1.52 961 0.26727 -11.1 -8.6 3.3 5.5 -3.6 -14.0 2.1 8.8 -30.2 -13.3 8.3 7.6 -10.2 -11.6 2.5 8.3 -11.5 6.1 -0.53 -1.52 978 0.26328 -11.3 -8.8 3.3 5.6 -3.9 -14.4 2.1 8.8 -30.5 -13.5 8.5 7.8 -10.3 -11.7 2.5 8.4 -11.7 6.2 -0.53 -1.53 991 0.26129 -11.6 -8.9 3.4 5.7 -4.1 -14.7 2.1 8.9 -30.9 -13.9 8.6 8.0 -10.4 -11.8 2.6 8.6 -11.9 6.3 -0.53 -1.53 1010 0.25730 -11.6 -8.9 3.4 5.7 -4.1 -14.8 2.2 9.0 -31.3 -14.2 8.7 8.1 -10.6 -12.0 2.6 8.7 -12.0 6.3 -0.53 -1.54 1020 0.25531 -11.8 -9.0 3.5 5.8 -4.2 -15.2 2.2 9.1 -31.5 -14.4 8.7 8.2 -10.7 -12.1 2.6 8.8 -12.2 6.4 -0.53 -1.54 1033 0.25332 -12.0 -9.2 3.5 5.9 -4.4 -15.4 2.2 9.1 -31.9 -14.7 8.8 8.3 -10.8 -12.3 2.7 8.9 -12.4 6.5 -0.52 -1.55 1051 0.24833 -12.0 -9.3 3.6 5.9 -4.6 -15.5 2.2 9.2 -32.1 -14.8 9.0 8.6 -11.0 -12.5 2.7 9.0 -12.5 6.6 -0.52 -1.55 1061 0.250
KL 58/40 Sample #1 KL 58/40 Sample #10 KL 58/40 Sample #12 TrimmedNormalized Vertical and Horizontal Deformation Arrays
KL 58/40 Sample #8Mean
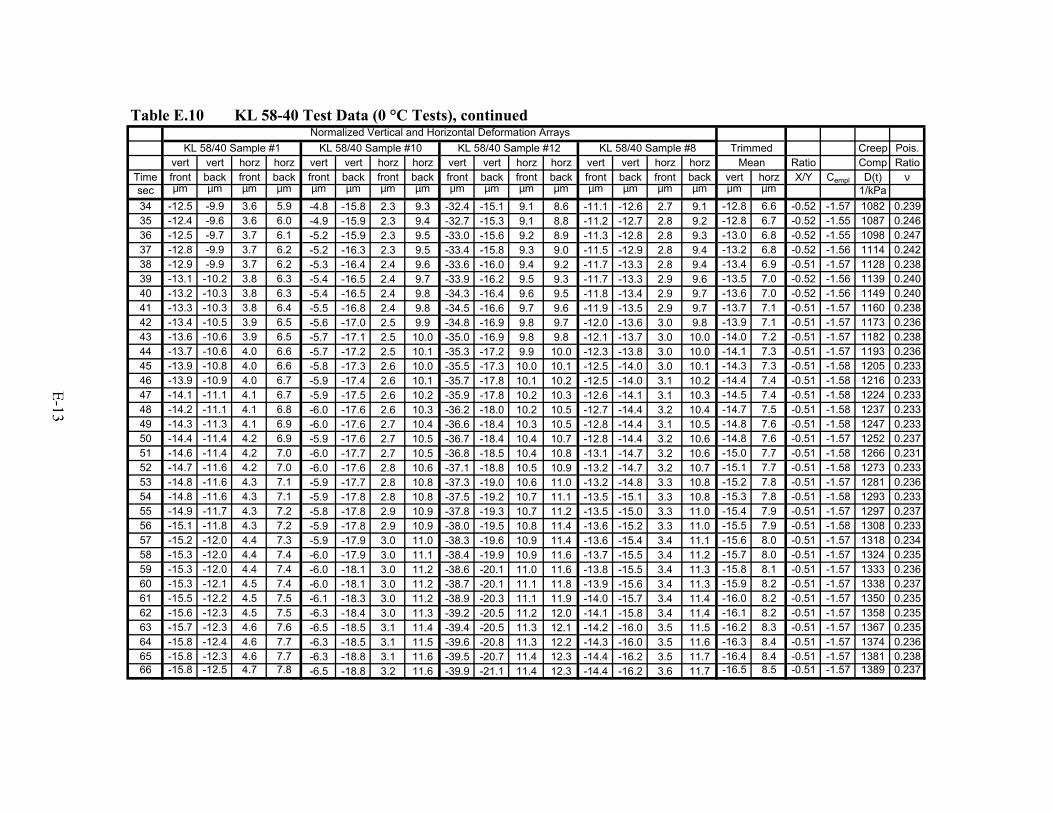
Table E.10 KL 58-40 Test Data (0 °C Tests), continued
Creep Pois.vert vert horz horz vert vert horz horz vert vert horz horz vert vert horz horz Ratio Comp Ratio
Time front back front back front back front back front back front back front back front back vert horz X/Y Cempl D(t) νsec µm µm µm µm µm µm µm µm µm µm µm µm µm µm µm µm µm µm 1/kPa34 -12.5 -9.9 3.6 5.9 -4.8 -15.8 2.3 9.3 -32.4 -15.1 9.1 8.6 -11.1 -12.6 2.7 9.1 -12.8 6.6 -0.52 -1.57 1082 0.23935 -12.4 -9.6 3.6 6.0 -4.9 -15.9 2.3 9.4 -32.7 -15.3 9.1 8.8 -11.2 -12.7 2.8 9.2 -12.8 6.7 -0.52 -1.55 1087 0.24636 -12.5 -9.7 3.7 6.1 -5.2 -15.9 2.3 9.5 -33.0 -15.6 9.2 8.9 -11.3 -12.8 2.8 9.3 -13.0 6.8 -0.52 -1.55 1098 0.24737 -12.8 -9.9 3.7 6.2 -5.2 -16.3 2.3 9.5 -33.4 -15.8 9.3 9.0 -11.5 -12.9 2.8 9.4 -13.2 6.8 -0.52 -1.56 1114 0.24238 -12.9 -9.9 3.7 6.2 -5.3 -16.4 2.4 9.6 -33.6 -16.0 9.4 9.2 -11.7 -13.3 2.8 9.4 -13.4 6.9 -0.51 -1.57 1128 0.23839 -13.1 -10.2 3.8 6.3 -5.4 -16.5 2.4 9.7 -33.9 -16.2 9.5 9.3 -11.7 -13.3 2.9 9.6 -13.5 7.0 -0.52 -1.56 1139 0.24040 -13.2 -10.3 3.8 6.3 -5.4 -16.5 2.4 9.8 -34.3 -16.4 9.6 9.5 -11.8 -13.4 2.9 9.7 -13.6 7.0 -0.52 -1.56 1149 0.24041 -13.3 -10.3 3.8 6.4 -5.5 -16.8 2.4 9.8 -34.5 -16.6 9.7 9.6 -11.9 -13.5 2.9 9.7 -13.7 7.1 -0.51 -1.57 1160 0.23842 -13.4 -10.5 3.9 6.5 -5.6 -17.0 2.5 9.9 -34.8 -16.9 9.8 9.7 -12.0 -13.6 3.0 9.8 -13.9 7.1 -0.51 -1.57 1173 0.23643 -13.6 -10.6 3.9 6.5 -5.7 -17.1 2.5 10.0 -35.0 -16.9 9.8 9.8 -12.1 -13.7 3.0 10.0 -14.0 7.2 -0.51 -1.57 1182 0.23844 -13.7 -10.6 4.0 6.6 -5.7 -17.2 2.5 10.1 -35.3 -17.2 9.9 10.0 -12.3 -13.8 3.0 10.0 -14.1 7.3 -0.51 -1.57 1193 0.23645 -13.9 -10.8 4.0 6.6 -5.8 -17.3 2.6 10.0 -35.5 -17.3 10.0 10.1 -12.5 -14.0 3.0 10.1 -14.3 7.3 -0.51 -1.58 1205 0.23346 -13.9 -10.9 4.0 6.7 -5.9 -17.4 2.6 10.1 -35.7 -17.8 10.1 10.2 -12.5 -14.0 3.1 10.2 -14.4 7.4 -0.51 -1.58 1216 0.23347 -14.1 -11.1 4.1 6.7 -5.9 -17.5 2.6 10.2 -35.9 -17.8 10.2 10.3 -12.6 -14.1 3.1 10.3 -14.5 7.4 -0.51 -1.58 1224 0.23348 -14.2 -11.1 4.1 6.8 -6.0 -17.6 2.6 10.3 -36.2 -18.0 10.2 10.5 -12.7 -14.4 3.2 10.4 -14.7 7.5 -0.51 -1.58 1237 0.23349 -14.3 -11.3 4.1 6.9 -6.0 -17.6 2.7 10.4 -36.6 -18.4 10.3 10.5 -12.8 -14.4 3.1 10.5 -14.8 7.6 -0.51 -1.58 1247 0.23350 -14.4 -11.4 4.2 6.9 -5.9 -17.6 2.7 10.5 -36.7 -18.4 10.4 10.7 -12.8 -14.4 3.2 10.6 -14.8 7.6 -0.51 -1.57 1252 0.23751 -14.6 -11.4 4.2 7.0 -6.0 -17.7 2.7 10.5 -36.8 -18.5 10.4 10.8 -13.1 -14.7 3.2 10.6 -15.0 7.7 -0.51 -1.58 1266 0.23152 -14.7 -11.6 4.2 7.0 -6.0 -17.6 2.8 10.6 -37.1 -18.8 10.5 10.9 -13.2 -14.7 3.2 10.7 -15.1 7.7 -0.51 -1.58 1273 0.23353 -14.8 -11.6 4.3 7.1 -5.9 -17.7 2.8 10.8 -37.3 -19.0 10.6 11.0 -13.2 -14.8 3.3 10.8 -15.2 7.8 -0.51 -1.57 1281 0.23654 -14.8 -11.6 4.3 7.1 -5.9 -17.8 2.8 10.8 -37.5 -19.2 10.7 11.1 -13.5 -15.1 3.3 10.8 -15.3 7.8 -0.51 -1.58 1293 0.23355 -14.9 -11.7 4.3 7.2 -5.8 -17.8 2.9 10.9 -37.8 -19.3 10.7 11.2 -13.5 -15.0 3.3 11.0 -15.4 7.9 -0.51 -1.57 1297 0.23756 -15.1 -11.8 4.3 7.2 -5.9 -17.8 2.9 10.9 -38.0 -19.5 10.8 11.4 -13.6 -15.2 3.3 11.0 -15.5 7.9 -0.51 -1.58 1308 0.23357 -15.2 -12.0 4.4 7.3 -5.9 -17.9 3.0 11.0 -38.3 -19.6 10.9 11.4 -13.6 -15.4 3.4 11.1 -15.6 8.0 -0.51 -1.57 1318 0.23458 -15.3 -12.0 4.4 7.4 -6.0 -17.9 3.0 11.1 -38.4 -19.9 10.9 11.6 -13.7 -15.5 3.4 11.2 -15.7 8.0 -0.51 -1.57 1324 0.23559 -15.3 -12.0 4.4 7.4 -6.0 -18.1 3.0 11.2 -38.6 -20.1 11.0 11.6 -13.8 -15.5 3.4 11.3 -15.8 8.1 -0.51 -1.57 1333 0.23660 -15.3 -12.1 4.5 7.4 -6.0 -18.1 3.0 11.2 -38.7 -20.1 11.1 11.8 -13.9 -15.6 3.4 11.3 -15.9 8.2 -0.51 -1.57 1338 0.23761 -15.5 -12.2 4.5 7.5 -6.1 -18.3 3.0 11.2 -38.9 -20.3 11.1 11.9 -14.0 -15.7 3.4 11.4 -16.0 8.2 -0.51 -1.57 1350 0.23562 -15.6 -12.3 4.5 7.5 -6.3 -18.4 3.0 11.3 -39.2 -20.5 11.2 12.0 -14.1 -15.8 3.4 11.4 -16.1 8.2 -0.51 -1.57 1358 0.23563 -15.7 -12.3 4.6 7.6 -6.5 -18.5 3.1 11.4 -39.4 -20.5 11.3 12.1 -14.2 -16.0 3.5 11.5 -16.2 8.3 -0.51 -1.57 1367 0.23564 -15.8 -12.4 4.6 7.7 -6.3 -18.5 3.1 11.5 -39.6 -20.8 11.3 12.2 -14.3 -16.0 3.5 11.6 -16.3 8.4 -0.51 -1.57 1374 0.23665 -15.8 -12.3 4.6 7.7 -6.3 -18.8 3.1 11.6 -39.5 -20.7 11.4 12.3 -14.4 -16.2 3.5 11.7 -16.4 8.4 -0.51 -1.57 1381 0.23866 -15.8 -12.5 4.7 7.8 -6.5 -18.8 3.2 11.6 -39.9 -21.1 11.4 12.3 -14.4 -16.2 3.6 11.7 -16.5 8.5 -0.51 -1.57 1389 0.237
Mean
Normalized Vertical and Horizontal Deformation ArraysKL 58/40 Sample #1 KL 58/40 Sample #10 KL 58/40 Sample #12 KL 58/40 Sample #8 Trimmed
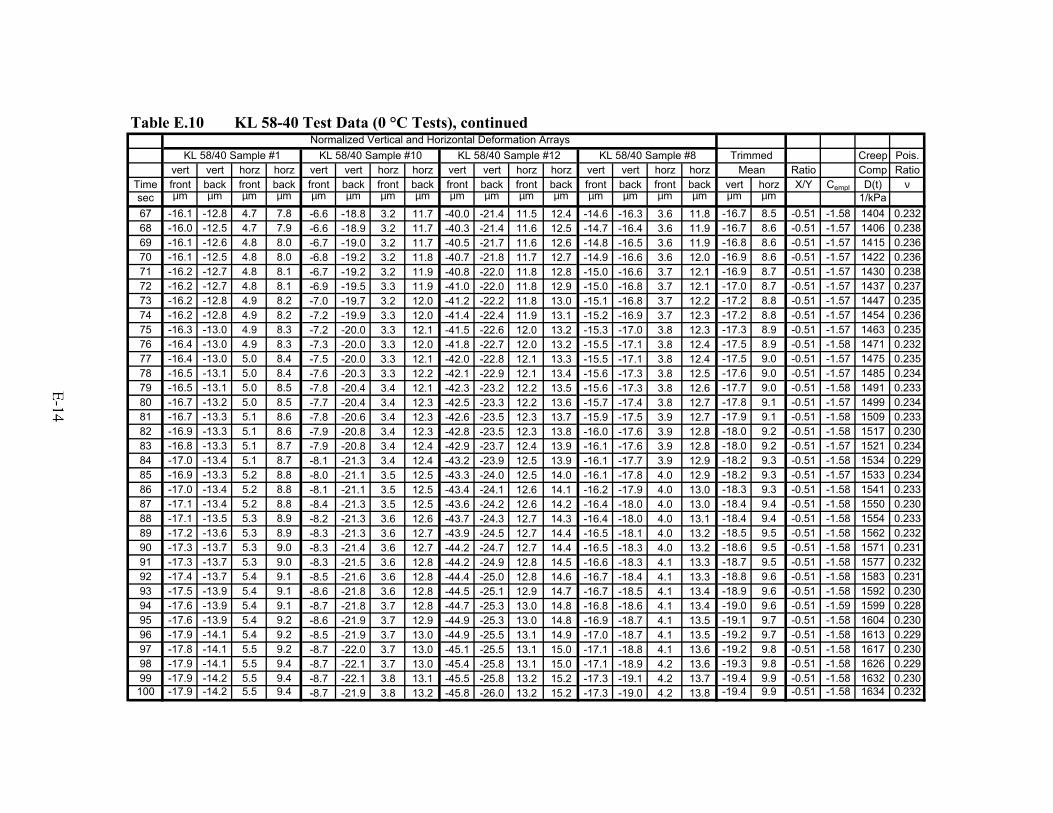
Table E.10 KL 58-40 Test Data (0 °C Tests), continued
Creep Pois.vert vert horz horz vert vert horz horz vert vert horz horz vert vert horz horz Ratio Comp Ratio
Time front back front back front back front back front back front back front back front back vert horz X/Y Cempl D(t) νsec µm µm µm µm µm µm µm µm µm µm µm µm µm µm µm µm µm µm 1/kPa67 -16.1 -12.8 4.7 7.8 -6.6 -18.8 3.2 11.7 -40.0 -21.4 11.5 12.4 -14.6 -16.3 3.6 11.8 -16.7 8.5 -0.51 -1.58 1404 0.23268 -16.0 -12.5 4.7 7.9 -6.6 -18.9 3.2 11.7 -40.3 -21.4 11.6 12.5 -14.7 -16.4 3.6 11.9 -16.7 8.6 -0.51 -1.57 1406 0.23869 -16.1 -12.6 4.8 8.0 -6.7 -19.0 3.2 11.7 -40.5 -21.7 11.6 12.6 -14.8 -16.5 3.6 11.9 -16.8 8.6 -0.51 -1.57 1415 0.23670 -16.1 -12.5 4.8 8.0 -6.8 -19.2 3.2 11.8 -40.7 -21.8 11.7 12.7 -14.9 -16.6 3.6 12.0 -16.9 8.6 -0.51 -1.57 1422 0.23671 -16.2 -12.7 4.8 8.1 -6.7 -19.2 3.2 11.9 -40.8 -22.0 11.8 12.8 -15.0 -16.6 3.7 12.1 -16.9 8.7 -0.51 -1.57 1430 0.23872 -16.2 -12.7 4.8 8.1 -6.9 -19.5 3.3 11.9 -41.0 -22.0 11.8 12.9 -15.0 -16.8 3.7 12.1 -17.0 8.7 -0.51 -1.57 1437 0.23773 -16.2 -12.8 4.9 8.2 -7.0 -19.7 3.2 12.0 -41.2 -22.2 11.8 13.0 -15.1 -16.8 3.7 12.2 -17.2 8.8 -0.51 -1.57 1447 0.23574 -16.2 -12.8 4.9 8.2 -7.2 -19.9 3.3 12.0 -41.4 -22.4 11.9 13.1 -15.2 -16.9 3.7 12.3 -17.2 8.8 -0.51 -1.57 1454 0.23675 -16.3 -13.0 4.9 8.3 -7.2 -20.0 3.3 12.1 -41.5 -22.6 12.0 13.2 -15.3 -17.0 3.8 12.3 -17.3 8.9 -0.51 -1.57 1463 0.23576 -16.4 -13.0 4.9 8.3 -7.3 -20.0 3.3 12.0 -41.8 -22.7 12.0 13.2 -15.5 -17.1 3.8 12.4 -17.5 8.9 -0.51 -1.58 1471 0.23277 -16.4 -13.0 5.0 8.4 -7.5 -20.0 3.3 12.1 -42.0 -22.8 12.1 13.3 -15.5 -17.1 3.8 12.4 -17.5 9.0 -0.51 -1.57 1475 0.23578 -16.5 -13.1 5.0 8.4 -7.6 -20.3 3.3 12.2 -42.1 -22.9 12.1 13.4 -15.6 -17.3 3.8 12.5 -17.6 9.0 -0.51 -1.57 1485 0.23479 -16.5 -13.1 5.0 8.5 -7.8 -20.4 3.4 12.1 -42.3 -23.2 12.2 13.5 -15.6 -17.3 3.8 12.6 -17.7 9.0 -0.51 -1.58 1491 0.23380 -16.7 -13.2 5.0 8.5 -7.7 -20.4 3.4 12.3 -42.5 -23.3 12.2 13.6 -15.7 -17.4 3.8 12.7 -17.8 9.1 -0.51 -1.57 1499 0.23481 -16.7 -13.3 5.1 8.6 -7.8 -20.6 3.4 12.3 -42.6 -23.5 12.3 13.7 -15.9 -17.5 3.9 12.7 -17.9 9.1 -0.51 -1.58 1509 0.23382 -16.9 -13.3 5.1 8.6 -7.9 -20.8 3.4 12.3 -42.8 -23.5 12.3 13.8 -16.0 -17.6 3.9 12.8 -18.0 9.2 -0.51 -1.58 1517 0.23083 -16.8 -13.3 5.1 8.7 -7.9 -20.8 3.4 12.4 -42.9 -23.7 12.4 13.9 -16.1 -17.6 3.9 12.8 -18.0 9.2 -0.51 -1.57 1521 0.23484 -17.0 -13.4 5.1 8.7 -8.1 -21.3 3.4 12.4 -43.2 -23.9 12.5 13.9 -16.1 -17.7 3.9 12.9 -18.2 9.3 -0.51 -1.58 1534 0.22985 -16.9 -13.3 5.2 8.8 -8.0 -21.1 3.5 12.5 -43.3 -24.0 12.5 14.0 -16.1 -17.8 4.0 12.9 -18.2 9.3 -0.51 -1.57 1533 0.23486 -17.0 -13.4 5.2 8.8 -8.1 -21.1 3.5 12.5 -43.4 -24.1 12.6 14.1 -16.2 -17.9 4.0 13.0 -18.3 9.3 -0.51 -1.58 1541 0.23387 -17.1 -13.4 5.2 8.8 -8.4 -21.3 3.5 12.5 -43.6 -24.2 12.6 14.2 -16.4 -18.0 4.0 13.0 -18.4 9.4 -0.51 -1.58 1550 0.23088 -17.1 -13.5 5.3 8.9 -8.2 -21.3 3.6 12.6 -43.7 -24.3 12.7 14.3 -16.4 -18.0 4.0 13.1 -18.4 9.4 -0.51 -1.58 1554 0.23389 -17.2 -13.6 5.3 8.9 -8.3 -21.3 3.6 12.7 -43.9 -24.5 12.7 14.4 -16.5 -18.1 4.0 13.2 -18.5 9.5 -0.51 -1.58 1562 0.23290 -17.3 -13.7 5.3 9.0 -8.3 -21.4 3.6 12.7 -44.2 -24.7 12.7 14.4 -16.5 -18.3 4.0 13.2 -18.6 9.5 -0.51 -1.58 1571 0.23191 -17.3 -13.7 5.3 9.0 -8.3 -21.5 3.6 12.8 -44.2 -24.9 12.8 14.5 -16.6 -18.3 4.1 13.3 -18.7 9.5 -0.51 -1.58 1577 0.23292 -17.4 -13.7 5.4 9.1 -8.5 -21.6 3.6 12.8 -44.4 -25.0 12.8 14.6 -16.7 -18.4 4.1 13.3 -18.8 9.6 -0.51 -1.58 1583 0.23193 -17.5 -13.9 5.4 9.1 -8.6 -21.8 3.6 12.8 -44.5 -25.1 12.9 14.7 -16.7 -18.5 4.1 13.4 -18.9 9.6 -0.51 -1.58 1592 0.23094 -17.6 -13.9 5.4 9.1 -8.7 -21.8 3.7 12.8 -44.7 -25.3 13.0 14.8 -16.8 -18.6 4.1 13.4 -19.0 9.6 -0.51 -1.59 1599 0.22895 -17.6 -13.9 5.4 9.2 -8.6 -21.9 3.7 12.9 -44.9 -25.3 13.0 14.8 -16.9 -18.7 4.1 13.5 -19.1 9.7 -0.51 -1.58 1604 0.23096 -17.9 -14.1 5.4 9.2 -8.5 -21.9 3.7 13.0 -44.9 -25.5 13.1 14.9 -17.0 -18.7 4.1 13.5 -19.2 9.7 -0.51 -1.58 1613 0.22997 -17.8 -14.1 5.5 9.2 -8.7 -22.0 3.7 13.0 -45.1 -25.5 13.1 15.0 -17.1 -18.8 4.1 13.6 -19.2 9.8 -0.51 -1.58 1617 0.23098 -17.9 -14.1 5.5 9.4 -8.7 -22.1 3.7 13.0 -45.4 -25.8 13.1 15.0 -17.1 -18.9 4.2 13.6 -19.3 9.8 -0.51 -1.58 1626 0.22999 -17.9 -14.2 5.5 9.4 -8.7 -22.1 3.8 13.1 -45.5 -25.8 13.2 15.2 -17.3 -19.1 4.2 13.7 -19.4 9.9 -0.51 -1.58 1632 0.230100 -17.9 -14.2 5.5 9.4 -8.7 -21.9 3.8 13.2 -45.8 -26.0 13.2 15.2 -17.3 -19.0 4.2 13.8 -19.4 9.9 -0.51 -1.58 1634 0.232
Mean
Normalized Vertical and Horizontal Deformation ArraysKL 58/40 Sample #1 KL 58/40 Sample #10 KL 58/40 Sample #12 KL 58/40 Sample #8 Trimmed
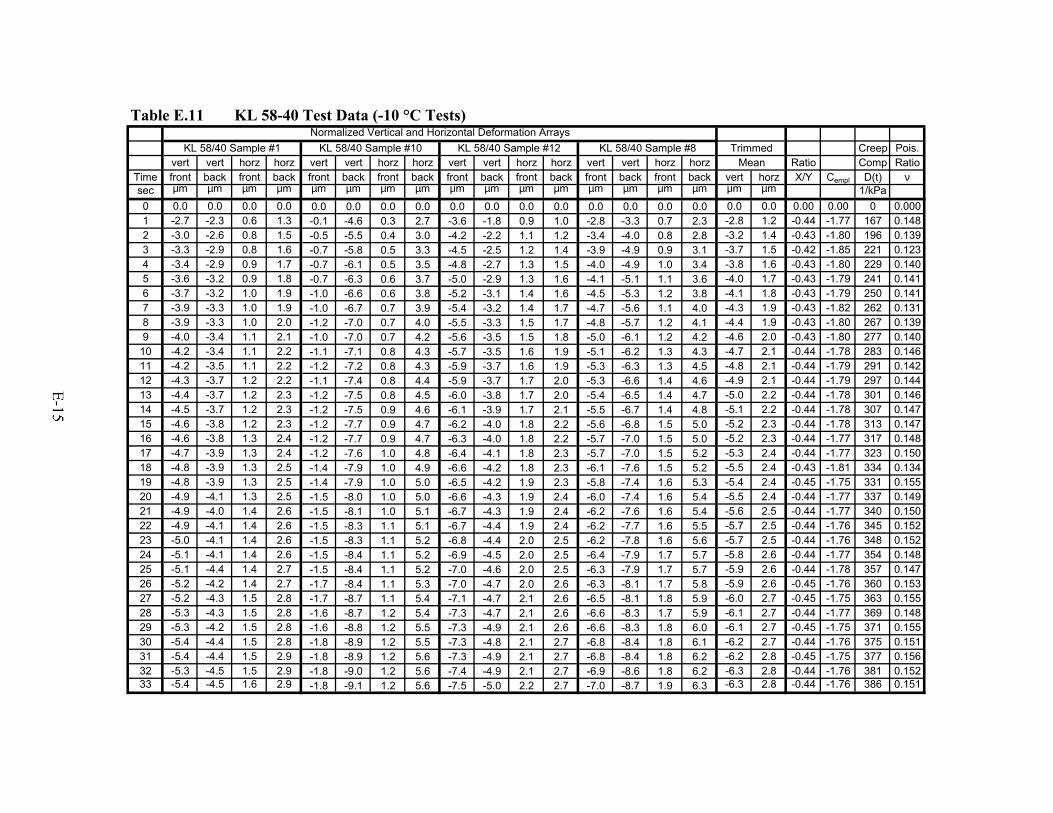
Table E.11 KL 58-40 Test Data (-10 °C Tests)
Creep Pois.vert vert horz horz vert vert horz horz vert vert horz horz vert vert horz horz Ratio Comp Ratio
Time front back front back front back front back front back front back front back front back vert horz X/Y Cempl D(t) νsec µm µm µm µm µm µm µm µm µm µm µm µm µm µm µm µm µm µm 1/kPa0 0.0 0.0 0.0 0.0 0.0 0.0 0.0 0.0 0.0 0.0 0.0 0.0 0.0 0.0 0.0 0.0 0.0 0.0 0.00 0.00 0 0.0001 -2.7 -2.3 0.6 1.3 -0.1 -4.6 0.3 2.7 -3.6 -1.8 0.9 1.0 -2.8 -3.3 0.7 2.3 -2.8 1.2 -0.44 -1.77 167 0.1482 -3.0 -2.6 0.8 1.5 -0.5 -5.5 0.4 3.0 -4.2 -2.2 1.1 1.2 -3.4 -4.0 0.8 2.8 -3.2 1.4 -0.43 -1.80 196 0.1393 -3.3 -2.9 0.8 1.6 -0.7 -5.8 0.5 3.3 -4.5 -2.5 1.2 1.4 -3.9 -4.9 0.9 3.1 -3.7 1.5 -0.42 -1.85 221 0.1234 -3.4 -2.9 0.9 1.7 -0.7 -6.1 0.5 3.5 -4.8 -2.7 1.3 1.5 -4.0 -4.9 1.0 3.4 -3.8 1.6 -0.43 -1.80 229 0.1405 -3.6 -3.2 0.9 1.8 -0.7 -6.3 0.6 3.7 -5.0 -2.9 1.3 1.6 -4.1 -5.1 1.1 3.6 -4.0 1.7 -0.43 -1.79 241 0.1416 -3.7 -3.2 1.0 1.9 -1.0 -6.6 0.6 3.8 -5.2 -3.1 1.4 1.6 -4.5 -5.3 1.2 3.8 -4.1 1.8 -0.43 -1.79 250 0.1417 -3.9 -3.3 1.0 1.9 -1.0 -6.7 0.7 3.9 -5.4 -3.2 1.4 1.7 -4.7 -5.6 1.1 4.0 -4.3 1.9 -0.43 -1.82 262 0.1318 -3.9 -3.3 1.0 2.0 -1.2 -7.0 0.7 4.0 -5.5 -3.3 1.5 1.7 -4.8 -5.7 1.2 4.1 -4.4 1.9 -0.43 -1.80 267 0.1399 -4.0 -3.4 1.1 2.1 -1.0 -7.0 0.7 4.2 -5.6 -3.5 1.5 1.8 -5.0 -6.1 1.2 4.2 -4.6 2.0 -0.43 -1.80 277 0.140
10 -4.2 -3.4 1.1 2.2 -1.1 -7.1 0.8 4.3 -5.7 -3.5 1.6 1.9 -5.1 -6.2 1.3 4.3 -4.7 2.1 -0.44 -1.78 283 0.14611 -4.2 -3.5 1.1 2.2 -1.2 -7.2 0.8 4.3 -5.9 -3.7 1.6 1.9 -5.3 -6.3 1.3 4.5 -4.8 2.1 -0.44 -1.79 291 0.14212 -4.3 -3.7 1.2 2.2 -1.1 -7.4 0.8 4.4 -5.9 -3.7 1.7 2.0 -5.3 -6.6 1.4 4.6 -4.9 2.1 -0.44 -1.79 297 0.14413 -4.4 -3.7 1.2 2.3 -1.2 -7.5 0.8 4.5 -6.0 -3.8 1.7 2.0 -5.4 -6.5 1.4 4.7 -5.0 2.2 -0.44 -1.78 301 0.14614 -4.5 -3.7 1.2 2.3 -1.2 -7.5 0.9 4.6 -6.1 -3.9 1.7 2.1 -5.5 -6.7 1.4 4.8 -5.1 2.2 -0.44 -1.78 307 0.14715 -4.6 -3.8 1.2 2.3 -1.2 -7.7 0.9 4.7 -6.2 -4.0 1.8 2.2 -5.6 -6.8 1.5 5.0 -5.2 2.3 -0.44 -1.78 313 0.14716 -4.6 -3.8 1.3 2.4 -1.2 -7.7 0.9 4.7 -6.3 -4.0 1.8 2.2 -5.7 -7.0 1.5 5.0 -5.2 2.3 -0.44 -1.77 317 0.14817 -4.7 -3.9 1.3 2.4 -1.2 -7.6 1.0 4.8 -6.4 -4.1 1.8 2.3 -5.7 -7.0 1.5 5.2 -5.3 2.4 -0.44 -1.77 323 0.15018 -4.8 -3.9 1.3 2.5 -1.4 -7.9 1.0 4.9 -6.6 -4.2 1.8 2.3 -6.1 -7.6 1.5 5.2 -5.5 2.4 -0.43 -1.81 334 0.13419 -4.8 -3.9 1.3 2.5 -1.4 -7.9 1.0 5.0 -6.5 -4.2 1.9 2.3 -5.8 -7.4 1.6 5.3 -5.4 2.4 -0.45 -1.75 331 0.15520 -4.9 -4.1 1.3 2.5 -1.5 -8.0 1.0 5.0 -6.6 -4.3 1.9 2.4 -6.0 -7.4 1.6 5.4 -5.5 2.4 -0.44 -1.77 337 0.14921 -4.9 -4.0 1.4 2.6 -1.5 -8.1 1.0 5.1 -6.7 -4.3 1.9 2.4 -6.2 -7.6 1.6 5.4 -5.6 2.5 -0.44 -1.77 340 0.15022 -4.9 -4.1 1.4 2.6 -1.5 -8.3 1.1 5.1 -6.7 -4.4 1.9 2.4 -6.2 -7.7 1.6 5.5 -5.7 2.5 -0.44 -1.76 345 0.15223 -5.0 -4.1 1.4 2.6 -1.5 -8.3 1.1 5.2 -6.8 -4.4 2.0 2.5 -6.2 -7.8 1.6 5.6 -5.7 2.5 -0.44 -1.76 348 0.15224 -5.1 -4.1 1.4 2.6 -1.5 -8.4 1.1 5.2 -6.9 -4.5 2.0 2.5 -6.4 -7.9 1.7 5.7 -5.8 2.6 -0.44 -1.77 354 0.14825 -5.1 -4.4 1.4 2.7 -1.5 -8.4 1.1 5.2 -7.0 -4.6 2.0 2.5 -6.3 -7.9 1.7 5.7 -5.9 2.6 -0.44 -1.78 357 0.14726 -5.2 -4.2 1.4 2.7 -1.7 -8.4 1.1 5.3 -7.0 -4.7 2.0 2.6 -6.3 -8.1 1.7 5.8 -5.9 2.6 -0.45 -1.76 360 0.15327 -5.2 -4.3 1.5 2.8 -1.7 -8.7 1.1 5.4 -7.1 -4.7 2.1 2.6 -6.5 -8.1 1.8 5.9 -6.0 2.7 -0.45 -1.75 363 0.15528 -5.3 -4.3 1.5 2.8 -1.6 -8.7 1.2 5.4 -7.3 -4.7 2.1 2.6 -6.6 -8.3 1.7 5.9 -6.1 2.7 -0.44 -1.77 369 0.14829 -5.3 -4.2 1.5 2.8 -1.6 -8.8 1.2 5.5 -7.3 -4.9 2.1 2.6 -6.6 -8.3 1.8 6.0 -6.1 2.7 -0.45 -1.75 371 0.15530 -5.4 -4.4 1.5 2.8 -1.8 -8.9 1.2 5.5 -7.3 -4.8 2.1 2.7 -6.8 -8.4 1.8 6.1 -6.2 2.7 -0.44 -1.76 375 0.15131 -5.4 -4.4 1.5 2.9 -1.8 -8.9 1.2 5.6 -7.3 -4.9 2.1 2.7 -6.8 -8.4 1.8 6.2 -6.2 2.8 -0.45 -1.75 377 0.15632 -5.3 -4.5 1.5 2.9 -1.8 -9.0 1.2 5.6 -7.4 -4.9 2.1 2.7 -6.9 -8.6 1.8 6.2 -6.3 2.8 -0.44 -1.76 381 0.15233 -5.4 -4.5 1.6 2.9 -1.8 -9.1 1.2 5.6 -7.5 -5.0 2.2 2.7 -7.0 -8.7 1.9 6.3 -6.3 2.8 -0.44 -1.76 386 0.151
KL 58/40 Sample #1 KL 58/40 Sample #10 KL 58/40 Sample #12 TrimmedNormalized Vertical and Horizontal Deformation Arrays
KL 58/40 Sample #8Mean
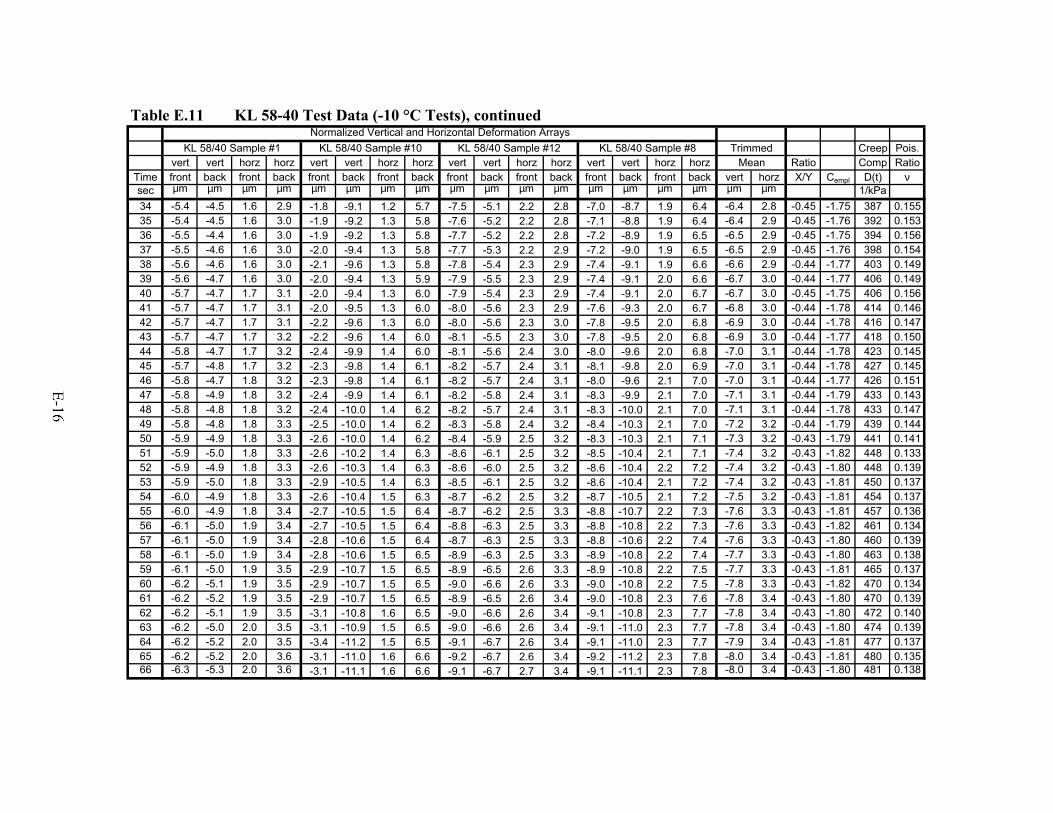
Table E.11 KL 58-40 Test Data (-10 °C Tests), continued
Creep Pois.vert vert horz horz vert vert horz horz vert vert horz horz vert vert horz horz Ratio Comp Ratio
Time front back front back front back front back front back front back front back front back vert horz X/Y Cempl D(t) νsec µm µm µm µm µm µm µm µm µm µm µm µm µm µm µm µm µm µm 1/kPa34 -5.4 -4.5 1.6 2.9 -1.8 -9.1 1.2 5.7 -7.5 -5.1 2.2 2.8 -7.0 -8.7 1.9 6.4 -6.4 2.8 -0.45 -1.75 387 0.15535 -5.4 -4.5 1.6 3.0 -1.9 -9.2 1.3 5.8 -7.6 -5.2 2.2 2.8 -7.1 -8.8 1.9 6.4 -6.4 2.9 -0.45 -1.76 392 0.15336 -5.5 -4.4 1.6 3.0 -1.9 -9.2 1.3 5.8 -7.7 -5.2 2.2 2.8 -7.2 -8.9 1.9 6.5 -6.5 2.9 -0.45 -1.75 394 0.15637 -5.5 -4.6 1.6 3.0 -2.0 -9.4 1.3 5.8 -7.7 -5.3 2.2 2.9 -7.2 -9.0 1.9 6.5 -6.5 2.9 -0.45 -1.76 398 0.15438 -5.6 -4.6 1.6 3.0 -2.1 -9.6 1.3 5.8 -7.8 -5.4 2.3 2.9 -7.4 -9.1 1.9 6.6 -6.6 2.9 -0.44 -1.77 403 0.14939 -5.6 -4.7 1.6 3.0 -2.0 -9.4 1.3 5.9 -7.9 -5.5 2.3 2.9 -7.4 -9.1 2.0 6.6 -6.7 3.0 -0.44 -1.77 406 0.14940 -5.7 -4.7 1.7 3.1 -2.0 -9.4 1.3 6.0 -7.9 -5.4 2.3 2.9 -7.4 -9.1 2.0 6.7 -6.7 3.0 -0.45 -1.75 406 0.15641 -5.7 -4.7 1.7 3.1 -2.0 -9.5 1.3 6.0 -8.0 -5.6 2.3 2.9 -7.6 -9.3 2.0 6.7 -6.8 3.0 -0.44 -1.78 414 0.14642 -5.7 -4.7 1.7 3.1 -2.2 -9.6 1.3 6.0 -8.0 -5.6 2.3 3.0 -7.8 -9.5 2.0 6.8 -6.9 3.0 -0.44 -1.78 416 0.14743 -5.7 -4.7 1.7 3.2 -2.2 -9.6 1.4 6.0 -8.1 -5.5 2.3 3.0 -7.8 -9.5 2.0 6.8 -6.9 3.0 -0.44 -1.77 418 0.15044 -5.8 -4.7 1.7 3.2 -2.4 -9.9 1.4 6.0 -8.1 -5.6 2.4 3.0 -8.0 -9.6 2.0 6.8 -7.0 3.1 -0.44 -1.78 423 0.14545 -5.7 -4.8 1.7 3.2 -2.3 -9.8 1.4 6.1 -8.2 -5.7 2.4 3.1 -8.1 -9.8 2.0 6.9 -7.0 3.1 -0.44 -1.78 427 0.14546 -5.8 -4.7 1.8 3.2 -2.3 -9.8 1.4 6.1 -8.2 -5.7 2.4 3.1 -8.0 -9.6 2.1 7.0 -7.0 3.1 -0.44 -1.77 426 0.15147 -5.8 -4.9 1.8 3.2 -2.4 -9.9 1.4 6.1 -8.2 -5.8 2.4 3.1 -8.3 -9.9 2.1 7.0 -7.1 3.1 -0.44 -1.79 433 0.14348 -5.8 -4.8 1.8 3.2 -2.4 -10.0 1.4 6.2 -8.2 -5.7 2.4 3.1 -8.3 -10.0 2.1 7.0 -7.1 3.1 -0.44 -1.78 433 0.14749 -5.8 -4.8 1.8 3.3 -2.5 -10.0 1.4 6.2 -8.3 -5.8 2.4 3.2 -8.4 -10.3 2.1 7.0 -7.2 3.2 -0.44 -1.79 439 0.14450 -5.9 -4.9 1.8 3.3 -2.6 -10.0 1.4 6.2 -8.4 -5.9 2.5 3.2 -8.3 -10.3 2.1 7.1 -7.3 3.2 -0.43 -1.79 441 0.14151 -5.9 -5.0 1.8 3.3 -2.6 -10.2 1.4 6.3 -8.6 -6.1 2.5 3.2 -8.5 -10.4 2.1 7.1 -7.4 3.2 -0.43 -1.82 448 0.13352 -5.9 -4.9 1.8 3.3 -2.6 -10.3 1.4 6.3 -8.6 -6.0 2.5 3.2 -8.6 -10.4 2.2 7.2 -7.4 3.2 -0.43 -1.80 448 0.13953 -5.9 -5.0 1.8 3.3 -2.9 -10.5 1.4 6.3 -8.5 -6.1 2.5 3.2 -8.6 -10.4 2.1 7.2 -7.4 3.2 -0.43 -1.81 450 0.13754 -6.0 -4.9 1.8 3.3 -2.6 -10.4 1.5 6.3 -8.7 -6.2 2.5 3.2 -8.7 -10.5 2.1 7.2 -7.5 3.2 -0.43 -1.81 454 0.13755 -6.0 -4.9 1.8 3.4 -2.7 -10.5 1.5 6.4 -8.7 -6.2 2.5 3.3 -8.8 -10.7 2.2 7.3 -7.6 3.3 -0.43 -1.81 457 0.13656 -6.1 -5.0 1.9 3.4 -2.7 -10.5 1.5 6.4 -8.8 -6.3 2.5 3.3 -8.8 -10.8 2.2 7.3 -7.6 3.3 -0.43 -1.82 461 0.13457 -6.1 -5.0 1.9 3.4 -2.8 -10.6 1.5 6.4 -8.7 -6.3 2.5 3.3 -8.8 -10.6 2.2 7.4 -7.6 3.3 -0.43 -1.80 460 0.13958 -6.1 -5.0 1.9 3.4 -2.8 -10.6 1.5 6.5 -8.9 -6.3 2.5 3.3 -8.9 -10.8 2.2 7.4 -7.7 3.3 -0.43 -1.80 463 0.13859 -6.1 -5.0 1.9 3.5 -2.9 -10.7 1.5 6.5 -8.9 -6.5 2.6 3.3 -8.9 -10.8 2.2 7.5 -7.7 3.3 -0.43 -1.81 465 0.13760 -6.2 -5.1 1.9 3.5 -2.9 -10.7 1.5 6.5 -9.0 -6.6 2.6 3.3 -9.0 -10.8 2.2 7.5 -7.8 3.3 -0.43 -1.82 470 0.13461 -6.2 -5.2 1.9 3.5 -2.9 -10.7 1.5 6.5 -8.9 -6.5 2.6 3.4 -9.0 -10.8 2.3 7.6 -7.8 3.4 -0.43 -1.80 470 0.13962 -6.2 -5.1 1.9 3.5 -3.1 -10.8 1.6 6.5 -9.0 -6.6 2.6 3.4 -9.1 -10.8 2.3 7.7 -7.8 3.4 -0.43 -1.80 472 0.14063 -6.2 -5.0 2.0 3.5 -3.1 -10.9 1.5 6.5 -9.0 -6.6 2.6 3.4 -9.1 -11.0 2.3 7.7 -7.8 3.4 -0.43 -1.80 474 0.13964 -6.2 -5.2 2.0 3.5 -3.4 -11.2 1.5 6.5 -9.1 -6.7 2.6 3.4 -9.1 -11.0 2.3 7.7 -7.9 3.4 -0.43 -1.81 477 0.13765 -6.2 -5.2 2.0 3.6 -3.1 -11.0 1.6 6.6 -9.2 -6.7 2.6 3.4 -9.2 -11.2 2.3 7.8 -8.0 3.4 -0.43 -1.81 480 0.13566 -6.3 -5.3 2.0 3.6 -3.1 -11.1 1.6 6.6 -9.1 -6.7 2.7 3.4 -9.1 -11.1 2.3 7.8 -8.0 3.4 -0.43 -1.80 481 0.138
Mean
Normalized Vertical and Horizontal Deformation ArraysKL 58/40 Sample #1 KL 58/40 Sample #10 KL 58/40 Sample #12 KL 58/40 Sample #8 Trimmed
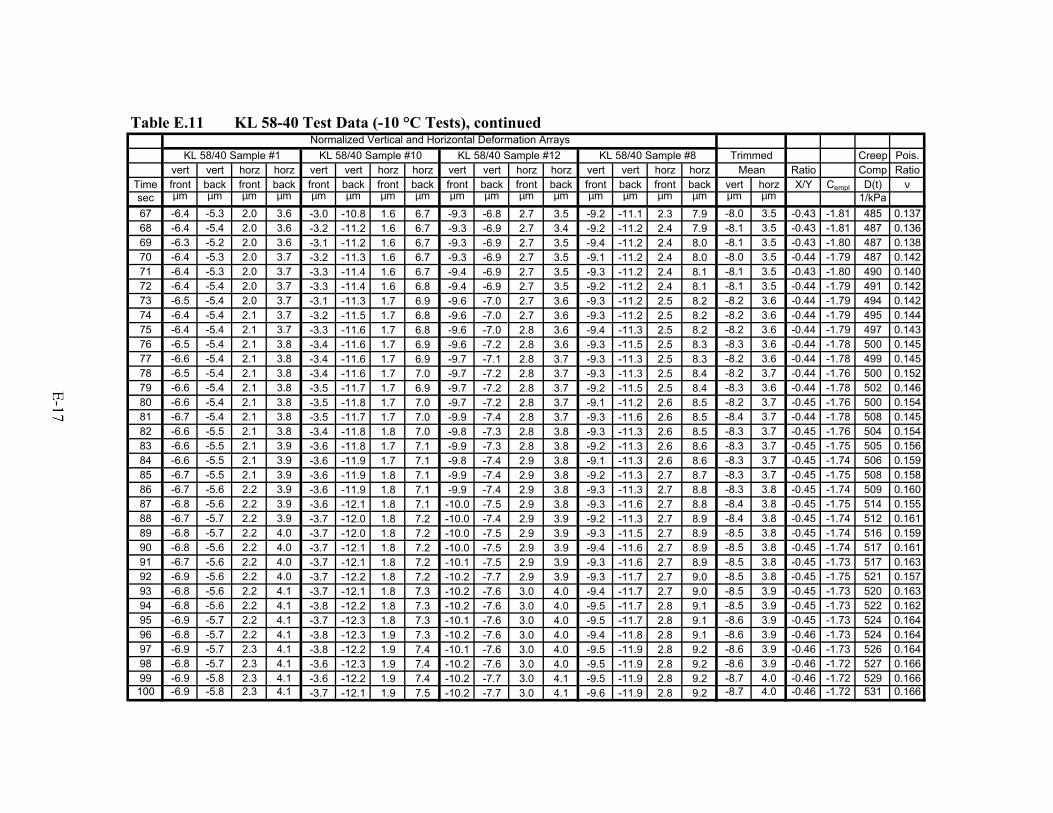
Table E.11 KL 58-40 Test Data (-10 °C Tests), continued
Creep Pois.vert vert horz horz vert vert horz horz vert vert horz horz vert vert horz horz Ratio Comp Ratio
Time front back front back front back front back front back front back front back front back vert horz X/Y Cempl D(t) νsec µm µm µm µm µm µm µm µm µm µm µm µm µm µm µm µm µm µm 1/kPa67 -6.4 -5.3 2.0 3.6 -3.0 -10.8 1.6 6.7 -9.3 -6.8 2.7 3.5 -9.2 -11.1 2.3 7.9 -8.0 3.5 -0.43 -1.81 485 0.13768 -6.4 -5.4 2.0 3.6 -3.2 -11.2 1.6 6.7 -9.3 -6.9 2.7 3.4 -9.2 -11.2 2.4 7.9 -8.1 3.5 -0.43 -1.81 487 0.13669 -6.3 -5.2 2.0 3.6 -3.1 -11.2 1.6 6.7 -9.3 -6.9 2.7 3.5 -9.4 -11.2 2.4 8.0 -8.1 3.5 -0.43 -1.80 487 0.13870 -6.4 -5.3 2.0 3.7 -3.2 -11.3 1.6 6.7 -9.3 -6.9 2.7 3.5 -9.1 -11.2 2.4 8.0 -8.0 3.5 -0.44 -1.79 487 0.14271 -6.4 -5.3 2.0 3.7 -3.3 -11.4 1.6 6.7 -9.4 -6.9 2.7 3.5 -9.3 -11.2 2.4 8.1 -8.1 3.5 -0.43 -1.80 490 0.14072 -6.4 -5.4 2.0 3.7 -3.3 -11.4 1.6 6.8 -9.4 -6.9 2.7 3.5 -9.2 -11.2 2.4 8.1 -8.1 3.5 -0.44 -1.79 491 0.14273 -6.5 -5.4 2.0 3.7 -3.1 -11.3 1.7 6.9 -9.6 -7.0 2.7 3.6 -9.3 -11.2 2.5 8.2 -8.2 3.6 -0.44 -1.79 494 0.14274 -6.4 -5.4 2.1 3.7 -3.2 -11.5 1.7 6.8 -9.6 -7.0 2.7 3.6 -9.3 -11.2 2.5 8.2 -8.2 3.6 -0.44 -1.79 495 0.14475 -6.4 -5.4 2.1 3.7 -3.3 -11.6 1.7 6.8 -9.6 -7.0 2.8 3.6 -9.4 -11.3 2.5 8.2 -8.2 3.6 -0.44 -1.79 497 0.14376 -6.5 -5.4 2.1 3.8 -3.4 -11.6 1.7 6.9 -9.6 -7.2 2.8 3.6 -9.3 -11.5 2.5 8.3 -8.3 3.6 -0.44 -1.78 500 0.14577 -6.6 -5.4 2.1 3.8 -3.4 -11.6 1.7 6.9 -9.7 -7.1 2.8 3.7 -9.3 -11.3 2.5 8.3 -8.2 3.6 -0.44 -1.78 499 0.14578 -6.5 -5.4 2.1 3.8 -3.4 -11.6 1.7 7.0 -9.7 -7.2 2.8 3.7 -9.3 -11.3 2.5 8.4 -8.2 3.7 -0.44 -1.76 500 0.15279 -6.6 -5.4 2.1 3.8 -3.5 -11.7 1.7 6.9 -9.7 -7.2 2.8 3.7 -9.2 -11.5 2.5 8.4 -8.3 3.6 -0.44 -1.78 502 0.14680 -6.6 -5.4 2.1 3.8 -3.5 -11.8 1.7 7.0 -9.7 -7.2 2.8 3.7 -9.1 -11.2 2.6 8.5 -8.2 3.7 -0.45 -1.76 500 0.15481 -6.7 -5.4 2.1 3.8 -3.5 -11.7 1.7 7.0 -9.9 -7.4 2.8 3.7 -9.3 -11.6 2.6 8.5 -8.4 3.7 -0.44 -1.78 508 0.14582 -6.6 -5.5 2.1 3.8 -3.4 -11.8 1.8 7.0 -9.8 -7.3 2.8 3.8 -9.3 -11.3 2.6 8.5 -8.3 3.7 -0.45 -1.76 504 0.15483 -6.6 -5.5 2.1 3.9 -3.6 -11.8 1.7 7.1 -9.9 -7.3 2.8 3.8 -9.2 -11.3 2.6 8.6 -8.3 3.7 -0.45 -1.75 505 0.15684 -6.6 -5.5 2.1 3.9 -3.6 -11.9 1.7 7.1 -9.8 -7.4 2.9 3.8 -9.1 -11.3 2.6 8.6 -8.3 3.7 -0.45 -1.74 506 0.15985 -6.7 -5.5 2.1 3.9 -3.6 -11.9 1.8 7.1 -9.9 -7.4 2.9 3.8 -9.2 -11.3 2.7 8.7 -8.3 3.7 -0.45 -1.75 508 0.15886 -6.7 -5.6 2.2 3.9 -3.6 -11.9 1.8 7.1 -9.9 -7.4 2.9 3.8 -9.3 -11.3 2.7 8.8 -8.3 3.8 -0.45 -1.74 509 0.16087 -6.8 -5.6 2.2 3.9 -3.6 -12.1 1.8 7.1 -10.0 -7.5 2.9 3.8 -9.3 -11.6 2.7 8.8 -8.4 3.8 -0.45 -1.75 514 0.15588 -6.7 -5.7 2.2 3.9 -3.7 -12.0 1.8 7.2 -10.0 -7.4 2.9 3.9 -9.2 -11.3 2.7 8.9 -8.4 3.8 -0.45 -1.74 512 0.16189 -6.8 -5.7 2.2 4.0 -3.7 -12.0 1.8 7.2 -10.0 -7.5 2.9 3.9 -9.3 -11.5 2.7 8.9 -8.5 3.8 -0.45 -1.74 516 0.15990 -6.8 -5.6 2.2 4.0 -3.7 -12.1 1.8 7.2 -10.0 -7.5 2.9 3.9 -9.4 -11.6 2.7 8.9 -8.5 3.8 -0.45 -1.74 517 0.16191 -6.7 -5.6 2.2 4.0 -3.7 -12.1 1.8 7.2 -10.1 -7.5 2.9 3.9 -9.3 -11.6 2.7 8.9 -8.5 3.8 -0.45 -1.73 517 0.16392 -6.9 -5.6 2.2 4.0 -3.7 -12.2 1.8 7.2 -10.2 -7.7 2.9 3.9 -9.3 -11.7 2.7 9.0 -8.5 3.8 -0.45 -1.75 521 0.15793 -6.8 -5.6 2.2 4.1 -3.7 -12.1 1.8 7.3 -10.2 -7.6 3.0 4.0 -9.4 -11.7 2.7 9.0 -8.5 3.9 -0.45 -1.73 520 0.16394 -6.8 -5.6 2.2 4.1 -3.8 -12.2 1.8 7.3 -10.2 -7.6 3.0 4.0 -9.5 -11.7 2.8 9.1 -8.5 3.9 -0.45 -1.73 522 0.16295 -6.9 -5.7 2.2 4.1 -3.7 -12.3 1.8 7.3 -10.1 -7.6 3.0 4.0 -9.5 -11.7 2.8 9.1 -8.6 3.9 -0.45 -1.73 524 0.16496 -6.8 -5.7 2.2 4.1 -3.8 -12.3 1.9 7.3 -10.2 -7.6 3.0 4.0 -9.4 -11.8 2.8 9.1 -8.6 3.9 -0.46 -1.73 524 0.16497 -6.9 -5.7 2.3 4.1 -3.8 -12.2 1.9 7.4 -10.1 -7.6 3.0 4.0 -9.5 -11.9 2.8 9.2 -8.6 3.9 -0.46 -1.73 526 0.16498 -6.8 -5.7 2.3 4.1 -3.6 -12.3 1.9 7.4 -10.2 -7.6 3.0 4.0 -9.5 -11.9 2.8 9.2 -8.6 3.9 -0.46 -1.72 527 0.16699 -6.9 -5.8 2.3 4.1 -3.6 -12.2 1.9 7.4 -10.2 -7.7 3.0 4.1 -9.5 -11.9 2.8 9.2 -8.7 4.0 -0.46 -1.72 529 0.166100 -6.9 -5.8 2.3 4.1 -3.7 -12.1 1.9 7.5 -10.2 -7.7 3.0 4.1 -9.6 -11.9 2.8 9.2 -8.7 4.0 -0.46 -1.72 531 0.166
Mean
Normalized Vertical and Horizontal Deformation ArraysKL 58/40 Sample #1 KL 58/40 Sample #10 KL 58/40 Sample #12 KL 58/40 Sample #8 Trimmed
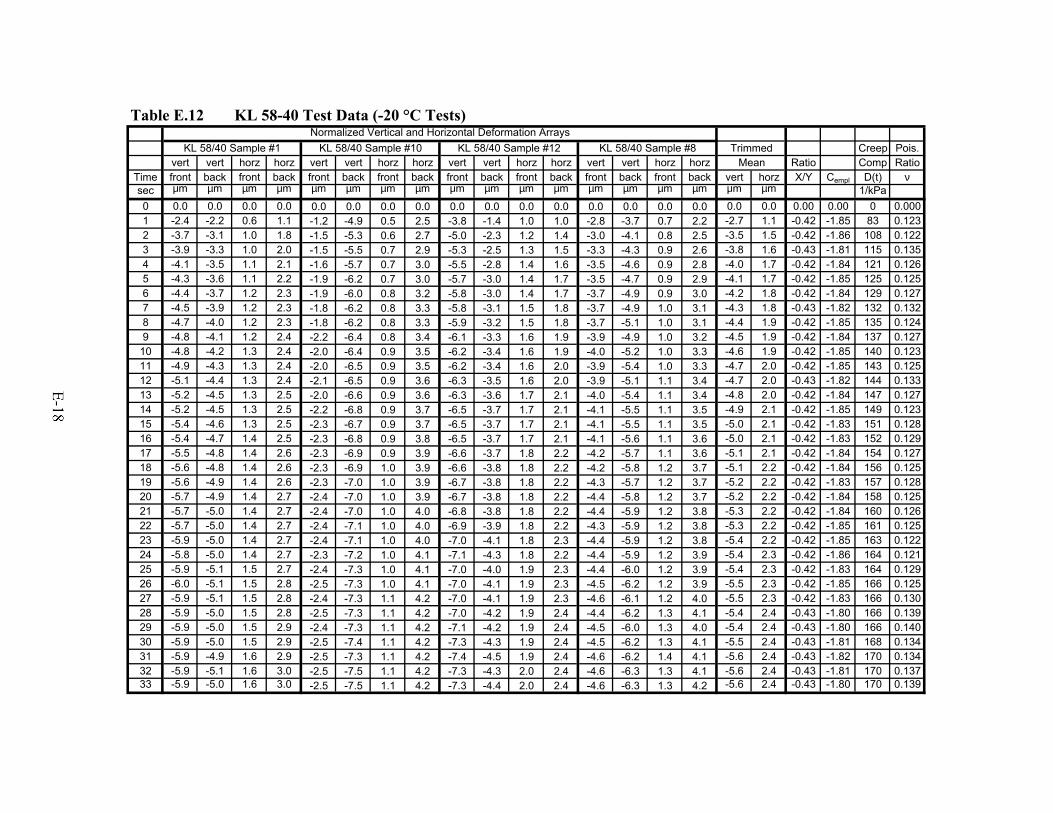
Table E.12 KL 58-40 Test Data (-20 °C Tests)
Creep Pois.vert vert horz horz vert vert horz horz vert vert horz horz vert vert horz horz Ratio Comp Ratio
Time front back front back front back front back front back front back front back front back vert horz X/Y Cempl D(t) νsec µm µm µm µm µm µm µm µm µm µm µm µm µm µm µm µm µm µm 1/kPa0 0.0 0.0 0.0 0.0 0.0 0.0 0.0 0.0 0.0 0.0 0.0 0.0 0.0 0.0 0.0 0.0 0.0 0.0 0.00 0.00 0 0.0001 -2.4 -2.2 0.6 1.1 -1.2 -4.9 0.5 2.5 -3.8 -1.4 1.0 1.0 -2.8 -3.7 0.7 2.2 -2.7 1.1 -0.42 -1.85 83 0.1232 -3.7 -3.1 1.0 1.8 -1.5 -5.3 0.6 2.7 -5.0 -2.3 1.2 1.4 -3.0 -4.1 0.8 2.5 -3.5 1.5 -0.42 -1.86 108 0.1223 -3.9 -3.3 1.0 2.0 -1.5 -5.5 0.7 2.9 -5.3 -2.5 1.3 1.5 -3.3 -4.3 0.9 2.6 -3.8 1.6 -0.43 -1.81 115 0.1354 -4.1 -3.5 1.1 2.1 -1.6 -5.7 0.7 3.0 -5.5 -2.8 1.4 1.6 -3.5 -4.6 0.9 2.8 -4.0 1.7 -0.42 -1.84 121 0.1265 -4.3 -3.6 1.1 2.2 -1.9 -6.2 0.7 3.0 -5.7 -3.0 1.4 1.7 -3.5 -4.7 0.9 2.9 -4.1 1.7 -0.42 -1.85 125 0.1256 -4.4 -3.7 1.2 2.3 -1.9 -6.0 0.8 3.2 -5.8 -3.0 1.4 1.7 -3.7 -4.9 0.9 3.0 -4.2 1.8 -0.42 -1.84 129 0.1277 -4.5 -3.9 1.2 2.3 -1.8 -6.2 0.8 3.3 -5.8 -3.1 1.5 1.8 -3.7 -4.9 1.0 3.1 -4.3 1.8 -0.43 -1.82 132 0.1328 -4.7 -4.0 1.2 2.3 -1.8 -6.2 0.8 3.3 -5.9 -3.2 1.5 1.8 -3.7 -5.1 1.0 3.1 -4.4 1.9 -0.42 -1.85 135 0.1249 -4.8 -4.1 1.2 2.4 -2.2 -6.4 0.8 3.4 -6.1 -3.3 1.6 1.9 -3.9 -4.9 1.0 3.2 -4.5 1.9 -0.42 -1.84 137 0.127
10 -4.8 -4.2 1.3 2.4 -2.0 -6.4 0.9 3.5 -6.2 -3.4 1.6 1.9 -4.0 -5.2 1.0 3.3 -4.6 1.9 -0.42 -1.85 140 0.12311 -4.9 -4.3 1.3 2.4 -2.0 -6.5 0.9 3.5 -6.2 -3.4 1.6 2.0 -3.9 -5.4 1.0 3.3 -4.7 2.0 -0.42 -1.85 143 0.12512 -5.1 -4.4 1.3 2.4 -2.1 -6.5 0.9 3.6 -6.3 -3.5 1.6 2.0 -3.9 -5.1 1.1 3.4 -4.7 2.0 -0.43 -1.82 144 0.13313 -5.2 -4.5 1.3 2.5 -2.0 -6.6 0.9 3.6 -6.3 -3.6 1.7 2.1 -4.0 -5.4 1.1 3.4 -4.8 2.0 -0.42 -1.84 147 0.12714 -5.2 -4.5 1.3 2.5 -2.2 -6.8 0.9 3.7 -6.5 -3.7 1.7 2.1 -4.1 -5.5 1.1 3.5 -4.9 2.1 -0.42 -1.85 149 0.12315 -5.4 -4.6 1.3 2.5 -2.3 -6.7 0.9 3.7 -6.5 -3.7 1.7 2.1 -4.1 -5.5 1.1 3.5 -5.0 2.1 -0.42 -1.83 151 0.12816 -5.4 -4.7 1.4 2.5 -2.3 -6.8 0.9 3.8 -6.5 -3.7 1.7 2.1 -4.1 -5.6 1.1 3.6 -5.0 2.1 -0.42 -1.83 152 0.12917 -5.5 -4.8 1.4 2.6 -2.3 -6.9 0.9 3.9 -6.6 -3.7 1.8 2.2 -4.2 -5.7 1.1 3.6 -5.1 2.1 -0.42 -1.84 154 0.12718 -5.6 -4.8 1.4 2.6 -2.3 -6.9 1.0 3.9 -6.6 -3.8 1.8 2.2 -4.2 -5.8 1.2 3.7 -5.1 2.2 -0.42 -1.84 156 0.12519 -5.6 -4.9 1.4 2.6 -2.3 -7.0 1.0 3.9 -6.7 -3.8 1.8 2.2 -4.3 -5.7 1.2 3.7 -5.2 2.2 -0.42 -1.83 157 0.12820 -5.7 -4.9 1.4 2.7 -2.4 -7.0 1.0 3.9 -6.7 -3.8 1.8 2.2 -4.4 -5.8 1.2 3.7 -5.2 2.2 -0.42 -1.84 158 0.12521 -5.7 -5.0 1.4 2.7 -2.4 -7.0 1.0 4.0 -6.8 -3.8 1.8 2.2 -4.4 -5.9 1.2 3.8 -5.3 2.2 -0.42 -1.84 160 0.12622 -5.7 -5.0 1.4 2.7 -2.4 -7.1 1.0 4.0 -6.9 -3.9 1.8 2.2 -4.3 -5.9 1.2 3.8 -5.3 2.2 -0.42 -1.85 161 0.12523 -5.9 -5.0 1.4 2.7 -2.4 -7.1 1.0 4.0 -7.0 -4.1 1.8 2.3 -4.4 -5.9 1.2 3.8 -5.4 2.2 -0.42 -1.85 163 0.12224 -5.8 -5.0 1.4 2.7 -2.3 -7.2 1.0 4.1 -7.1 -4.3 1.8 2.2 -4.4 -5.9 1.2 3.9 -5.4 2.3 -0.42 -1.86 164 0.12125 -5.9 -5.1 1.5 2.7 -2.4 -7.3 1.0 4.1 -7.0 -4.0 1.9 2.3 -4.4 -6.0 1.2 3.9 -5.4 2.3 -0.42 -1.83 164 0.12926 -6.0 -5.1 1.5 2.8 -2.5 -7.3 1.0 4.1 -7.0 -4.1 1.9 2.3 -4.5 -6.2 1.2 3.9 -5.5 2.3 -0.42 -1.85 166 0.12527 -5.9 -5.1 1.5 2.8 -2.4 -7.3 1.1 4.2 -7.0 -4.1 1.9 2.3 -4.6 -6.1 1.2 4.0 -5.5 2.3 -0.42 -1.83 166 0.13028 -5.9 -5.0 1.5 2.8 -2.5 -7.3 1.1 4.2 -7.0 -4.2 1.9 2.4 -4.4 -6.2 1.3 4.1 -5.4 2.4 -0.43 -1.80 166 0.13929 -5.9 -5.0 1.5 2.9 -2.4 -7.3 1.1 4.2 -7.1 -4.2 1.9 2.4 -4.5 -6.0 1.3 4.0 -5.4 2.4 -0.43 -1.80 166 0.14030 -5.9 -5.0 1.5 2.9 -2.5 -7.4 1.1 4.2 -7.3 -4.3 1.9 2.4 -4.5 -6.2 1.3 4.1 -5.5 2.4 -0.43 -1.81 168 0.13431 -5.9 -4.9 1.6 2.9 -2.5 -7.3 1.1 4.2 -7.4 -4.5 1.9 2.4 -4.6 -6.2 1.4 4.1 -5.6 2.4 -0.43 -1.82 170 0.13432 -5.9 -5.1 1.6 3.0 -2.5 -7.5 1.1 4.2 -7.3 -4.3 2.0 2.4 -4.6 -6.3 1.3 4.1 -5.6 2.4 -0.43 -1.81 170 0.13733 -5.9 -5.0 1.6 3.0 -2.5 -7.5 1.1 4.2 -7.3 -4.4 2.0 2.4 -4.6 -6.3 1.3 4.2 -5.6 2.4 -0.43 -1.80 170 0.139
KL 58/40 Sample #1 KL 58/40 Sample #10 KL 58/40 Sample #12 TrimmedNormalized Vertical and Horizontal Deformation Arrays
KL 58/40 Sample #8Mean
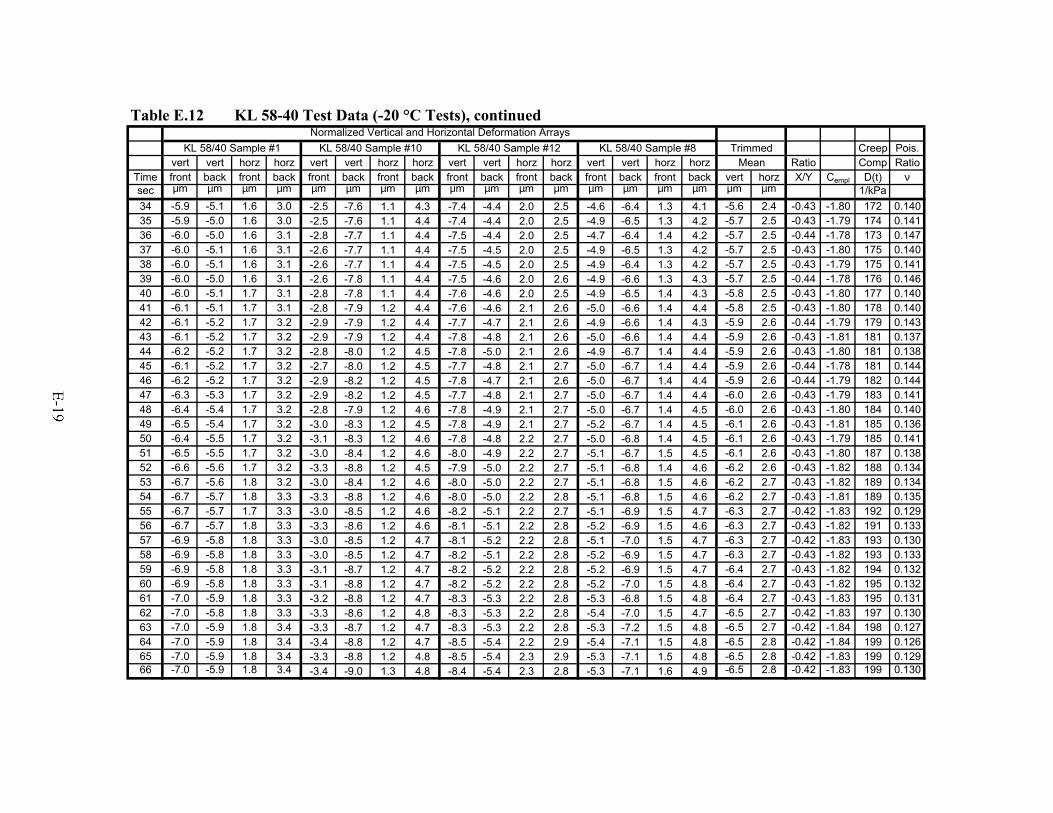
Table E.12 KL 58-40 Test Data (-20 °C Tests), continued
Creep Pois.vert vert horz horz vert vert horz horz vert vert horz horz vert vert horz horz Ratio Comp Ratio
Time front back front back front back front back front back front back front back front back vert horz X/Y Cempl D(t) νsec µm µm µm µm µm µm µm µm µm µm µm µm µm µm µm µm µm µm 1/kPa34 -5.9 -5.1 1.6 3.0 -2.5 -7.6 1.1 4.3 -7.4 -4.4 2.0 2.5 -4.6 -6.4 1.3 4.1 -5.6 2.4 -0.43 -1.80 172 0.14035 -5.9 -5.0 1.6 3.0 -2.5 -7.6 1.1 4.4 -7.4 -4.4 2.0 2.5 -4.9 -6.5 1.3 4.2 -5.7 2.5 -0.43 -1.79 174 0.14136 -6.0 -5.0 1.6 3.1 -2.8 -7.7 1.1 4.4 -7.5 -4.4 2.0 2.5 -4.7 -6.4 1.4 4.2 -5.7 2.5 -0.44 -1.78 173 0.14737 -6.0 -5.1 1.6 3.1 -2.6 -7.7 1.1 4.4 -7.5 -4.5 2.0 2.5 -4.9 -6.5 1.3 4.2 -5.7 2.5 -0.43 -1.80 175 0.14038 -6.0 -5.1 1.6 3.1 -2.6 -7.7 1.1 4.4 -7.5 -4.5 2.0 2.5 -4.9 -6.4 1.3 4.2 -5.7 2.5 -0.43 -1.79 175 0.14139 -6.0 -5.0 1.6 3.1 -2.6 -7.8 1.1 4.4 -7.5 -4.6 2.0 2.6 -4.9 -6.6 1.3 4.3 -5.7 2.5 -0.44 -1.78 176 0.14640 -6.0 -5.1 1.7 3.1 -2.8 -7.8 1.1 4.4 -7.6 -4.6 2.0 2.5 -4.9 -6.5 1.4 4.3 -5.8 2.5 -0.43 -1.80 177 0.14041 -6.1 -5.1 1.7 3.1 -2.8 -7.9 1.2 4.4 -7.6 -4.6 2.1 2.6 -5.0 -6.6 1.4 4.4 -5.8 2.5 -0.43 -1.80 178 0.14042 -6.1 -5.2 1.7 3.2 -2.9 -7.9 1.2 4.4 -7.7 -4.7 2.1 2.6 -4.9 -6.6 1.4 4.3 -5.9 2.6 -0.44 -1.79 179 0.14343 -6.1 -5.2 1.7 3.2 -2.9 -7.9 1.2 4.4 -7.8 -4.8 2.1 2.6 -5.0 -6.6 1.4 4.4 -5.9 2.6 -0.43 -1.81 181 0.13744 -6.2 -5.2 1.7 3.2 -2.8 -8.0 1.2 4.5 -7.8 -5.0 2.1 2.6 -4.9 -6.7 1.4 4.4 -5.9 2.6 -0.43 -1.80 181 0.13845 -6.1 -5.2 1.7 3.2 -2.7 -8.0 1.2 4.5 -7.7 -4.8 2.1 2.7 -5.0 -6.7 1.4 4.4 -5.9 2.6 -0.44 -1.78 181 0.14446 -6.2 -5.2 1.7 3.2 -2.9 -8.2 1.2 4.5 -7.8 -4.7 2.1 2.6 -5.0 -6.7 1.4 4.4 -5.9 2.6 -0.44 -1.79 182 0.14447 -6.3 -5.3 1.7 3.2 -2.9 -8.2 1.2 4.5 -7.7 -4.8 2.1 2.7 -5.0 -6.7 1.4 4.4 -6.0 2.6 -0.43 -1.79 183 0.14148 -6.4 -5.4 1.7 3.2 -2.8 -7.9 1.2 4.6 -7.8 -4.9 2.1 2.7 -5.0 -6.7 1.4 4.5 -6.0 2.6 -0.43 -1.80 184 0.14049 -6.5 -5.4 1.7 3.2 -3.0 -8.3 1.2 4.5 -7.8 -4.9 2.1 2.7 -5.2 -6.7 1.4 4.5 -6.1 2.6 -0.43 -1.81 185 0.13650 -6.4 -5.5 1.7 3.2 -3.1 -8.3 1.2 4.6 -7.8 -4.8 2.2 2.7 -5.0 -6.8 1.4 4.5 -6.1 2.6 -0.43 -1.79 185 0.14151 -6.5 -5.5 1.7 3.2 -3.0 -8.4 1.2 4.6 -8.0 -4.9 2.2 2.7 -5.1 -6.7 1.5 4.5 -6.1 2.6 -0.43 -1.80 187 0.13852 -6.6 -5.6 1.7 3.2 -3.3 -8.8 1.2 4.5 -7.9 -5.0 2.2 2.7 -5.1 -6.8 1.4 4.6 -6.2 2.6 -0.43 -1.82 188 0.13453 -6.7 -5.6 1.8 3.2 -3.0 -8.4 1.2 4.6 -8.0 -5.0 2.2 2.7 -5.1 -6.8 1.5 4.6 -6.2 2.7 -0.43 -1.82 189 0.13454 -6.7 -5.7 1.8 3.3 -3.3 -8.8 1.2 4.6 -8.0 -5.0 2.2 2.8 -5.1 -6.8 1.5 4.6 -6.2 2.7 -0.43 -1.81 189 0.13555 -6.7 -5.7 1.7 3.3 -3.0 -8.5 1.2 4.6 -8.2 -5.1 2.2 2.7 -5.1 -6.9 1.5 4.7 -6.3 2.7 -0.42 -1.83 192 0.12956 -6.7 -5.7 1.8 3.3 -3.3 -8.6 1.2 4.6 -8.1 -5.1 2.2 2.8 -5.2 -6.9 1.5 4.6 -6.3 2.7 -0.43 -1.82 191 0.13357 -6.9 -5.8 1.8 3.3 -3.0 -8.5 1.2 4.7 -8.1 -5.2 2.2 2.8 -5.1 -7.0 1.5 4.7 -6.3 2.7 -0.42 -1.83 193 0.13058 -6.9 -5.8 1.8 3.3 -3.0 -8.5 1.2 4.7 -8.2 -5.1 2.2 2.8 -5.2 -6.9 1.5 4.7 -6.3 2.7 -0.43 -1.82 193 0.13359 -6.9 -5.8 1.8 3.3 -3.1 -8.7 1.2 4.7 -8.2 -5.2 2.2 2.8 -5.2 -6.9 1.5 4.7 -6.4 2.7 -0.43 -1.82 194 0.13260 -6.9 -5.8 1.8 3.3 -3.1 -8.8 1.2 4.7 -8.2 -5.2 2.2 2.8 -5.2 -7.0 1.5 4.8 -6.4 2.7 -0.43 -1.82 195 0.13261 -7.0 -5.9 1.8 3.3 -3.2 -8.8 1.2 4.7 -8.3 -5.3 2.2 2.8 -5.3 -6.8 1.5 4.8 -6.4 2.7 -0.43 -1.83 195 0.13162 -7.0 -5.8 1.8 3.3 -3.3 -8.6 1.2 4.8 -8.3 -5.3 2.2 2.8 -5.4 -7.0 1.5 4.7 -6.5 2.7 -0.42 -1.83 197 0.13063 -7.0 -5.9 1.8 3.4 -3.3 -8.7 1.2 4.7 -8.3 -5.3 2.2 2.8 -5.3 -7.2 1.5 4.8 -6.5 2.7 -0.42 -1.84 198 0.12764 -7.0 -5.9 1.8 3.4 -3.4 -8.8 1.2 4.7 -8.5 -5.4 2.2 2.9 -5.4 -7.1 1.5 4.8 -6.5 2.8 -0.42 -1.84 199 0.12665 -7.0 -5.9 1.8 3.4 -3.3 -8.8 1.2 4.8 -8.5 -5.4 2.3 2.9 -5.3 -7.1 1.5 4.8 -6.5 2.8 -0.42 -1.83 199 0.12966 -7.0 -5.9 1.8 3.4 -3.4 -9.0 1.3 4.8 -8.4 -5.4 2.3 2.8 -5.3 -7.1 1.6 4.9 -6.5 2.8 -0.42 -1.83 199 0.130
Mean
Normalized Vertical and Horizontal Deformation ArraysKL 58/40 Sample #1 KL 58/40 Sample #10 KL 58/40 Sample #12 KL 58/40 Sample #8 Trimmed
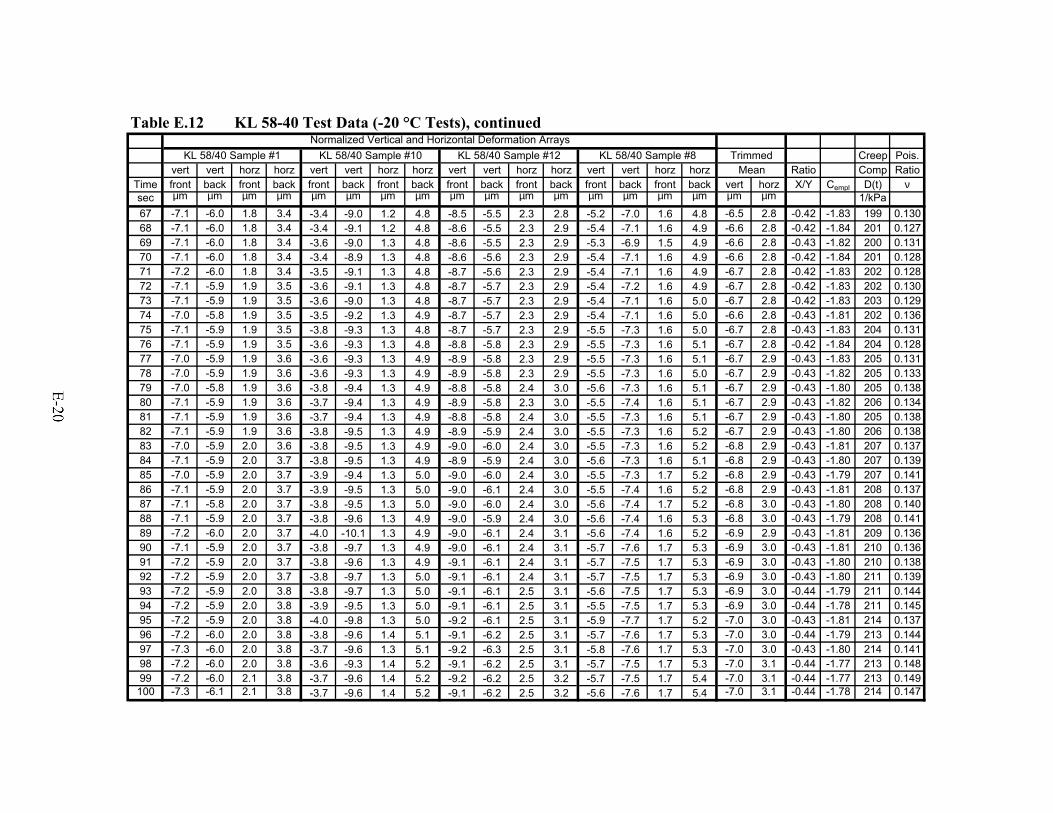
Table E.12 KL 58-40 Test Data (-20 °C Tests), continued
Creep Pois.vert vert horz horz vert vert horz horz vert vert horz horz vert vert horz horz Ratio Comp Ratio
Time front back front back front back front back front back front back front back front back vert horz X/Y Cempl D(t) νsec µm µm µm µm µm µm µm µm µm µm µm µm µm µm µm µm µm µm 1/kPa67 -7.1 -6.0 1.8 3.4 -3.4 -9.0 1.2 4.8 -8.5 -5.5 2.3 2.8 -5.2 -7.0 1.6 4.8 -6.5 2.8 -0.42 -1.83 199 0.13068 -7.1 -6.0 1.8 3.4 -3.4 -9.1 1.2 4.8 -8.6 -5.5 2.3 2.9 -5.4 -7.1 1.6 4.9 -6.6 2.8 -0.42 -1.84 201 0.12769 -7.1 -6.0 1.8 3.4 -3.6 -9.0 1.3 4.8 -8.6 -5.5 2.3 2.9 -5.3 -6.9 1.5 4.9 -6.6 2.8 -0.43 -1.82 200 0.13170 -7.1 -6.0 1.8 3.4 -3.4 -8.9 1.3 4.8 -8.6 -5.6 2.3 2.9 -5.4 -7.1 1.6 4.9 -6.6 2.8 -0.42 -1.84 201 0.12871 -7.2 -6.0 1.8 3.4 -3.5 -9.1 1.3 4.8 -8.7 -5.6 2.3 2.9 -5.4 -7.1 1.6 4.9 -6.7 2.8 -0.42 -1.83 202 0.12872 -7.1 -5.9 1.9 3.5 -3.6 -9.1 1.3 4.8 -8.7 -5.7 2.3 2.9 -5.4 -7.2 1.6 4.9 -6.7 2.8 -0.42 -1.83 202 0.13073 -7.1 -5.9 1.9 3.5 -3.6 -9.0 1.3 4.8 -8.7 -5.7 2.3 2.9 -5.4 -7.1 1.6 5.0 -6.7 2.8 -0.42 -1.83 203 0.12974 -7.0 -5.8 1.9 3.5 -3.5 -9.2 1.3 4.9 -8.7 -5.7 2.3 2.9 -5.4 -7.1 1.6 5.0 -6.6 2.8 -0.43 -1.81 202 0.13675 -7.1 -5.9 1.9 3.5 -3.8 -9.3 1.3 4.8 -8.7 -5.7 2.3 2.9 -5.5 -7.3 1.6 5.0 -6.7 2.8 -0.43 -1.83 204 0.13176 -7.1 -5.9 1.9 3.5 -3.6 -9.3 1.3 4.8 -8.8 -5.8 2.3 2.9 -5.5 -7.3 1.6 5.1 -6.7 2.8 -0.42 -1.84 204 0.12877 -7.0 -5.9 1.9 3.6 -3.6 -9.3 1.3 4.9 -8.9 -5.8 2.3 2.9 -5.5 -7.3 1.6 5.1 -6.7 2.9 -0.43 -1.83 205 0.13178 -7.0 -5.9 1.9 3.6 -3.6 -9.3 1.3 4.9 -8.9 -5.8 2.3 2.9 -5.5 -7.3 1.6 5.0 -6.7 2.9 -0.43 -1.82 205 0.13379 -7.0 -5.8 1.9 3.6 -3.8 -9.4 1.3 4.9 -8.8 -5.8 2.4 3.0 -5.6 -7.3 1.6 5.1 -6.7 2.9 -0.43 -1.80 205 0.13880 -7.1 -5.9 1.9 3.6 -3.7 -9.4 1.3 4.9 -8.9 -5.8 2.3 3.0 -5.5 -7.4 1.6 5.1 -6.7 2.9 -0.43 -1.82 206 0.13481 -7.1 -5.9 1.9 3.6 -3.7 -9.4 1.3 4.9 -8.8 -5.8 2.4 3.0 -5.5 -7.3 1.6 5.1 -6.7 2.9 -0.43 -1.80 205 0.13882 -7.1 -5.9 1.9 3.6 -3.8 -9.5 1.3 4.9 -8.9 -5.9 2.4 3.0 -5.5 -7.3 1.6 5.2 -6.7 2.9 -0.43 -1.80 206 0.13883 -7.0 -5.9 2.0 3.6 -3.8 -9.5 1.3 4.9 -9.0 -6.0 2.4 3.0 -5.5 -7.3 1.6 5.2 -6.8 2.9 -0.43 -1.81 207 0.13784 -7.1 -5.9 2.0 3.7 -3.8 -9.5 1.3 4.9 -8.9 -5.9 2.4 3.0 -5.6 -7.3 1.6 5.1 -6.8 2.9 -0.43 -1.80 207 0.13985 -7.0 -5.9 2.0 3.7 -3.9 -9.4 1.3 5.0 -9.0 -6.0 2.4 3.0 -5.5 -7.3 1.7 5.2 -6.8 2.9 -0.43 -1.79 207 0.14186 -7.1 -5.9 2.0 3.7 -3.9 -9.5 1.3 5.0 -9.0 -6.1 2.4 3.0 -5.5 -7.4 1.6 5.2 -6.8 2.9 -0.43 -1.81 208 0.13787 -7.1 -5.8 2.0 3.7 -3.8 -9.5 1.3 5.0 -9.0 -6.0 2.4 3.0 -5.6 -7.4 1.7 5.2 -6.8 3.0 -0.43 -1.80 208 0.14088 -7.1 -5.9 2.0 3.7 -3.8 -9.6 1.3 4.9 -9.0 -5.9 2.4 3.0 -5.6 -7.4 1.6 5.3 -6.8 3.0 -0.43 -1.79 208 0.14189 -7.2 -6.0 2.0 3.7 -4.0 -10.1 1.3 4.9 -9.0 -6.1 2.4 3.1 -5.6 -7.4 1.6 5.2 -6.9 2.9 -0.43 -1.81 209 0.13690 -7.1 -5.9 2.0 3.7 -3.8 -9.7 1.3 4.9 -9.0 -6.1 2.4 3.1 -5.7 -7.6 1.7 5.3 -6.9 3.0 -0.43 -1.81 210 0.13691 -7.2 -5.9 2.0 3.7 -3.8 -9.6 1.3 4.9 -9.1 -6.1 2.4 3.1 -5.7 -7.5 1.7 5.3 -6.9 3.0 -0.43 -1.80 210 0.13892 -7.2 -5.9 2.0 3.7 -3.8 -9.7 1.3 5.0 -9.1 -6.1 2.4 3.1 -5.7 -7.5 1.7 5.3 -6.9 3.0 -0.43 -1.80 211 0.13993 -7.2 -5.9 2.0 3.8 -3.8 -9.7 1.3 5.0 -9.1 -6.1 2.5 3.1 -5.6 -7.5 1.7 5.3 -6.9 3.0 -0.44 -1.79 211 0.14494 -7.2 -5.9 2.0 3.8 -3.9 -9.5 1.3 5.0 -9.1 -6.1 2.5 3.1 -5.5 -7.5 1.7 5.3 -6.9 3.0 -0.44 -1.78 211 0.14595 -7.2 -5.9 2.0 3.8 -4.0 -9.8 1.3 5.0 -9.2 -6.1 2.5 3.1 -5.9 -7.7 1.7 5.2 -7.0 3.0 -0.43 -1.81 214 0.13796 -7.2 -6.0 2.0 3.8 -3.8 -9.6 1.4 5.1 -9.1 -6.2 2.5 3.1 -5.7 -7.6 1.7 5.3 -7.0 3.0 -0.44 -1.79 213 0.14497 -7.3 -6.0 2.0 3.8 -3.7 -9.6 1.3 5.1 -9.2 -6.3 2.5 3.1 -5.8 -7.6 1.7 5.3 -7.0 3.0 -0.43 -1.80 214 0.14198 -7.2 -6.0 2.0 3.8 -3.6 -9.3 1.4 5.2 -9.1 -6.2 2.5 3.1 -5.7 -7.5 1.7 5.3 -7.0 3.1 -0.44 -1.77 213 0.14899 -7.2 -6.0 2.1 3.8 -3.7 -9.6 1.4 5.2 -9.2 -6.2 2.5 3.2 -5.7 -7.5 1.7 5.4 -7.0 3.1 -0.44 -1.77 213 0.149100 -7.3 -6.1 2.1 3.8 -3.7 -9.6 1.4 5.2 -9.1 -6.2 2.5 3.2 -5.6 -7.6 1.7 5.4 -7.0 3.1 -0.44 -1.78 214 0.147
Mean
Normalized Vertical and Horizontal Deformation ArraysKL 58/40 Sample #1 KL 58/40 Sample #10 KL 58/40 Sample #12 KL 58/40 Sample #8 Trimmed
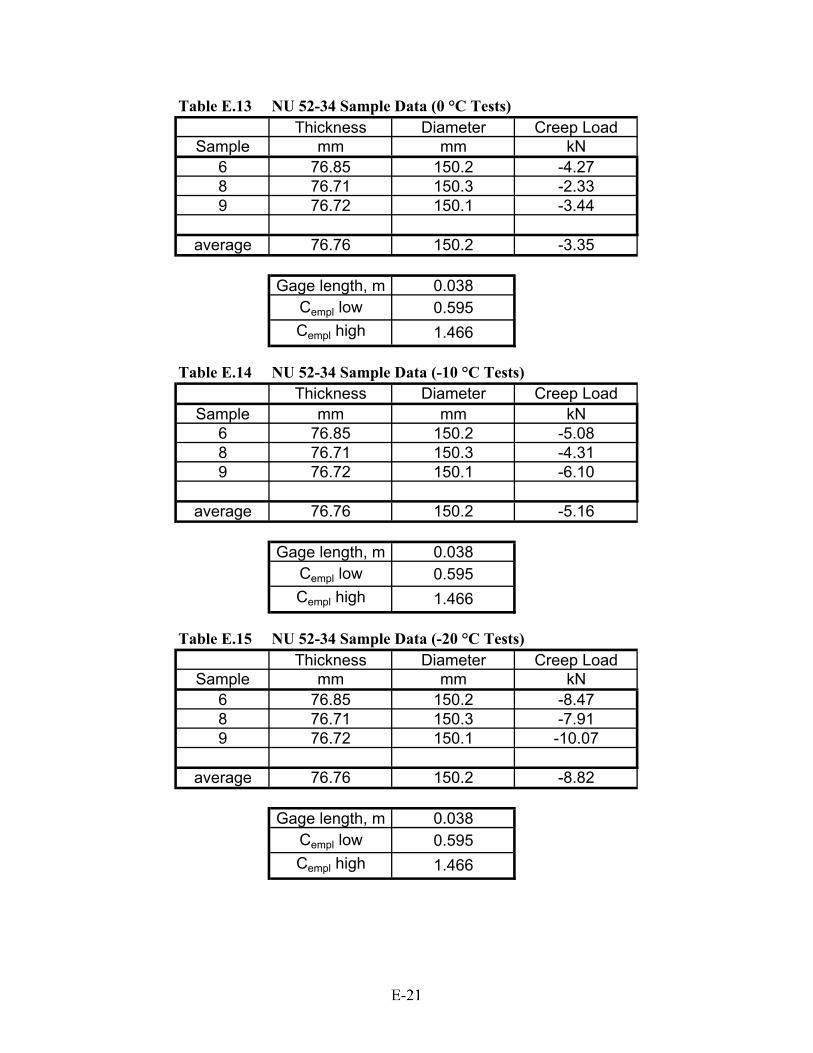
Table E.13 NU 52-34 Sample Data (0 °C Tests)Thickness Diameter Creep Load
Sample mm mm kN6 76.85 150.2 -4.278 76.71 150.3 -2.339 76.72 150.1 -3.44
average 76.76 150.2 -3.35
Gage length, m 0.038Cempl low 0.595Cempl high 1.466
Table E.14 NU 52-34 Sample Data (-10 °C Tests)Thickness Diameter Creep Load
Sample mm mm kN6 76.85 150.2 -5.088 76.71 150.3 -4.319 76.72 150.1 -6.10
average 76.76 150.2 -5.16
Gage length, m 0.038Cempl low 0.595Cempl high 1.466
Table E.15 NU 52-34 Sample Data (-20 °C Tests)Thickness Diameter Creep Load
Sample mm mm kN6 76.85 150.2 -8.478 76.71 150.3 -7.919 76.72 150.1 -10.07
average 76.76 150.2 -8.82
Gage length, m 0.038Cempl low 0.595Cempl high 1.466
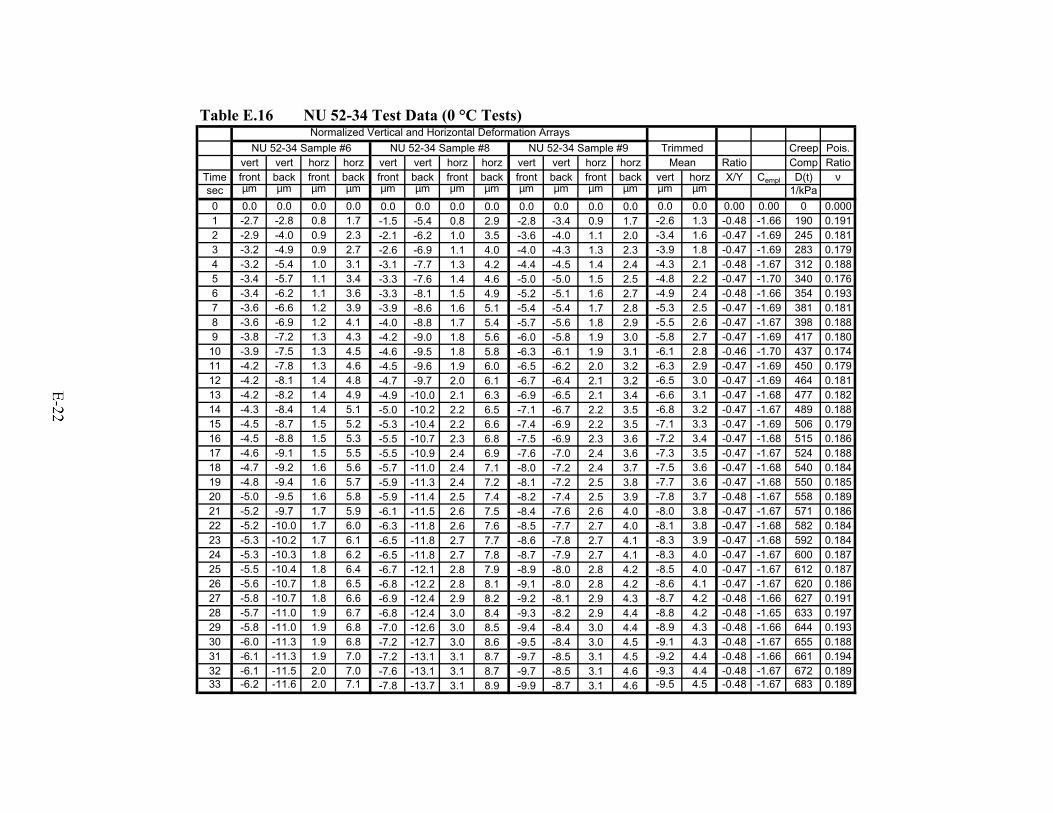
Table E.16 NU 52-34 Test Data (0 °C Tests)
Creep Pois.vert vert horz horz vert vert horz horz vert vert horz horz Ratio Comp Ratio
Time front back front back front back front back front back front back vert horz X/Y Cempl D(t) νsec µm µm µm µm µm µm µm µm µm µm µm µm µm µm 1/kPa0 0.0 0.0 0.0 0.0 0.0 0.0 0.0 0.0 0.0 0.0 0.0 0.0 0.0 0.0 0.00 0.00 0 0.0001 -2.7 -2.8 0.8 1.7 -1.5 -5.4 0.8 2.9 -2.8 -3.4 0.9 1.7 -2.6 1.3 -0.48 -1.66 190 0.1912 -2.9 -4.0 0.9 2.3 -2.1 -6.2 1.0 3.5 -3.6 -4.0 1.1 2.0 -3.4 1.6 -0.47 -1.69 245 0.1813 -3.2 -4.9 0.9 2.7 -2.6 -6.9 1.1 4.0 -4.0 -4.3 1.3 2.3 -3.9 1.8 -0.47 -1.69 283 0.1794 -3.2 -5.4 1.0 3.1 -3.1 -7.7 1.3 4.2 -4.4 -4.5 1.4 2.4 -4.3 2.1 -0.48 -1.67 312 0.1885 -3.4 -5.7 1.1 3.4 -3.3 -7.6 1.4 4.6 -5.0 -5.0 1.5 2.5 -4.8 2.2 -0.47 -1.70 340 0.1766 -3.4 -6.2 1.1 3.6 -3.3 -8.1 1.5 4.9 -5.2 -5.1 1.6 2.7 -4.9 2.4 -0.48 -1.66 354 0.1937 -3.6 -6.6 1.2 3.9 -3.9 -8.6 1.6 5.1 -5.4 -5.4 1.7 2.8 -5.3 2.5 -0.47 -1.69 381 0.1818 -3.6 -6.9 1.2 4.1 -4.0 -8.8 1.7 5.4 -5.7 -5.6 1.8 2.9 -5.5 2.6 -0.47 -1.67 398 0.1889 -3.8 -7.2 1.3 4.3 -4.2 -9.0 1.8 5.6 -6.0 -5.8 1.9 3.0 -5.8 2.7 -0.47 -1.69 417 0.180
10 -3.9 -7.5 1.3 4.5 -4.6 -9.5 1.8 5.8 -6.3 -6.1 1.9 3.1 -6.1 2.8 -0.46 -1.70 437 0.17411 -4.2 -7.8 1.3 4.6 -4.5 -9.6 1.9 6.0 -6.5 -6.2 2.0 3.2 -6.3 2.9 -0.47 -1.69 450 0.17912 -4.2 -8.1 1.4 4.8 -4.7 -9.7 2.0 6.1 -6.7 -6.4 2.1 3.2 -6.5 3.0 -0.47 -1.69 464 0.18113 -4.2 -8.2 1.4 4.9 -4.9 -10.0 2.1 6.3 -6.9 -6.5 2.1 3.4 -6.6 3.1 -0.47 -1.68 477 0.18214 -4.3 -8.4 1.4 5.1 -5.0 -10.2 2.2 6.5 -7.1 -6.7 2.2 3.5 -6.8 3.2 -0.47 -1.67 489 0.18815 -4.5 -8.7 1.5 5.2 -5.3 -10.4 2.2 6.6 -7.4 -6.9 2.2 3.5 -7.1 3.3 -0.47 -1.69 506 0.17916 -4.5 -8.8 1.5 5.3 -5.5 -10.7 2.3 6.8 -7.5 -6.9 2.3 3.6 -7.2 3.4 -0.47 -1.68 515 0.18617 -4.6 -9.1 1.5 5.5 -5.5 -10.9 2.4 6.9 -7.6 -7.0 2.4 3.6 -7.3 3.5 -0.47 -1.67 524 0.18818 -4.7 -9.2 1.6 5.6 -5.7 -11.0 2.4 7.1 -8.0 -7.2 2.4 3.7 -7.5 3.6 -0.47 -1.68 540 0.18419 -4.8 -9.4 1.6 5.7 -5.9 -11.3 2.4 7.2 -8.1 -7.2 2.5 3.8 -7.7 3.6 -0.47 -1.68 550 0.18520 -5.0 -9.5 1.6 5.8 -5.9 -11.4 2.5 7.4 -8.2 -7.4 2.5 3.9 -7.8 3.7 -0.48 -1.67 558 0.18921 -5.2 -9.7 1.7 5.9 -6.1 -11.5 2.6 7.5 -8.4 -7.6 2.6 4.0 -8.0 3.8 -0.47 -1.67 571 0.18622 -5.2 -10.0 1.7 6.0 -6.3 -11.8 2.6 7.6 -8.5 -7.7 2.7 4.0 -8.1 3.8 -0.47 -1.68 582 0.18423 -5.3 -10.2 1.7 6.1 -6.5 -11.8 2.7 7.7 -8.6 -7.8 2.7 4.1 -8.3 3.9 -0.47 -1.68 592 0.18424 -5.3 -10.3 1.8 6.2 -6.5 -11.8 2.7 7.8 -8.7 -7.9 2.7 4.1 -8.3 4.0 -0.47 -1.67 600 0.18725 -5.5 -10.4 1.8 6.4 -6.7 -12.1 2.8 7.9 -8.9 -8.0 2.8 4.2 -8.5 4.0 -0.47 -1.67 612 0.18726 -5.6 -10.7 1.8 6.5 -6.8 -12.2 2.8 8.1 -9.1 -8.0 2.8 4.2 -8.6 4.1 -0.47 -1.67 620 0.18627 -5.8 -10.7 1.8 6.6 -6.9 -12.4 2.9 8.2 -9.2 -8.1 2.9 4.3 -8.7 4.2 -0.48 -1.66 627 0.19128 -5.7 -11.0 1.9 6.7 -6.8 -12.4 3.0 8.4 -9.3 -8.2 2.9 4.4 -8.8 4.2 -0.48 -1.65 633 0.19729 -5.8 -11.0 1.9 6.8 -7.0 -12.6 3.0 8.5 -9.4 -8.4 3.0 4.4 -8.9 4.3 -0.48 -1.66 644 0.19330 -6.0 -11.3 1.9 6.8 -7.2 -12.7 3.0 8.6 -9.5 -8.4 3.0 4.5 -9.1 4.3 -0.48 -1.67 655 0.18831 -6.1 -11.3 1.9 7.0 -7.2 -13.1 3.1 8.7 -9.7 -8.5 3.1 4.5 -9.2 4.4 -0.48 -1.66 661 0.19432 -6.1 -11.5 2.0 7.0 -7.6 -13.1 3.1 8.7 -9.7 -8.5 3.1 4.6 -9.3 4.4 -0.48 -1.67 672 0.18933 -6.2 -11.6 2.0 7.1 -7.8 -13.7 3.1 8.9 -9.9 -8.7 3.1 4.6 -9.5 4.5 -0.48 -1.67 683 0.189
Normalized Vertical and Horizontal Deformation ArraysNU 52-34 Sample #6 NU 52-34 Sample #8 NU 52-34 Sample #9 Trimmed
Mean
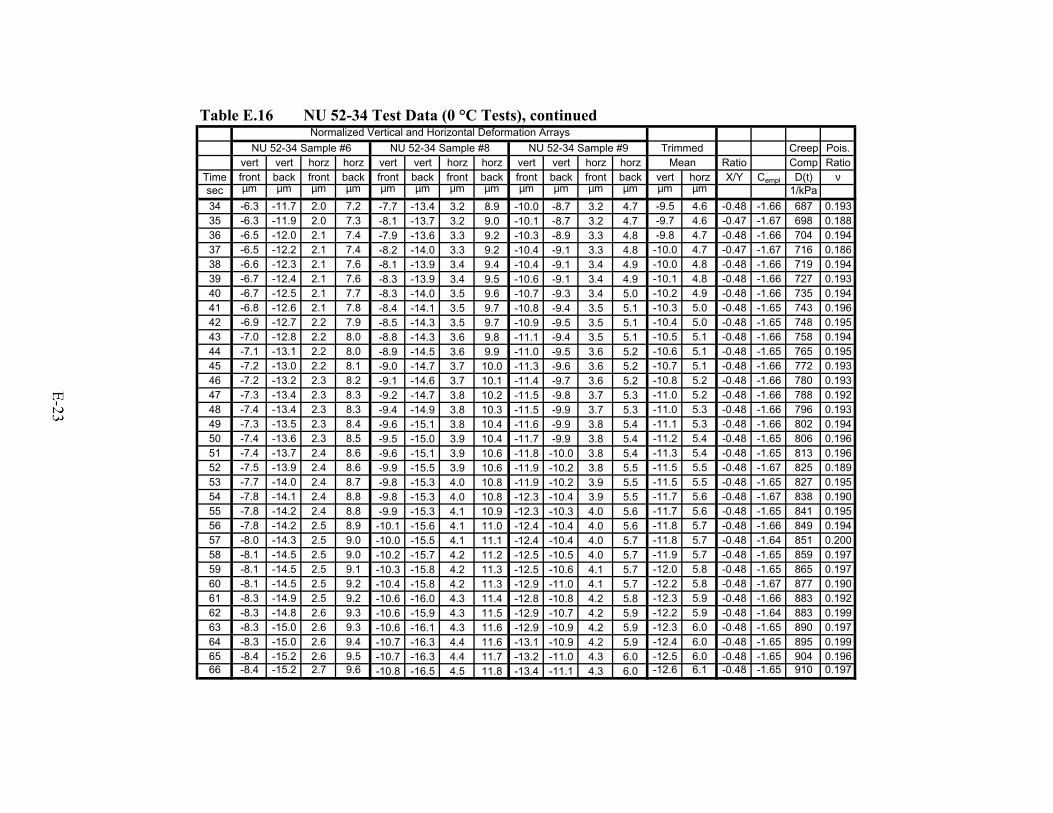
Table E.16 NU 52-34 Test Data (0 °C Tests), continued
Creep Pois.vert vert horz horz vert vert horz horz vert vert horz horz Ratio Comp Ratio
Time front back front back front back front back front back front back vert horz X/Y Cempl D(t) νsec µm µm µm µm µm µm µm µm µm µm µm µm µm µm 1/kPa34 -6.3 -11.7 2.0 7.2 -7.7 -13.4 3.2 8.9 -10.0 -8.7 3.2 4.7 -9.5 4.6 -0.48 -1.66 687 0.19335 -6.3 -11.9 2.0 7.3 -8.1 -13.7 3.2 9.0 -10.1 -8.7 3.2 4.7 -9.7 4.6 -0.47 -1.67 698 0.18836 -6.5 -12.0 2.1 7.4 -7.9 -13.6 3.3 9.2 -10.3 -8.9 3.3 4.8 -9.8 4.7 -0.48 -1.66 704 0.19437 -6.5 -12.2 2.1 7.4 -8.2 -14.0 3.3 9.2 -10.4 -9.1 3.3 4.8 -10.0 4.7 -0.47 -1.67 716 0.18638 -6.6 -12.3 2.1 7.6 -8.1 -13.9 3.4 9.4 -10.4 -9.1 3.4 4.9 -10.0 4.8 -0.48 -1.66 719 0.19439 -6.7 -12.4 2.1 7.6 -8.3 -13.9 3.4 9.5 -10.6 -9.1 3.4 4.9 -10.1 4.8 -0.48 -1.66 727 0.19340 -6.7 -12.5 2.1 7.7 -8.3 -14.0 3.5 9.6 -10.7 -9.3 3.4 5.0 -10.2 4.9 -0.48 -1.66 735 0.19441 -6.8 -12.6 2.1 7.8 -8.4 -14.1 3.5 9.7 -10.8 -9.4 3.5 5.1 -10.3 5.0 -0.48 -1.65 743 0.19642 -6.9 -12.7 2.2 7.9 -8.5 -14.3 3.5 9.7 -10.9 -9.5 3.5 5.1 -10.4 5.0 -0.48 -1.65 748 0.19543 -7.0 -12.8 2.2 8.0 -8.8 -14.3 3.6 9.8 -11.1 -9.4 3.5 5.1 -10.5 5.1 -0.48 -1.66 758 0.19444 -7.1 -13.1 2.2 8.0 -8.9 -14.5 3.6 9.9 -11.0 -9.5 3.6 5.2 -10.6 5.1 -0.48 -1.65 765 0.19545 -7.2 -13.0 2.2 8.1 -9.0 -14.7 3.7 10.0 -11.3 -9.6 3.6 5.2 -10.7 5.1 -0.48 -1.66 772 0.19346 -7.2 -13.2 2.3 8.2 -9.1 -14.6 3.7 10.1 -11.4 -9.7 3.6 5.2 -10.8 5.2 -0.48 -1.66 780 0.19347 -7.3 -13.4 2.3 8.3 -9.2 -14.7 3.8 10.2 -11.5 -9.8 3.7 5.3 -11.0 5.2 -0.48 -1.66 788 0.19248 -7.4 -13.4 2.3 8.3 -9.4 -14.9 3.8 10.3 -11.5 -9.9 3.7 5.3 -11.0 5.3 -0.48 -1.66 796 0.19349 -7.3 -13.5 2.3 8.4 -9.6 -15.1 3.8 10.4 -11.6 -9.9 3.8 5.4 -11.1 5.3 -0.48 -1.66 802 0.19450 -7.4 -13.6 2.3 8.5 -9.5 -15.0 3.9 10.4 -11.7 -9.9 3.8 5.4 -11.2 5.4 -0.48 -1.65 806 0.19651 -7.4 -13.7 2.4 8.6 -9.6 -15.1 3.9 10.6 -11.8 -10.0 3.8 5.4 -11.3 5.4 -0.48 -1.65 813 0.19652 -7.5 -13.9 2.4 8.6 -9.9 -15.5 3.9 10.6 -11.9 -10.2 3.8 5.5 -11.5 5.5 -0.48 -1.67 825 0.18953 -7.7 -14.0 2.4 8.7 -9.8 -15.3 4.0 10.8 -11.9 -10.2 3.9 5.5 -11.5 5.5 -0.48 -1.65 827 0.19554 -7.8 -14.1 2.4 8.8 -9.8 -15.3 4.0 10.8 -12.3 -10.4 3.9 5.5 -11.7 5.6 -0.48 -1.67 838 0.19055 -7.8 -14.2 2.4 8.8 -9.9 -15.3 4.1 10.9 -12.3 -10.3 4.0 5.6 -11.7 5.6 -0.48 -1.65 841 0.19556 -7.8 -14.2 2.5 8.9 -10.1 -15.6 4.1 11.0 -12.4 -10.4 4.0 5.6 -11.8 5.7 -0.48 -1.66 849 0.19457 -8.0 -14.3 2.5 9.0 -10.0 -15.5 4.1 11.1 -12.4 -10.4 4.0 5.7 -11.8 5.7 -0.48 -1.64 851 0.20058 -8.1 -14.5 2.5 9.0 -10.2 -15.7 4.2 11.2 -12.5 -10.5 4.0 5.7 -11.9 5.7 -0.48 -1.65 859 0.19759 -8.1 -14.5 2.5 9.1 -10.3 -15.8 4.2 11.3 -12.5 -10.6 4.1 5.7 -12.0 5.8 -0.48 -1.65 865 0.19760 -8.1 -14.5 2.5 9.2 -10.4 -15.8 4.2 11.3 -12.9 -11.0 4.1 5.7 -12.2 5.8 -0.48 -1.67 877 0.19061 -8.3 -14.9 2.5 9.2 -10.6 -16.0 4.3 11.4 -12.8 -10.8 4.2 5.8 -12.3 5.9 -0.48 -1.66 883 0.19262 -8.3 -14.8 2.6 9.3 -10.6 -15.9 4.3 11.5 -12.9 -10.7 4.2 5.9 -12.2 5.9 -0.48 -1.64 883 0.19963 -8.3 -15.0 2.6 9.3 -10.6 -16.1 4.3 11.6 -12.9 -10.9 4.2 5.9 -12.3 6.0 -0.48 -1.65 890 0.19764 -8.3 -15.0 2.6 9.4 -10.7 -16.3 4.4 11.6 -13.1 -10.9 4.2 5.9 -12.4 6.0 -0.48 -1.65 895 0.19965 -8.4 -15.2 2.6 9.5 -10.7 -16.3 4.4 11.7 -13.2 -11.0 4.3 6.0 -12.5 6.0 -0.48 -1.65 904 0.19666 -8.4 -15.2 2.7 9.6 -10.8 -16.5 4.5 11.8 -13.4 -11.1 4.3 6.0 -12.6 6.1 -0.48 -1.65 910 0.197
Mean
Normalized Vertical and Horizontal Deformation ArraysNU 52-34 Sample #6 NU 52-34 Sample #8 NU 52-34 Sample #9 Trimmed
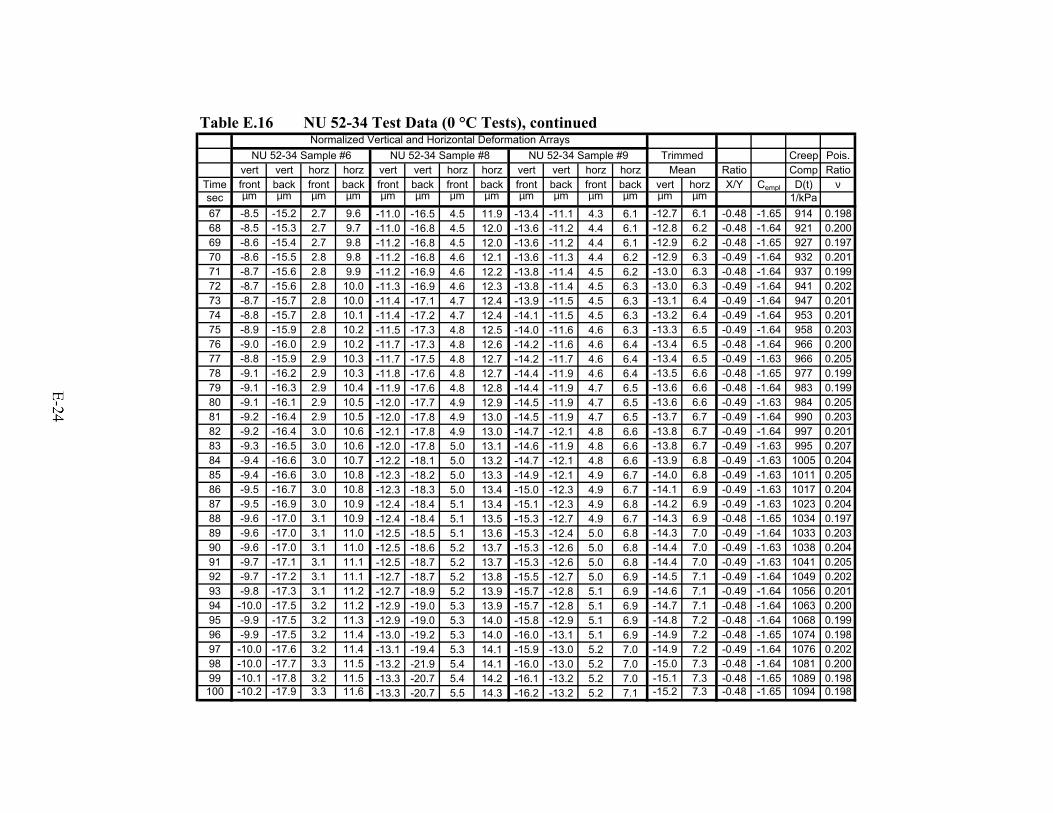
Table E.16 NU 52-34 Test Data (0 °C Tests), continued
Creep Pois.vert vert horz horz vert vert horz horz vert vert horz horz Ratio Comp Ratio
Time front back front back front back front back front back front back vert horz X/Y Cempl D(t) νsec µm µm µm µm µm µm µm µm µm µm µm µm µm µm 1/kPa67 -8.5 -15.2 2.7 9.6 -11.0 -16.5 4.5 11.9 -13.4 -11.1 4.3 6.1 -12.7 6.1 -0.48 -1.65 914 0.19868 -8.5 -15.3 2.7 9.7 -11.0 -16.8 4.5 12.0 -13.6 -11.2 4.4 6.1 -12.8 6.2 -0.48 -1.64 921 0.20069 -8.6 -15.4 2.7 9.8 -11.2 -16.8 4.5 12.0 -13.6 -11.2 4.4 6.1 -12.9 6.2 -0.48 -1.65 927 0.19770 -8.6 -15.5 2.8 9.8 -11.2 -16.8 4.6 12.1 -13.6 -11.3 4.4 6.2 -12.9 6.3 -0.49 -1.64 932 0.20171 -8.7 -15.6 2.8 9.9 -11.2 -16.9 4.6 12.2 -13.8 -11.4 4.5 6.2 -13.0 6.3 -0.48 -1.64 937 0.19972 -8.7 -15.6 2.8 10.0 -11.3 -16.9 4.6 12.3 -13.8 -11.4 4.5 6.3 -13.0 6.3 -0.49 -1.64 941 0.20273 -8.7 -15.7 2.8 10.0 -11.4 -17.1 4.7 12.4 -13.9 -11.5 4.5 6.3 -13.1 6.4 -0.49 -1.64 947 0.20174 -8.8 -15.7 2.8 10.1 -11.4 -17.2 4.7 12.4 -14.1 -11.5 4.5 6.3 -13.2 6.4 -0.49 -1.64 953 0.20175 -8.9 -15.9 2.8 10.2 -11.5 -17.3 4.8 12.5 -14.0 -11.6 4.6 6.3 -13.3 6.5 -0.49 -1.64 958 0.20376 -9.0 -16.0 2.9 10.2 -11.7 -17.3 4.8 12.6 -14.2 -11.6 4.6 6.4 -13.4 6.5 -0.48 -1.64 966 0.20077 -8.8 -15.9 2.9 10.3 -11.7 -17.5 4.8 12.7 -14.2 -11.7 4.6 6.4 -13.4 6.5 -0.49 -1.63 966 0.20578 -9.1 -16.2 2.9 10.3 -11.8 -17.6 4.8 12.7 -14.4 -11.9 4.6 6.4 -13.5 6.6 -0.48 -1.65 977 0.19979 -9.1 -16.3 2.9 10.4 -11.9 -17.6 4.8 12.8 -14.4 -11.9 4.7 6.5 -13.6 6.6 -0.48 -1.64 983 0.19980 -9.1 -16.1 2.9 10.5 -12.0 -17.7 4.9 12.9 -14.5 -11.9 4.7 6.5 -13.6 6.6 -0.49 -1.63 984 0.20581 -9.2 -16.4 2.9 10.5 -12.0 -17.8 4.9 13.0 -14.5 -11.9 4.7 6.5 -13.7 6.7 -0.49 -1.64 990 0.20382 -9.2 -16.4 3.0 10.6 -12.1 -17.8 4.9 13.0 -14.7 -12.1 4.8 6.6 -13.8 6.7 -0.49 -1.64 997 0.20183 -9.3 -16.5 3.0 10.6 -12.0 -17.8 5.0 13.1 -14.6 -11.9 4.8 6.6 -13.8 6.7 -0.49 -1.63 995 0.20784 -9.4 -16.6 3.0 10.7 -12.2 -18.1 5.0 13.2 -14.7 -12.1 4.8 6.6 -13.9 6.8 -0.49 -1.63 1005 0.20485 -9.4 -16.6 3.0 10.8 -12.3 -18.2 5.0 13.3 -14.9 -12.1 4.9 6.7 -14.0 6.8 -0.49 -1.63 1011 0.20586 -9.5 -16.7 3.0 10.8 -12.3 -18.3 5.0 13.4 -15.0 -12.3 4.9 6.7 -14.1 6.9 -0.49 -1.63 1017 0.20487 -9.5 -16.9 3.0 10.9 -12.4 -18.4 5.1 13.4 -15.1 -12.3 4.9 6.8 -14.2 6.9 -0.49 -1.63 1023 0.20488 -9.6 -17.0 3.1 10.9 -12.4 -18.4 5.1 13.5 -15.3 -12.7 4.9 6.7 -14.3 6.9 -0.48 -1.65 1034 0.19789 -9.6 -17.0 3.1 11.0 -12.5 -18.5 5.1 13.6 -15.3 -12.4 5.0 6.8 -14.3 7.0 -0.49 -1.64 1033 0.20390 -9.6 -17.0 3.1 11.0 -12.5 -18.6 5.2 13.7 -15.3 -12.6 5.0 6.8 -14.4 7.0 -0.49 -1.63 1038 0.20491 -9.7 -17.1 3.1 11.1 -12.5 -18.7 5.2 13.7 -15.3 -12.6 5.0 6.8 -14.4 7.0 -0.49 -1.63 1041 0.20592 -9.7 -17.2 3.1 11.1 -12.7 -18.7 5.2 13.8 -15.5 -12.7 5.0 6.9 -14.5 7.1 -0.49 -1.64 1049 0.20293 -9.8 -17.3 3.1 11.2 -12.7 -18.9 5.2 13.9 -15.7 -12.8 5.1 6.9 -14.6 7.1 -0.49 -1.64 1056 0.20194 -10.0 -17.5 3.2 11.2 -12.9 -19.0 5.3 13.9 -15.7 -12.8 5.1 6.9 -14.7 7.1 -0.48 -1.64 1063 0.20095 -9.9 -17.5 3.2 11.3 -12.9 -19.0 5.3 14.0 -15.8 -12.9 5.1 6.9 -14.8 7.2 -0.48 -1.64 1068 0.19996 -9.9 -17.5 3.2 11.4 -13.0 -19.2 5.3 14.0 -16.0 -13.1 5.1 6.9 -14.9 7.2 -0.48 -1.65 1074 0.19897 -10.0 -17.6 3.2 11.4 -13.1 -19.4 5.3 14.1 -15.9 -13.0 5.2 7.0 -14.9 7.2 -0.49 -1.64 1076 0.20298 -10.0 -17.7 3.3 11.5 -13.2 -21.9 5.4 14.1 -16.0 -13.0 5.2 7.0 -15.0 7.3 -0.48 -1.64 1081 0.20099 -10.1 -17.8 3.2 11.5 -13.3 -20.7 5.4 14.2 -16.1 -13.2 5.2 7.0 -15.1 7.3 -0.48 -1.65 1089 0.198100 -10.2 -17.9 3.3 11.6 -13.3 -20.7 5.5 14.3 -16.2 -13.2 5.2 7.1 -15.2 7.3 -0.48 -1.65 1094 0.198
Mean
Normalized Vertical and Horizontal Deformation ArraysNU 52-34 Sample #6 NU 52-34 Sample #8 NU 52-34 Sample #9 Trimmed
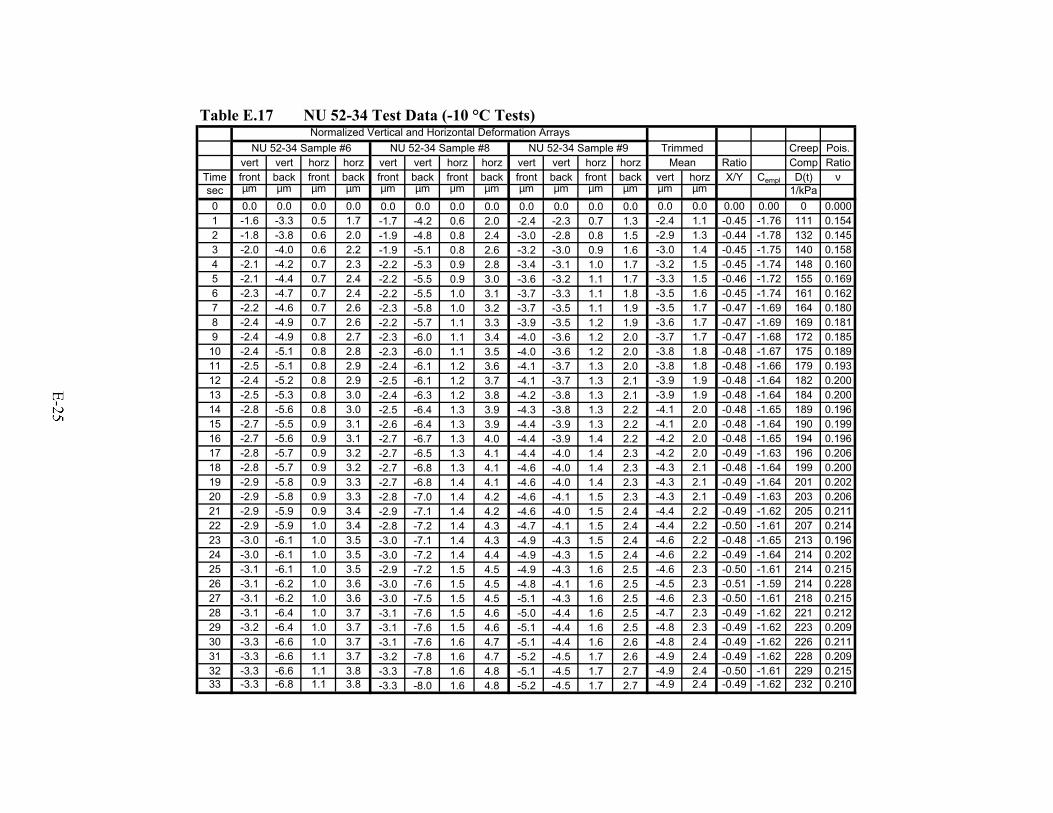
Table E.17 NU 52-34 Test Data (-10 °C Tests)
Creep Pois.vert vert horz horz vert vert horz horz vert vert horz horz Ratio Comp Ratio
Time front back front back front back front back front back front back vert horz X/Y Cempl D(t) νsec µm µm µm µm µm µm µm µm µm µm µm µm µm µm 1/kPa0 0.0 0.0 0.0 0.0 0.0 0.0 0.0 0.0 0.0 0.0 0.0 0.0 0.0 0.0 0.00 0.00 0 0.0001 -1.6 -3.3 0.5 1.7 -1.7 -4.2 0.6 2.0 -2.4 -2.3 0.7 1.3 -2.4 1.1 -0.45 -1.76 111 0.1542 -1.8 -3.8 0.6 2.0 -1.9 -4.8 0.8 2.4 -3.0 -2.8 0.8 1.5 -2.9 1.3 -0.44 -1.78 132 0.1453 -2.0 -4.0 0.6 2.2 -1.9 -5.1 0.8 2.6 -3.2 -3.0 0.9 1.6 -3.0 1.4 -0.45 -1.75 140 0.1584 -2.1 -4.2 0.7 2.3 -2.2 -5.3 0.9 2.8 -3.4 -3.1 1.0 1.7 -3.2 1.5 -0.45 -1.74 148 0.1605 -2.1 -4.4 0.7 2.4 -2.2 -5.5 0.9 3.0 -3.6 -3.2 1.1 1.7 -3.3 1.5 -0.46 -1.72 155 0.1696 -2.3 -4.7 0.7 2.4 -2.2 -5.5 1.0 3.1 -3.7 -3.3 1.1 1.8 -3.5 1.6 -0.45 -1.74 161 0.1627 -2.2 -4.6 0.7 2.6 -2.3 -5.8 1.0 3.2 -3.7 -3.5 1.1 1.9 -3.5 1.7 -0.47 -1.69 164 0.1808 -2.4 -4.9 0.7 2.6 -2.2 -5.7 1.1 3.3 -3.9 -3.5 1.2 1.9 -3.6 1.7 -0.47 -1.69 169 0.1819 -2.4 -4.9 0.8 2.7 -2.3 -6.0 1.1 3.4 -4.0 -3.6 1.2 2.0 -3.7 1.7 -0.47 -1.68 172 0.185
10 -2.4 -5.1 0.8 2.8 -2.3 -6.0 1.1 3.5 -4.0 -3.6 1.2 2.0 -3.8 1.8 -0.48 -1.67 175 0.18911 -2.5 -5.1 0.8 2.9 -2.4 -6.1 1.2 3.6 -4.1 -3.7 1.3 2.0 -3.8 1.8 -0.48 -1.66 179 0.19312 -2.4 -5.2 0.8 2.9 -2.5 -6.1 1.2 3.7 -4.1 -3.7 1.3 2.1 -3.9 1.9 -0.48 -1.64 182 0.20013 -2.5 -5.3 0.8 3.0 -2.4 -6.3 1.2 3.8 -4.2 -3.8 1.3 2.1 -3.9 1.9 -0.48 -1.64 184 0.20014 -2.8 -5.6 0.8 3.0 -2.5 -6.4 1.3 3.9 -4.3 -3.8 1.3 2.2 -4.1 2.0 -0.48 -1.65 189 0.19615 -2.7 -5.5 0.9 3.1 -2.6 -6.4 1.3 3.9 -4.4 -3.9 1.3 2.2 -4.1 2.0 -0.48 -1.64 190 0.19916 -2.7 -5.6 0.9 3.1 -2.7 -6.7 1.3 4.0 -4.4 -3.9 1.4 2.2 -4.2 2.0 -0.48 -1.65 194 0.19617 -2.8 -5.7 0.9 3.2 -2.7 -6.5 1.3 4.1 -4.4 -4.0 1.4 2.3 -4.2 2.0 -0.49 -1.63 196 0.20618 -2.8 -5.7 0.9 3.2 -2.7 -6.8 1.3 4.1 -4.6 -4.0 1.4 2.3 -4.3 2.1 -0.48 -1.64 199 0.20019 -2.9 -5.8 0.9 3.3 -2.7 -6.8 1.4 4.1 -4.6 -4.0 1.4 2.3 -4.3 2.1 -0.49 -1.64 201 0.20220 -2.9 -5.8 0.9 3.3 -2.8 -7.0 1.4 4.2 -4.6 -4.1 1.5 2.3 -4.3 2.1 -0.49 -1.63 203 0.20621 -2.9 -5.9 0.9 3.4 -2.9 -7.1 1.4 4.2 -4.6 -4.0 1.5 2.4 -4.4 2.2 -0.49 -1.62 205 0.21122 -2.9 -5.9 1.0 3.4 -2.8 -7.2 1.4 4.3 -4.7 -4.1 1.5 2.4 -4.4 2.2 -0.50 -1.61 207 0.21423 -3.0 -6.1 1.0 3.5 -3.0 -7.1 1.4 4.3 -4.9 -4.3 1.5 2.4 -4.6 2.2 -0.48 -1.65 213 0.19624 -3.0 -6.1 1.0 3.5 -3.0 -7.2 1.4 4.4 -4.9 -4.3 1.5 2.4 -4.6 2.2 -0.49 -1.64 214 0.20225 -3.1 -6.1 1.0 3.5 -2.9 -7.2 1.5 4.5 -4.9 -4.3 1.6 2.5 -4.6 2.3 -0.50 -1.61 214 0.21526 -3.1 -6.2 1.0 3.6 -3.0 -7.6 1.5 4.5 -4.8 -4.1 1.6 2.5 -4.5 2.3 -0.51 -1.59 214 0.22827 -3.1 -6.2 1.0 3.6 -3.0 -7.5 1.5 4.5 -5.1 -4.3 1.6 2.5 -4.6 2.3 -0.50 -1.61 218 0.21528 -3.1 -6.4 1.0 3.7 -3.1 -7.6 1.5 4.6 -5.0 -4.4 1.6 2.5 -4.7 2.3 -0.49 -1.62 221 0.21229 -3.2 -6.4 1.0 3.7 -3.1 -7.6 1.5 4.6 -5.1 -4.4 1.6 2.5 -4.8 2.3 -0.49 -1.62 223 0.20930 -3.3 -6.6 1.0 3.7 -3.1 -7.6 1.6 4.7 -5.1 -4.4 1.6 2.6 -4.8 2.4 -0.49 -1.62 226 0.21131 -3.3 -6.6 1.1 3.7 -3.2 -7.8 1.6 4.7 -5.2 -4.5 1.7 2.6 -4.9 2.4 -0.49 -1.62 228 0.20932 -3.3 -6.6 1.1 3.8 -3.3 -7.8 1.6 4.8 -5.1 -4.5 1.7 2.7 -4.9 2.4 -0.50 -1.61 229 0.21533 -3.3 -6.8 1.1 3.8 -3.3 -8.0 1.6 4.8 -5.2 -4.5 1.7 2.7 -4.9 2.4 -0.49 -1.62 232 0.210
Normalized Vertical and Horizontal Deformation ArraysNU 52-34 Sample #6 NU 52-34 Sample #8 NU 52-34 Sample #9 Trimmed
Mean
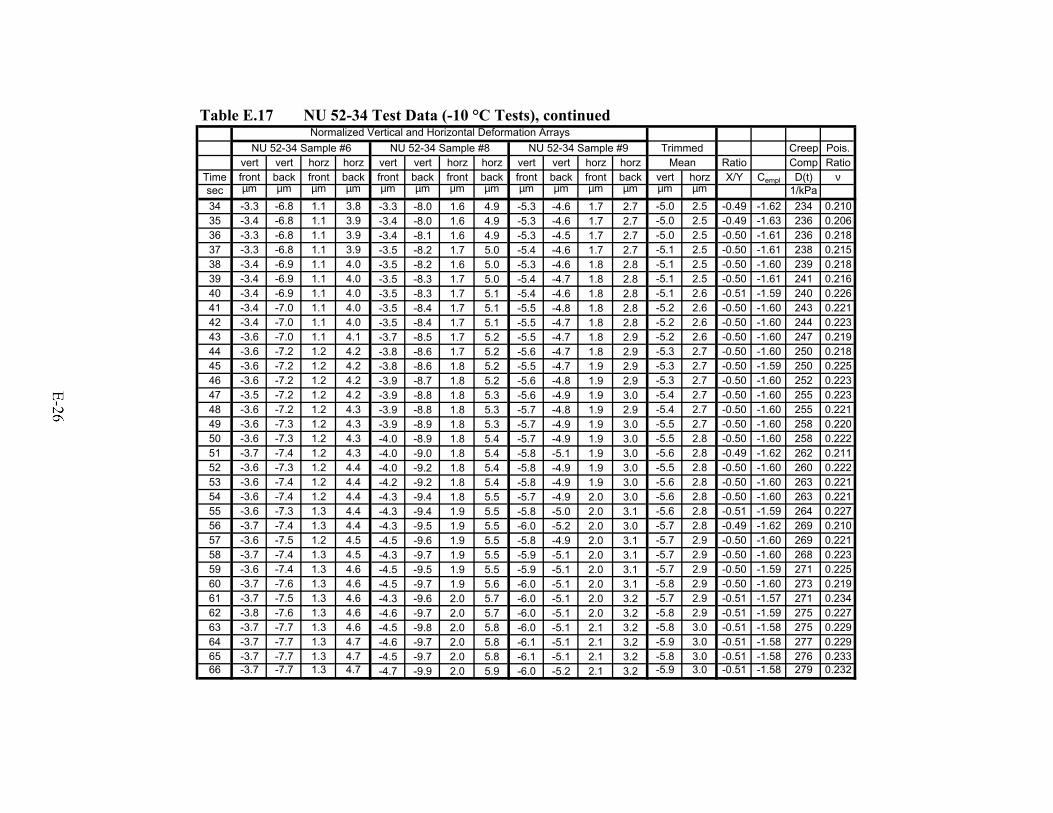
Table E.17 NU 52-34 Test Data (-10 °C Tests), continued
Creep Pois.vert vert horz horz vert vert horz horz vert vert horz horz Ratio Comp Ratio
Time front back front back front back front back front back front back vert horz X/Y Cempl D(t) νsec µm µm µm µm µm µm µm µm µm µm µm µm µm µm 1/kPa34 -3.3 -6.8 1.1 3.8 -3.3 -8.0 1.6 4.9 -5.3 -4.6 1.7 2.7 -5.0 2.5 -0.49 -1.62 234 0.21035 -3.4 -6.8 1.1 3.9 -3.4 -8.0 1.6 4.9 -5.3 -4.6 1.7 2.7 -5.0 2.5 -0.49 -1.63 236 0.20636 -3.3 -6.8 1.1 3.9 -3.4 -8.1 1.6 4.9 -5.3 -4.5 1.7 2.7 -5.0 2.5 -0.50 -1.61 236 0.21837 -3.3 -6.8 1.1 3.9 -3.5 -8.2 1.7 5.0 -5.4 -4.6 1.7 2.7 -5.1 2.5 -0.50 -1.61 238 0.21538 -3.4 -6.9 1.1 4.0 -3.5 -8.2 1.6 5.0 -5.3 -4.6 1.8 2.8 -5.1 2.5 -0.50 -1.60 239 0.21839 -3.4 -6.9 1.1 4.0 -3.5 -8.3 1.7 5.0 -5.4 -4.7 1.8 2.8 -5.1 2.5 -0.50 -1.61 241 0.21640 -3.4 -6.9 1.1 4.0 -3.5 -8.3 1.7 5.1 -5.4 -4.6 1.8 2.8 -5.1 2.6 -0.51 -1.59 240 0.22641 -3.4 -7.0 1.1 4.0 -3.5 -8.4 1.7 5.1 -5.5 -4.8 1.8 2.8 -5.2 2.6 -0.50 -1.60 243 0.22142 -3.4 -7.0 1.1 4.0 -3.5 -8.4 1.7 5.1 -5.5 -4.7 1.8 2.8 -5.2 2.6 -0.50 -1.60 244 0.22343 -3.6 -7.0 1.1 4.1 -3.7 -8.5 1.7 5.2 -5.5 -4.7 1.8 2.9 -5.2 2.6 -0.50 -1.60 247 0.21944 -3.6 -7.2 1.2 4.2 -3.8 -8.6 1.7 5.2 -5.6 -4.7 1.8 2.9 -5.3 2.7 -0.50 -1.60 250 0.21845 -3.6 -7.2 1.2 4.2 -3.8 -8.6 1.8 5.2 -5.5 -4.7 1.9 2.9 -5.3 2.7 -0.50 -1.59 250 0.22546 -3.6 -7.2 1.2 4.2 -3.9 -8.7 1.8 5.2 -5.6 -4.8 1.9 2.9 -5.3 2.7 -0.50 -1.60 252 0.22347 -3.5 -7.2 1.2 4.2 -3.9 -8.8 1.8 5.3 -5.6 -4.9 1.9 3.0 -5.4 2.7 -0.50 -1.60 255 0.22348 -3.6 -7.2 1.2 4.3 -3.9 -8.8 1.8 5.3 -5.7 -4.8 1.9 2.9 -5.4 2.7 -0.50 -1.60 255 0.22149 -3.6 -7.3 1.2 4.3 -3.9 -8.9 1.8 5.3 -5.7 -4.9 1.9 3.0 -5.5 2.7 -0.50 -1.60 258 0.22050 -3.6 -7.3 1.2 4.3 -4.0 -8.9 1.8 5.4 -5.7 -4.9 1.9 3.0 -5.5 2.8 -0.50 -1.60 258 0.22251 -3.7 -7.4 1.2 4.3 -4.0 -9.0 1.8 5.4 -5.8 -5.1 1.9 3.0 -5.6 2.8 -0.49 -1.62 262 0.21152 -3.6 -7.3 1.2 4.4 -4.0 -9.2 1.8 5.4 -5.8 -4.9 1.9 3.0 -5.5 2.8 -0.50 -1.60 260 0.22253 -3.6 -7.4 1.2 4.4 -4.2 -9.2 1.8 5.4 -5.8 -4.9 1.9 3.0 -5.6 2.8 -0.50 -1.60 263 0.22154 -3.6 -7.4 1.2 4.4 -4.3 -9.4 1.8 5.5 -5.7 -4.9 2.0 3.0 -5.6 2.8 -0.50 -1.60 263 0.22155 -3.6 -7.3 1.3 4.4 -4.3 -9.4 1.9 5.5 -5.8 -5.0 2.0 3.1 -5.6 2.8 -0.51 -1.59 264 0.22756 -3.7 -7.4 1.3 4.4 -4.3 -9.5 1.9 5.5 -6.0 -5.2 2.0 3.0 -5.7 2.8 -0.49 -1.62 269 0.21057 -3.6 -7.5 1.2 4.5 -4.5 -9.6 1.9 5.5 -5.8 -4.9 2.0 3.1 -5.7 2.9 -0.50 -1.60 269 0.22158 -3.7 -7.4 1.3 4.5 -4.3 -9.7 1.9 5.5 -5.9 -5.1 2.0 3.1 -5.7 2.9 -0.50 -1.60 268 0.22359 -3.6 -7.4 1.3 4.6 -4.5 -9.5 1.9 5.5 -5.9 -5.1 2.0 3.1 -5.7 2.9 -0.50 -1.59 271 0.22560 -3.7 -7.6 1.3 4.6 -4.5 -9.7 1.9 5.6 -6.0 -5.1 2.0 3.1 -5.8 2.9 -0.50 -1.60 273 0.21961 -3.7 -7.5 1.3 4.6 -4.3 -9.6 2.0 5.7 -6.0 -5.1 2.0 3.2 -5.7 2.9 -0.51 -1.57 271 0.23462 -3.8 -7.6 1.3 4.6 -4.6 -9.7 2.0 5.7 -6.0 -5.1 2.0 3.2 -5.8 2.9 -0.51 -1.59 275 0.22763 -3.7 -7.7 1.3 4.6 -4.5 -9.8 2.0 5.8 -6.0 -5.1 2.1 3.2 -5.8 3.0 -0.51 -1.58 275 0.22964 -3.7 -7.7 1.3 4.7 -4.6 -9.7 2.0 5.8 -6.1 -5.1 2.1 3.2 -5.9 3.0 -0.51 -1.58 277 0.22965 -3.7 -7.7 1.3 4.7 -4.5 -9.7 2.0 5.8 -6.1 -5.1 2.1 3.2 -5.8 3.0 -0.51 -1.58 276 0.23366 -3.7 -7.7 1.3 4.7 -4.7 -9.9 2.0 5.9 -6.0 -5.2 2.1 3.2 -5.9 3.0 -0.51 -1.58 279 0.232
Mean
Normalized Vertical and Horizontal Deformation ArraysNU 52-34 Sample #6 NU 52-34 Sample #8 NU 52-34 Sample #9 Trimmed
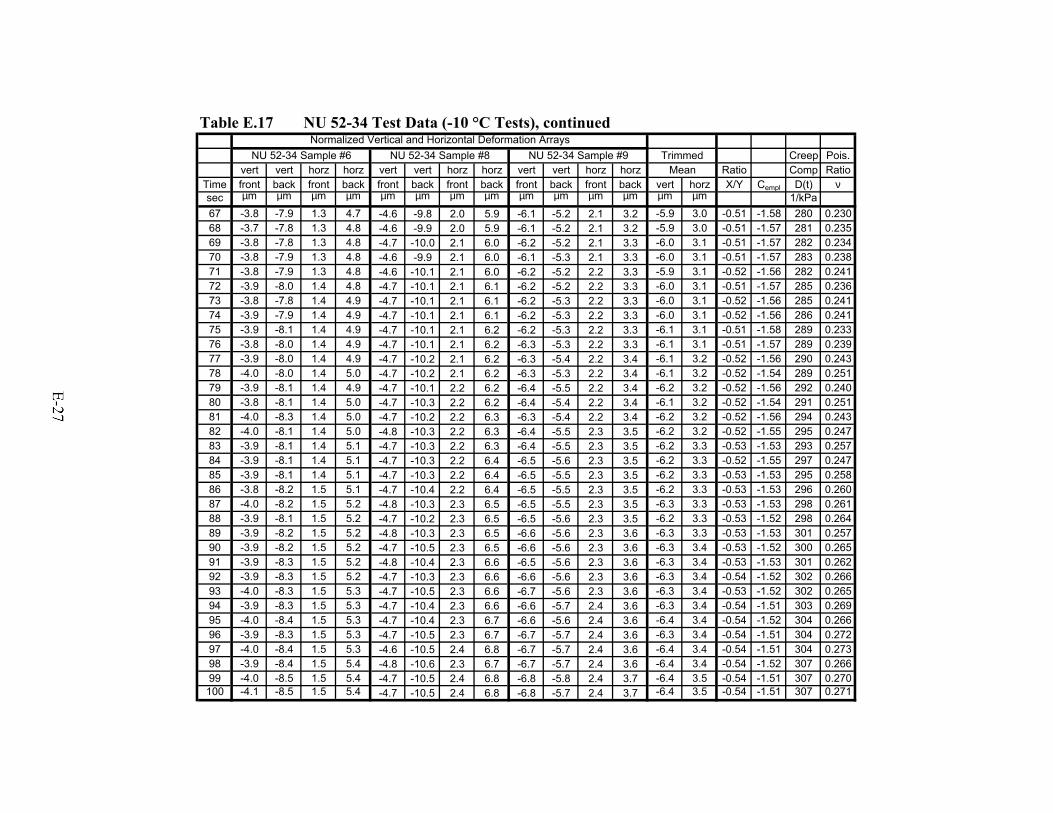
Table E.17 NU 52-34 Test Data (-10 °C Tests), continued
Creep Pois.vert vert horz horz vert vert horz horz vert vert horz horz Ratio Comp Ratio
Time front back front back front back front back front back front back vert horz X/Y Cempl D(t) νsec µm µm µm µm µm µm µm µm µm µm µm µm µm µm 1/kPa67 -3.8 -7.9 1.3 4.7 -4.6 -9.8 2.0 5.9 -6.1 -5.2 2.1 3.2 -5.9 3.0 -0.51 -1.58 280 0.23068 -3.7 -7.8 1.3 4.8 -4.6 -9.9 2.0 5.9 -6.1 -5.2 2.1 3.2 -5.9 3.0 -0.51 -1.57 281 0.23569 -3.8 -7.8 1.3 4.8 -4.7 -10.0 2.1 6.0 -6.2 -5.2 2.1 3.3 -6.0 3.1 -0.51 -1.57 282 0.23470 -3.8 -7.9 1.3 4.8 -4.6 -9.9 2.1 6.0 -6.1 -5.3 2.1 3.3 -6.0 3.1 -0.51 -1.57 283 0.23871 -3.8 -7.9 1.3 4.8 -4.6 -10.1 2.1 6.0 -6.2 -5.2 2.2 3.3 -5.9 3.1 -0.52 -1.56 282 0.24172 -3.9 -8.0 1.4 4.8 -4.7 -10.1 2.1 6.1 -6.2 -5.2 2.2 3.3 -6.0 3.1 -0.51 -1.57 285 0.23673 -3.8 -7.8 1.4 4.9 -4.7 -10.1 2.1 6.1 -6.2 -5.3 2.2 3.3 -6.0 3.1 -0.52 -1.56 285 0.24174 -3.9 -7.9 1.4 4.9 -4.7 -10.1 2.1 6.1 -6.2 -5.3 2.2 3.3 -6.0 3.1 -0.52 -1.56 286 0.24175 -3.9 -8.1 1.4 4.9 -4.7 -10.1 2.1 6.2 -6.2 -5.3 2.2 3.3 -6.1 3.1 -0.51 -1.58 289 0.23376 -3.8 -8.0 1.4 4.9 -4.7 -10.1 2.1 6.2 -6.3 -5.3 2.2 3.3 -6.1 3.1 -0.51 -1.57 289 0.23977 -3.9 -8.0 1.4 4.9 -4.7 -10.2 2.1 6.2 -6.3 -5.4 2.2 3.4 -6.1 3.2 -0.52 -1.56 290 0.24378 -4.0 -8.0 1.4 5.0 -4.7 -10.2 2.1 6.2 -6.3 -5.3 2.2 3.4 -6.1 3.2 -0.52 -1.54 289 0.25179 -3.9 -8.1 1.4 4.9 -4.7 -10.1 2.2 6.2 -6.4 -5.5 2.2 3.4 -6.2 3.2 -0.52 -1.56 292 0.24080 -3.8 -8.1 1.4 5.0 -4.7 -10.3 2.2 6.2 -6.4 -5.4 2.2 3.4 -6.1 3.2 -0.52 -1.54 291 0.25181 -4.0 -8.3 1.4 5.0 -4.7 -10.2 2.2 6.3 -6.3 -5.4 2.2 3.4 -6.2 3.2 -0.52 -1.56 294 0.24382 -4.0 -8.1 1.4 5.0 -4.8 -10.3 2.2 6.3 -6.4 -5.5 2.3 3.5 -6.2 3.2 -0.52 -1.55 295 0.24783 -3.9 -8.1 1.4 5.1 -4.7 -10.3 2.2 6.3 -6.4 -5.5 2.3 3.5 -6.2 3.3 -0.53 -1.53 293 0.25784 -3.9 -8.1 1.4 5.1 -4.7 -10.3 2.2 6.4 -6.5 -5.6 2.3 3.5 -6.2 3.3 -0.52 -1.55 297 0.24785 -3.9 -8.1 1.4 5.1 -4.7 -10.3 2.2 6.4 -6.5 -5.5 2.3 3.5 -6.2 3.3 -0.53 -1.53 295 0.25886 -3.8 -8.2 1.5 5.1 -4.7 -10.4 2.2 6.4 -6.5 -5.5 2.3 3.5 -6.2 3.3 -0.53 -1.53 296 0.26087 -4.0 -8.2 1.5 5.2 -4.8 -10.3 2.3 6.5 -6.5 -5.5 2.3 3.5 -6.3 3.3 -0.53 -1.53 298 0.26188 -3.9 -8.1 1.5 5.2 -4.7 -10.2 2.3 6.5 -6.5 -5.6 2.3 3.5 -6.2 3.3 -0.53 -1.52 298 0.26489 -3.9 -8.2 1.5 5.2 -4.8 -10.3 2.3 6.5 -6.6 -5.6 2.3 3.6 -6.3 3.3 -0.53 -1.53 301 0.25790 -3.9 -8.2 1.5 5.2 -4.7 -10.5 2.3 6.5 -6.6 -5.6 2.3 3.6 -6.3 3.4 -0.53 -1.52 300 0.26591 -3.9 -8.3 1.5 5.2 -4.8 -10.4 2.3 6.6 -6.5 -5.6 2.3 3.6 -6.3 3.4 -0.53 -1.53 301 0.26292 -3.9 -8.3 1.5 5.2 -4.7 -10.3 2.3 6.6 -6.6 -5.6 2.3 3.6 -6.3 3.4 -0.54 -1.52 302 0.26693 -4.0 -8.3 1.5 5.3 -4.7 -10.5 2.3 6.6 -6.7 -5.6 2.3 3.6 -6.3 3.4 -0.53 -1.52 302 0.26594 -3.9 -8.3 1.5 5.3 -4.7 -10.4 2.3 6.6 -6.6 -5.7 2.4 3.6 -6.3 3.4 -0.54 -1.51 303 0.26995 -4.0 -8.4 1.5 5.3 -4.7 -10.4 2.3 6.7 -6.6 -5.6 2.4 3.6 -6.4 3.4 -0.54 -1.52 304 0.26696 -3.9 -8.3 1.5 5.3 -4.7 -10.5 2.3 6.7 -6.7 -5.7 2.4 3.6 -6.3 3.4 -0.54 -1.51 304 0.27297 -4.0 -8.4 1.5 5.3 -4.6 -10.5 2.4 6.8 -6.7 -5.7 2.4 3.6 -6.4 3.4 -0.54 -1.51 304 0.27398 -3.9 -8.4 1.5 5.4 -4.8 -10.6 2.3 6.7 -6.7 -5.7 2.4 3.6 -6.4 3.4 -0.54 -1.52 307 0.26699 -4.0 -8.5 1.5 5.4 -4.7 -10.5 2.4 6.8 -6.8 -5.8 2.4 3.7 -6.4 3.5 -0.54 -1.51 307 0.270100 -4.1 -8.5 1.5 5.4 -4.7 -10.5 2.4 6.8 -6.8 -5.7 2.4 3.7 -6.4 3.5 -0.54 -1.51 307 0.271
Mean
Normalized Vertical and Horizontal Deformation ArraysNU 52-34 Sample #6 NU 52-34 Sample #8 NU 52-34 Sample #9 Trimmed
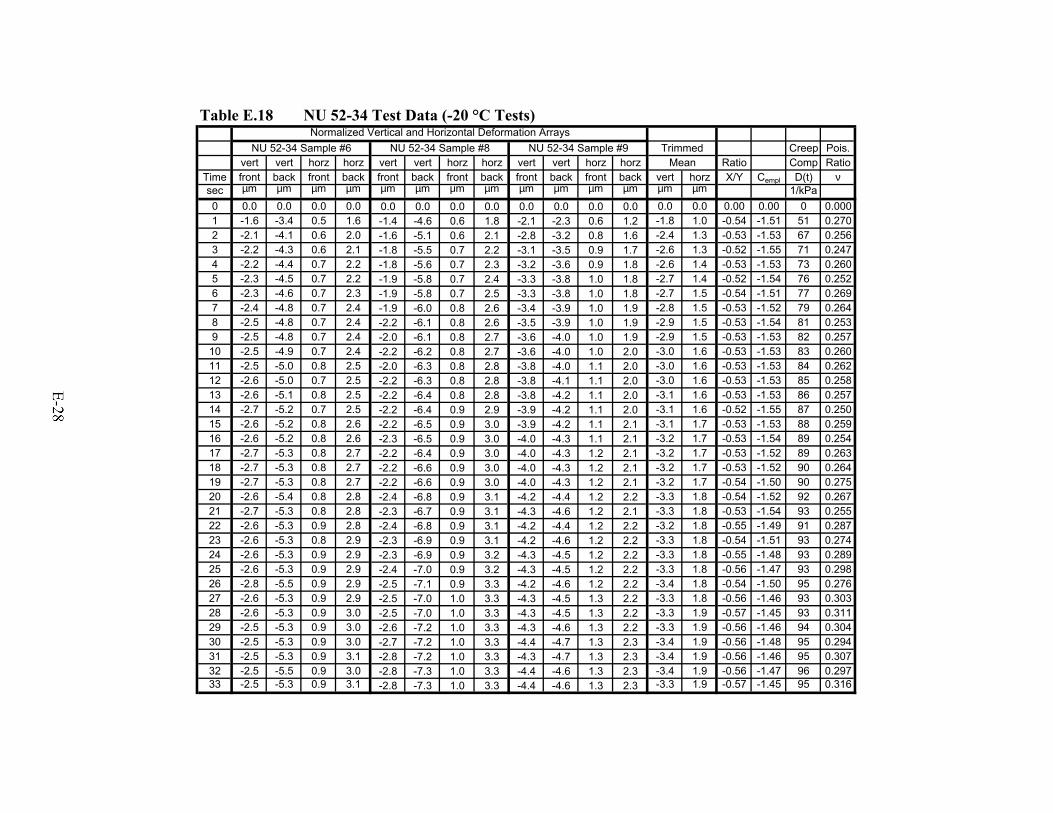
Table E.18 NU 52-34 Test Data (-20 °C Tests)
Creep Pois.vert vert horz horz vert vert horz horz vert vert horz horz Ratio Comp Ratio
Time front back front back front back front back front back front back vert horz X/Y Cempl D(t) νsec µm µm µm µm µm µm µm µm µm µm µm µm µm µm 1/kPa0 0.0 0.0 0.0 0.0 0.0 0.0 0.0 0.0 0.0 0.0 0.0 0.0 0.0 0.0 0.00 0.00 0 0.0001 -1.6 -3.4 0.5 1.6 -1.4 -4.6 0.6 1.8 -2.1 -2.3 0.6 1.2 -1.8 1.0 -0.54 -1.51 51 0.2702 -2.1 -4.1 0.6 2.0 -1.6 -5.1 0.6 2.1 -2.8 -3.2 0.8 1.6 -2.4 1.3 -0.53 -1.53 67 0.2563 -2.2 -4.3 0.6 2.1 -1.8 -5.5 0.7 2.2 -3.1 -3.5 0.9 1.7 -2.6 1.3 -0.52 -1.55 71 0.2474 -2.2 -4.4 0.7 2.2 -1.8 -5.6 0.7 2.3 -3.2 -3.6 0.9 1.8 -2.6 1.4 -0.53 -1.53 73 0.2605 -2.3 -4.5 0.7 2.2 -1.9 -5.8 0.7 2.4 -3.3 -3.8 1.0 1.8 -2.7 1.4 -0.52 -1.54 76 0.2526 -2.3 -4.6 0.7 2.3 -1.9 -5.8 0.7 2.5 -3.3 -3.8 1.0 1.8 -2.7 1.5 -0.54 -1.51 77 0.2697 -2.4 -4.8 0.7 2.4 -1.9 -6.0 0.8 2.6 -3.4 -3.9 1.0 1.9 -2.8 1.5 -0.53 -1.52 79 0.2648 -2.5 -4.8 0.7 2.4 -2.2 -6.1 0.8 2.6 -3.5 -3.9 1.0 1.9 -2.9 1.5 -0.53 -1.54 81 0.2539 -2.5 -4.8 0.7 2.4 -2.0 -6.1 0.8 2.7 -3.6 -4.0 1.0 1.9 -2.9 1.5 -0.53 -1.53 82 0.257
10 -2.5 -4.9 0.7 2.4 -2.2 -6.2 0.8 2.7 -3.6 -4.0 1.0 2.0 -3.0 1.6 -0.53 -1.53 83 0.26011 -2.5 -5.0 0.8 2.5 -2.0 -6.3 0.8 2.8 -3.8 -4.0 1.1 2.0 -3.0 1.6 -0.53 -1.53 84 0.26212 -2.6 -5.0 0.7 2.5 -2.2 -6.3 0.8 2.8 -3.8 -4.1 1.1 2.0 -3.0 1.6 -0.53 -1.53 85 0.25813 -2.6 -5.1 0.8 2.5 -2.2 -6.4 0.8 2.8 -3.8 -4.2 1.1 2.0 -3.1 1.6 -0.53 -1.53 86 0.25714 -2.7 -5.2 0.7 2.5 -2.2 -6.4 0.9 2.9 -3.9 -4.2 1.1 2.0 -3.1 1.6 -0.52 -1.55 87 0.25015 -2.6 -5.2 0.8 2.6 -2.2 -6.5 0.9 3.0 -3.9 -4.2 1.1 2.1 -3.1 1.7 -0.53 -1.53 88 0.25916 -2.6 -5.2 0.8 2.6 -2.3 -6.5 0.9 3.0 -4.0 -4.3 1.1 2.1 -3.2 1.7 -0.53 -1.54 89 0.25417 -2.7 -5.3 0.8 2.7 -2.2 -6.4 0.9 3.0 -4.0 -4.3 1.2 2.1 -3.2 1.7 -0.53 -1.52 89 0.26318 -2.7 -5.3 0.8 2.7 -2.2 -6.6 0.9 3.0 -4.0 -4.3 1.2 2.1 -3.2 1.7 -0.53 -1.52 90 0.26419 -2.7 -5.3 0.8 2.7 -2.2 -6.6 0.9 3.0 -4.0 -4.3 1.2 2.1 -3.2 1.7 -0.54 -1.50 90 0.27520 -2.6 -5.4 0.8 2.8 -2.4 -6.8 0.9 3.1 -4.2 -4.4 1.2 2.2 -3.3 1.8 -0.54 -1.52 92 0.26721 -2.7 -5.3 0.8 2.8 -2.3 -6.7 0.9 3.1 -4.3 -4.6 1.2 2.1 -3.3 1.8 -0.53 -1.54 93 0.25522 -2.6 -5.3 0.9 2.8 -2.4 -6.8 0.9 3.1 -4.2 -4.4 1.2 2.2 -3.2 1.8 -0.55 -1.49 91 0.28723 -2.6 -5.3 0.8 2.9 -2.3 -6.9 0.9 3.1 -4.2 -4.6 1.2 2.2 -3.3 1.8 -0.54 -1.51 93 0.27424 -2.6 -5.3 0.9 2.9 -2.3 -6.9 0.9 3.2 -4.3 -4.5 1.2 2.2 -3.3 1.8 -0.55 -1.48 93 0.28925 -2.6 -5.3 0.9 2.9 -2.4 -7.0 0.9 3.2 -4.3 -4.5 1.2 2.2 -3.3 1.8 -0.56 -1.47 93 0.29826 -2.8 -5.5 0.9 2.9 -2.5 -7.1 0.9 3.3 -4.2 -4.6 1.2 2.2 -3.4 1.8 -0.54 -1.50 95 0.27627 -2.6 -5.3 0.9 2.9 -2.5 -7.0 1.0 3.3 -4.3 -4.5 1.3 2.2 -3.3 1.8 -0.56 -1.46 93 0.30328 -2.6 -5.3 0.9 3.0 -2.5 -7.0 1.0 3.3 -4.3 -4.5 1.3 2.2 -3.3 1.9 -0.57 -1.45 93 0.31129 -2.5 -5.3 0.9 3.0 -2.6 -7.2 1.0 3.3 -4.3 -4.6 1.3 2.2 -3.3 1.9 -0.56 -1.46 94 0.30430 -2.5 -5.3 0.9 3.0 -2.7 -7.2 1.0 3.3 -4.4 -4.7 1.3 2.3 -3.4 1.9 -0.56 -1.48 95 0.29431 -2.5 -5.3 0.9 3.1 -2.8 -7.2 1.0 3.3 -4.3 -4.7 1.3 2.3 -3.4 1.9 -0.56 -1.46 95 0.30732 -2.5 -5.5 0.9 3.0 -2.8 -7.3 1.0 3.3 -4.4 -4.6 1.3 2.3 -3.4 1.9 -0.56 -1.47 96 0.29733 -2.5 -5.3 0.9 3.1 -2.8 -7.3 1.0 3.3 -4.4 -4.6 1.3 2.3 -3.3 1.9 -0.57 -1.45 95 0.316
Normalized Vertical and Horizontal Deformation ArraysNU 52-34 Sample #6 NU 52-34 Sample #8 NU 52-34 Sample #9 Trimmed
Mean
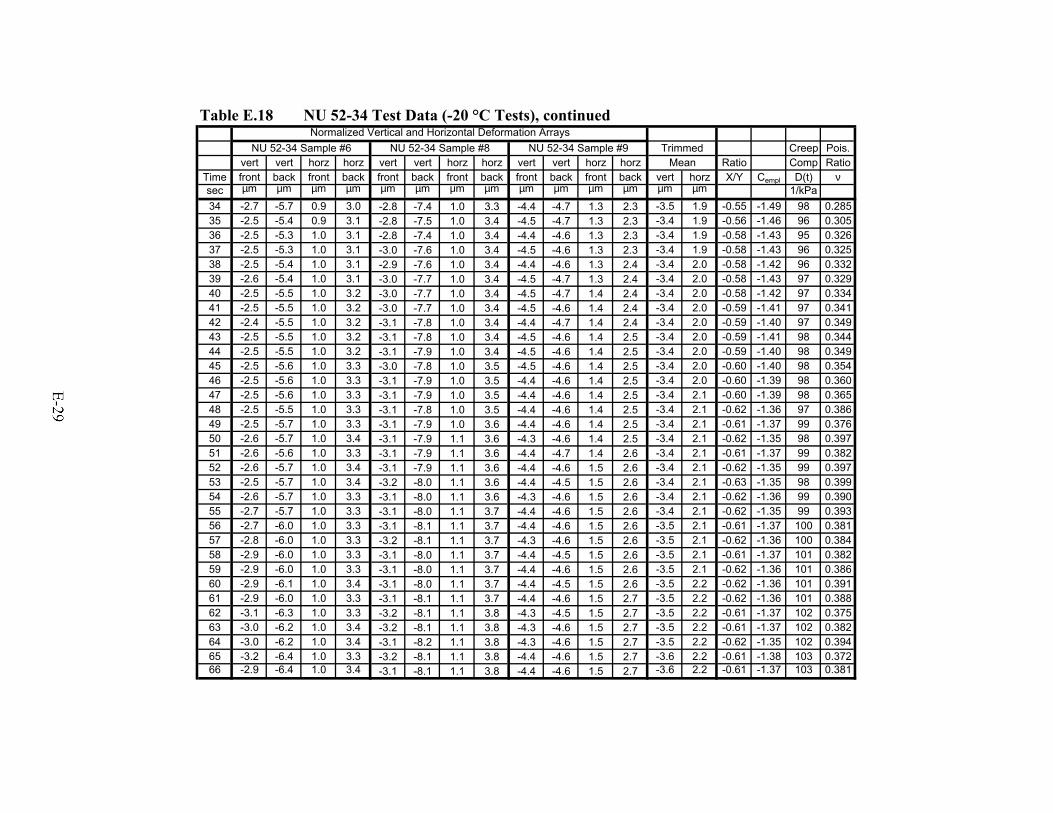
Table E.18 NU 52-34 Test Data (-20 °C Tests), continued
Creep Pois.vert vert horz horz vert vert horz horz vert vert horz horz Ratio Comp Ratio
Time front back front back front back front back front back front back vert horz X/Y Cempl D(t) νsec µm µm µm µm µm µm µm µm µm µm µm µm µm µm 1/kPa34 -2.7 -5.7 0.9 3.0 -2.8 -7.4 1.0 3.3 -4.4 -4.7 1.3 2.3 -3.5 1.9 -0.55 -1.49 98 0.28535 -2.5 -5.4 0.9 3.1 -2.8 -7.5 1.0 3.4 -4.5 -4.7 1.3 2.3 -3.4 1.9 -0.56 -1.46 96 0.30536 -2.5 -5.3 1.0 3.1 -2.8 -7.4 1.0 3.4 -4.4 -4.6 1.3 2.3 -3.4 1.9 -0.58 -1.43 95 0.32637 -2.5 -5.3 1.0 3.1 -3.0 -7.6 1.0 3.4 -4.5 -4.6 1.3 2.3 -3.4 1.9 -0.58 -1.43 96 0.32538 -2.5 -5.4 1.0 3.1 -2.9 -7.6 1.0 3.4 -4.4 -4.6 1.3 2.4 -3.4 2.0 -0.58 -1.42 96 0.33239 -2.6 -5.4 1.0 3.1 -3.0 -7.7 1.0 3.4 -4.5 -4.7 1.3 2.4 -3.4 2.0 -0.58 -1.43 97 0.32940 -2.5 -5.5 1.0 3.2 -3.0 -7.7 1.0 3.4 -4.5 -4.7 1.4 2.4 -3.4 2.0 -0.58 -1.42 97 0.33441 -2.5 -5.5 1.0 3.2 -3.0 -7.7 1.0 3.4 -4.5 -4.6 1.4 2.4 -3.4 2.0 -0.59 -1.41 97 0.34142 -2.4 -5.5 1.0 3.2 -3.1 -7.8 1.0 3.4 -4.4 -4.7 1.4 2.4 -3.4 2.0 -0.59 -1.40 97 0.34943 -2.5 -5.5 1.0 3.2 -3.1 -7.8 1.0 3.4 -4.5 -4.6 1.4 2.5 -3.4 2.0 -0.59 -1.41 98 0.34444 -2.5 -5.5 1.0 3.2 -3.1 -7.9 1.0 3.4 -4.5 -4.6 1.4 2.5 -3.4 2.0 -0.59 -1.40 98 0.34945 -2.5 -5.6 1.0 3.3 -3.0 -7.8 1.0 3.5 -4.5 -4.6 1.4 2.5 -3.4 2.0 -0.60 -1.40 98 0.35446 -2.5 -5.6 1.0 3.3 -3.1 -7.9 1.0 3.5 -4.4 -4.6 1.4 2.5 -3.4 2.0 -0.60 -1.39 98 0.36047 -2.5 -5.6 1.0 3.3 -3.1 -7.9 1.0 3.5 -4.4 -4.6 1.4 2.5 -3.4 2.1 -0.60 -1.39 98 0.36548 -2.5 -5.5 1.0 3.3 -3.1 -7.8 1.0 3.5 -4.4 -4.6 1.4 2.5 -3.4 2.1 -0.62 -1.36 97 0.38649 -2.5 -5.7 1.0 3.3 -3.1 -7.9 1.0 3.6 -4.4 -4.6 1.4 2.5 -3.4 2.1 -0.61 -1.37 99 0.37650 -2.6 -5.7 1.0 3.4 -3.1 -7.9 1.1 3.6 -4.3 -4.6 1.4 2.5 -3.4 2.1 -0.62 -1.35 98 0.39751 -2.6 -5.6 1.0 3.3 -3.1 -7.9 1.1 3.6 -4.4 -4.7 1.4 2.6 -3.4 2.1 -0.61 -1.37 99 0.38252 -2.6 -5.7 1.0 3.4 -3.1 -7.9 1.1 3.6 -4.4 -4.6 1.5 2.6 -3.4 2.1 -0.62 -1.35 99 0.39753 -2.5 -5.7 1.0 3.4 -3.2 -8.0 1.1 3.6 -4.4 -4.5 1.5 2.6 -3.4 2.1 -0.63 -1.35 98 0.39954 -2.6 -5.7 1.0 3.3 -3.1 -8.0 1.1 3.6 -4.3 -4.6 1.5 2.6 -3.4 2.1 -0.62 -1.36 99 0.39055 -2.7 -5.7 1.0 3.3 -3.1 -8.0 1.1 3.7 -4.4 -4.6 1.5 2.6 -3.4 2.1 -0.62 -1.35 99 0.39356 -2.7 -6.0 1.0 3.3 -3.1 -8.1 1.1 3.7 -4.4 -4.6 1.5 2.6 -3.5 2.1 -0.61 -1.37 100 0.38157 -2.8 -6.0 1.0 3.3 -3.2 -8.1 1.1 3.7 -4.3 -4.6 1.5 2.6 -3.5 2.1 -0.62 -1.36 100 0.38458 -2.9 -6.0 1.0 3.3 -3.1 -8.0 1.1 3.7 -4.4 -4.5 1.5 2.6 -3.5 2.1 -0.61 -1.37 101 0.38259 -2.9 -6.0 1.0 3.3 -3.1 -8.0 1.1 3.7 -4.4 -4.6 1.5 2.6 -3.5 2.1 -0.62 -1.36 101 0.38660 -2.9 -6.1 1.0 3.4 -3.1 -8.0 1.1 3.7 -4.4 -4.5 1.5 2.6 -3.5 2.2 -0.62 -1.36 101 0.39161 -2.9 -6.0 1.0 3.3 -3.1 -8.1 1.1 3.7 -4.4 -4.6 1.5 2.7 -3.5 2.2 -0.62 -1.36 101 0.38862 -3.1 -6.3 1.0 3.3 -3.2 -8.1 1.1 3.8 -4.3 -4.5 1.5 2.7 -3.5 2.2 -0.61 -1.37 102 0.37563 -3.0 -6.2 1.0 3.4 -3.2 -8.1 1.1 3.8 -4.3 -4.6 1.5 2.7 -3.5 2.2 -0.61 -1.37 102 0.38264 -3.0 -6.2 1.0 3.4 -3.1 -8.2 1.1 3.8 -4.3 -4.6 1.5 2.7 -3.5 2.2 -0.62 -1.35 102 0.39465 -3.2 -6.4 1.0 3.3 -3.2 -8.1 1.1 3.8 -4.4 -4.6 1.5 2.7 -3.6 2.2 -0.61 -1.38 103 0.37266 -2.9 -6.4 1.0 3.4 -3.1 -8.1 1.1 3.8 -4.4 -4.6 1.5 2.7 -3.6 2.2 -0.61 -1.37 103 0.381
Mean
Normalized Vertical and Horizontal Deformation ArraysNU 52-34 Sample #6 NU 52-34 Sample #8 NU 52-34 Sample #9 Trimmed
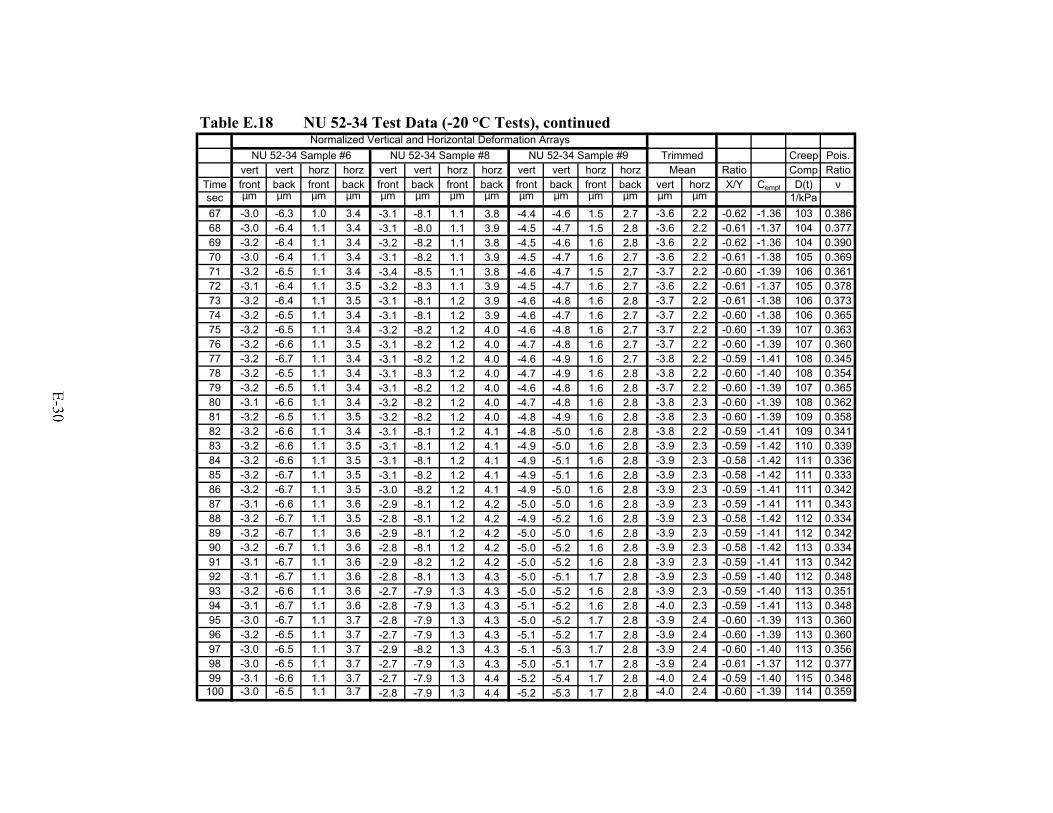
Table E.18 NU 52-34 Test Data (-20 °C Tests), continued
Creep Pois.vert vert horz horz vert vert horz horz vert vert horz horz Ratio Comp Ratio
Time front back front back front back front back front back front back vert horz X/Y Cempl D(t) νsec µm µm µm µm µm µm µm µm µm µm µm µm µm µm 1/kPa67 -3.0 -6.3 1.0 3.4 -3.1 -8.1 1.1 3.8 -4.4 -4.6 1.5 2.7 -3.6 2.2 -0.62 -1.36 103 0.38668 -3.0 -6.4 1.1 3.4 -3.1 -8.0 1.1 3.9 -4.5 -4.7 1.5 2.8 -3.6 2.2 -0.61 -1.37 104 0.37769 -3.2 -6.4 1.1 3.4 -3.2 -8.2 1.1 3.8 -4.5 -4.6 1.6 2.8 -3.6 2.2 -0.62 -1.36 104 0.39070 -3.0 -6.4 1.1 3.4 -3.1 -8.2 1.1 3.9 -4.5 -4.7 1.6 2.7 -3.6 2.2 -0.61 -1.38 105 0.36971 -3.2 -6.5 1.1 3.4 -3.4 -8.5 1.1 3.8 -4.6 -4.7 1.5 2.7 -3.7 2.2 -0.60 -1.39 106 0.36172 -3.1 -6.4 1.1 3.5 -3.2 -8.3 1.1 3.9 -4.5 -4.7 1.6 2.7 -3.6 2.2 -0.61 -1.37 105 0.37873 -3.2 -6.4 1.1 3.5 -3.1 -8.1 1.2 3.9 -4.6 -4.8 1.6 2.8 -3.7 2.2 -0.61 -1.38 106 0.37374 -3.2 -6.5 1.1 3.4 -3.1 -8.1 1.2 3.9 -4.6 -4.7 1.6 2.7 -3.7 2.2 -0.60 -1.38 106 0.36575 -3.2 -6.5 1.1 3.4 -3.2 -8.2 1.2 4.0 -4.6 -4.8 1.6 2.7 -3.7 2.2 -0.60 -1.39 107 0.36376 -3.2 -6.6 1.1 3.5 -3.1 -8.2 1.2 4.0 -4.7 -4.8 1.6 2.7 -3.7 2.2 -0.60 -1.39 107 0.36077 -3.2 -6.7 1.1 3.4 -3.1 -8.2 1.2 4.0 -4.6 -4.9 1.6 2.7 -3.8 2.2 -0.59 -1.41 108 0.34578 -3.2 -6.5 1.1 3.4 -3.1 -8.3 1.2 4.0 -4.7 -4.9 1.6 2.8 -3.8 2.2 -0.60 -1.40 108 0.35479 -3.2 -6.5 1.1 3.4 -3.1 -8.2 1.2 4.0 -4.6 -4.8 1.6 2.8 -3.7 2.2 -0.60 -1.39 107 0.36580 -3.1 -6.6 1.1 3.4 -3.2 -8.2 1.2 4.0 -4.7 -4.8 1.6 2.8 -3.8 2.3 -0.60 -1.39 108 0.36281 -3.2 -6.5 1.1 3.5 -3.2 -8.2 1.2 4.0 -4.8 -4.9 1.6 2.8 -3.8 2.3 -0.60 -1.39 109 0.35882 -3.2 -6.6 1.1 3.4 -3.1 -8.1 1.2 4.1 -4.8 -5.0 1.6 2.8 -3.8 2.2 -0.59 -1.41 109 0.34183 -3.2 -6.6 1.1 3.5 -3.1 -8.1 1.2 4.1 -4.9 -5.0 1.6 2.8 -3.9 2.3 -0.59 -1.42 110 0.33984 -3.2 -6.6 1.1 3.5 -3.1 -8.1 1.2 4.1 -4.9 -5.1 1.6 2.8 -3.9 2.3 -0.58 -1.42 111 0.33685 -3.2 -6.7 1.1 3.5 -3.1 -8.2 1.2 4.1 -4.9 -5.1 1.6 2.8 -3.9 2.3 -0.58 -1.42 111 0.33386 -3.2 -6.7 1.1 3.5 -3.0 -8.2 1.2 4.1 -4.9 -5.0 1.6 2.8 -3.9 2.3 -0.59 -1.41 111 0.34287 -3.1 -6.6 1.1 3.6 -2.9 -8.1 1.2 4.2 -5.0 -5.0 1.6 2.8 -3.9 2.3 -0.59 -1.41 111 0.34388 -3.2 -6.7 1.1 3.5 -2.8 -8.1 1.2 4.2 -4.9 -5.2 1.6 2.8 -3.9 2.3 -0.58 -1.42 112 0.33489 -3.2 -6.7 1.1 3.6 -2.9 -8.1 1.2 4.2 -5.0 -5.0 1.6 2.8 -3.9 2.3 -0.59 -1.41 112 0.34290 -3.2 -6.7 1.1 3.6 -2.8 -8.1 1.2 4.2 -5.0 -5.2 1.6 2.8 -3.9 2.3 -0.58 -1.42 113 0.33491 -3.1 -6.7 1.1 3.6 -2.9 -8.2 1.2 4.2 -5.0 -5.2 1.6 2.8 -3.9 2.3 -0.59 -1.41 113 0.34292 -3.1 -6.7 1.1 3.6 -2.8 -8.1 1.3 4.3 -5.0 -5.1 1.7 2.8 -3.9 2.3 -0.59 -1.40 112 0.34893 -3.2 -6.6 1.1 3.6 -2.7 -7.9 1.3 4.3 -5.0 -5.2 1.6 2.8 -3.9 2.3 -0.59 -1.40 113 0.35194 -3.1 -6.7 1.1 3.6 -2.8 -7.9 1.3 4.3 -5.1 -5.2 1.6 2.8 -4.0 2.3 -0.59 -1.41 113 0.34895 -3.0 -6.7 1.1 3.7 -2.8 -7.9 1.3 4.3 -5.0 -5.2 1.7 2.8 -3.9 2.4 -0.60 -1.39 113 0.36096 -3.2 -6.5 1.1 3.7 -2.7 -7.9 1.3 4.3 -5.1 -5.2 1.7 2.8 -3.9 2.4 -0.60 -1.39 113 0.36097 -3.0 -6.5 1.1 3.7 -2.9 -8.2 1.3 4.3 -5.1 -5.3 1.7 2.8 -3.9 2.4 -0.60 -1.40 113 0.35698 -3.0 -6.5 1.1 3.7 -2.7 -7.9 1.3 4.3 -5.0 -5.1 1.7 2.8 -3.9 2.4 -0.61 -1.37 112 0.37799 -3.1 -6.6 1.1 3.7 -2.7 -7.9 1.3 4.4 -5.2 -5.4 1.7 2.8 -4.0 2.4 -0.59 -1.40 115 0.348100 -3.0 -6.5 1.1 3.7 -2.8 -7.9 1.3 4.4 -5.2 -5.3 1.7 2.8 -4.0 2.4 -0.60 -1.39 114 0.359
Mean
Normalized Vertical and Horizontal Deformation ArraysNU 52-34 Sample #6 NU 52-34 Sample #8 NU 52-34 Sample #9 Trimmed
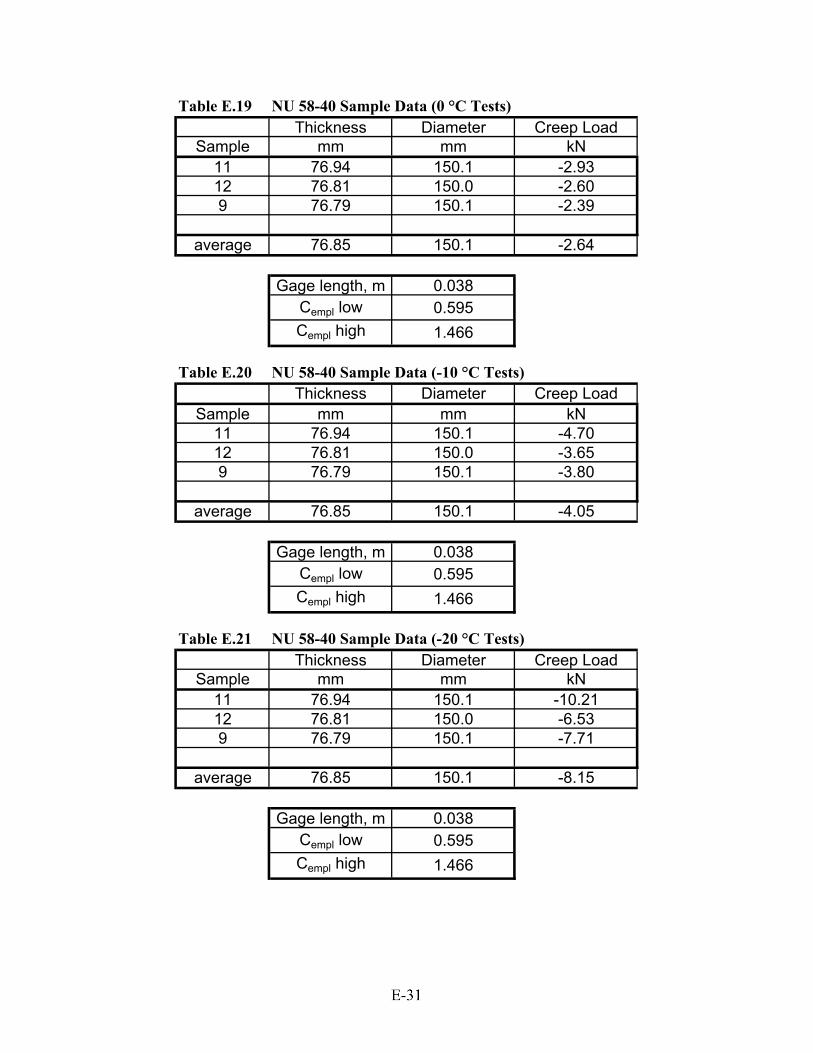
Table E.19 NU 58-40 Sample Data (0 °C Tests)Thickness Diameter Creep Load
Sample mm mm kN11 76.94 150.1 -2.9312 76.81 150.0 -2.609 76.79 150.1 -2.39
average 76.85 150.1 -2.64
Gage length, m 0.038Cempl low 0.595Cempl high 1.466
Table E.20 NU 58-40 Sample Data (-10 °C Tests)Thickness Diameter Creep Load
Sample mm mm kN11 76.94 150.1 -4.7012 76.81 150.0 -3.659 76.79 150.1 -3.80
average 76.85 150.1 -4.05
Gage length, m 0.038Cempl low 0.595Cempl high 1.466
Table E.21 NU 58-40 Sample Data (-20 °C Tests)Thickness Diameter Creep Load
Sample mm mm kN11 76.94 150.1 -10.2112 76.81 150.0 -6.539 76.79 150.1 -7.71
average 76.85 150.1 -8.15
Gage length, m 0.038Cempl low 0.595Cempl high 1.466
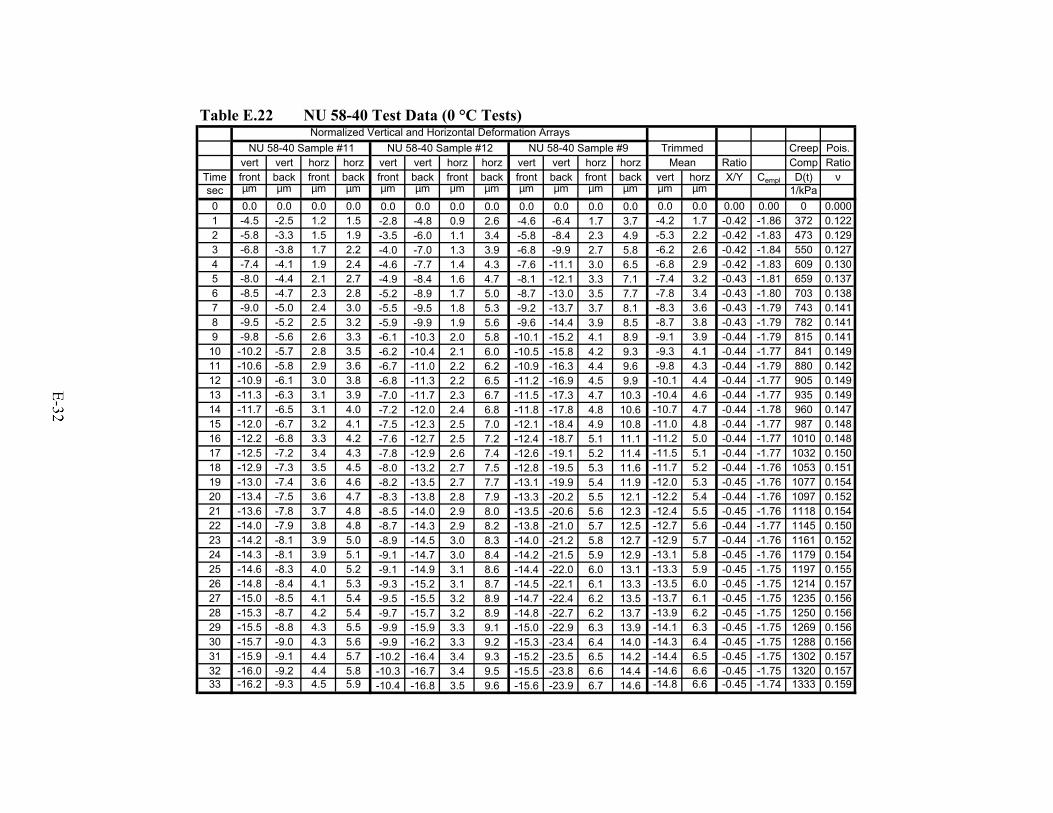
Table E.22 NU 58-40 Test Data (0 °C Tests)
Creep Pois.vert vert horz horz vert vert horz horz vert vert horz horz Ratio Comp Ratio
Time front back front back front back front back front back front back vert horz X/Y Cempl D(t) νsec µm µm µm µm µm µm µm µm µm µm µm µm µm µm 1/kPa0 0.0 0.0 0.0 0.0 0.0 0.0 0.0 0.0 0.0 0.0 0.0 0.0 0.0 0.0 0.00 0.00 0 0.0001 -4.5 -2.5 1.2 1.5 -2.8 -4.8 0.9 2.6 -4.6 -6.4 1.7 3.7 -4.2 1.7 -0.42 -1.86 372 0.1222 -5.8 -3.3 1.5 1.9 -3.5 -6.0 1.1 3.4 -5.8 -8.4 2.3 4.9 -5.3 2.2 -0.42 -1.83 473 0.1293 -6.8 -3.8 1.7 2.2 -4.0 -7.0 1.3 3.9 -6.8 -9.9 2.7 5.8 -6.2 2.6 -0.42 -1.84 550 0.1274 -7.4 -4.1 1.9 2.4 -4.6 -7.7 1.4 4.3 -7.6 -11.1 3.0 6.5 -6.8 2.9 -0.42 -1.83 609 0.1305 -8.0 -4.4 2.1 2.7 -4.9 -8.4 1.6 4.7 -8.1 -12.1 3.3 7.1 -7.4 3.2 -0.43 -1.81 659 0.1376 -8.5 -4.7 2.3 2.8 -5.2 -8.9 1.7 5.0 -8.7 -13.0 3.5 7.7 -7.8 3.4 -0.43 -1.80 703 0.1387 -9.0 -5.0 2.4 3.0 -5.5 -9.5 1.8 5.3 -9.2 -13.7 3.7 8.1 -8.3 3.6 -0.43 -1.79 743 0.1418 -9.5 -5.2 2.5 3.2 -5.9 -9.9 1.9 5.6 -9.6 -14.4 3.9 8.5 -8.7 3.8 -0.43 -1.79 782 0.1419 -9.8 -5.6 2.6 3.3 -6.1 -10.3 2.0 5.8 -10.1 -15.2 4.1 8.9 -9.1 3.9 -0.44 -1.79 815 0.141
10 -10.2 -5.7 2.8 3.5 -6.2 -10.4 2.1 6.0 -10.5 -15.8 4.2 9.3 -9.3 4.1 -0.44 -1.77 841 0.14911 -10.6 -5.8 2.9 3.6 -6.7 -11.0 2.2 6.2 -10.9 -16.3 4.4 9.6 -9.8 4.3 -0.44 -1.79 880 0.14212 -10.9 -6.1 3.0 3.8 -6.8 -11.3 2.2 6.5 -11.2 -16.9 4.5 9.9 -10.1 4.4 -0.44 -1.77 905 0.14913 -11.3 -6.3 3.1 3.9 -7.0 -11.7 2.3 6.7 -11.5 -17.3 4.7 10.3 -10.4 4.6 -0.44 -1.77 935 0.14914 -11.7 -6.5 3.1 4.0 -7.2 -12.0 2.4 6.8 -11.8 -17.8 4.8 10.6 -10.7 4.7 -0.44 -1.78 960 0.14715 -12.0 -6.7 3.2 4.1 -7.5 -12.3 2.5 7.0 -12.1 -18.4 4.9 10.8 -11.0 4.8 -0.44 -1.77 987 0.14816 -12.2 -6.8 3.3 4.2 -7.6 -12.7 2.5 7.2 -12.4 -18.7 5.1 11.1 -11.2 5.0 -0.44 -1.77 1010 0.14817 -12.5 -7.2 3.4 4.3 -7.8 -12.9 2.6 7.4 -12.6 -19.1 5.2 11.4 -11.5 5.1 -0.44 -1.77 1032 0.15018 -12.9 -7.3 3.5 4.5 -8.0 -13.2 2.7 7.5 -12.8 -19.5 5.3 11.6 -11.7 5.2 -0.44 -1.76 1053 0.15119 -13.0 -7.4 3.6 4.6 -8.2 -13.5 2.7 7.7 -13.1 -19.9 5.4 11.9 -12.0 5.3 -0.45 -1.76 1077 0.15420 -13.4 -7.5 3.6 4.7 -8.3 -13.8 2.8 7.9 -13.3 -20.2 5.5 12.1 -12.2 5.4 -0.44 -1.76 1097 0.15221 -13.6 -7.8 3.7 4.8 -8.5 -14.0 2.9 8.0 -13.5 -20.6 5.6 12.3 -12.4 5.5 -0.45 -1.76 1118 0.15422 -14.0 -7.9 3.8 4.8 -8.7 -14.3 2.9 8.2 -13.8 -21.0 5.7 12.5 -12.7 5.6 -0.44 -1.77 1145 0.15023 -14.2 -8.1 3.9 5.0 -8.9 -14.5 3.0 8.3 -14.0 -21.2 5.8 12.7 -12.9 5.7 -0.44 -1.76 1161 0.15224 -14.3 -8.1 3.9 5.1 -9.1 -14.7 3.0 8.4 -14.2 -21.5 5.9 12.9 -13.1 5.8 -0.45 -1.76 1179 0.15425 -14.6 -8.3 4.0 5.2 -9.1 -14.9 3.1 8.6 -14.4 -22.0 6.0 13.1 -13.3 5.9 -0.45 -1.75 1197 0.15526 -14.8 -8.4 4.1 5.3 -9.3 -15.2 3.1 8.7 -14.5 -22.1 6.1 13.3 -13.5 6.0 -0.45 -1.75 1214 0.15727 -15.0 -8.5 4.1 5.4 -9.5 -15.5 3.2 8.9 -14.7 -22.4 6.2 13.5 -13.7 6.1 -0.45 -1.75 1235 0.15628 -15.3 -8.7 4.2 5.4 -9.7 -15.7 3.2 8.9 -14.8 -22.7 6.2 13.7 -13.9 6.2 -0.45 -1.75 1250 0.15629 -15.5 -8.8 4.3 5.5 -9.9 -15.9 3.3 9.1 -15.0 -22.9 6.3 13.9 -14.1 6.3 -0.45 -1.75 1269 0.15630 -15.7 -9.0 4.3 5.6 -9.9 -16.2 3.3 9.2 -15.3 -23.4 6.4 14.0 -14.3 6.4 -0.45 -1.75 1288 0.15631 -15.9 -9.1 4.4 5.7 -10.2 -16.4 3.4 9.3 -15.2 -23.5 6.5 14.2 -14.4 6.5 -0.45 -1.75 1302 0.15732 -16.0 -9.2 4.4 5.8 -10.3 -16.7 3.4 9.5 -15.5 -23.8 6.6 14.4 -14.6 6.6 -0.45 -1.75 1320 0.15733 -16.2 -9.3 4.5 5.9 -10.4 -16.8 3.5 9.6 -15.6 -23.9 6.7 14.6 -14.8 6.6 -0.45 -1.74 1333 0.159
Mean
Normalized Vertical and Horizontal Deformation ArraysNU 58-40 Sample #11 NU 58-40 Sample #12 NU 58-40 Sample #9 Trimmed
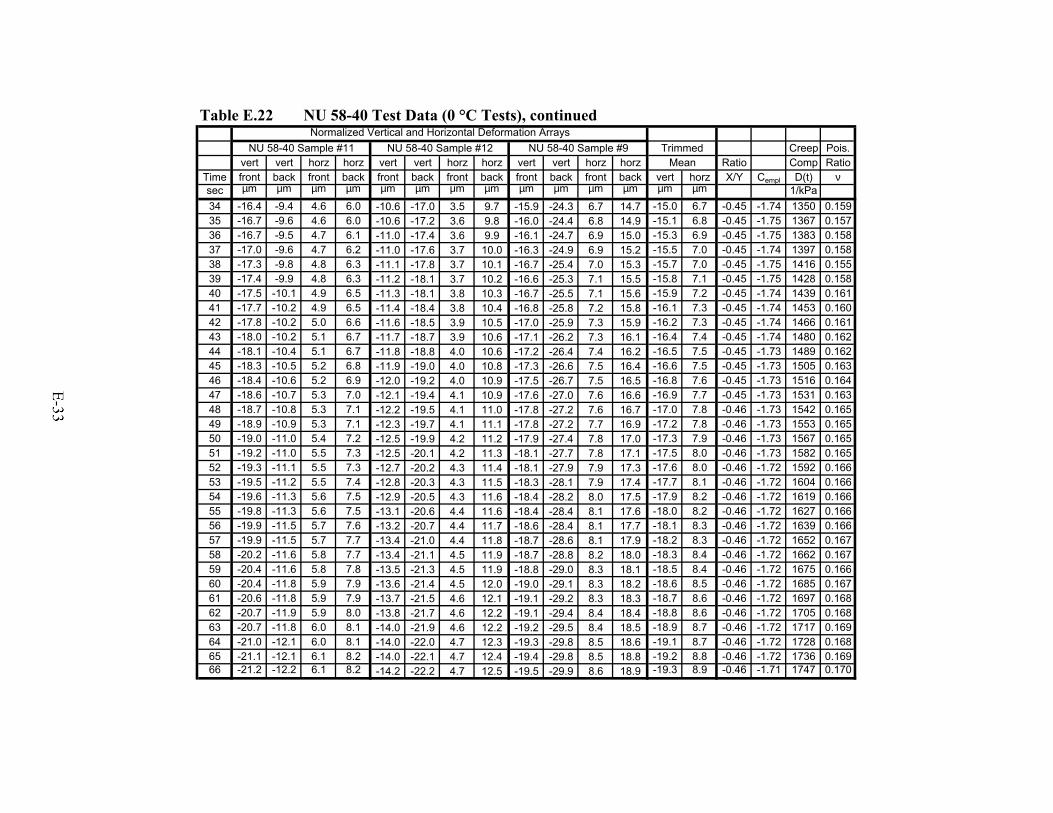
Table E.22 NU 58-40 Test Data (0 °C Tests), continued
Creep Pois.vert vert horz horz vert vert horz horz vert vert horz horz Ratio Comp Ratio
Time front back front back front back front back front back front back vert horz X/Y Cempl D(t) νsec µm µm µm µm µm µm µm µm µm µm µm µm µm µm 1/kPa34 -16.4 -9.4 4.6 6.0 -10.6 -17.0 3.5 9.7 -15.9 -24.3 6.7 14.7 -15.0 6.7 -0.45 -1.74 1350 0.15935 -16.7 -9.6 4.6 6.0 -10.6 -17.2 3.6 9.8 -16.0 -24.4 6.8 14.9 -15.1 6.8 -0.45 -1.75 1367 0.15736 -16.7 -9.5 4.7 6.1 -11.0 -17.4 3.6 9.9 -16.1 -24.7 6.9 15.0 -15.3 6.9 -0.45 -1.75 1383 0.15837 -17.0 -9.6 4.7 6.2 -11.0 -17.6 3.7 10.0 -16.3 -24.9 6.9 15.2 -15.5 7.0 -0.45 -1.74 1397 0.15838 -17.3 -9.8 4.8 6.3 -11.1 -17.8 3.7 10.1 -16.7 -25.4 7.0 15.3 -15.7 7.0 -0.45 -1.75 1416 0.15539 -17.4 -9.9 4.8 6.3 -11.2 -18.1 3.7 10.2 -16.6 -25.3 7.1 15.5 -15.8 7.1 -0.45 -1.75 1428 0.15840 -17.5 -10.1 4.9 6.5 -11.3 -18.1 3.8 10.3 -16.7 -25.5 7.1 15.6 -15.9 7.2 -0.45 -1.74 1439 0.16141 -17.7 -10.2 4.9 6.5 -11.4 -18.4 3.8 10.4 -16.8 -25.8 7.2 15.8 -16.1 7.3 -0.45 -1.74 1453 0.16042 -17.8 -10.2 5.0 6.6 -11.6 -18.5 3.9 10.5 -17.0 -25.9 7.3 15.9 -16.2 7.3 -0.45 -1.74 1466 0.16143 -18.0 -10.2 5.1 6.7 -11.7 -18.7 3.9 10.6 -17.1 -26.2 7.3 16.1 -16.4 7.4 -0.45 -1.74 1480 0.16244 -18.1 -10.4 5.1 6.7 -11.8 -18.8 4.0 10.6 -17.2 -26.4 7.4 16.2 -16.5 7.5 -0.45 -1.73 1489 0.16245 -18.3 -10.5 5.2 6.8 -11.9 -19.0 4.0 10.8 -17.3 -26.6 7.5 16.4 -16.6 7.5 -0.45 -1.73 1505 0.16346 -18.4 -10.6 5.2 6.9 -12.0 -19.2 4.0 10.9 -17.5 -26.7 7.5 16.5 -16.8 7.6 -0.45 -1.73 1516 0.16447 -18.6 -10.7 5.3 7.0 -12.1 -19.4 4.1 10.9 -17.6 -27.0 7.6 16.6 -16.9 7.7 -0.45 -1.73 1531 0.16348 -18.7 -10.8 5.3 7.1 -12.2 -19.5 4.1 11.0 -17.8 -27.2 7.6 16.7 -17.0 7.8 -0.46 -1.73 1542 0.16549 -18.9 -10.9 5.3 7.1 -12.3 -19.7 4.1 11.1 -17.8 -27.2 7.7 16.9 -17.2 7.8 -0.46 -1.73 1553 0.16550 -19.0 -11.0 5.4 7.2 -12.5 -19.9 4.2 11.2 -17.9 -27.4 7.8 17.0 -17.3 7.9 -0.46 -1.73 1567 0.16551 -19.2 -11.0 5.5 7.3 -12.5 -20.1 4.2 11.3 -18.1 -27.7 7.8 17.1 -17.5 8.0 -0.46 -1.73 1582 0.16552 -19.3 -11.1 5.5 7.3 -12.7 -20.2 4.3 11.4 -18.1 -27.9 7.9 17.3 -17.6 8.0 -0.46 -1.72 1592 0.16653 -19.5 -11.2 5.5 7.4 -12.8 -20.3 4.3 11.5 -18.3 -28.1 7.9 17.4 -17.7 8.1 -0.46 -1.72 1604 0.16654 -19.6 -11.3 5.6 7.5 -12.9 -20.5 4.3 11.6 -18.4 -28.2 8.0 17.5 -17.9 8.2 -0.46 -1.72 1619 0.16655 -19.8 -11.3 5.6 7.5 -13.1 -20.6 4.4 11.6 -18.4 -28.4 8.1 17.6 -18.0 8.2 -0.46 -1.72 1627 0.16656 -19.9 -11.5 5.7 7.6 -13.2 -20.7 4.4 11.7 -18.6 -28.4 8.1 17.7 -18.1 8.3 -0.46 -1.72 1639 0.16657 -19.9 -11.5 5.7 7.7 -13.4 -21.0 4.4 11.8 -18.7 -28.6 8.1 17.9 -18.2 8.3 -0.46 -1.72 1652 0.16758 -20.2 -11.6 5.8 7.7 -13.4 -21.1 4.5 11.9 -18.7 -28.8 8.2 18.0 -18.3 8.4 -0.46 -1.72 1662 0.16759 -20.4 -11.6 5.8 7.8 -13.5 -21.3 4.5 11.9 -18.8 -29.0 8.3 18.1 -18.5 8.4 -0.46 -1.72 1675 0.16660 -20.4 -11.8 5.9 7.9 -13.6 -21.4 4.5 12.0 -19.0 -29.1 8.3 18.2 -18.6 8.5 -0.46 -1.72 1685 0.16761 -20.6 -11.8 5.9 7.9 -13.7 -21.5 4.6 12.1 -19.1 -29.2 8.3 18.3 -18.7 8.6 -0.46 -1.72 1697 0.16862 -20.7 -11.9 5.9 8.0 -13.8 -21.7 4.6 12.2 -19.1 -29.4 8.4 18.4 -18.8 8.6 -0.46 -1.72 1705 0.16863 -20.7 -11.8 6.0 8.1 -14.0 -21.9 4.6 12.2 -19.2 -29.5 8.4 18.5 -18.9 8.7 -0.46 -1.72 1717 0.16964 -21.0 -12.1 6.0 8.1 -14.0 -22.0 4.7 12.3 -19.3 -29.8 8.5 18.6 -19.1 8.7 -0.46 -1.72 1728 0.16865 -21.1 -12.1 6.1 8.2 -14.0 -22.1 4.7 12.4 -19.4 -29.8 8.5 18.8 -19.2 8.8 -0.46 -1.72 1736 0.16966 -21.2 -12.2 6.1 8.2 -14.2 -22.2 4.7 12.5 -19.5 -29.9 8.6 18.9 -19.3 8.9 -0.46 -1.71 1747 0.170
Mean
Normalized Vertical and Horizontal Deformation ArraysNU 58-40 Sample #11 NU 58-40 Sample #12 NU 58-40 Sample #9 Trimmed
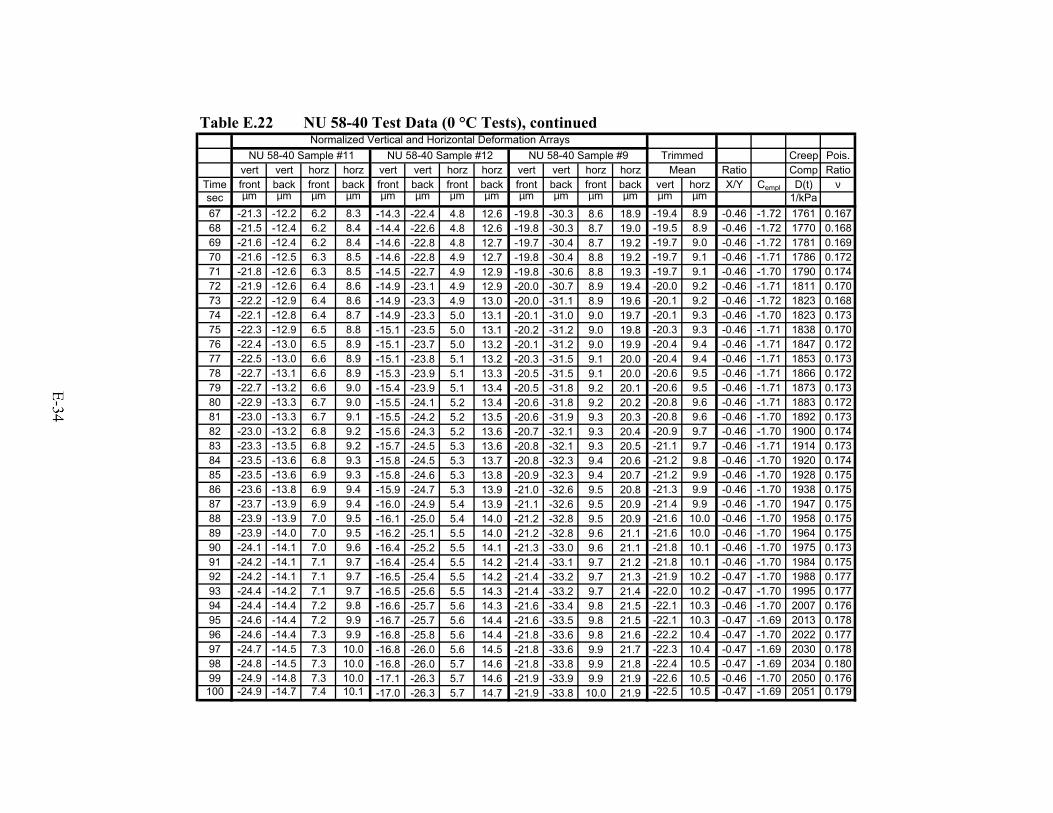
Table E.22 NU 58-40 Test Data (0 °C Tests), continued
Creep Pois.vert vert horz horz vert vert horz horz vert vert horz horz Ratio Comp Ratio
Time front back front back front back front back front back front back vert horz X/Y Cempl D(t) νsec µm µm µm µm µm µm µm µm µm µm µm µm µm µm 1/kPa67 -21.3 -12.2 6.2 8.3 -14.3 -22.4 4.8 12.6 -19.8 -30.3 8.6 18.9 -19.4 8.9 -0.46 -1.72 1761 0.16768 -21.5 -12.4 6.2 8.4 -14.4 -22.6 4.8 12.6 -19.8 -30.3 8.7 19.0 -19.5 8.9 -0.46 -1.72 1770 0.16869 -21.6 -12.4 6.2 8.4 -14.6 -22.8 4.8 12.7 -19.7 -30.4 8.7 19.2 -19.7 9.0 -0.46 -1.72 1781 0.16970 -21.6 -12.5 6.3 8.5 -14.6 -22.8 4.9 12.7 -19.8 -30.4 8.8 19.2 -19.7 9.1 -0.46 -1.71 1786 0.17271 -21.8 -12.6 6.3 8.5 -14.5 -22.7 4.9 12.9 -19.8 -30.6 8.8 19.3 -19.7 9.1 -0.46 -1.70 1790 0.17472 -21.9 -12.6 6.4 8.6 -14.9 -23.1 4.9 12.9 -20.0 -30.7 8.9 19.4 -20.0 9.2 -0.46 -1.71 1811 0.17073 -22.2 -12.9 6.4 8.6 -14.9 -23.3 4.9 13.0 -20.0 -31.1 8.9 19.6 -20.1 9.2 -0.46 -1.72 1823 0.16874 -22.1 -12.8 6.4 8.7 -14.9 -23.3 5.0 13.1 -20.1 -31.0 9.0 19.7 -20.1 9.3 -0.46 -1.70 1823 0.17375 -22.3 -12.9 6.5 8.8 -15.1 -23.5 5.0 13.1 -20.2 -31.2 9.0 19.8 -20.3 9.3 -0.46 -1.71 1838 0.17076 -22.4 -13.0 6.5 8.9 -15.1 -23.7 5.0 13.2 -20.1 -31.2 9.0 19.9 -20.4 9.4 -0.46 -1.71 1847 0.17277 -22.5 -13.0 6.6 8.9 -15.1 -23.8 5.1 13.2 -20.3 -31.5 9.1 20.0 -20.4 9.4 -0.46 -1.71 1853 0.17378 -22.7 -13.1 6.6 8.9 -15.3 -23.9 5.1 13.3 -20.5 -31.5 9.1 20.0 -20.6 9.5 -0.46 -1.71 1866 0.17279 -22.7 -13.2 6.6 9.0 -15.4 -23.9 5.1 13.4 -20.5 -31.8 9.2 20.1 -20.6 9.5 -0.46 -1.71 1873 0.17380 -22.9 -13.3 6.7 9.0 -15.5 -24.1 5.2 13.4 -20.6 -31.8 9.2 20.2 -20.8 9.6 -0.46 -1.71 1883 0.17281 -23.0 -13.3 6.7 9.1 -15.5 -24.2 5.2 13.5 -20.6 -31.9 9.3 20.3 -20.8 9.6 -0.46 -1.70 1892 0.17382 -23.0 -13.2 6.8 9.2 -15.6 -24.3 5.2 13.6 -20.7 -32.1 9.3 20.4 -20.9 9.7 -0.46 -1.70 1900 0.17483 -23.3 -13.5 6.8 9.2 -15.7 -24.5 5.3 13.6 -20.8 -32.1 9.3 20.5 -21.1 9.7 -0.46 -1.71 1914 0.17384 -23.5 -13.6 6.8 9.3 -15.8 -24.5 5.3 13.7 -20.8 -32.3 9.4 20.6 -21.2 9.8 -0.46 -1.70 1920 0.17485 -23.5 -13.6 6.9 9.3 -15.8 -24.6 5.3 13.8 -20.9 -32.3 9.4 20.7 -21.2 9.9 -0.46 -1.70 1928 0.17586 -23.6 -13.8 6.9 9.4 -15.9 -24.7 5.3 13.9 -21.0 -32.6 9.5 20.8 -21.3 9.9 -0.46 -1.70 1938 0.17587 -23.7 -13.9 6.9 9.4 -16.0 -24.9 5.4 13.9 -21.1 -32.6 9.5 20.9 -21.4 9.9 -0.46 -1.70 1947 0.17588 -23.9 -13.9 7.0 9.5 -16.1 -25.0 5.4 14.0 -21.2 -32.8 9.5 20.9 -21.6 10.0 -0.46 -1.70 1958 0.17589 -23.9 -14.0 7.0 9.5 -16.2 -25.1 5.5 14.0 -21.2 -32.8 9.6 21.1 -21.6 10.0 -0.46 -1.70 1964 0.17590 -24.1 -14.1 7.0 9.6 -16.4 -25.2 5.5 14.1 -21.3 -33.0 9.6 21.1 -21.8 10.1 -0.46 -1.70 1975 0.17391 -24.2 -14.1 7.1 9.7 -16.4 -25.4 5.5 14.2 -21.4 -33.1 9.7 21.2 -21.8 10.1 -0.46 -1.70 1984 0.17592 -24.2 -14.1 7.1 9.7 -16.5 -25.4 5.5 14.2 -21.4 -33.2 9.7 21.3 -21.9 10.2 -0.47 -1.70 1988 0.17793 -24.4 -14.2 7.1 9.7 -16.5 -25.6 5.5 14.3 -21.4 -33.2 9.7 21.4 -22.0 10.2 -0.47 -1.70 1995 0.17794 -24.4 -14.4 7.2 9.8 -16.6 -25.7 5.6 14.3 -21.6 -33.4 9.8 21.5 -22.1 10.3 -0.46 -1.70 2007 0.17695 -24.6 -14.4 7.2 9.9 -16.7 -25.7 5.6 14.4 -21.6 -33.5 9.8 21.5 -22.1 10.3 -0.47 -1.69 2013 0.17896 -24.6 -14.4 7.3 9.9 -16.8 -25.8 5.6 14.4 -21.8 -33.6 9.8 21.6 -22.2 10.4 -0.47 -1.70 2022 0.17797 -24.7 -14.5 7.3 10.0 -16.8 -26.0 5.6 14.5 -21.8 -33.6 9.9 21.7 -22.3 10.4 -0.47 -1.69 2030 0.17898 -24.8 -14.5 7.3 10.0 -16.8 -26.0 5.7 14.6 -21.8 -33.8 9.9 21.8 -22.4 10.5 -0.47 -1.69 2034 0.18099 -24.9 -14.8 7.3 10.0 -17.1 -26.3 5.7 14.6 -21.9 -33.9 9.9 21.9 -22.6 10.5 -0.46 -1.70 2050 0.176100 -24.9 -14.7 7.4 10.1 -17.0 -26.3 5.7 14.7 -21.9 -33.8 10.0 21.9 -22.5 10.5 -0.47 -1.69 2051 0.179
Mean
Normalized Vertical and Horizontal Deformation ArraysNU 58-40 Sample #11 NU 58-40 Sample #12 NU 58-40 Sample #9 Trimmed
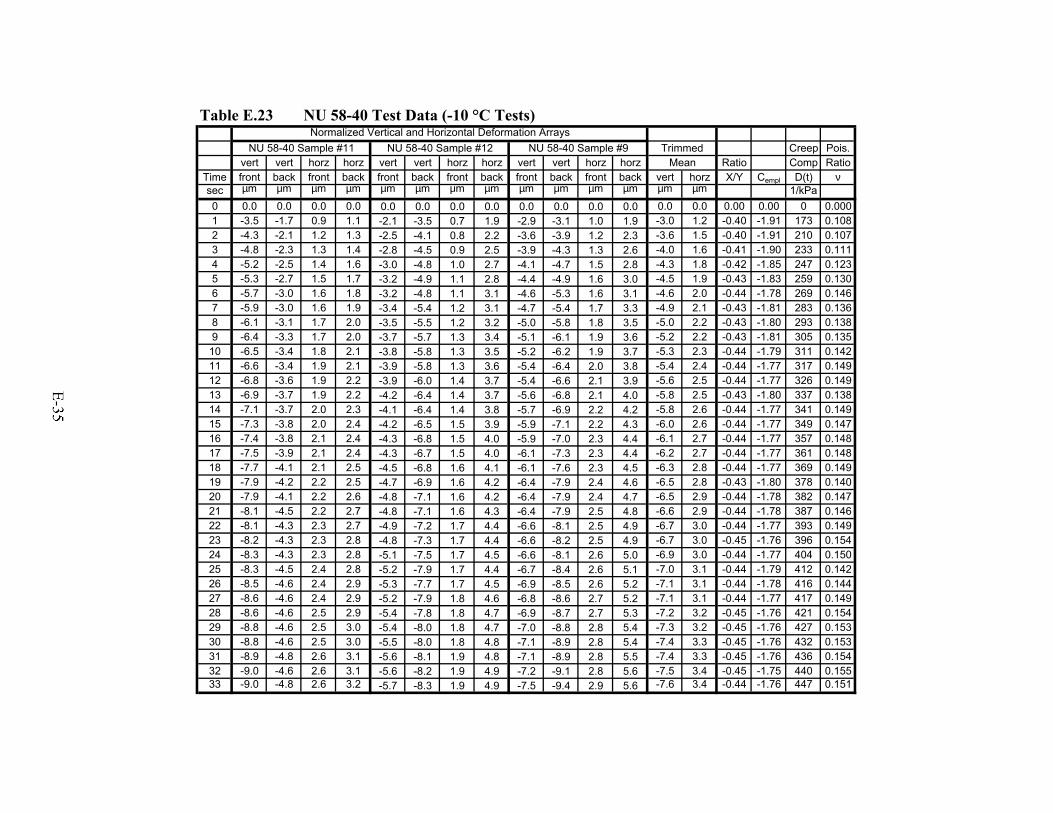
Table E.23 NU 58-40 Test Data (-10 °C Tests)
Creep Pois.vert vert horz horz vert vert horz horz vert vert horz horz Ratio Comp Ratio
Time front back front back front back front back front back front back vert horz X/Y Cempl D(t) νsec µm µm µm µm µm µm µm µm µm µm µm µm µm µm 1/kPa0 0.0 0.0 0.0 0.0 0.0 0.0 0.0 0.0 0.0 0.0 0.0 0.0 0.0 0.0 0.00 0.00 0 0.0001 -3.5 -1.7 0.9 1.1 -2.1 -3.5 0.7 1.9 -2.9 -3.1 1.0 1.9 -3.0 1.2 -0.40 -1.91 173 0.1082 -4.3 -2.1 1.2 1.3 -2.5 -4.1 0.8 2.2 -3.6 -3.9 1.2 2.3 -3.6 1.5 -0.40 -1.91 210 0.1073 -4.8 -2.3 1.3 1.4 -2.8 -4.5 0.9 2.5 -3.9 -4.3 1.3 2.6 -4.0 1.6 -0.41 -1.90 233 0.1114 -5.2 -2.5 1.4 1.6 -3.0 -4.8 1.0 2.7 -4.1 -4.7 1.5 2.8 -4.3 1.8 -0.42 -1.85 247 0.1235 -5.3 -2.7 1.5 1.7 -3.2 -4.9 1.1 2.8 -4.4 -4.9 1.6 3.0 -4.5 1.9 -0.43 -1.83 259 0.1306 -5.7 -3.0 1.6 1.8 -3.2 -4.8 1.1 3.1 -4.6 -5.3 1.6 3.1 -4.6 2.0 -0.44 -1.78 269 0.1467 -5.9 -3.0 1.6 1.9 -3.4 -5.4 1.2 3.1 -4.7 -5.4 1.7 3.3 -4.9 2.1 -0.43 -1.81 283 0.1368 -6.1 -3.1 1.7 2.0 -3.5 -5.5 1.2 3.2 -5.0 -5.8 1.8 3.5 -5.0 2.2 -0.43 -1.80 293 0.1389 -6.4 -3.3 1.7 2.0 -3.7 -5.7 1.3 3.4 -5.1 -6.1 1.9 3.6 -5.2 2.2 -0.43 -1.81 305 0.135
10 -6.5 -3.4 1.8 2.1 -3.8 -5.8 1.3 3.5 -5.2 -6.2 1.9 3.7 -5.3 2.3 -0.44 -1.79 311 0.14211 -6.6 -3.4 1.9 2.1 -3.9 -5.8 1.3 3.6 -5.4 -6.4 2.0 3.8 -5.4 2.4 -0.44 -1.77 317 0.14912 -6.8 -3.6 1.9 2.2 -3.9 -6.0 1.4 3.7 -5.4 -6.6 2.1 3.9 -5.6 2.5 -0.44 -1.77 326 0.14913 -6.9 -3.7 1.9 2.2 -4.2 -6.4 1.4 3.7 -5.6 -6.8 2.1 4.0 -5.8 2.5 -0.43 -1.80 337 0.13814 -7.1 -3.7 2.0 2.3 -4.1 -6.4 1.4 3.8 -5.7 -6.9 2.2 4.2 -5.8 2.6 -0.44 -1.77 341 0.14915 -7.3 -3.8 2.0 2.4 -4.2 -6.5 1.5 3.9 -5.9 -7.1 2.2 4.3 -6.0 2.6 -0.44 -1.77 349 0.14716 -7.4 -3.8 2.1 2.4 -4.3 -6.8 1.5 4.0 -5.9 -7.0 2.3 4.4 -6.1 2.7 -0.44 -1.77 357 0.14817 -7.5 -3.9 2.1 2.4 -4.3 -6.7 1.5 4.0 -6.1 -7.3 2.3 4.4 -6.2 2.7 -0.44 -1.77 361 0.14818 -7.7 -4.1 2.1 2.5 -4.5 -6.8 1.6 4.1 -6.1 -7.6 2.3 4.5 -6.3 2.8 -0.44 -1.77 369 0.14919 -7.9 -4.2 2.2 2.5 -4.7 -6.9 1.6 4.2 -6.4 -7.9 2.4 4.6 -6.5 2.8 -0.43 -1.80 378 0.14020 -7.9 -4.1 2.2 2.6 -4.8 -7.1 1.6 4.2 -6.4 -7.9 2.4 4.7 -6.5 2.9 -0.44 -1.78 382 0.14721 -8.1 -4.5 2.2 2.7 -4.8 -7.1 1.6 4.3 -6.4 -7.9 2.5 4.8 -6.6 2.9 -0.44 -1.78 387 0.14622 -8.1 -4.3 2.3 2.7 -4.9 -7.2 1.7 4.4 -6.6 -8.1 2.5 4.9 -6.7 3.0 -0.44 -1.77 393 0.14923 -8.2 -4.3 2.3 2.8 -4.8 -7.3 1.7 4.4 -6.6 -8.2 2.5 4.9 -6.7 3.0 -0.45 -1.76 396 0.15424 -8.3 -4.3 2.3 2.8 -5.1 -7.5 1.7 4.5 -6.6 -8.1 2.6 5.0 -6.9 3.0 -0.44 -1.77 404 0.15025 -8.3 -4.5 2.4 2.8 -5.2 -7.9 1.7 4.4 -6.7 -8.4 2.6 5.1 -7.0 3.1 -0.44 -1.79 412 0.14226 -8.5 -4.6 2.4 2.9 -5.3 -7.7 1.7 4.5 -6.9 -8.5 2.6 5.2 -7.1 3.1 -0.44 -1.78 416 0.14427 -8.6 -4.6 2.4 2.9 -5.2 -7.9 1.8 4.6 -6.8 -8.6 2.7 5.2 -7.1 3.1 -0.44 -1.77 417 0.14928 -8.6 -4.6 2.5 2.9 -5.4 -7.8 1.8 4.7 -6.9 -8.7 2.7 5.3 -7.2 3.2 -0.45 -1.76 421 0.15429 -8.8 -4.6 2.5 3.0 -5.4 -8.0 1.8 4.7 -7.0 -8.8 2.8 5.4 -7.3 3.2 -0.45 -1.76 427 0.15330 -8.8 -4.6 2.5 3.0 -5.5 -8.0 1.8 4.8 -7.1 -8.9 2.8 5.4 -7.4 3.3 -0.45 -1.76 432 0.15331 -8.9 -4.8 2.6 3.1 -5.6 -8.1 1.9 4.8 -7.1 -8.9 2.8 5.5 -7.4 3.3 -0.45 -1.76 436 0.15432 -9.0 -4.6 2.6 3.1 -5.6 -8.2 1.9 4.9 -7.2 -9.1 2.8 5.6 -7.5 3.4 -0.45 -1.75 440 0.15533 -9.0 -4.8 2.6 3.2 -5.7 -8.3 1.9 4.9 -7.5 -9.4 2.9 5.6 -7.6 3.4 -0.44 -1.76 447 0.151
Mean
Normalized Vertical and Horizontal Deformation ArraysNU 58-40 Sample #11 NU 58-40 Sample #12 NU 58-40 Sample #9 Trimmed
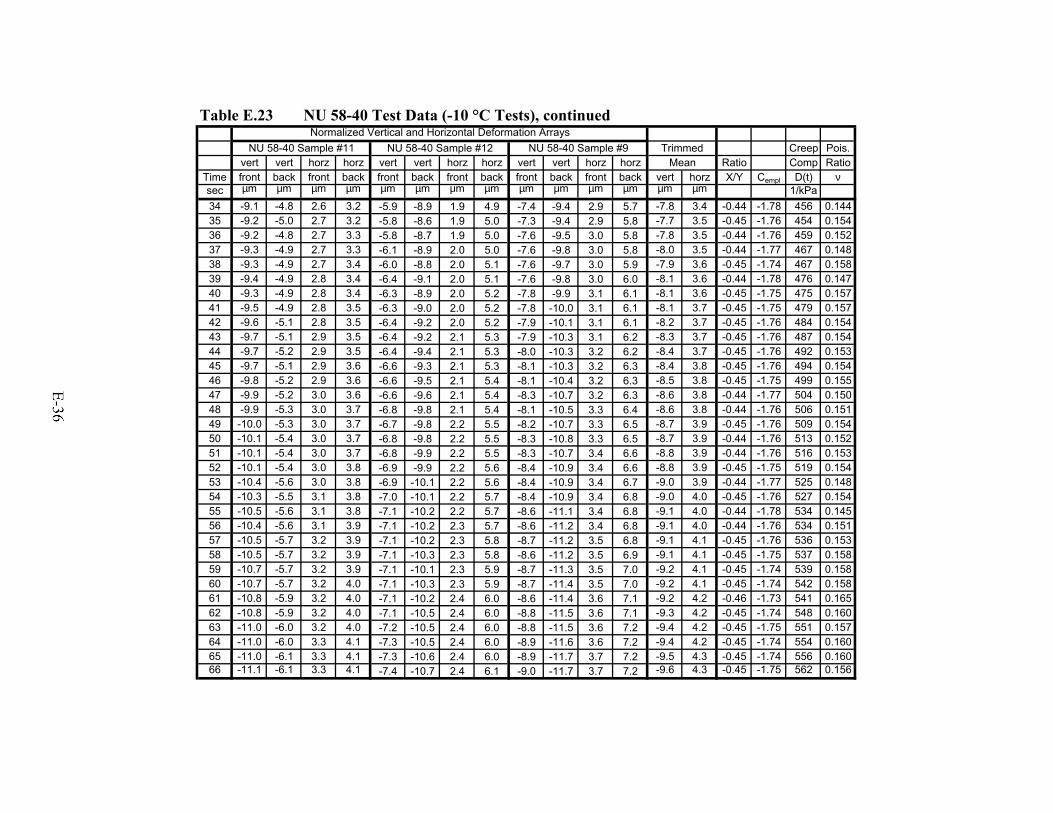
Table E.23 NU 58-40 Test Data (-10 °C Tests), continued
Creep Pois.vert vert horz horz vert vert horz horz vert vert horz horz Ratio Comp Ratio
Time front back front back front back front back front back front back vert horz X/Y Cempl D(t) νsec µm µm µm µm µm µm µm µm µm µm µm µm µm µm 1/kPa34 -9.1 -4.8 2.6 3.2 -5.9 -8.9 1.9 4.9 -7.4 -9.4 2.9 5.7 -7.8 3.4 -0.44 -1.78 456 0.14435 -9.2 -5.0 2.7 3.2 -5.8 -8.6 1.9 5.0 -7.3 -9.4 2.9 5.8 -7.7 3.5 -0.45 -1.76 454 0.15436 -9.2 -4.8 2.7 3.3 -5.8 -8.7 1.9 5.0 -7.6 -9.5 3.0 5.8 -7.8 3.5 -0.44 -1.76 459 0.15237 -9.3 -4.9 2.7 3.3 -6.1 -8.9 2.0 5.0 -7.6 -9.8 3.0 5.8 -8.0 3.5 -0.44 -1.77 467 0.14838 -9.3 -4.9 2.7 3.4 -6.0 -8.8 2.0 5.1 -7.6 -9.7 3.0 5.9 -7.9 3.6 -0.45 -1.74 467 0.15839 -9.4 -4.9 2.8 3.4 -6.4 -9.1 2.0 5.1 -7.6 -9.8 3.0 6.0 -8.1 3.6 -0.44 -1.78 476 0.14740 -9.3 -4.9 2.8 3.4 -6.3 -8.9 2.0 5.2 -7.8 -9.9 3.1 6.1 -8.1 3.6 -0.45 -1.75 475 0.15741 -9.5 -4.9 2.8 3.5 -6.3 -9.0 2.0 5.2 -7.8 -10.0 3.1 6.1 -8.1 3.7 -0.45 -1.75 479 0.15742 -9.6 -5.1 2.8 3.5 -6.4 -9.2 2.0 5.2 -7.9 -10.1 3.1 6.1 -8.2 3.7 -0.45 -1.76 484 0.15443 -9.7 -5.1 2.9 3.5 -6.4 -9.2 2.1 5.3 -7.9 -10.3 3.1 6.2 -8.3 3.7 -0.45 -1.76 487 0.15444 -9.7 -5.2 2.9 3.5 -6.4 -9.4 2.1 5.3 -8.0 -10.3 3.2 6.2 -8.4 3.7 -0.45 -1.76 492 0.15345 -9.7 -5.1 2.9 3.6 -6.6 -9.3 2.1 5.3 -8.1 -10.3 3.2 6.3 -8.4 3.8 -0.45 -1.76 494 0.15446 -9.8 -5.2 2.9 3.6 -6.6 -9.5 2.1 5.4 -8.1 -10.4 3.2 6.3 -8.5 3.8 -0.45 -1.75 499 0.15547 -9.9 -5.2 3.0 3.6 -6.6 -9.6 2.1 5.4 -8.3 -10.7 3.2 6.3 -8.6 3.8 -0.44 -1.77 504 0.15048 -9.9 -5.3 3.0 3.7 -6.8 -9.8 2.1 5.4 -8.1 -10.5 3.3 6.4 -8.6 3.8 -0.44 -1.76 506 0.15149 -10.0 -5.3 3.0 3.7 -6.7 -9.8 2.2 5.5 -8.2 -10.7 3.3 6.5 -8.7 3.9 -0.45 -1.76 509 0.15450 -10.1 -5.4 3.0 3.7 -6.8 -9.8 2.2 5.5 -8.3 -10.8 3.3 6.5 -8.7 3.9 -0.44 -1.76 513 0.15251 -10.1 -5.4 3.0 3.7 -6.8 -9.9 2.2 5.5 -8.3 -10.7 3.4 6.6 -8.8 3.9 -0.44 -1.76 516 0.15352 -10.1 -5.4 3.0 3.8 -6.9 -9.9 2.2 5.6 -8.4 -10.9 3.4 6.6 -8.8 3.9 -0.45 -1.75 519 0.15453 -10.4 -5.6 3.0 3.8 -6.9 -10.1 2.2 5.6 -8.4 -10.9 3.4 6.7 -9.0 3.9 -0.44 -1.77 525 0.14854 -10.3 -5.5 3.1 3.8 -7.0 -10.1 2.2 5.7 -8.4 -10.9 3.4 6.8 -9.0 4.0 -0.45 -1.76 527 0.15455 -10.5 -5.6 3.1 3.8 -7.1 -10.2 2.2 5.7 -8.6 -11.1 3.4 6.8 -9.1 4.0 -0.44 -1.78 534 0.14556 -10.4 -5.6 3.1 3.9 -7.1 -10.2 2.3 5.7 -8.6 -11.2 3.4 6.8 -9.1 4.0 -0.44 -1.76 534 0.15157 -10.5 -5.7 3.2 3.9 -7.1 -10.2 2.3 5.8 -8.7 -11.2 3.5 6.8 -9.1 4.1 -0.45 -1.76 536 0.15358 -10.5 -5.7 3.2 3.9 -7.1 -10.3 2.3 5.8 -8.6 -11.2 3.5 6.9 -9.1 4.1 -0.45 -1.75 537 0.15859 -10.7 -5.7 3.2 3.9 -7.1 -10.1 2.3 5.9 -8.7 -11.3 3.5 7.0 -9.2 4.1 -0.45 -1.74 539 0.15860 -10.7 -5.7 3.2 4.0 -7.1 -10.3 2.3 5.9 -8.7 -11.4 3.5 7.0 -9.2 4.1 -0.45 -1.74 542 0.15861 -10.8 -5.9 3.2 4.0 -7.1 -10.2 2.4 6.0 -8.6 -11.4 3.6 7.1 -9.2 4.2 -0.46 -1.73 541 0.16562 -10.8 -5.9 3.2 4.0 -7.1 -10.5 2.4 6.0 -8.8 -11.5 3.6 7.1 -9.3 4.2 -0.45 -1.74 548 0.16063 -11.0 -6.0 3.2 4.0 -7.2 -10.5 2.4 6.0 -8.8 -11.5 3.6 7.2 -9.4 4.2 -0.45 -1.75 551 0.15764 -11.0 -6.0 3.3 4.1 -7.3 -10.5 2.4 6.0 -8.9 -11.6 3.6 7.2 -9.4 4.2 -0.45 -1.74 554 0.16065 -11.0 -6.1 3.3 4.1 -7.3 -10.6 2.4 6.0 -8.9 -11.7 3.7 7.2 -9.5 4.3 -0.45 -1.74 556 0.16066 -11.1 -6.1 3.3 4.1 -7.4 -10.7 2.4 6.1 -9.0 -11.7 3.7 7.2 -9.6 4.3 -0.45 -1.75 562 0.156
Mean
Normalized Vertical and Horizontal Deformation ArraysNU 58-40 Sample #11 NU 58-40 Sample #12 NU 58-40 Sample #9 Trimmed
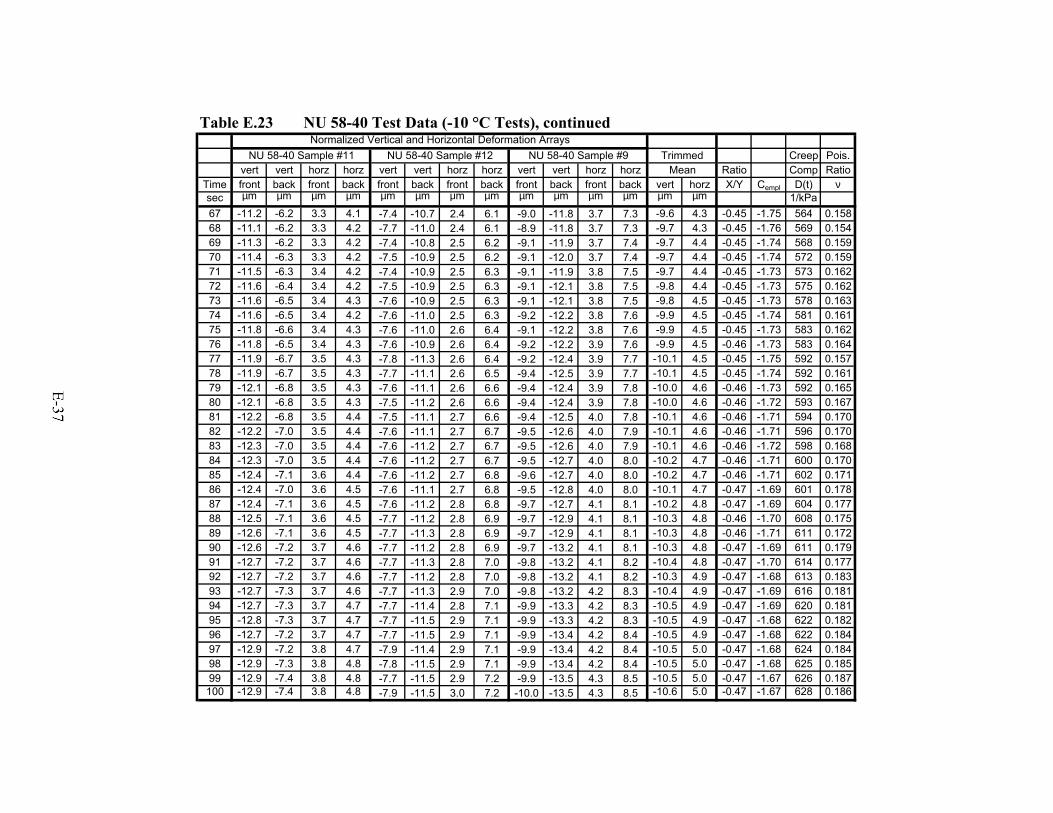
Table E.23 NU 58-40 Test Data (-10 °C Tests), continued
Creep Pois.vert vert horz horz vert vert horz horz vert vert horz horz Ratio Comp Ratio
Time front back front back front back front back front back front back vert horz X/Y Cempl D(t) νsec µm µm µm µm µm µm µm µm µm µm µm µm µm µm 1/kPa67 -11.2 -6.2 3.3 4.1 -7.4 -10.7 2.4 6.1 -9.0 -11.8 3.7 7.3 -9.6 4.3 -0.45 -1.75 564 0.15868 -11.1 -6.2 3.3 4.2 -7.7 -11.0 2.4 6.1 -8.9 -11.8 3.7 7.3 -9.7 4.3 -0.45 -1.76 569 0.15469 -11.3 -6.2 3.3 4.2 -7.4 -10.8 2.5 6.2 -9.1 -11.9 3.7 7.4 -9.7 4.4 -0.45 -1.74 568 0.15970 -11.4 -6.3 3.3 4.2 -7.5 -10.9 2.5 6.2 -9.1 -12.0 3.7 7.4 -9.7 4.4 -0.45 -1.74 572 0.15971 -11.5 -6.3 3.4 4.2 -7.4 -10.9 2.5 6.3 -9.1 -11.9 3.8 7.5 -9.7 4.4 -0.45 -1.73 573 0.16272 -11.6 -6.4 3.4 4.2 -7.5 -10.9 2.5 6.3 -9.1 -12.1 3.8 7.5 -9.8 4.4 -0.45 -1.73 575 0.16273 -11.6 -6.5 3.4 4.3 -7.6 -10.9 2.5 6.3 -9.1 -12.1 3.8 7.5 -9.8 4.5 -0.45 -1.73 578 0.16374 -11.6 -6.5 3.4 4.2 -7.6 -11.0 2.5 6.3 -9.2 -12.2 3.8 7.6 -9.9 4.5 -0.45 -1.74 581 0.16175 -11.8 -6.6 3.4 4.3 -7.6 -11.0 2.6 6.4 -9.1 -12.2 3.8 7.6 -9.9 4.5 -0.45 -1.73 583 0.16276 -11.8 -6.5 3.4 4.3 -7.6 -10.9 2.6 6.4 -9.2 -12.2 3.9 7.6 -9.9 4.5 -0.46 -1.73 583 0.16477 -11.9 -6.7 3.5 4.3 -7.8 -11.3 2.6 6.4 -9.2 -12.4 3.9 7.7 -10.1 4.5 -0.45 -1.75 592 0.15778 -11.9 -6.7 3.5 4.3 -7.7 -11.1 2.6 6.5 -9.4 -12.5 3.9 7.7 -10.1 4.5 -0.45 -1.74 592 0.16179 -12.1 -6.8 3.5 4.3 -7.6 -11.1 2.6 6.6 -9.4 -12.4 3.9 7.8 -10.0 4.6 -0.46 -1.73 592 0.16580 -12.1 -6.8 3.5 4.3 -7.5 -11.2 2.6 6.6 -9.4 -12.4 3.9 7.8 -10.0 4.6 -0.46 -1.72 593 0.16781 -12.2 -6.8 3.5 4.4 -7.5 -11.1 2.7 6.6 -9.4 -12.5 4.0 7.8 -10.1 4.6 -0.46 -1.71 594 0.17082 -12.2 -7.0 3.5 4.4 -7.6 -11.1 2.7 6.7 -9.5 -12.6 4.0 7.9 -10.1 4.6 -0.46 -1.71 596 0.17083 -12.3 -7.0 3.5 4.4 -7.6 -11.2 2.7 6.7 -9.5 -12.6 4.0 7.9 -10.1 4.6 -0.46 -1.72 598 0.16884 -12.3 -7.0 3.5 4.4 -7.6 -11.2 2.7 6.7 -9.5 -12.7 4.0 8.0 -10.2 4.7 -0.46 -1.71 600 0.17085 -12.4 -7.1 3.6 4.4 -7.6 -11.2 2.7 6.8 -9.6 -12.7 4.0 8.0 -10.2 4.7 -0.46 -1.71 602 0.17186 -12.4 -7.0 3.6 4.5 -7.6 -11.1 2.7 6.8 -9.5 -12.8 4.0 8.0 -10.1 4.7 -0.47 -1.69 601 0.17887 -12.4 -7.1 3.6 4.5 -7.6 -11.2 2.8 6.8 -9.7 -12.7 4.1 8.1 -10.2 4.8 -0.47 -1.69 604 0.17788 -12.5 -7.1 3.6 4.5 -7.7 -11.2 2.8 6.9 -9.7 -12.9 4.1 8.1 -10.3 4.8 -0.46 -1.70 608 0.17589 -12.6 -7.1 3.6 4.5 -7.7 -11.3 2.8 6.9 -9.7 -12.9 4.1 8.1 -10.3 4.8 -0.46 -1.71 611 0.17290 -12.6 -7.2 3.7 4.6 -7.7 -11.2 2.8 6.9 -9.7 -13.2 4.1 8.1 -10.3 4.8 -0.47 -1.69 611 0.17991 -12.7 -7.2 3.7 4.6 -7.7 -11.3 2.8 7.0 -9.8 -13.2 4.1 8.2 -10.4 4.8 -0.47 -1.70 614 0.17792 -12.7 -7.2 3.7 4.6 -7.7 -11.2 2.8 7.0 -9.8 -13.2 4.1 8.2 -10.3 4.9 -0.47 -1.68 613 0.18393 -12.7 -7.3 3.7 4.6 -7.7 -11.3 2.9 7.0 -9.8 -13.2 4.2 8.3 -10.4 4.9 -0.47 -1.69 616 0.18194 -12.7 -7.3 3.7 4.7 -7.7 -11.4 2.8 7.1 -9.9 -13.3 4.2 8.3 -10.5 4.9 -0.47 -1.69 620 0.18195 -12.8 -7.3 3.7 4.7 -7.7 -11.5 2.9 7.1 -9.9 -13.3 4.2 8.3 -10.5 4.9 -0.47 -1.68 622 0.18296 -12.7 -7.2 3.7 4.7 -7.7 -11.5 2.9 7.1 -9.9 -13.4 4.2 8.4 -10.5 4.9 -0.47 -1.68 622 0.18497 -12.9 -7.2 3.8 4.7 -7.9 -11.4 2.9 7.1 -9.9 -13.4 4.2 8.4 -10.5 5.0 -0.47 -1.68 624 0.18498 -12.9 -7.3 3.8 4.8 -7.8 -11.5 2.9 7.1 -9.9 -13.4 4.2 8.4 -10.5 5.0 -0.47 -1.68 625 0.18599 -12.9 -7.4 3.8 4.8 -7.7 -11.5 2.9 7.2 -9.9 -13.5 4.3 8.5 -10.5 5.0 -0.47 -1.67 626 0.187100 -12.9 -7.4 3.8 4.8 -7.9 -11.5 3.0 7.2 -10.0 -13.5 4.3 8.5 -10.6 5.0 -0.47 -1.67 628 0.186
Mean
Normalized Vertical and Horizontal Deformation ArraysNU 58-40 Sample #11 NU 58-40 Sample #12 NU 58-40 Sample #9 Trimmed
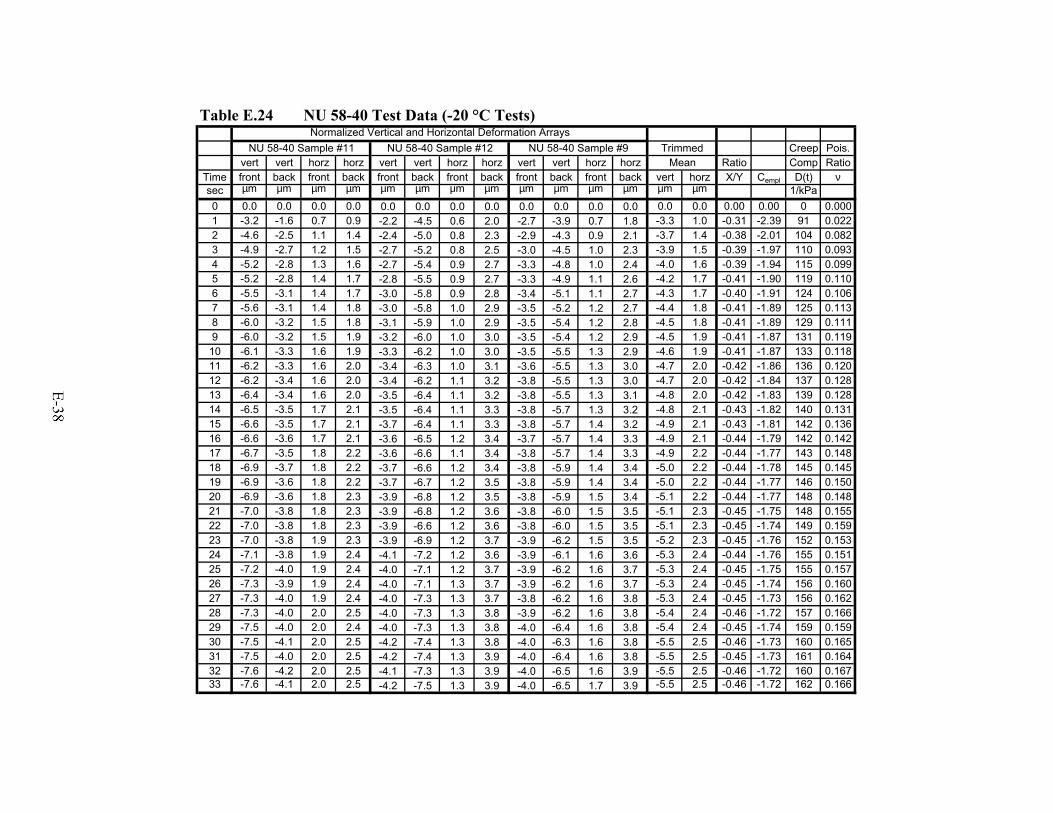
Table E.24 NU 58-40 Test Data (-20 °C Tests)
Creep Pois.vert vert horz horz vert vert horz horz vert vert horz horz Ratio Comp Ratio
Time front back front back front back front back front back front back vert horz X/Y Cempl D(t) νsec µm µm µm µm µm µm µm µm µm µm µm µm µm µm 1/kPa0 0.0 0.0 0.0 0.0 0.0 0.0 0.0 0.0 0.0 0.0 0.0 0.0 0.0 0.0 0.00 0.00 0 0.0001 -3.2 -1.6 0.7 0.9 -2.2 -4.5 0.6 2.0 -2.7 -3.9 0.7 1.8 -3.3 1.0 -0.31 -2.39 91 0.0222 -4.6 -2.5 1.1 1.4 -2.4 -5.0 0.8 2.3 -2.9 -4.3 0.9 2.1 -3.7 1.4 -0.38 -2.01 104 0.0823 -4.9 -2.7 1.2 1.5 -2.7 -5.2 0.8 2.5 -3.0 -4.5 1.0 2.3 -3.9 1.5 -0.39 -1.97 110 0.0934 -5.2 -2.8 1.3 1.6 -2.7 -5.4 0.9 2.7 -3.3 -4.8 1.0 2.4 -4.0 1.6 -0.39 -1.94 115 0.0995 -5.2 -2.8 1.4 1.7 -2.8 -5.5 0.9 2.7 -3.3 -4.9 1.1 2.6 -4.2 1.7 -0.41 -1.90 119 0.1106 -5.5 -3.1 1.4 1.7 -3.0 -5.8 0.9 2.8 -3.4 -5.1 1.1 2.7 -4.3 1.7 -0.40 -1.91 124 0.1067 -5.6 -3.1 1.4 1.8 -3.0 -5.8 1.0 2.9 -3.5 -5.2 1.2 2.7 -4.4 1.8 -0.41 -1.89 125 0.1138 -6.0 -3.2 1.5 1.8 -3.1 -5.9 1.0 2.9 -3.5 -5.4 1.2 2.8 -4.5 1.8 -0.41 -1.89 129 0.1119 -6.0 -3.2 1.5 1.9 -3.2 -6.0 1.0 3.0 -3.5 -5.4 1.2 2.9 -4.5 1.9 -0.41 -1.87 131 0.119
10 -6.1 -3.3 1.6 1.9 -3.3 -6.2 1.0 3.0 -3.5 -5.5 1.3 2.9 -4.6 1.9 -0.41 -1.87 133 0.11811 -6.2 -3.3 1.6 2.0 -3.4 -6.3 1.0 3.1 -3.6 -5.5 1.3 3.0 -4.7 2.0 -0.42 -1.86 136 0.12012 -6.2 -3.4 1.6 2.0 -3.4 -6.2 1.1 3.2 -3.8 -5.5 1.3 3.0 -4.7 2.0 -0.42 -1.84 137 0.12813 -6.4 -3.4 1.6 2.0 -3.5 -6.4 1.1 3.2 -3.8 -5.5 1.3 3.1 -4.8 2.0 -0.42 -1.83 139 0.12814 -6.5 -3.5 1.7 2.1 -3.5 -6.4 1.1 3.3 -3.8 -5.7 1.3 3.2 -4.8 2.1 -0.43 -1.82 140 0.13115 -6.6 -3.5 1.7 2.1 -3.7 -6.4 1.1 3.3 -3.8 -5.7 1.4 3.2 -4.9 2.1 -0.43 -1.81 142 0.13616 -6.6 -3.6 1.7 2.1 -3.6 -6.5 1.2 3.4 -3.7 -5.7 1.4 3.3 -4.9 2.1 -0.44 -1.79 142 0.14217 -6.7 -3.5 1.8 2.2 -3.6 -6.6 1.1 3.4 -3.8 -5.7 1.4 3.3 -4.9 2.2 -0.44 -1.77 143 0.14818 -6.9 -3.7 1.8 2.2 -3.7 -6.6 1.2 3.4 -3.8 -5.9 1.4 3.4 -5.0 2.2 -0.44 -1.78 145 0.14519 -6.9 -3.6 1.8 2.2 -3.7 -6.7 1.2 3.5 -3.8 -5.9 1.4 3.4 -5.0 2.2 -0.44 -1.77 146 0.15020 -6.9 -3.6 1.8 2.3 -3.9 -6.8 1.2 3.5 -3.8 -5.9 1.5 3.4 -5.1 2.2 -0.44 -1.77 148 0.14821 -7.0 -3.8 1.8 2.3 -3.9 -6.8 1.2 3.6 -3.8 -6.0 1.5 3.5 -5.1 2.3 -0.45 -1.75 148 0.15522 -7.0 -3.8 1.8 2.3 -3.9 -6.6 1.2 3.6 -3.8 -6.0 1.5 3.5 -5.1 2.3 -0.45 -1.74 149 0.15923 -7.0 -3.8 1.9 2.3 -3.9 -6.9 1.2 3.7 -3.9 -6.2 1.5 3.5 -5.2 2.3 -0.45 -1.76 152 0.15324 -7.1 -3.8 1.9 2.4 -4.1 -7.2 1.2 3.6 -3.9 -6.1 1.6 3.6 -5.3 2.4 -0.44 -1.76 155 0.15125 -7.2 -4.0 1.9 2.4 -4.0 -7.1 1.2 3.7 -3.9 -6.2 1.6 3.7 -5.3 2.4 -0.45 -1.75 155 0.15726 -7.3 -3.9 1.9 2.4 -4.0 -7.1 1.3 3.7 -3.9 -6.2 1.6 3.7 -5.3 2.4 -0.45 -1.74 156 0.16027 -7.3 -4.0 1.9 2.4 -4.0 -7.3 1.3 3.7 -3.8 -6.2 1.6 3.8 -5.3 2.4 -0.45 -1.73 156 0.16228 -7.3 -4.0 2.0 2.5 -4.0 -7.3 1.3 3.8 -3.9 -6.2 1.6 3.8 -5.4 2.4 -0.46 -1.72 157 0.16629 -7.5 -4.0 2.0 2.4 -4.0 -7.3 1.3 3.8 -4.0 -6.4 1.6 3.8 -5.4 2.4 -0.45 -1.74 159 0.15930 -7.5 -4.1 2.0 2.5 -4.2 -7.4 1.3 3.8 -4.0 -6.3 1.6 3.8 -5.5 2.5 -0.46 -1.73 160 0.16531 -7.5 -4.0 2.0 2.5 -4.2 -7.4 1.3 3.9 -4.0 -6.4 1.6 3.8 -5.5 2.5 -0.45 -1.73 161 0.16432 -7.6 -4.2 2.0 2.5 -4.1 -7.3 1.3 3.9 -4.0 -6.5 1.6 3.9 -5.5 2.5 -0.46 -1.72 160 0.16733 -7.6 -4.1 2.0 2.5 -4.2 -7.5 1.3 3.9 -4.0 -6.5 1.7 3.9 -5.5 2.5 -0.46 -1.72 162 0.166
Mean
Normalized Vertical and Horizontal Deformation ArraysNU 58-40 Sample #11 NU 58-40 Sample #12 NU 58-40 Sample #9 Trimmed
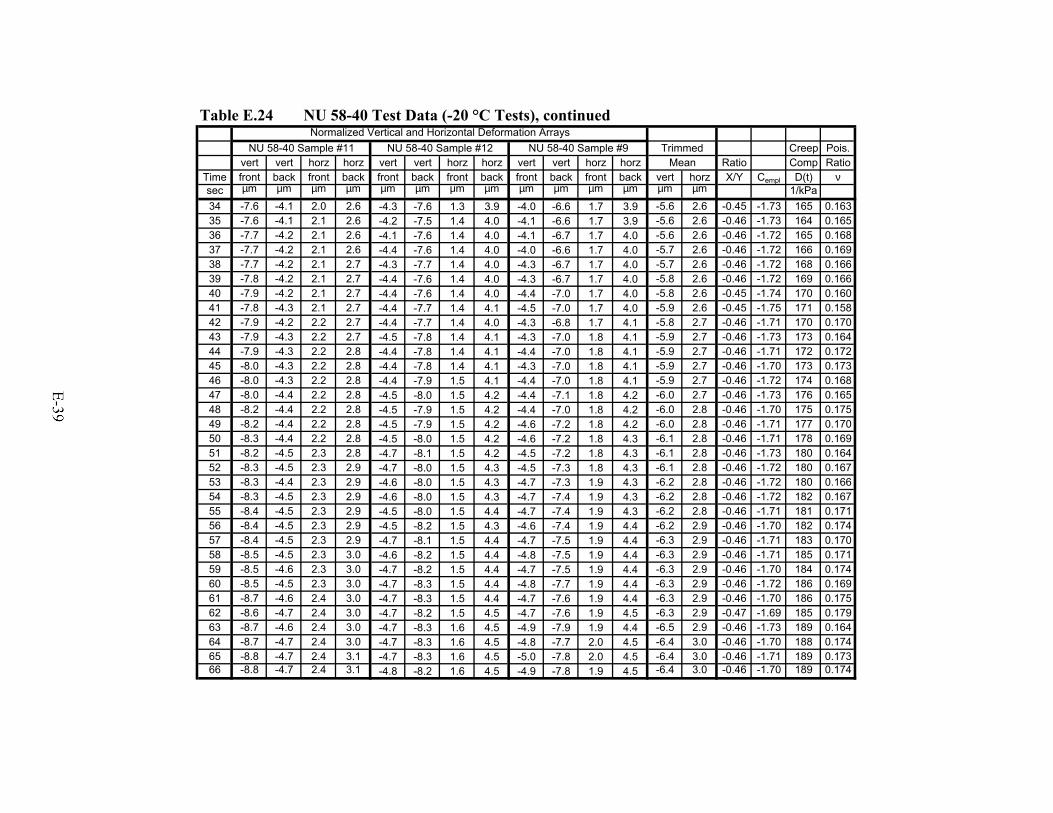
Table E.24 NU 58-40 Test Data (-20 °C Tests), continued
Creep Pois.vert vert horz horz vert vert horz horz vert vert horz horz Ratio Comp Ratio
Time front back front back front back front back front back front back vert horz X/Y Cempl D(t) νsec µm µm µm µm µm µm µm µm µm µm µm µm µm µm 1/kPa34 -7.6 -4.1 2.0 2.6 -4.3 -7.6 1.3 3.9 -4.0 -6.6 1.7 3.9 -5.6 2.6 -0.45 -1.73 165 0.16335 -7.6 -4.1 2.1 2.6 -4.2 -7.5 1.4 4.0 -4.1 -6.6 1.7 3.9 -5.6 2.6 -0.46 -1.73 164 0.16536 -7.7 -4.2 2.1 2.6 -4.1 -7.6 1.4 4.0 -4.1 -6.7 1.7 4.0 -5.6 2.6 -0.46 -1.72 165 0.16837 -7.7 -4.2 2.1 2.6 -4.4 -7.6 1.4 4.0 -4.0 -6.6 1.7 4.0 -5.7 2.6 -0.46 -1.72 166 0.16938 -7.7 -4.2 2.1 2.7 -4.3 -7.7 1.4 4.0 -4.3 -6.7 1.7 4.0 -5.7 2.6 -0.46 -1.72 168 0.16639 -7.8 -4.2 2.1 2.7 -4.4 -7.6 1.4 4.0 -4.3 -6.7 1.7 4.0 -5.8 2.6 -0.46 -1.72 169 0.16640 -7.9 -4.2 2.1 2.7 -4.4 -7.6 1.4 4.0 -4.4 -7.0 1.7 4.0 -5.8 2.6 -0.45 -1.74 170 0.16041 -7.8 -4.3 2.1 2.7 -4.4 -7.7 1.4 4.1 -4.5 -7.0 1.7 4.0 -5.9 2.6 -0.45 -1.75 171 0.15842 -7.9 -4.2 2.2 2.7 -4.4 -7.7 1.4 4.0 -4.3 -6.8 1.7 4.1 -5.8 2.7 -0.46 -1.71 170 0.17043 -7.9 -4.3 2.2 2.7 -4.5 -7.8 1.4 4.1 -4.3 -7.0 1.8 4.1 -5.9 2.7 -0.46 -1.73 173 0.16444 -7.9 -4.3 2.2 2.8 -4.4 -7.8 1.4 4.1 -4.4 -7.0 1.8 4.1 -5.9 2.7 -0.46 -1.71 172 0.17245 -8.0 -4.3 2.2 2.8 -4.4 -7.8 1.4 4.1 -4.3 -7.0 1.8 4.1 -5.9 2.7 -0.46 -1.70 173 0.17346 -8.0 -4.3 2.2 2.8 -4.4 -7.9 1.5 4.1 -4.4 -7.0 1.8 4.1 -5.9 2.7 -0.46 -1.72 174 0.16847 -8.0 -4.4 2.2 2.8 -4.5 -8.0 1.5 4.2 -4.4 -7.1 1.8 4.2 -6.0 2.7 -0.46 -1.73 176 0.16548 -8.2 -4.4 2.2 2.8 -4.5 -7.9 1.5 4.2 -4.4 -7.0 1.8 4.2 -6.0 2.8 -0.46 -1.70 175 0.17549 -8.2 -4.4 2.2 2.8 -4.5 -7.9 1.5 4.2 -4.6 -7.2 1.8 4.2 -6.0 2.8 -0.46 -1.71 177 0.17050 -8.3 -4.4 2.2 2.8 -4.5 -8.0 1.5 4.2 -4.6 -7.2 1.8 4.3 -6.1 2.8 -0.46 -1.71 178 0.16951 -8.2 -4.5 2.3 2.8 -4.7 -8.1 1.5 4.2 -4.5 -7.2 1.8 4.3 -6.1 2.8 -0.46 -1.73 180 0.16452 -8.3 -4.5 2.3 2.9 -4.7 -8.0 1.5 4.3 -4.5 -7.3 1.8 4.3 -6.1 2.8 -0.46 -1.72 180 0.16753 -8.3 -4.4 2.3 2.9 -4.6 -8.0 1.5 4.3 -4.7 -7.3 1.9 4.3 -6.2 2.8 -0.46 -1.72 180 0.16654 -8.3 -4.5 2.3 2.9 -4.6 -8.0 1.5 4.3 -4.7 -7.4 1.9 4.3 -6.2 2.8 -0.46 -1.72 182 0.16755 -8.4 -4.5 2.3 2.9 -4.5 -8.0 1.5 4.4 -4.7 -7.4 1.9 4.3 -6.2 2.8 -0.46 -1.71 181 0.17156 -8.4 -4.5 2.3 2.9 -4.5 -8.2 1.5 4.3 -4.6 -7.4 1.9 4.4 -6.2 2.9 -0.46 -1.70 182 0.17457 -8.4 -4.5 2.3 2.9 -4.7 -8.1 1.5 4.4 -4.7 -7.5 1.9 4.4 -6.3 2.9 -0.46 -1.71 183 0.17058 -8.5 -4.5 2.3 3.0 -4.6 -8.2 1.5 4.4 -4.8 -7.5 1.9 4.4 -6.3 2.9 -0.46 -1.71 185 0.17159 -8.5 -4.6 2.3 3.0 -4.7 -8.2 1.5 4.4 -4.7 -7.5 1.9 4.4 -6.3 2.9 -0.46 -1.70 184 0.17460 -8.5 -4.5 2.3 3.0 -4.7 -8.3 1.5 4.4 -4.8 -7.7 1.9 4.4 -6.3 2.9 -0.46 -1.72 186 0.16961 -8.7 -4.6 2.4 3.0 -4.7 -8.3 1.5 4.4 -4.7 -7.6 1.9 4.4 -6.3 2.9 -0.46 -1.70 186 0.17562 -8.6 -4.7 2.4 3.0 -4.7 -8.2 1.5 4.5 -4.7 -7.6 1.9 4.5 -6.3 2.9 -0.47 -1.69 185 0.17963 -8.7 -4.6 2.4 3.0 -4.7 -8.3 1.6 4.5 -4.9 -7.9 1.9 4.4 -6.5 2.9 -0.46 -1.73 189 0.16464 -8.7 -4.7 2.4 3.0 -4.7 -8.3 1.6 4.5 -4.8 -7.7 2.0 4.5 -6.4 3.0 -0.46 -1.70 188 0.17465 -8.8 -4.7 2.4 3.1 -4.7 -8.3 1.6 4.5 -5.0 -7.8 2.0 4.5 -6.4 3.0 -0.46 -1.71 189 0.17366 -8.8 -4.7 2.4 3.1 -4.8 -8.2 1.6 4.5 -4.9 -7.8 1.9 4.5 -6.4 3.0 -0.46 -1.70 189 0.174
Mean
Normalized Vertical and Horizontal Deformation ArraysNU 58-40 Sample #11 NU 58-40 Sample #12 NU 58-40 Sample #9 Trimmed
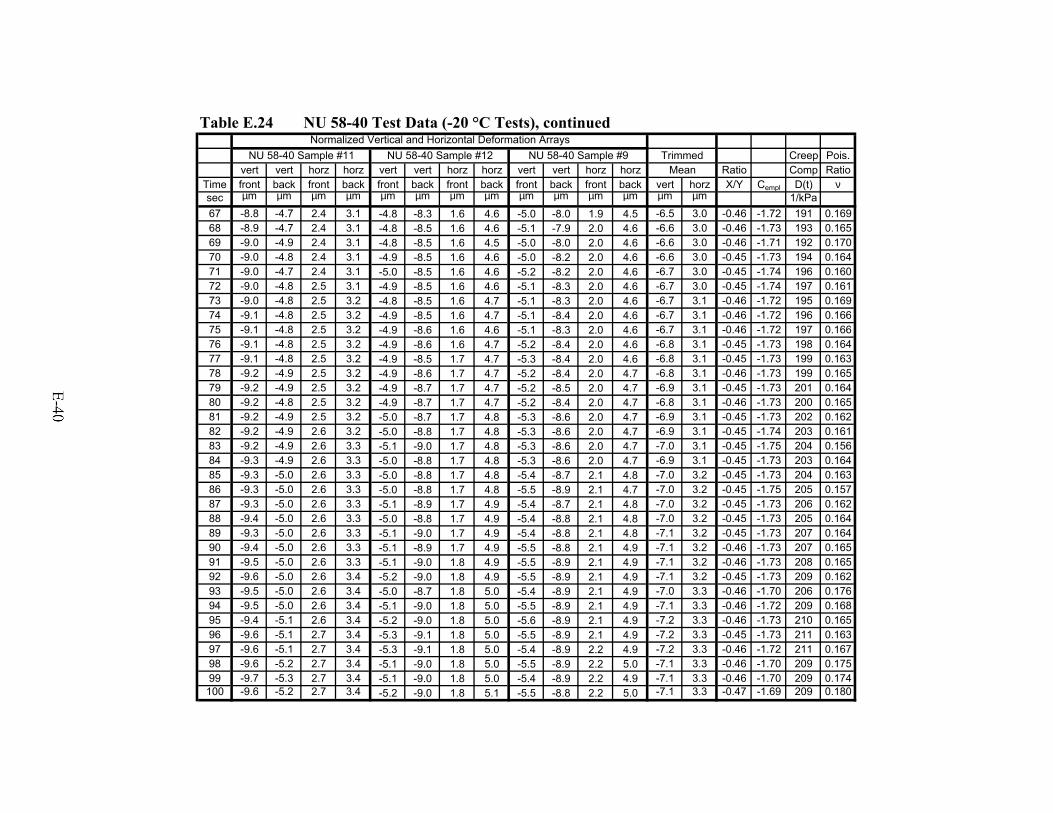
Table E.24 NU 58-40 Test Data (-20 °C Tests), continued
Creep Pois.vert vert horz horz vert vert horz horz vert vert horz horz Ratio Comp Ratio
Time front back front back front back front back front back front back vert horz X/Y Cempl D(t) νsec µm µm µm µm µm µm µm µm µm µm µm µm µm µm 1/kPa67 -8.8 -4.7 2.4 3.1 -4.8 -8.3 1.6 4.6 -5.0 -8.0 1.9 4.5 -6.5 3.0 -0.46 -1.72 191 0.16968 -8.9 -4.7 2.4 3.1 -4.8 -8.5 1.6 4.6 -5.1 -7.9 2.0 4.6 -6.6 3.0 -0.46 -1.73 193 0.16569 -9.0 -4.9 2.4 3.1 -4.8 -8.5 1.6 4.5 -5.0 -8.0 2.0 4.6 -6.6 3.0 -0.46 -1.71 192 0.17070 -9.0 -4.8 2.4 3.1 -4.9 -8.5 1.6 4.6 -5.0 -8.2 2.0 4.6 -6.6 3.0 -0.45 -1.73 194 0.16471 -9.0 -4.7 2.4 3.1 -5.0 -8.5 1.6 4.6 -5.2 -8.2 2.0 4.6 -6.7 3.0 -0.45 -1.74 196 0.16072 -9.0 -4.8 2.5 3.1 -4.9 -8.5 1.6 4.6 -5.1 -8.3 2.0 4.6 -6.7 3.0 -0.45 -1.74 197 0.16173 -9.0 -4.8 2.5 3.2 -4.8 -8.5 1.6 4.7 -5.1 -8.3 2.0 4.6 -6.7 3.1 -0.46 -1.72 195 0.16974 -9.1 -4.8 2.5 3.2 -4.9 -8.5 1.6 4.7 -5.1 -8.4 2.0 4.6 -6.7 3.1 -0.46 -1.72 196 0.16675 -9.1 -4.8 2.5 3.2 -4.9 -8.6 1.6 4.6 -5.1 -8.3 2.0 4.6 -6.7 3.1 -0.46 -1.72 197 0.16676 -9.1 -4.8 2.5 3.2 -4.9 -8.6 1.6 4.7 -5.2 -8.4 2.0 4.6 -6.8 3.1 -0.45 -1.73 198 0.16477 -9.1 -4.8 2.5 3.2 -4.9 -8.5 1.7 4.7 -5.3 -8.4 2.0 4.6 -6.8 3.1 -0.45 -1.73 199 0.16378 -9.2 -4.9 2.5 3.2 -4.9 -8.6 1.7 4.7 -5.2 -8.4 2.0 4.7 -6.8 3.1 -0.46 -1.73 199 0.16579 -9.2 -4.9 2.5 3.2 -4.9 -8.7 1.7 4.7 -5.2 -8.5 2.0 4.7 -6.9 3.1 -0.45 -1.73 201 0.16480 -9.2 -4.8 2.5 3.2 -4.9 -8.7 1.7 4.7 -5.2 -8.4 2.0 4.7 -6.8 3.1 -0.46 -1.73 200 0.16581 -9.2 -4.9 2.5 3.2 -5.0 -8.7 1.7 4.8 -5.3 -8.6 2.0 4.7 -6.9 3.1 -0.45 -1.73 202 0.16282 -9.2 -4.9 2.6 3.2 -5.0 -8.8 1.7 4.8 -5.3 -8.6 2.0 4.7 -6.9 3.1 -0.45 -1.74 203 0.16183 -9.2 -4.9 2.6 3.3 -5.1 -9.0 1.7 4.8 -5.3 -8.6 2.0 4.7 -7.0 3.1 -0.45 -1.75 204 0.15684 -9.3 -4.9 2.6 3.3 -5.0 -8.8 1.7 4.8 -5.3 -8.6 2.0 4.7 -6.9 3.1 -0.45 -1.73 203 0.16485 -9.3 -5.0 2.6 3.3 -5.0 -8.8 1.7 4.8 -5.4 -8.7 2.1 4.8 -7.0 3.2 -0.45 -1.73 204 0.16386 -9.3 -5.0 2.6 3.3 -5.0 -8.8 1.7 4.8 -5.5 -8.9 2.1 4.7 -7.0 3.2 -0.45 -1.75 205 0.15787 -9.3 -5.0 2.6 3.3 -5.1 -8.9 1.7 4.9 -5.4 -8.7 2.1 4.8 -7.0 3.2 -0.45 -1.73 206 0.16288 -9.4 -5.0 2.6 3.3 -5.0 -8.8 1.7 4.9 -5.4 -8.8 2.1 4.8 -7.0 3.2 -0.45 -1.73 205 0.16489 -9.3 -5.0 2.6 3.3 -5.1 -9.0 1.7 4.9 -5.4 -8.8 2.1 4.8 -7.1 3.2 -0.45 -1.73 207 0.16490 -9.4 -5.0 2.6 3.3 -5.1 -8.9 1.7 4.9 -5.5 -8.8 2.1 4.9 -7.1 3.2 -0.46 -1.73 207 0.16591 -9.5 -5.0 2.6 3.3 -5.1 -9.0 1.8 4.9 -5.5 -8.9 2.1 4.9 -7.1 3.2 -0.46 -1.73 208 0.16592 -9.6 -5.0 2.6 3.4 -5.2 -9.0 1.8 4.9 -5.5 -8.9 2.1 4.9 -7.1 3.2 -0.45 -1.73 209 0.16293 -9.5 -5.0 2.6 3.4 -5.0 -8.7 1.8 5.0 -5.4 -8.9 2.1 4.9 -7.0 3.3 -0.46 -1.70 206 0.17694 -9.5 -5.0 2.6 3.4 -5.1 -9.0 1.8 5.0 -5.5 -8.9 2.1 4.9 -7.1 3.3 -0.46 -1.72 209 0.16895 -9.4 -5.1 2.6 3.4 -5.2 -9.0 1.8 5.0 -5.6 -8.9 2.1 4.9 -7.2 3.3 -0.46 -1.73 210 0.16596 -9.6 -5.1 2.7 3.4 -5.3 -9.1 1.8 5.0 -5.5 -8.9 2.1 4.9 -7.2 3.3 -0.45 -1.73 211 0.16397 -9.6 -5.1 2.7 3.4 -5.3 -9.1 1.8 5.0 -5.4 -8.9 2.2 4.9 -7.2 3.3 -0.46 -1.72 211 0.16798 -9.6 -5.2 2.7 3.4 -5.1 -9.0 1.8 5.0 -5.5 -8.9 2.2 5.0 -7.1 3.3 -0.46 -1.70 209 0.17599 -9.7 -5.3 2.7 3.4 -5.1 -9.0 1.8 5.0 -5.4 -8.9 2.2 4.9 -7.1 3.3 -0.46 -1.70 209 0.174100 -9.6 -5.2 2.7 3.4 -5.2 -9.0 1.8 5.1 -5.5 -8.8 2.2 5.0 -7.1 3.3 -0.47 -1.69 209 0.180
Mean
Normalized Vertical and Horizontal Deformation ArraysNU 58-40 Sample #11 NU 58-40 Sample #12 NU 58-40 Sample #9 Trimmed
APPENDIX F IDT STRENGTH DATA
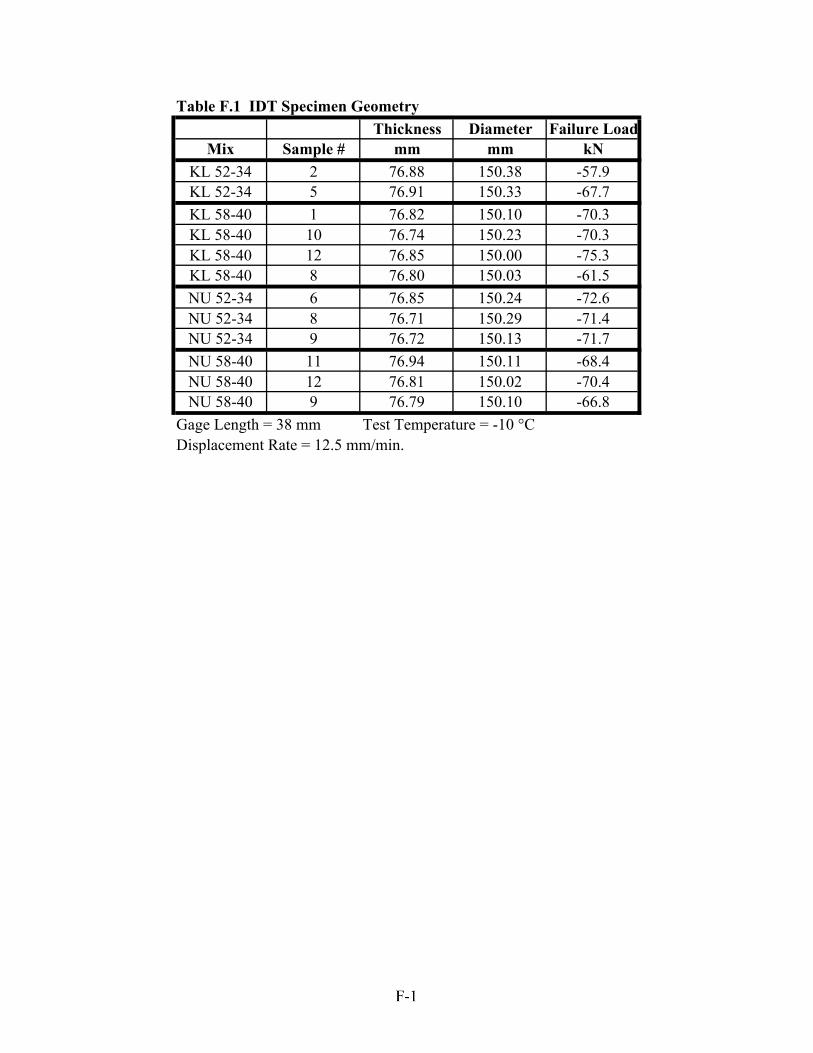
Table F.1 IDT Specimen GeometryThickness Diameter Failure Load
Mix Sample # mm mm kNKL 52-34 2 76.88 150.38 -57.9KL 52-34 5 76.91 150.33 -67.7KL 58-40 1 76.82 150.10 -70.3KL 58-40 10 76.74 150.23 -70.3KL 58-40 12 76.85 150.00 -75.3KL 58-40 8 76.80 150.03 -61.5NU 52-34 6 76.85 150.24 -72.6NU 52-34 8 76.71 150.29 -71.4NU 52-34 9 76.72 150.13 -71.7NU 58-40 11 76.94 150.11 -68.4NU 58-40 12 76.81 150.02 -70.4NU 58-40 9 76.79 150.10 -66.8
Gage Length = 38 mm Test Temperature = -10 °CDisplacement Rate = 12.5 mm/min.
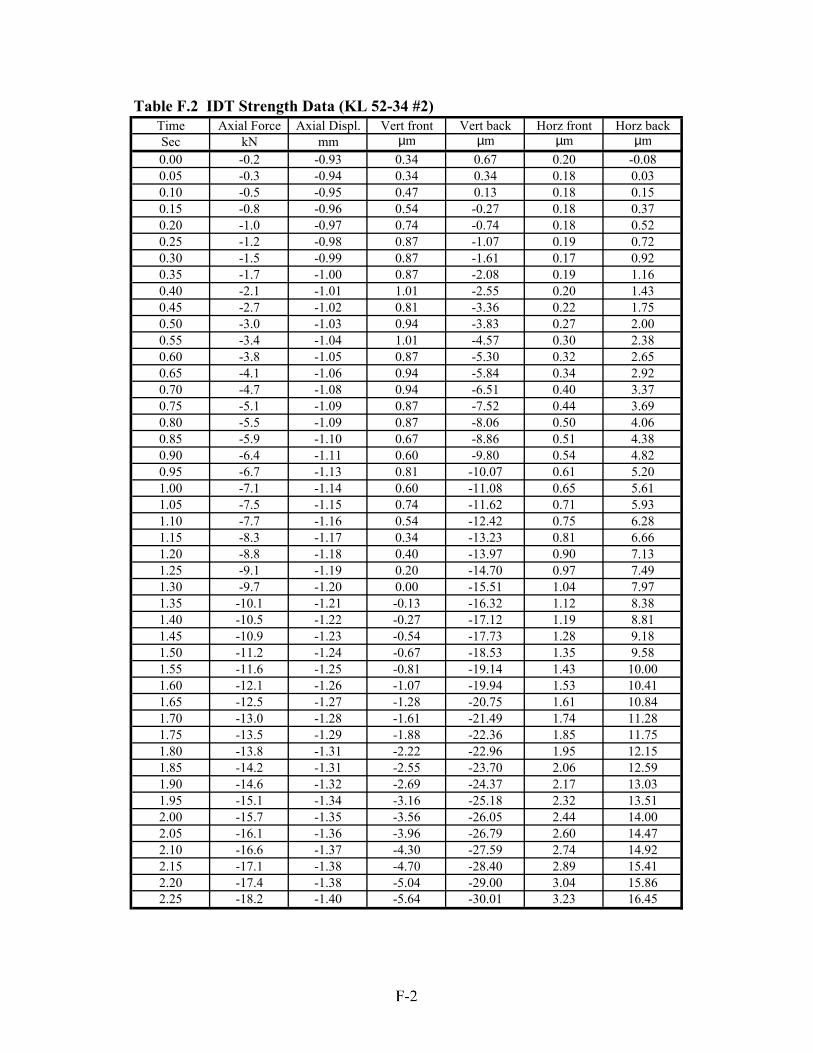
Time Axial Force Axial Displ. Vert front Vert back Horz front Horz backSec kN mm µm µm µm µm0.00 -0.2 -0.93 0.34 0.67 0.20 -0.080.05 -0.3 -0.94 0.34 0.34 0.18 0.030.10 -0.5 -0.95 0.47 0.13 0.18 0.150.15 -0.8 -0.96 0.54 -0.27 0.18 0.370.20 -1.0 -0.97 0.74 -0.74 0.18 0.520.25 -1.2 -0.98 0.87 -1.07 0.19 0.720.30 -1.5 -0.99 0.87 -1.61 0.17 0.920.35 -1.7 -1.00 0.87 -2.08 0.19 1.160.40 -2.1 -1.01 1.01 -2.55 0.20 1.430.45 -2.7 -1.02 0.81 -3.36 0.22 1.750.50 -3.0 -1.03 0.94 -3.83 0.27 2.000.55 -3.4 -1.04 1.01 -4.57 0.30 2.380.60 -3.8 -1.05 0.87 -5.30 0.32 2.650.65 -4.1 -1.06 0.94 -5.84 0.34 2.920.70 -4.7 -1.08 0.94 -6.51 0.40 3.370.75 -5.1 -1.09 0.87 -7.52 0.44 3.690.80 -5.5 -1.09 0.87 -8.06 0.50 4.060.85 -5.9 -1.10 0.67 -8.86 0.51 4.380.90 -6.4 -1.11 0.60 -9.80 0.54 4.820.95 -6.7 -1.13 0.81 -10.07 0.61 5.201.00 -7.1 -1.14 0.60 -11.08 0.65 5.611.05 -7.5 -1.15 0.74 -11.62 0.71 5.931.10 -7.7 -1.16 0.54 -12.42 0.75 6.281.15 -8.3 -1.17 0.34 -13.23 0.81 6.661.20 -8.8 -1.18 0.40 -13.97 0.90 7.131.25 -9.1 -1.19 0.20 -14.70 0.97 7.491.30 -9.7 -1.20 0.00 -15.51 1.04 7.971.35 -10.1 -1.21 -0.13 -16.32 1.12 8.381.40 -10.5 -1.22 -0.27 -17.12 1.19 8.811.45 -10.9 -1.23 -0.54 -17.73 1.28 9.181.50 -11.2 -1.24 -0.67 -18.53 1.35 9.581.55 -11.6 -1.25 -0.81 -19.14 1.43 10.001.60 -12.1 -1.26 -1.07 -19.94 1.53 10.411.65 -12.5 -1.27 -1.28 -20.75 1.61 10.841.70 -13.0 -1.28 -1.61 -21.49 1.74 11.281.75 -13.5 -1.29 -1.88 -22.36 1.85 11.751.80 -13.8 -1.31 -2.22 -22.96 1.95 12.151.85 -14.2 -1.31 -2.55 -23.70 2.06 12.591.90 -14.6 -1.32 -2.69 -24.37 2.17 13.031.95 -15.1 -1.34 -3.16 -25.18 2.32 13.512.00 -15.7 -1.35 -3.56 -26.05 2.44 14.002.05 -16.1 -1.36 -3.96 -26.79 2.60 14.472.10 -16.6 -1.37 -4.30 -27.59 2.74 14.922.15 -17.1 -1.38 -4.70 -28.40 2.89 15.412.20 -17.4 -1.38 -5.04 -29.00 3.04 15.862.25 -18.2 -1.40 -5.64 -30.01 3.23 16.45
Table F.2 IDT Strength Data (KL 52-34 #2)
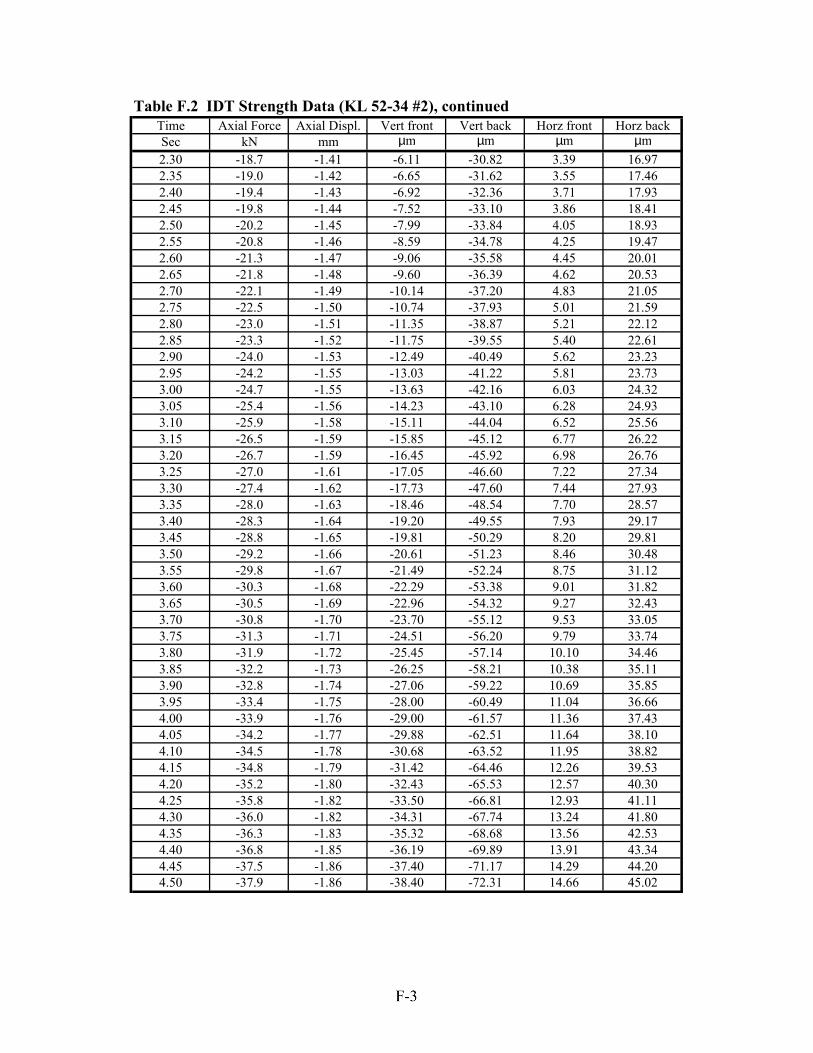
Time Axial Force Axial Displ. Vert front Vert back Horz front Horz backSec kN mm µm µm µm µm2.30 -18.7 -1.41 -6.11 -30.82 3.39 16.972.35 -19.0 -1.42 -6.65 -31.62 3.55 17.462.40 -19.4 -1.43 -6.92 -32.36 3.71 17.932.45 -19.8 -1.44 -7.52 -33.10 3.86 18.412.50 -20.2 -1.45 -7.99 -33.84 4.05 18.932.55 -20.8 -1.46 -8.59 -34.78 4.25 19.472.60 -21.3 -1.47 -9.06 -35.58 4.45 20.012.65 -21.8 -1.48 -9.60 -36.39 4.62 20.532.70 -22.1 -1.49 -10.14 -37.20 4.83 21.052.75 -22.5 -1.50 -10.74 -37.93 5.01 21.592.80 -23.0 -1.51 -11.35 -38.87 5.21 22.122.85 -23.3 -1.52 -11.75 -39.55 5.40 22.612.90 -24.0 -1.53 -12.49 -40.49 5.62 23.232.95 -24.2 -1.55 -13.03 -41.22 5.81 23.733.00 -24.7 -1.55 -13.63 -42.16 6.03 24.323.05 -25.4 -1.56 -14.23 -43.10 6.28 24.933.10 -25.9 -1.58 -15.11 -44.04 6.52 25.563.15 -26.5 -1.59 -15.85 -45.12 6.77 26.223.20 -26.7 -1.59 -16.45 -45.92 6.98 26.763.25 -27.0 -1.61 -17.05 -46.60 7.22 27.343.30 -27.4 -1.62 -17.73 -47.60 7.44 27.933.35 -28.0 -1.63 -18.46 -48.54 7.70 28.573.40 -28.3 -1.64 -19.20 -49.55 7.93 29.173.45 -28.8 -1.65 -19.81 -50.29 8.20 29.813.50 -29.2 -1.66 -20.61 -51.23 8.46 30.483.55 -29.8 -1.67 -21.49 -52.24 8.75 31.123.60 -30.3 -1.68 -22.29 -53.38 9.01 31.823.65 -30.5 -1.69 -22.96 -54.32 9.27 32.433.70 -30.8 -1.70 -23.70 -55.12 9.53 33.053.75 -31.3 -1.71 -24.51 -56.20 9.79 33.743.80 -31.9 -1.72 -25.45 -57.14 10.10 34.463.85 -32.2 -1.73 -26.25 -58.21 10.38 35.113.90 -32.8 -1.74 -27.06 -59.22 10.69 35.853.95 -33.4 -1.75 -28.00 -60.49 11.04 36.664.00 -33.9 -1.76 -29.00 -61.57 11.36 37.434.05 -34.2 -1.77 -29.88 -62.51 11.64 38.104.10 -34.5 -1.78 -30.68 -63.52 11.95 38.824.15 -34.8 -1.79 -31.42 -64.46 12.26 39.534.20 -35.2 -1.80 -32.43 -65.53 12.57 40.304.25 -35.8 -1.82 -33.50 -66.81 12.93 41.114.30 -36.0 -1.82 -34.31 -67.74 13.24 41.804.35 -36.3 -1.83 -35.32 -68.68 13.56 42.534.40 -36.8 -1.85 -36.19 -69.89 13.91 43.344.45 -37.5 -1.86 -37.40 -71.17 14.29 44.204.50 -37.9 -1.86 -38.40 -72.31 14.66 45.02
Table F.2 IDT Strength Data (KL 52-34 #2), continued
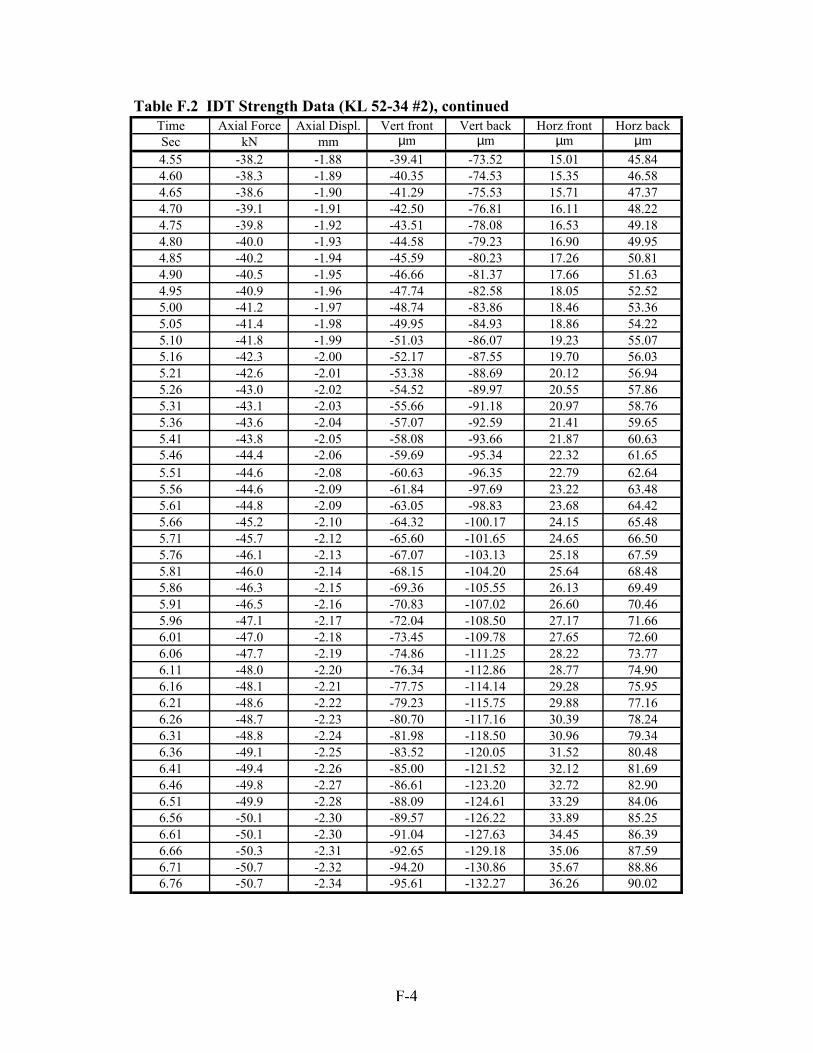
Time Axial Force Axial Displ. Vert front Vert back Horz front Horz backSec kN mm µm µm µm µm4.55 -38.2 -1.88 -39.41 -73.52 15.01 45.844.60 -38.3 -1.89 -40.35 -74.53 15.35 46.584.65 -38.6 -1.90 -41.29 -75.53 15.71 47.374.70 -39.1 -1.91 -42.50 -76.81 16.11 48.224.75 -39.8 -1.92 -43.51 -78.08 16.53 49.184.80 -40.0 -1.93 -44.58 -79.23 16.90 49.954.85 -40.2 -1.94 -45.59 -80.23 17.26 50.814.90 -40.5 -1.95 -46.66 -81.37 17.66 51.634.95 -40.9 -1.96 -47.74 -82.58 18.05 52.525.00 -41.2 -1.97 -48.74 -83.86 18.46 53.365.05 -41.4 -1.98 -49.95 -84.93 18.86 54.225.10 -41.8 -1.99 -51.03 -86.07 19.23 55.075.16 -42.3 -2.00 -52.17 -87.55 19.70 56.035.21 -42.6 -2.01 -53.38 -88.69 20.12 56.945.26 -43.0 -2.02 -54.52 -89.97 20.55 57.865.31 -43.1 -2.03 -55.66 -91.18 20.97 58.765.36 -43.6 -2.04 -57.07 -92.59 21.41 59.655.41 -43.8 -2.05 -58.08 -93.66 21.87 60.635.46 -44.4 -2.06 -59.69 -95.34 22.32 61.655.51 -44.6 -2.08 -60.63 -96.35 22.79 62.645.56 -44.6 -2.09 -61.84 -97.69 23.22 63.485.61 -44.8 -2.09 -63.05 -98.83 23.68 64.425.66 -45.2 -2.10 -64.32 -100.17 24.15 65.485.71 -45.7 -2.12 -65.60 -101.65 24.65 66.505.76 -46.1 -2.13 -67.07 -103.13 25.18 67.595.81 -46.0 -2.14 -68.15 -104.20 25.64 68.485.86 -46.3 -2.15 -69.36 -105.55 26.13 69.495.91 -46.5 -2.16 -70.83 -107.02 26.60 70.465.96 -47.1 -2.17 -72.04 -108.50 27.17 71.666.01 -47.0 -2.18 -73.45 -109.78 27.65 72.606.06 -47.7 -2.19 -74.86 -111.25 28.22 73.776.11 -48.0 -2.20 -76.34 -112.86 28.77 74.906.16 -48.1 -2.21 -77.75 -114.14 29.28 75.956.21 -48.6 -2.22 -79.23 -115.75 29.88 77.166.26 -48.7 -2.23 -80.70 -117.16 30.39 78.246.31 -48.8 -2.24 -81.98 -118.50 30.96 79.346.36 -49.1 -2.25 -83.52 -120.05 31.52 80.486.41 -49.4 -2.26 -85.00 -121.52 32.12 81.696.46 -49.8 -2.27 -86.61 -123.20 32.72 82.906.51 -49.9 -2.28 -88.09 -124.61 33.29 84.066.56 -50.1 -2.30 -89.57 -126.22 33.89 85.256.61 -50.1 -2.30 -91.04 -127.63 34.45 86.396.66 -50.3 -2.31 -92.65 -129.18 35.06 87.596.71 -50.7 -2.32 -94.20 -130.86 35.67 88.866.76 -50.7 -2.34 -95.61 -132.27 36.26 90.02
Table F.2 IDT Strength Data (KL 52-34 #2), continued
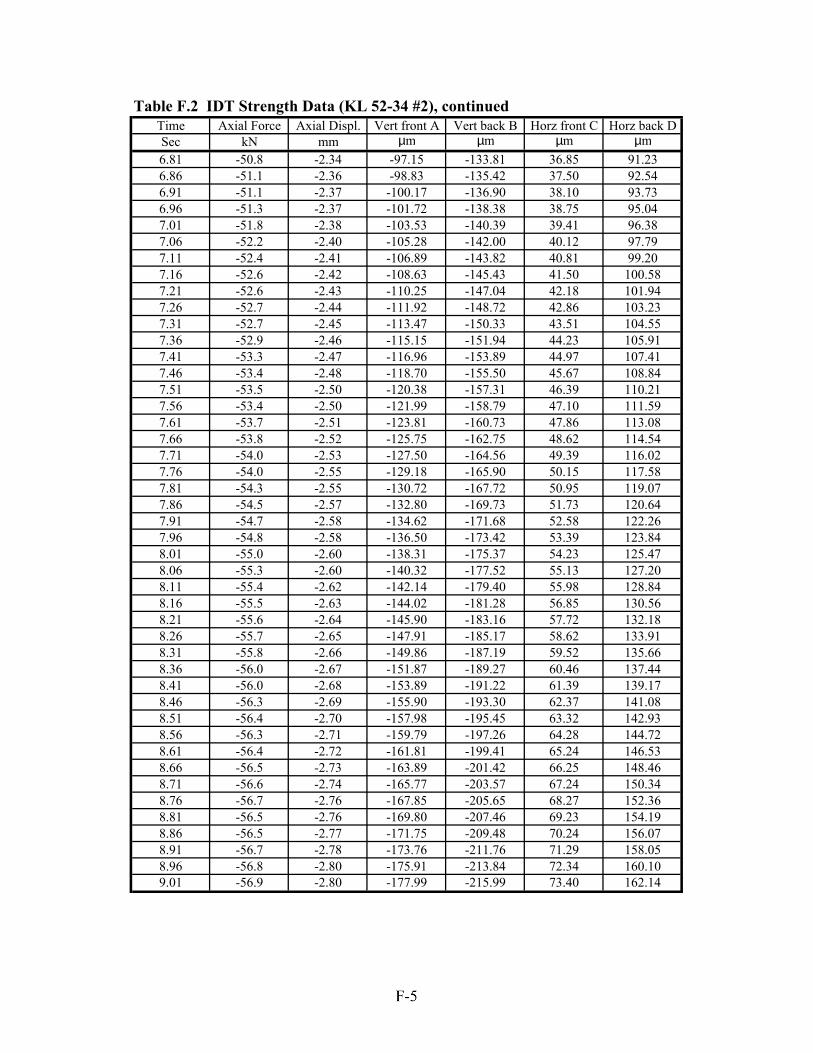
Time Axial Force Axial Displ. Vert front A Vert back B Horz front C Horz back DSec kN mm µm µm µm µm6.81 -50.8 -2.34 -97.15 -133.81 36.85 91.236.86 -51.1 -2.36 -98.83 -135.42 37.50 92.546.91 -51.1 -2.37 -100.17 -136.90 38.10 93.736.96 -51.3 -2.37 -101.72 -138.38 38.75 95.047.01 -51.8 -2.38 -103.53 -140.39 39.41 96.387.06 -52.2 -2.40 -105.28 -142.00 40.12 97.797.11 -52.4 -2.41 -106.89 -143.82 40.81 99.207.16 -52.6 -2.42 -108.63 -145.43 41.50 100.587.21 -52.6 -2.43 -110.25 -147.04 42.18 101.947.26 -52.7 -2.44 -111.92 -148.72 42.86 103.237.31 -52.7 -2.45 -113.47 -150.33 43.51 104.557.36 -52.9 -2.46 -115.15 -151.94 44.23 105.917.41 -53.3 -2.47 -116.96 -153.89 44.97 107.417.46 -53.4 -2.48 -118.70 -155.50 45.67 108.847.51 -53.5 -2.50 -120.38 -157.31 46.39 110.217.56 -53.4 -2.50 -121.99 -158.79 47.10 111.597.61 -53.7 -2.51 -123.81 -160.73 47.86 113.087.66 -53.8 -2.52 -125.75 -162.75 48.62 114.547.71 -54.0 -2.53 -127.50 -164.56 49.39 116.027.76 -54.0 -2.55 -129.18 -165.90 50.15 117.587.81 -54.3 -2.55 -130.72 -167.72 50.95 119.077.86 -54.5 -2.57 -132.80 -169.73 51.73 120.647.91 -54.7 -2.58 -134.62 -171.68 52.58 122.267.96 -54.8 -2.58 -136.50 -173.42 53.39 123.848.01 -55.0 -2.60 -138.31 -175.37 54.23 125.478.06 -55.3 -2.60 -140.32 -177.52 55.13 127.208.11 -55.4 -2.62 -142.14 -179.40 55.98 128.848.16 -55.5 -2.63 -144.02 -181.28 56.85 130.568.21 -55.6 -2.64 -145.90 -183.16 57.72 132.188.26 -55.7 -2.65 -147.91 -185.17 58.62 133.918.31 -55.8 -2.66 -149.86 -187.19 59.52 135.668.36 -56.0 -2.67 -151.87 -189.27 60.46 137.448.41 -56.0 -2.68 -153.89 -191.22 61.39 139.178.46 -56.3 -2.69 -155.90 -193.30 62.37 141.088.51 -56.4 -2.70 -157.98 -195.45 63.32 142.938.56 -56.3 -2.71 -159.79 -197.26 64.28 144.728.61 -56.4 -2.72 -161.81 -199.41 65.24 146.538.66 -56.5 -2.73 -163.89 -201.42 66.25 148.468.71 -56.6 -2.74 -165.77 -203.57 67.24 150.348.76 -56.7 -2.76 -167.85 -205.65 68.27 152.368.81 -56.5 -2.76 -169.80 -207.46 69.23 154.198.86 -56.5 -2.77 -171.75 -209.48 70.24 156.078.91 -56.7 -2.78 -173.76 -211.76 71.29 158.058.96 -56.8 -2.80 -175.91 -213.84 72.34 160.109.01 -56.9 -2.80 -177.99 -215.99 73.40 162.14
Table F.2 IDT Strength Data (KL 52-34 #2), continued
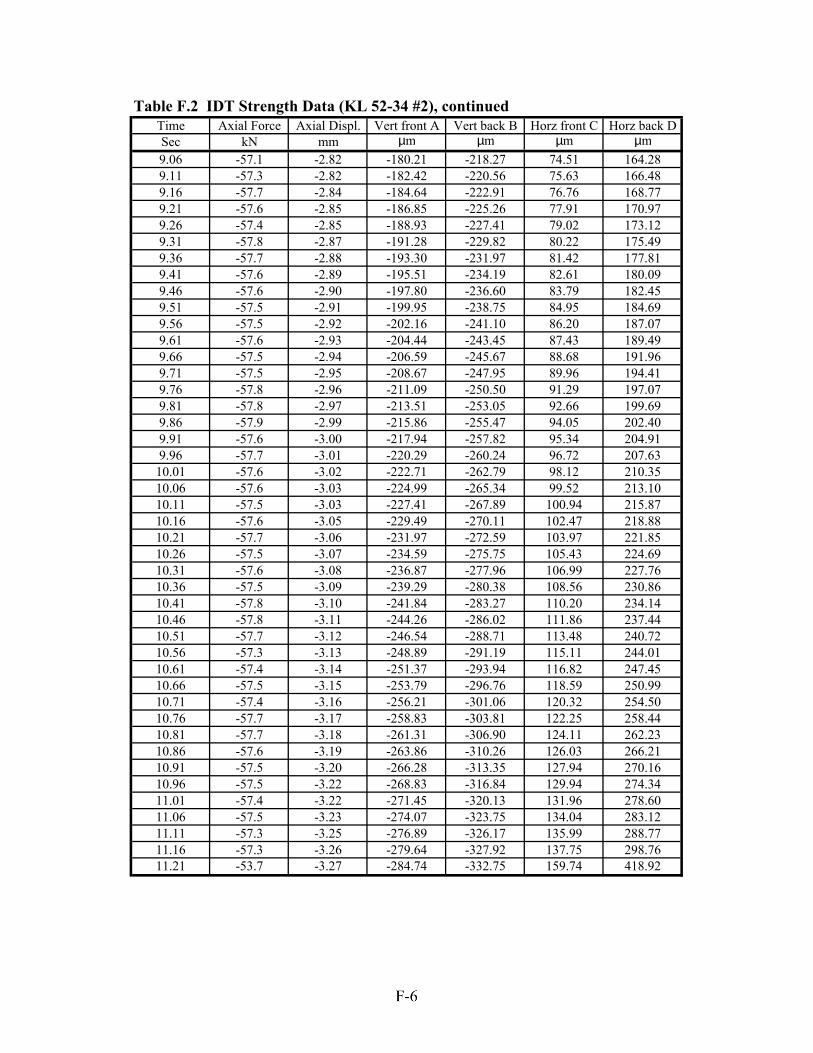
Time Axial Force Axial Displ. Vert front A Vert back B Horz front C Horz back DSec kN mm µm µm µm µm9.06 -57.1 -2.82 -180.21 -218.27 74.51 164.289.11 -57.3 -2.82 -182.42 -220.56 75.63 166.489.16 -57.7 -2.84 -184.64 -222.91 76.76 168.779.21 -57.6 -2.85 -186.85 -225.26 77.91 170.979.26 -57.4 -2.85 -188.93 -227.41 79.02 173.129.31 -57.8 -2.87 -191.28 -229.82 80.22 175.499.36 -57.7 -2.88 -193.30 -231.97 81.42 177.819.41 -57.6 -2.89 -195.51 -234.19 82.61 180.099.46 -57.6 -2.90 -197.80 -236.60 83.79 182.459.51 -57.5 -2.91 -199.95 -238.75 84.95 184.699.56 -57.5 -2.92 -202.16 -241.10 86.20 187.079.61 -57.6 -2.93 -204.44 -243.45 87.43 189.499.66 -57.5 -2.94 -206.59 -245.67 88.68 191.969.71 -57.5 -2.95 -208.67 -247.95 89.96 194.419.76 -57.8 -2.96 -211.09 -250.50 91.29 197.079.81 -57.8 -2.97 -213.51 -253.05 92.66 199.699.86 -57.9 -2.99 -215.86 -255.47 94.05 202.409.91 -57.6 -3.00 -217.94 -257.82 95.34 204.919.96 -57.7 -3.01 -220.29 -260.24 96.72 207.63
10.01 -57.6 -3.02 -222.71 -262.79 98.12 210.3510.06 -57.6 -3.03 -224.99 -265.34 99.52 213.1010.11 -57.5 -3.03 -227.41 -267.89 100.94 215.8710.16 -57.6 -3.05 -229.49 -270.11 102.47 218.8810.21 -57.7 -3.06 -231.97 -272.59 103.97 221.8510.26 -57.5 -3.07 -234.59 -275.75 105.43 224.6910.31 -57.6 -3.08 -236.87 -277.96 106.99 227.7610.36 -57.5 -3.09 -239.29 -280.38 108.56 230.8610.41 -57.8 -3.10 -241.84 -283.27 110.20 234.1410.46 -57.8 -3.11 -244.26 -286.02 111.86 237.4410.51 -57.7 -3.12 -246.54 -288.71 113.48 240.7210.56 -57.3 -3.13 -248.89 -291.19 115.11 244.0110.61 -57.4 -3.14 -251.37 -293.94 116.82 247.4510.66 -57.5 -3.15 -253.79 -296.76 118.59 250.9910.71 -57.4 -3.16 -256.21 -301.06 120.32 254.5010.76 -57.7 -3.17 -258.83 -303.81 122.25 258.4410.81 -57.7 -3.18 -261.31 -306.90 124.11 262.2310.86 -57.6 -3.19 -263.86 -310.26 126.03 266.2110.91 -57.5 -3.20 -266.28 -313.35 127.94 270.1610.96 -57.5 -3.22 -268.83 -316.84 129.94 274.3411.01 -57.4 -3.22 -271.45 -320.13 131.96 278.6011.06 -57.5 -3.23 -274.07 -323.75 134.04 283.1211.11 -57.3 -3.25 -276.89 -326.17 135.99 288.7711.16 -57.3 -3.26 -279.64 -327.92 137.75 298.7611.21 -53.7 -3.27 -284.74 -332.75 159.74 418.92
Table F.2 IDT Strength Data (KL 52-34 #2), continued
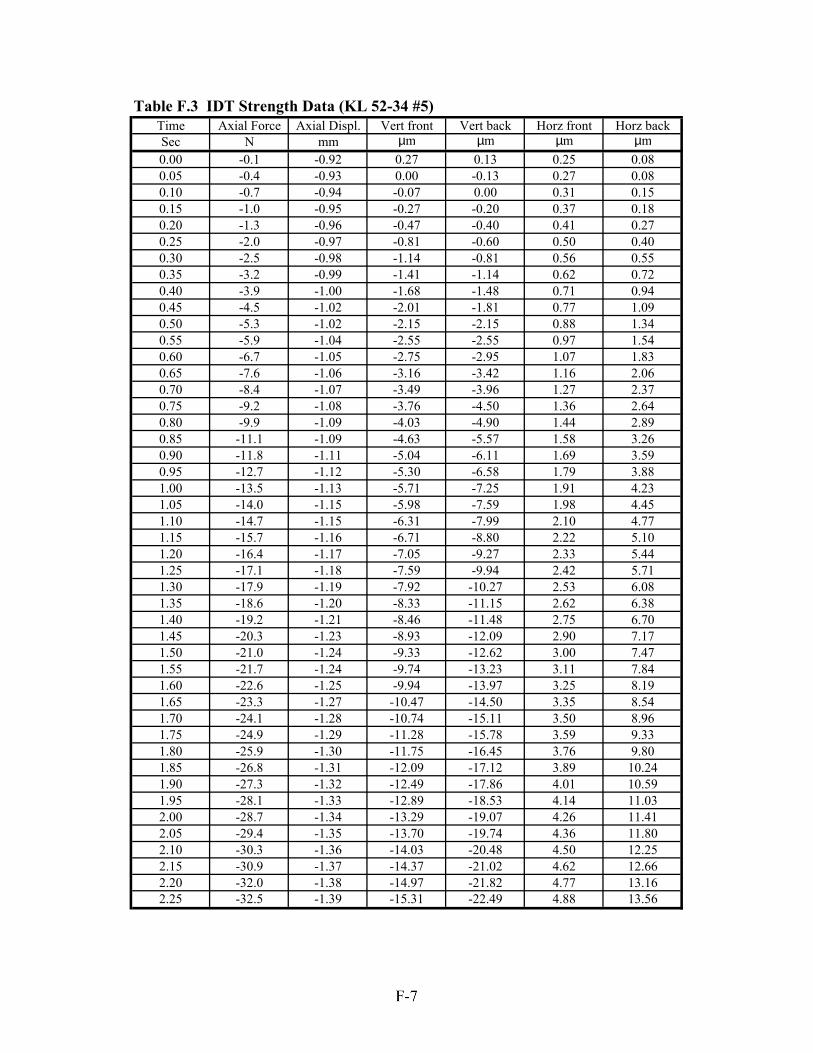
Time Axial Force Axial Displ. Vert front Vert back Horz front Horz backSec N mm µm µm µm µm0.00 -0.1 -0.92 0.27 0.13 0.25 0.080.05 -0.4 -0.93 0.00 -0.13 0.27 0.080.10 -0.7 -0.94 -0.07 0.00 0.31 0.150.15 -1.0 -0.95 -0.27 -0.20 0.37 0.180.20 -1.3 -0.96 -0.47 -0.40 0.41 0.270.25 -2.0 -0.97 -0.81 -0.60 0.50 0.400.30 -2.5 -0.98 -1.14 -0.81 0.56 0.550.35 -3.2 -0.99 -1.41 -1.14 0.62 0.720.40 -3.9 -1.00 -1.68 -1.48 0.71 0.940.45 -4.5 -1.02 -2.01 -1.81 0.77 1.090.50 -5.3 -1.02 -2.15 -2.15 0.88 1.340.55 -5.9 -1.04 -2.55 -2.55 0.97 1.540.60 -6.7 -1.05 -2.75 -2.95 1.07 1.830.65 -7.6 -1.06 -3.16 -3.42 1.16 2.060.70 -8.4 -1.07 -3.49 -3.96 1.27 2.370.75 -9.2 -1.08 -3.76 -4.50 1.36 2.640.80 -9.9 -1.09 -4.03 -4.90 1.44 2.890.85 -11.1 -1.09 -4.63 -5.57 1.58 3.260.90 -11.8 -1.11 -5.04 -6.11 1.69 3.590.95 -12.7 -1.12 -5.30 -6.58 1.79 3.881.00 -13.5 -1.13 -5.71 -7.25 1.91 4.231.05 -14.0 -1.15 -5.98 -7.59 1.98 4.451.10 -14.7 -1.15 -6.31 -7.99 2.10 4.771.15 -15.7 -1.16 -6.71 -8.80 2.22 5.101.20 -16.4 -1.17 -7.05 -9.27 2.33 5.441.25 -17.1 -1.18 -7.59 -9.94 2.42 5.711.30 -17.9 -1.19 -7.92 -10.27 2.53 6.081.35 -18.6 -1.20 -8.33 -11.15 2.62 6.381.40 -19.2 -1.21 -8.46 -11.48 2.75 6.701.45 -20.3 -1.23 -8.93 -12.09 2.90 7.171.50 -21.0 -1.24 -9.33 -12.62 3.00 7.471.55 -21.7 -1.24 -9.74 -13.23 3.11 7.841.60 -22.6 -1.25 -9.94 -13.97 3.25 8.191.65 -23.3 -1.27 -10.47 -14.50 3.35 8.541.70 -24.1 -1.28 -10.74 -15.11 3.50 8.961.75 -24.9 -1.29 -11.28 -15.78 3.59 9.331.80 -25.9 -1.30 -11.75 -16.45 3.76 9.801.85 -26.8 -1.31 -12.09 -17.12 3.89 10.241.90 -27.3 -1.32 -12.49 -17.86 4.01 10.591.95 -28.1 -1.33 -12.89 -18.53 4.14 11.032.00 -28.7 -1.34 -13.29 -19.07 4.26 11.412.05 -29.4 -1.35 -13.70 -19.74 4.36 11.802.10 -30.3 -1.36 -14.03 -20.48 4.50 12.252.15 -30.9 -1.37 -14.37 -21.02 4.62 12.662.20 -32.0 -1.38 -14.97 -21.82 4.77 13.162.25 -32.5 -1.39 -15.31 -22.49 4.88 13.56
Table F.3 IDT Strength Data (KL 52-34 #5)
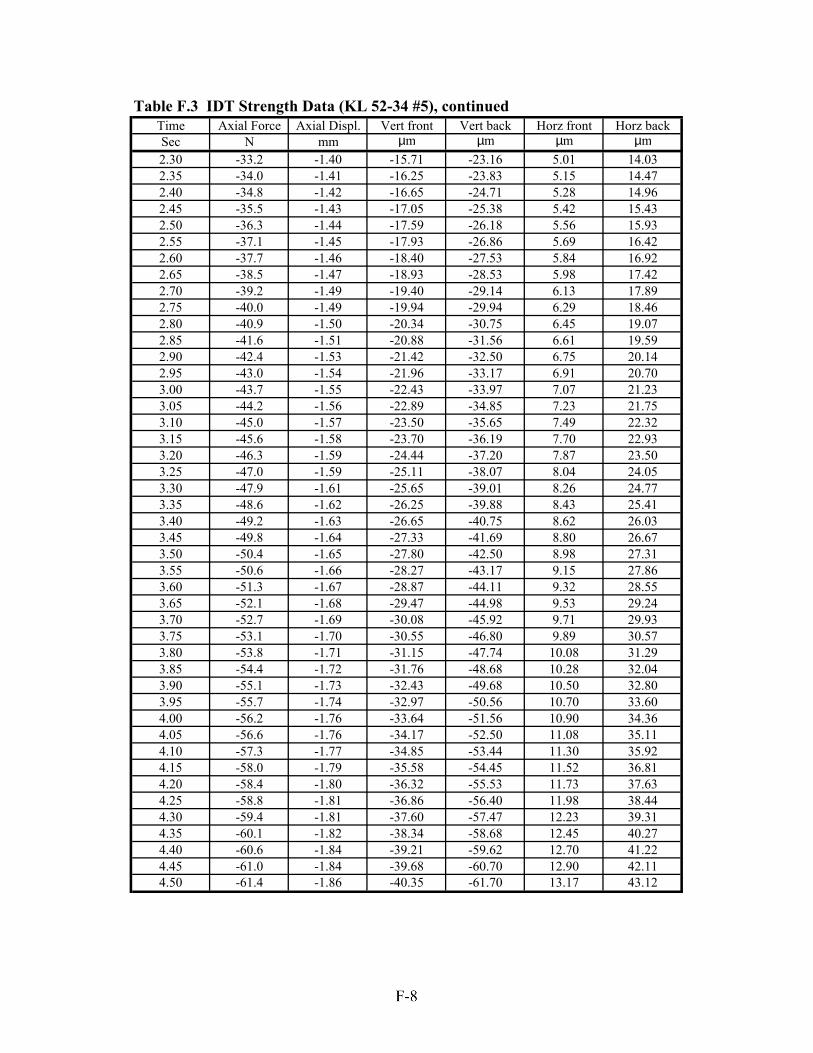
Time Axial Force Axial Displ. Vert front Vert back Horz front Horz backSec N mm µm µm µm µm2.30 -33.2 -1.40 -15.71 -23.16 5.01 14.032.35 -34.0 -1.41 -16.25 -23.83 5.15 14.472.40 -34.8 -1.42 -16.65 -24.71 5.28 14.962.45 -35.5 -1.43 -17.05 -25.38 5.42 15.432.50 -36.3 -1.44 -17.59 -26.18 5.56 15.932.55 -37.1 -1.45 -17.93 -26.86 5.69 16.422.60 -37.7 -1.46 -18.40 -27.53 5.84 16.922.65 -38.5 -1.47 -18.93 -28.53 5.98 17.422.70 -39.2 -1.49 -19.40 -29.14 6.13 17.892.75 -40.0 -1.49 -19.94 -29.94 6.29 18.462.80 -40.9 -1.50 -20.34 -30.75 6.45 19.072.85 -41.6 -1.51 -20.88 -31.56 6.61 19.592.90 -42.4 -1.53 -21.42 -32.50 6.75 20.142.95 -43.0 -1.54 -21.96 -33.17 6.91 20.703.00 -43.7 -1.55 -22.43 -33.97 7.07 21.233.05 -44.2 -1.56 -22.89 -34.85 7.23 21.753.10 -45.0 -1.57 -23.50 -35.65 7.49 22.323.15 -45.6 -1.58 -23.70 -36.19 7.70 22.933.20 -46.3 -1.59 -24.44 -37.20 7.87 23.503.25 -47.0 -1.59 -25.11 -38.07 8.04 24.053.30 -47.9 -1.61 -25.65 -39.01 8.26 24.773.35 -48.6 -1.62 -26.25 -39.88 8.43 25.413.40 -49.2 -1.63 -26.65 -40.75 8.62 26.033.45 -49.8 -1.64 -27.33 -41.69 8.80 26.673.50 -50.4 -1.65 -27.80 -42.50 8.98 27.313.55 -50.6 -1.66 -28.27 -43.17 9.15 27.863.60 -51.3 -1.67 -28.87 -44.11 9.32 28.553.65 -52.1 -1.68 -29.47 -44.98 9.53 29.243.70 -52.7 -1.69 -30.08 -45.92 9.71 29.933.75 -53.1 -1.70 -30.55 -46.80 9.89 30.573.80 -53.8 -1.71 -31.15 -47.74 10.08 31.293.85 -54.4 -1.72 -31.76 -48.68 10.28 32.043.90 -55.1 -1.73 -32.43 -49.68 10.50 32.803.95 -55.7 -1.74 -32.97 -50.56 10.70 33.604.00 -56.2 -1.76 -33.64 -51.56 10.90 34.364.05 -56.6 -1.76 -34.17 -52.50 11.08 35.114.10 -57.3 -1.77 -34.85 -53.44 11.30 35.924.15 -58.0 -1.79 -35.58 -54.45 11.52 36.814.20 -58.4 -1.80 -36.32 -55.53 11.73 37.634.25 -58.8 -1.81 -36.86 -56.40 11.98 38.444.30 -59.4 -1.81 -37.60 -57.47 12.23 39.314.35 -60.1 -1.82 -38.34 -58.68 12.45 40.274.40 -60.6 -1.84 -39.21 -59.62 12.70 41.224.45 -61.0 -1.84 -39.68 -60.70 12.90 42.114.50 -61.4 -1.86 -40.35 -61.70 13.17 43.12
Table F.3 IDT Strength Data (KL 52-34 #5), continued

Time Axial Force Axial Displ. Vert front Vert back Horz front Horz backSec N mm µm µm µm µm4.55 -61.9 -1.86 -41.22 -62.91 13.44 44.134.60 -62.3 -1.88 -41.83 -63.99 13.65 45.144.65 -63.0 -1.89 -42.70 -65.13 13.91 46.294.70 -63.6 -1.90 -43.51 -66.34 14.19 47.424.75 -64.0 -1.91 -44.25 -67.48 14.46 48.564.80 -64.2 -1.92 -44.98 -68.35 14.72 49.874.85 -64.7 -1.93 -45.72 -69.69 14.98 51.314.90 -65.0 -1.94 -46.60 -70.83 15.24 52.644.95 -65.6 -1.95 -47.40 -72.11 15.53 54.105.00 -65.9 -1.96 -48.27 -73.18 15.79 55.445.05 -66.3 -1.97 -49.15 -74.46 16.13 56.875.10 -66.8 -1.98 -50.22 -75.60 16.60 58.385.16 -66.8 -1.99 -51.63 -76.81 17.37 59.795.21 -67.2 -2.00 -52.77 -79.02 18.15 61.555.26 -67.6 -2.02 -54.12 -80.97 18.85 63.925.31 -67.4 -2.03 -56.94 -83.32 19.06 92.995.36 -66.8 -2.04 -61.30 -89.36 22.18 129.585.41 -65.2 -2.05 -70.90 -106.75 36.79 190.195.46 -61.4 -2.06 -81.58 -132.40 70.88 268.29
Table F.3 IDT Strength Data (KL 52-34 #5), continued
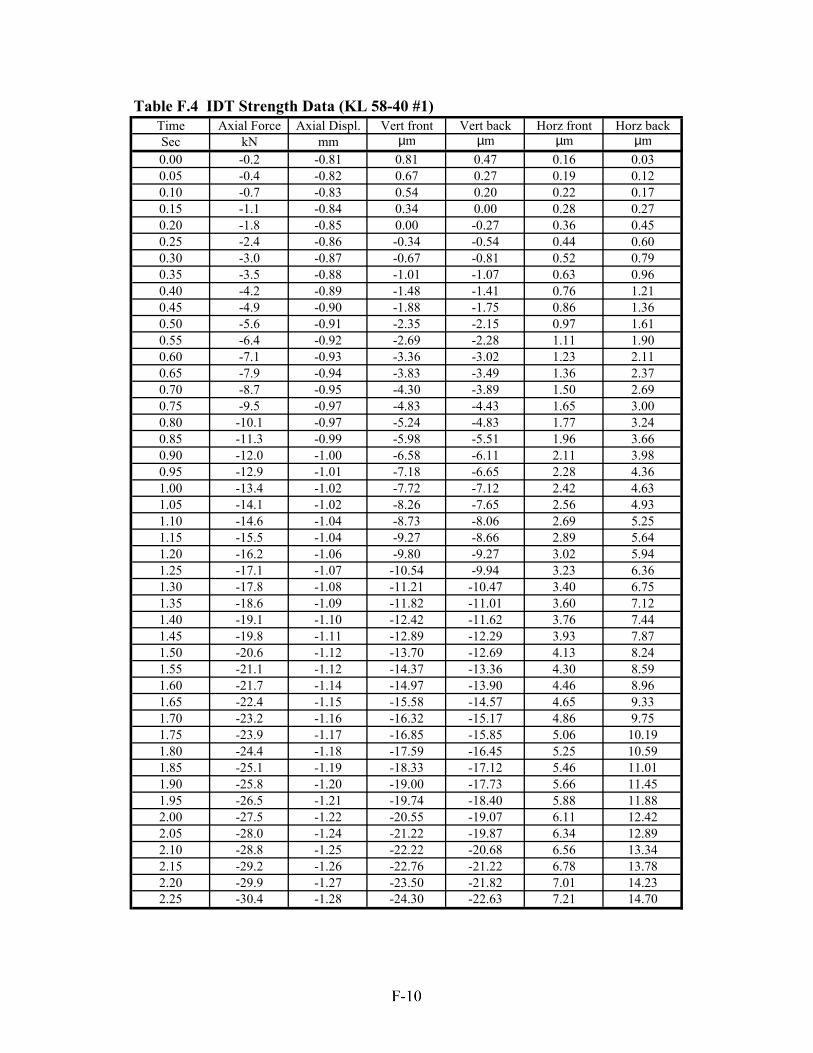
Time Axial Force Axial Displ. Vert front Vert back Horz front Horz backSec kN mm µm µm µm µm0.00 -0.2 -0.81 0.81 0.47 0.16 0.030.05 -0.4 -0.82 0.67 0.27 0.19 0.120.10 -0.7 -0.83 0.54 0.20 0.22 0.170.15 -1.1 -0.84 0.34 0.00 0.28 0.270.20 -1.8 -0.85 0.00 -0.27 0.36 0.450.25 -2.4 -0.86 -0.34 -0.54 0.44 0.600.30 -3.0 -0.87 -0.67 -0.81 0.52 0.790.35 -3.5 -0.88 -1.01 -1.07 0.63 0.960.40 -4.2 -0.89 -1.48 -1.41 0.76 1.210.45 -4.9 -0.90 -1.88 -1.75 0.86 1.360.50 -5.6 -0.91 -2.35 -2.15 0.97 1.610.55 -6.4 -0.92 -2.69 -2.28 1.11 1.900.60 -7.1 -0.93 -3.36 -3.02 1.23 2.110.65 -7.9 -0.94 -3.83 -3.49 1.36 2.370.70 -8.7 -0.95 -4.30 -3.89 1.50 2.690.75 -9.5 -0.97 -4.83 -4.43 1.65 3.000.80 -10.1 -0.97 -5.24 -4.83 1.77 3.240.85 -11.3 -0.99 -5.98 -5.51 1.96 3.660.90 -12.0 -1.00 -6.58 -6.11 2.11 3.980.95 -12.9 -1.01 -7.18 -6.65 2.28 4.361.00 -13.4 -1.02 -7.72 -7.12 2.42 4.631.05 -14.1 -1.02 -8.26 -7.65 2.56 4.931.10 -14.6 -1.04 -8.73 -8.06 2.69 5.251.15 -15.5 -1.04 -9.27 -8.66 2.89 5.641.20 -16.2 -1.06 -9.80 -9.27 3.02 5.941.25 -17.1 -1.07 -10.54 -9.94 3.23 6.361.30 -17.8 -1.08 -11.21 -10.47 3.40 6.751.35 -18.6 -1.09 -11.82 -11.01 3.60 7.121.40 -19.1 -1.10 -12.42 -11.62 3.76 7.441.45 -19.8 -1.11 -12.89 -12.29 3.93 7.871.50 -20.6 -1.12 -13.70 -12.69 4.13 8.241.55 -21.1 -1.12 -14.37 -13.36 4.30 8.591.60 -21.7 -1.14 -14.97 -13.90 4.46 8.961.65 -22.4 -1.15 -15.58 -14.57 4.65 9.331.70 -23.2 -1.16 -16.32 -15.17 4.86 9.751.75 -23.9 -1.17 -16.85 -15.85 5.06 10.191.80 -24.4 -1.18 -17.59 -16.45 5.25 10.591.85 -25.1 -1.19 -18.33 -17.12 5.46 11.011.90 -25.8 -1.20 -19.00 -17.73 5.66 11.451.95 -26.5 -1.21 -19.74 -18.40 5.88 11.882.00 -27.5 -1.22 -20.55 -19.07 6.11 12.422.05 -28.0 -1.24 -21.22 -19.87 6.34 12.892.10 -28.8 -1.25 -22.22 -20.68 6.56 13.342.15 -29.2 -1.26 -22.76 -21.22 6.78 13.782.20 -29.9 -1.27 -23.50 -21.82 7.01 14.232.25 -30.4 -1.28 -24.30 -22.63 7.21 14.70
Table F.4 IDT Strength Data (KL 58-40 #1)
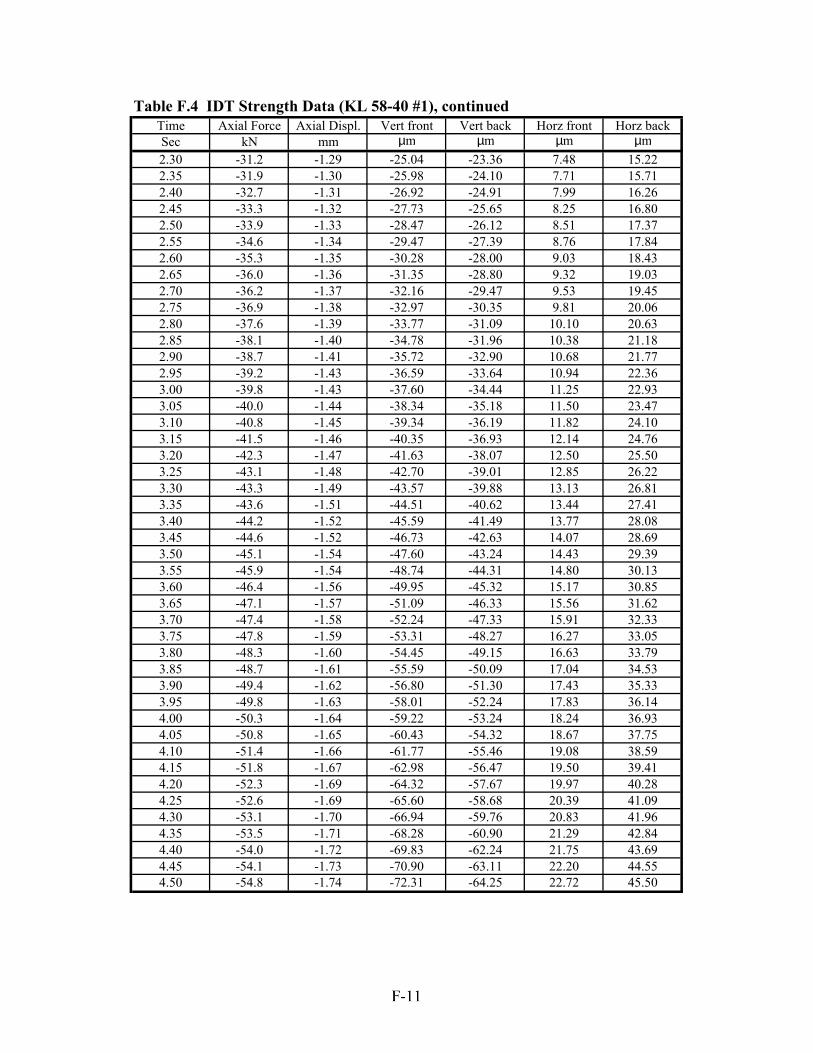
Time Axial Force Axial Displ. Vert front Vert back Horz front Horz backSec kN mm µm µm µm µm2.30 -31.2 -1.29 -25.04 -23.36 7.48 15.222.35 -31.9 -1.30 -25.98 -24.10 7.71 15.712.40 -32.7 -1.31 -26.92 -24.91 7.99 16.262.45 -33.3 -1.32 -27.73 -25.65 8.25 16.802.50 -33.9 -1.33 -28.47 -26.12 8.51 17.372.55 -34.6 -1.34 -29.47 -27.39 8.76 17.842.60 -35.3 -1.35 -30.28 -28.00 9.03 18.432.65 -36.0 -1.36 -31.35 -28.80 9.32 19.032.70 -36.2 -1.37 -32.16 -29.47 9.53 19.452.75 -36.9 -1.38 -32.97 -30.35 9.81 20.062.80 -37.6 -1.39 -33.77 -31.09 10.10 20.632.85 -38.1 -1.40 -34.78 -31.96 10.38 21.182.90 -38.7 -1.41 -35.72 -32.90 10.68 21.772.95 -39.2 -1.43 -36.59 -33.64 10.94 22.363.00 -39.8 -1.43 -37.60 -34.44 11.25 22.933.05 -40.0 -1.44 -38.34 -35.18 11.50 23.473.10 -40.8 -1.45 -39.34 -36.19 11.82 24.103.15 -41.5 -1.46 -40.35 -36.93 12.14 24.763.20 -42.3 -1.47 -41.63 -38.07 12.50 25.503.25 -43.1 -1.48 -42.70 -39.01 12.85 26.223.30 -43.3 -1.49 -43.57 -39.88 13.13 26.813.35 -43.6 -1.51 -44.51 -40.62 13.44 27.413.40 -44.2 -1.52 -45.59 -41.49 13.77 28.083.45 -44.6 -1.52 -46.73 -42.63 14.07 28.693.50 -45.1 -1.54 -47.60 -43.24 14.43 29.393.55 -45.9 -1.54 -48.74 -44.31 14.80 30.133.60 -46.4 -1.56 -49.95 -45.32 15.17 30.853.65 -47.1 -1.57 -51.09 -46.33 15.56 31.623.70 -47.4 -1.58 -52.24 -47.33 15.91 32.333.75 -47.8 -1.59 -53.31 -48.27 16.27 33.053.80 -48.3 -1.60 -54.45 -49.15 16.63 33.793.85 -48.7 -1.61 -55.59 -50.09 17.04 34.533.90 -49.4 -1.62 -56.80 -51.30 17.43 35.333.95 -49.8 -1.63 -58.01 -52.24 17.83 36.144.00 -50.3 -1.64 -59.22 -53.24 18.24 36.934.05 -50.8 -1.65 -60.43 -54.32 18.67 37.754.10 -51.4 -1.66 -61.77 -55.46 19.08 38.594.15 -51.8 -1.67 -62.98 -56.47 19.50 39.414.20 -52.3 -1.69 -64.32 -57.67 19.97 40.284.25 -52.6 -1.69 -65.60 -58.68 20.39 41.094.30 -53.1 -1.70 -66.94 -59.76 20.83 41.964.35 -53.5 -1.71 -68.28 -60.90 21.29 42.844.40 -54.0 -1.72 -69.83 -62.24 21.75 43.694.45 -54.1 -1.73 -70.90 -63.11 22.20 44.554.50 -54.8 -1.74 -72.31 -64.25 22.72 45.50
Table F.4 IDT Strength Data (KL 58-40 #1), continued
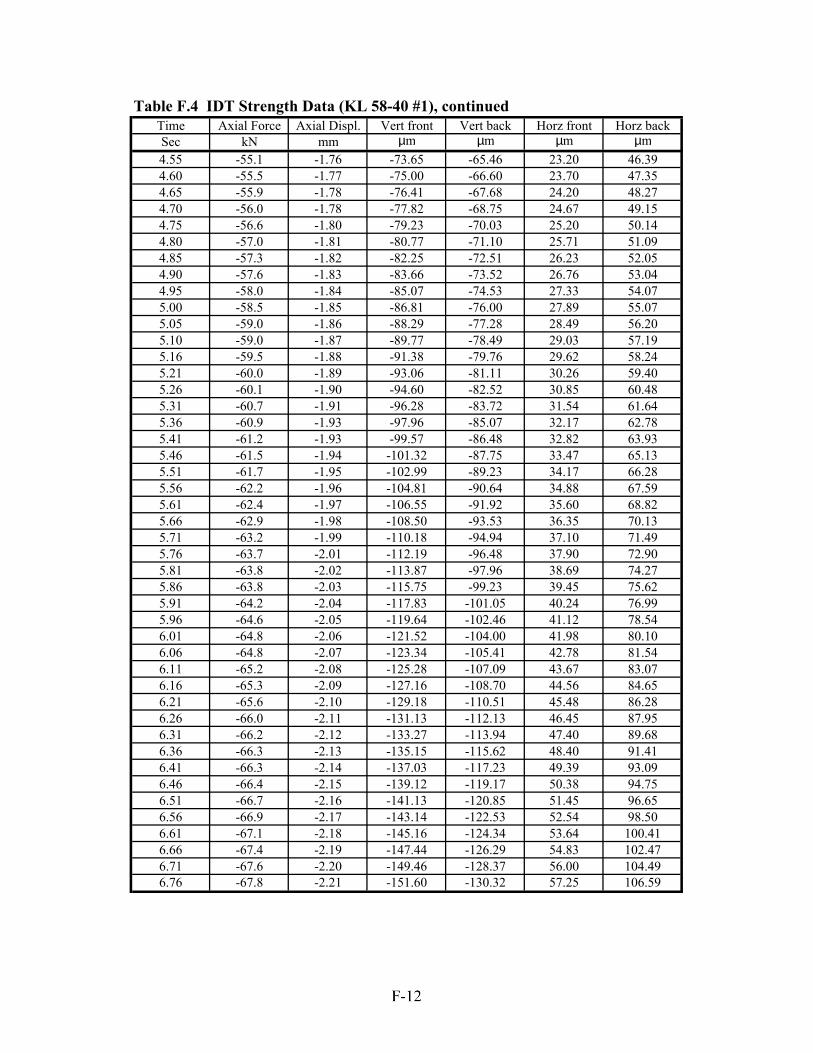
Time Axial Force Axial Displ. Vert front Vert back Horz front Horz backSec kN mm µm µm µm µm4.55 -55.1 -1.76 -73.65 -65.46 23.20 46.394.60 -55.5 -1.77 -75.00 -66.60 23.70 47.354.65 -55.9 -1.78 -76.41 -67.68 24.20 48.274.70 -56.0 -1.78 -77.82 -68.75 24.67 49.154.75 -56.6 -1.80 -79.23 -70.03 25.20 50.144.80 -57.0 -1.81 -80.77 -71.10 25.71 51.094.85 -57.3 -1.82 -82.25 -72.51 26.23 52.054.90 -57.6 -1.83 -83.66 -73.52 26.76 53.044.95 -58.0 -1.84 -85.07 -74.53 27.33 54.075.00 -58.5 -1.85 -86.81 -76.00 27.89 55.075.05 -59.0 -1.86 -88.29 -77.28 28.49 56.205.10 -59.0 -1.87 -89.77 -78.49 29.03 57.195.16 -59.5 -1.88 -91.38 -79.76 29.62 58.245.21 -60.0 -1.89 -93.06 -81.11 30.26 59.405.26 -60.1 -1.90 -94.60 -82.52 30.85 60.485.31 -60.7 -1.91 -96.28 -83.72 31.54 61.645.36 -60.9 -1.93 -97.96 -85.07 32.17 62.785.41 -61.2 -1.93 -99.57 -86.48 32.82 63.935.46 -61.5 -1.94 -101.32 -87.75 33.47 65.135.51 -61.7 -1.95 -102.99 -89.23 34.17 66.285.56 -62.2 -1.96 -104.81 -90.64 34.88 67.595.61 -62.4 -1.97 -106.55 -91.92 35.60 68.825.66 -62.9 -1.98 -108.50 -93.53 36.35 70.135.71 -63.2 -1.99 -110.18 -94.94 37.10 71.495.76 -63.7 -2.01 -112.19 -96.48 37.90 72.905.81 -63.8 -2.02 -113.87 -97.96 38.69 74.275.86 -63.8 -2.03 -115.75 -99.23 39.45 75.625.91 -64.2 -2.04 -117.83 -101.05 40.24 76.995.96 -64.6 -2.05 -119.64 -102.46 41.12 78.546.01 -64.8 -2.06 -121.52 -104.00 41.98 80.106.06 -64.8 -2.07 -123.34 -105.41 42.78 81.546.11 -65.2 -2.08 -125.28 -107.09 43.67 83.076.16 -65.3 -2.09 -127.16 -108.70 44.56 84.656.21 -65.6 -2.10 -129.18 -110.51 45.48 86.286.26 -66.0 -2.11 -131.13 -112.13 46.45 87.956.31 -66.2 -2.12 -133.27 -113.94 47.40 89.686.36 -66.3 -2.13 -135.15 -115.62 48.40 91.416.41 -66.3 -2.14 -137.03 -117.23 49.39 93.096.46 -66.4 -2.15 -139.12 -119.17 50.38 94.756.51 -66.7 -2.16 -141.13 -120.85 51.45 96.656.56 -66.9 -2.17 -143.14 -122.53 52.54 98.506.61 -67.1 -2.18 -145.16 -124.34 53.64 100.416.66 -67.4 -2.19 -147.44 -126.29 54.83 102.476.71 -67.6 -2.20 -149.46 -128.37 56.00 104.496.76 -67.8 -2.21 -151.60 -130.32 57.25 106.59
Table F.4 IDT Strength Data (KL 58-40 #1), continued
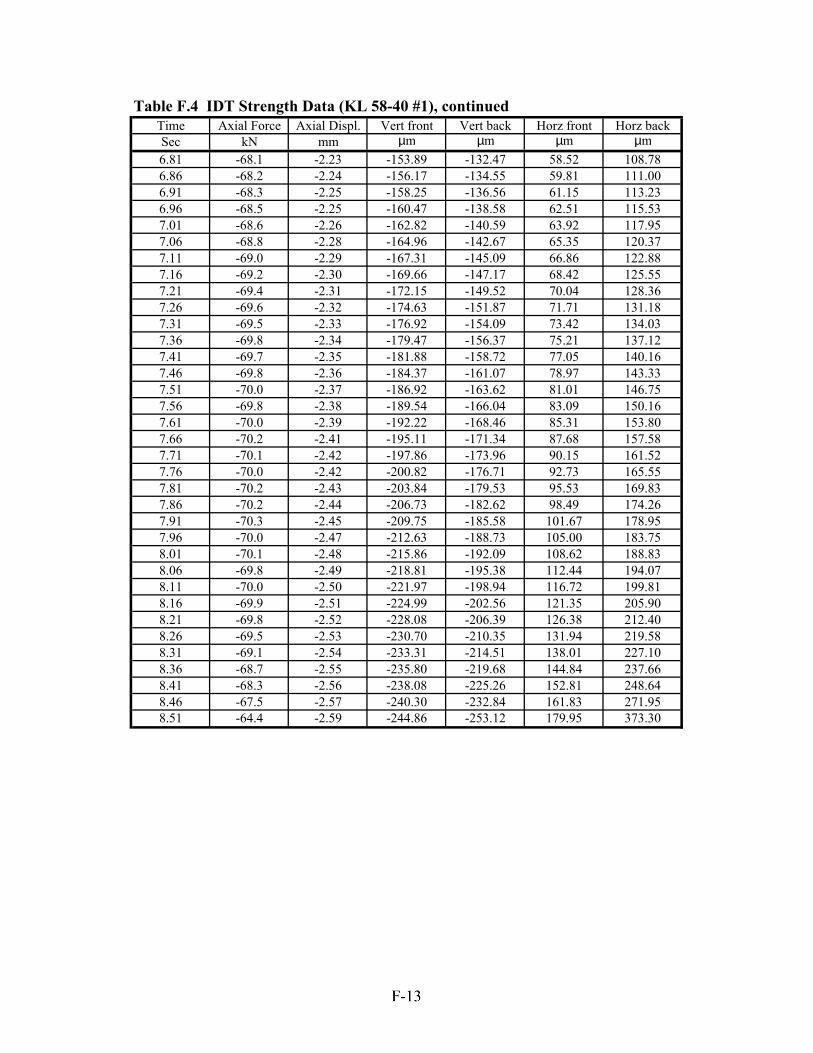
Time Axial Force Axial Displ. Vert front Vert back Horz front Horz backSec kN mm µm µm µm µm6.81 -68.1 -2.23 -153.89 -132.47 58.52 108.786.86 -68.2 -2.24 -156.17 -134.55 59.81 111.006.91 -68.3 -2.25 -158.25 -136.56 61.15 113.236.96 -68.5 -2.25 -160.47 -138.58 62.51 115.537.01 -68.6 -2.26 -162.82 -140.59 63.92 117.957.06 -68.8 -2.28 -164.96 -142.67 65.35 120.377.11 -69.0 -2.29 -167.31 -145.09 66.86 122.887.16 -69.2 -2.30 -169.66 -147.17 68.42 125.557.21 -69.4 -2.31 -172.15 -149.52 70.04 128.367.26 -69.6 -2.32 -174.63 -151.87 71.71 131.187.31 -69.5 -2.33 -176.92 -154.09 73.42 134.037.36 -69.8 -2.34 -179.47 -156.37 75.21 137.127.41 -69.7 -2.35 -181.88 -158.72 77.05 140.167.46 -69.8 -2.36 -184.37 -161.07 78.97 143.337.51 -70.0 -2.37 -186.92 -163.62 81.01 146.757.56 -69.8 -2.38 -189.54 -166.04 83.09 150.167.61 -70.0 -2.39 -192.22 -168.46 85.31 153.807.66 -70.2 -2.41 -195.11 -171.34 87.68 157.587.71 -70.1 -2.42 -197.86 -173.96 90.15 161.527.76 -70.0 -2.42 -200.82 -176.71 92.73 165.557.81 -70.2 -2.43 -203.84 -179.53 95.53 169.837.86 -70.2 -2.44 -206.73 -182.62 98.49 174.267.91 -70.3 -2.45 -209.75 -185.58 101.67 178.957.96 -70.0 -2.47 -212.63 -188.73 105.00 183.758.01 -70.1 -2.48 -215.86 -192.09 108.62 188.838.06 -69.8 -2.49 -218.81 -195.38 112.44 194.078.11 -70.0 -2.50 -221.97 -198.94 116.72 199.818.16 -69.9 -2.51 -224.99 -202.56 121.35 205.908.21 -69.8 -2.52 -228.08 -206.39 126.38 212.408.26 -69.5 -2.53 -230.70 -210.35 131.94 219.588.31 -69.1 -2.54 -233.31 -214.51 138.01 227.108.36 -68.7 -2.55 -235.80 -219.68 144.84 237.668.41 -68.3 -2.56 -238.08 -225.26 152.81 248.648.46 -67.5 -2.57 -240.30 -232.84 161.83 271.958.51 -64.4 -2.59 -244.86 -253.12 179.95 373.30
Table F.4 IDT Strength Data (KL 58-40 #1), continued
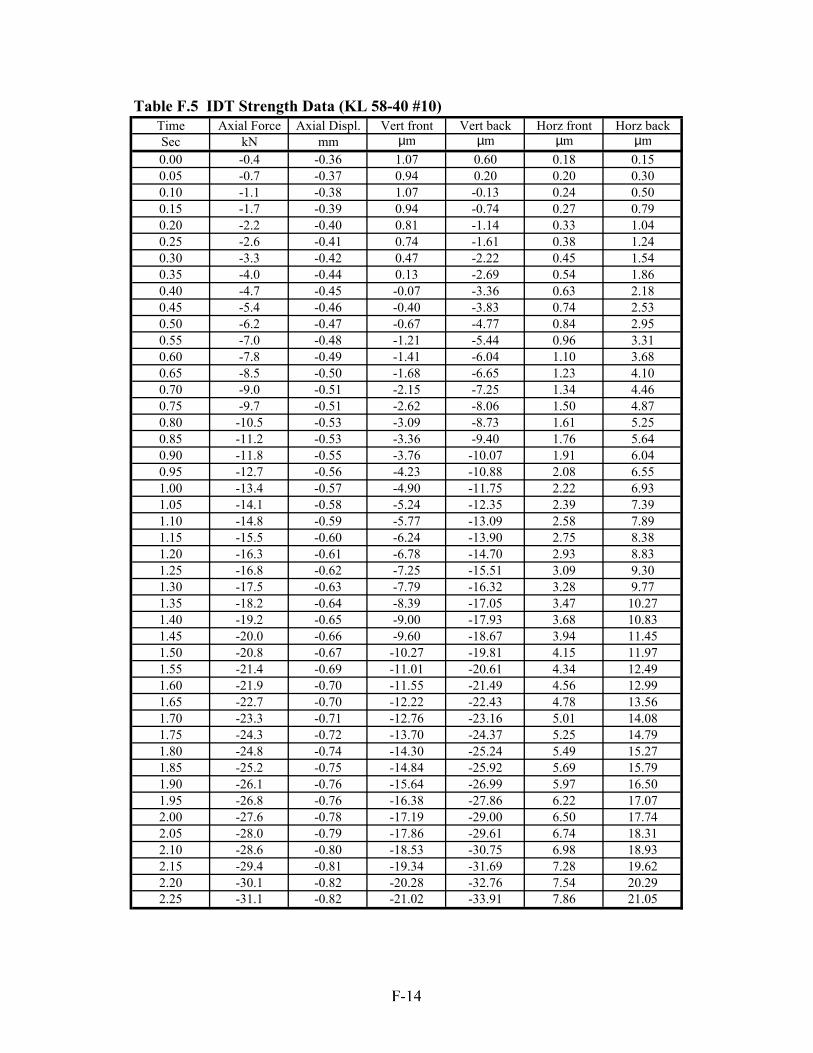
Time Axial Force Axial Displ. Vert front Vert back Horz front Horz backSec kN mm µm µm µm µm0.00 -0.4 -0.36 1.07 0.60 0.18 0.150.05 -0.7 -0.37 0.94 0.20 0.20 0.300.10 -1.1 -0.38 1.07 -0.13 0.24 0.500.15 -1.7 -0.39 0.94 -0.74 0.27 0.790.20 -2.2 -0.40 0.81 -1.14 0.33 1.040.25 -2.6 -0.41 0.74 -1.61 0.38 1.240.30 -3.3 -0.42 0.47 -2.22 0.45 1.540.35 -4.0 -0.44 0.13 -2.69 0.54 1.860.40 -4.7 -0.45 -0.07 -3.36 0.63 2.180.45 -5.4 -0.46 -0.40 -3.83 0.74 2.530.50 -6.2 -0.47 -0.67 -4.77 0.84 2.950.55 -7.0 -0.48 -1.21 -5.44 0.96 3.310.60 -7.8 -0.49 -1.41 -6.04 1.10 3.680.65 -8.5 -0.50 -1.68 -6.65 1.23 4.100.70 -9.0 -0.51 -2.15 -7.25 1.34 4.460.75 -9.7 -0.51 -2.62 -8.06 1.50 4.870.80 -10.5 -0.53 -3.09 -8.73 1.61 5.250.85 -11.2 -0.53 -3.36 -9.40 1.76 5.640.90 -11.8 -0.55 -3.76 -10.07 1.91 6.040.95 -12.7 -0.56 -4.23 -10.88 2.08 6.551.00 -13.4 -0.57 -4.90 -11.75 2.22 6.931.05 -14.1 -0.58 -5.24 -12.35 2.39 7.391.10 -14.8 -0.59 -5.77 -13.09 2.58 7.891.15 -15.5 -0.60 -6.24 -13.90 2.75 8.381.20 -16.3 -0.61 -6.78 -14.70 2.93 8.831.25 -16.8 -0.62 -7.25 -15.51 3.09 9.301.30 -17.5 -0.63 -7.79 -16.32 3.28 9.771.35 -18.2 -0.64 -8.39 -17.05 3.47 10.271.40 -19.2 -0.65 -9.00 -17.93 3.68 10.831.45 -20.0 -0.66 -9.60 -18.67 3.94 11.451.50 -20.8 -0.67 -10.27 -19.81 4.15 11.971.55 -21.4 -0.69 -11.01 -20.61 4.34 12.491.60 -21.9 -0.70 -11.55 -21.49 4.56 12.991.65 -22.7 -0.70 -12.22 -22.43 4.78 13.561.70 -23.3 -0.71 -12.76 -23.16 5.01 14.081.75 -24.3 -0.72 -13.70 -24.37 5.25 14.791.80 -24.8 -0.74 -14.30 -25.24 5.49 15.271.85 -25.2 -0.75 -14.84 -25.92 5.69 15.791.90 -26.1 -0.76 -15.64 -26.99 5.97 16.501.95 -26.8 -0.76 -16.38 -27.86 6.22 17.072.00 -27.6 -0.78 -17.19 -29.00 6.50 17.742.05 -28.0 -0.79 -17.86 -29.61 6.74 18.312.10 -28.6 -0.80 -18.53 -30.75 6.98 18.932.15 -29.4 -0.81 -19.34 -31.69 7.28 19.622.20 -30.1 -0.82 -20.28 -32.76 7.54 20.292.25 -31.1 -0.82 -21.02 -33.91 7.86 21.05
Table F.5 IDT Strength Data (KL 58-40 #10)
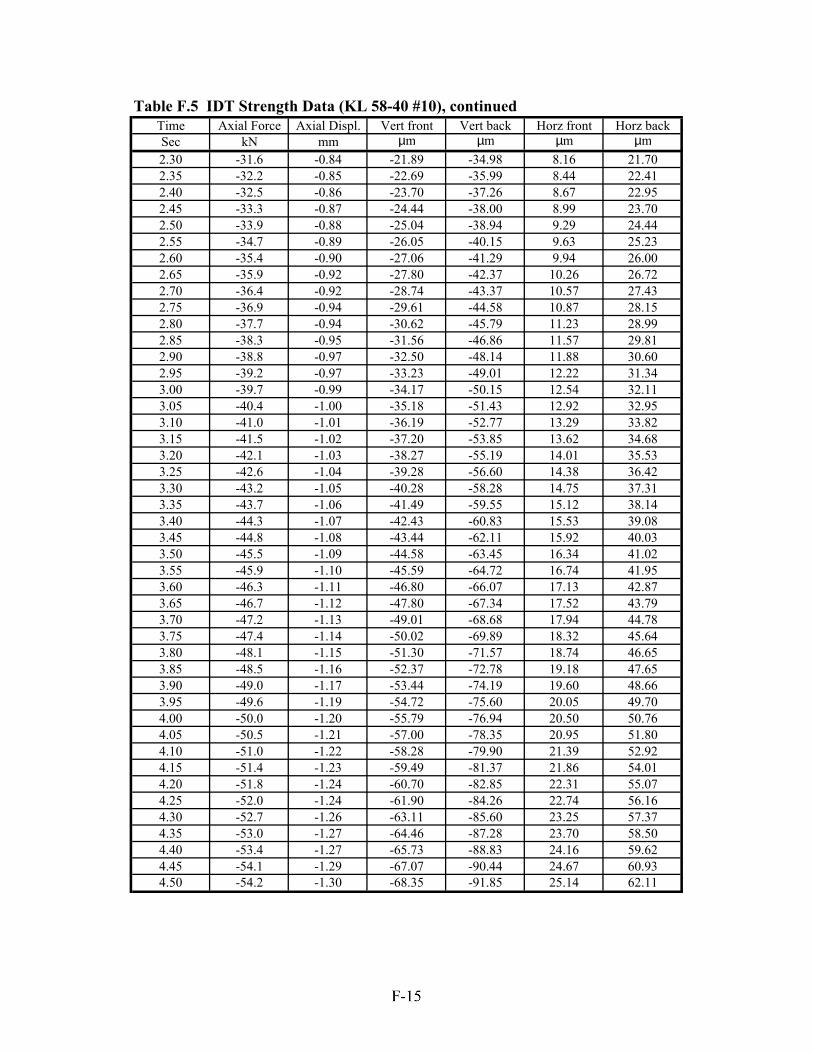
Time Axial Force Axial Displ. Vert front Vert back Horz front Horz backSec kN mm µm µm µm µm2.30 -31.6 -0.84 -21.89 -34.98 8.16 21.702.35 -32.2 -0.85 -22.69 -35.99 8.44 22.412.40 -32.5 -0.86 -23.70 -37.26 8.67 22.952.45 -33.3 -0.87 -24.44 -38.00 8.99 23.702.50 -33.9 -0.88 -25.04 -38.94 9.29 24.442.55 -34.7 -0.89 -26.05 -40.15 9.63 25.232.60 -35.4 -0.90 -27.06 -41.29 9.94 26.002.65 -35.9 -0.92 -27.80 -42.37 10.26 26.722.70 -36.4 -0.92 -28.74 -43.37 10.57 27.432.75 -36.9 -0.94 -29.61 -44.58 10.87 28.152.80 -37.7 -0.94 -30.62 -45.79 11.23 28.992.85 -38.3 -0.95 -31.56 -46.86 11.57 29.812.90 -38.8 -0.97 -32.50 -48.14 11.88 30.602.95 -39.2 -0.97 -33.23 -49.01 12.22 31.343.00 -39.7 -0.99 -34.17 -50.15 12.54 32.113.05 -40.4 -1.00 -35.18 -51.43 12.92 32.953.10 -41.0 -1.01 -36.19 -52.77 13.29 33.823.15 -41.5 -1.02 -37.20 -53.85 13.62 34.683.20 -42.1 -1.03 -38.27 -55.19 14.01 35.533.25 -42.6 -1.04 -39.28 -56.60 14.38 36.423.30 -43.2 -1.05 -40.28 -58.28 14.75 37.313.35 -43.7 -1.06 -41.49 -59.55 15.12 38.143.40 -44.3 -1.07 -42.43 -60.83 15.53 39.083.45 -44.8 -1.08 -43.44 -62.11 15.92 40.033.50 -45.5 -1.09 -44.58 -63.45 16.34 41.023.55 -45.9 -1.10 -45.59 -64.72 16.74 41.953.60 -46.3 -1.11 -46.80 -66.07 17.13 42.873.65 -46.7 -1.12 -47.80 -67.34 17.52 43.793.70 -47.2 -1.13 -49.01 -68.68 17.94 44.783.75 -47.4 -1.14 -50.02 -69.89 18.32 45.643.80 -48.1 -1.15 -51.30 -71.57 18.74 46.653.85 -48.5 -1.16 -52.37 -72.78 19.18 47.653.90 -49.0 -1.17 -53.44 -74.19 19.60 48.663.95 -49.6 -1.19 -54.72 -75.60 20.05 49.704.00 -50.0 -1.20 -55.79 -76.94 20.50 50.764.05 -50.5 -1.21 -57.00 -78.35 20.95 51.804.10 -51.0 -1.22 -58.28 -79.90 21.39 52.924.15 -51.4 -1.23 -59.49 -81.37 21.86 54.014.20 -51.8 -1.24 -60.70 -82.85 22.31 55.074.25 -52.0 -1.24 -61.90 -84.26 22.74 56.164.30 -52.7 -1.26 -63.11 -85.60 23.25 57.374.35 -53.0 -1.27 -64.46 -87.28 23.70 58.504.40 -53.4 -1.27 -65.73 -88.83 24.16 59.624.45 -54.1 -1.29 -67.07 -90.44 24.67 60.934.50 -54.2 -1.30 -68.35 -91.85 25.14 62.11
Table F.5 IDT Strength Data (KL 58-40 #10), continued
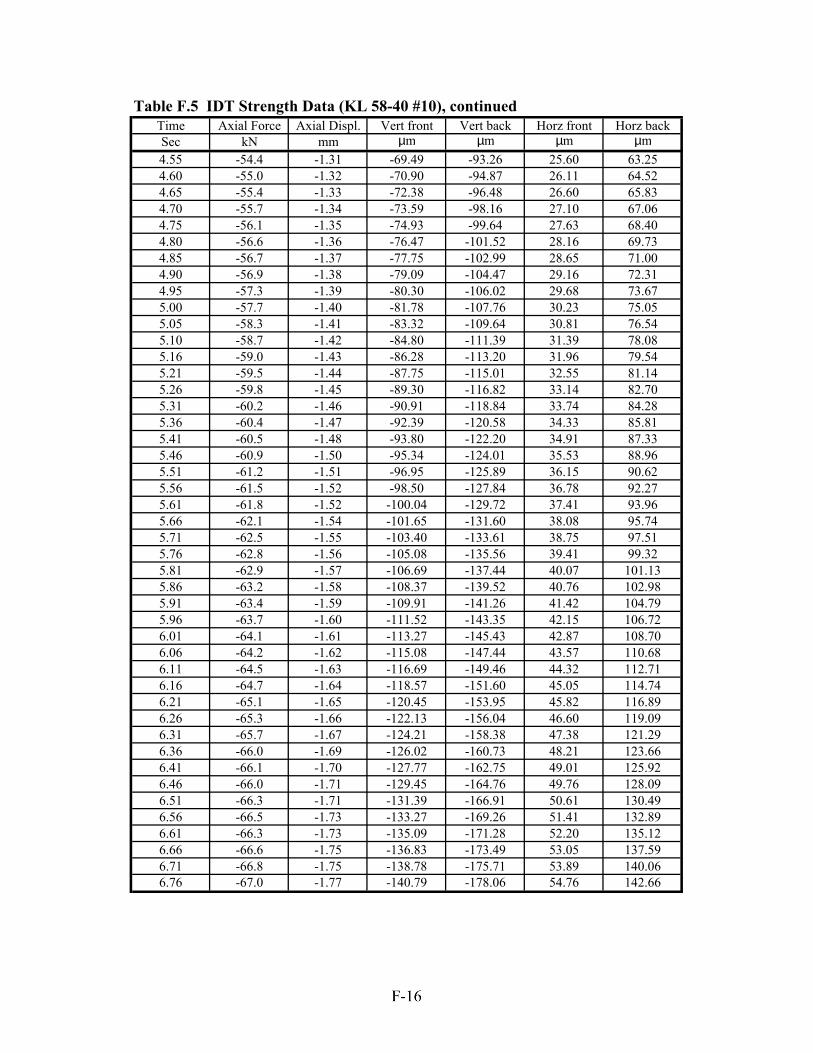
Time Axial Force Axial Displ. Vert front Vert back Horz front Horz backSec kN mm µm µm µm µm4.55 -54.4 -1.31 -69.49 -93.26 25.60 63.254.60 -55.0 -1.32 -70.90 -94.87 26.11 64.524.65 -55.4 -1.33 -72.38 -96.48 26.60 65.834.70 -55.7 -1.34 -73.59 -98.16 27.10 67.064.75 -56.1 -1.35 -74.93 -99.64 27.63 68.404.80 -56.6 -1.36 -76.47 -101.52 28.16 69.734.85 -56.7 -1.37 -77.75 -102.99 28.65 71.004.90 -56.9 -1.38 -79.09 -104.47 29.16 72.314.95 -57.3 -1.39 -80.30 -106.02 29.68 73.675.00 -57.7 -1.40 -81.78 -107.76 30.23 75.055.05 -58.3 -1.41 -83.32 -109.64 30.81 76.545.10 -58.7 -1.42 -84.80 -111.39 31.39 78.085.16 -59.0 -1.43 -86.28 -113.20 31.96 79.545.21 -59.5 -1.44 -87.75 -115.01 32.55 81.145.26 -59.8 -1.45 -89.30 -116.82 33.14 82.705.31 -60.2 -1.46 -90.91 -118.84 33.74 84.285.36 -60.4 -1.47 -92.39 -120.58 34.33 85.815.41 -60.5 -1.48 -93.80 -122.20 34.91 87.335.46 -60.9 -1.50 -95.34 -124.01 35.53 88.965.51 -61.2 -1.51 -96.95 -125.89 36.15 90.625.56 -61.5 -1.52 -98.50 -127.84 36.78 92.275.61 -61.8 -1.52 -100.04 -129.72 37.41 93.965.66 -62.1 -1.54 -101.65 -131.60 38.08 95.745.71 -62.5 -1.55 -103.40 -133.61 38.75 97.515.76 -62.8 -1.56 -105.08 -135.56 39.41 99.325.81 -62.9 -1.57 -106.69 -137.44 40.07 101.135.86 -63.2 -1.58 -108.37 -139.52 40.76 102.985.91 -63.4 -1.59 -109.91 -141.26 41.42 104.795.96 -63.7 -1.60 -111.52 -143.35 42.15 106.726.01 -64.1 -1.61 -113.27 -145.43 42.87 108.706.06 -64.2 -1.62 -115.08 -147.44 43.57 110.686.11 -64.5 -1.63 -116.69 -149.46 44.32 112.716.16 -64.7 -1.64 -118.57 -151.60 45.05 114.746.21 -65.1 -1.65 -120.45 -153.95 45.82 116.896.26 -65.3 -1.66 -122.13 -156.04 46.60 119.096.31 -65.7 -1.67 -124.21 -158.38 47.38 121.296.36 -66.0 -1.69 -126.02 -160.73 48.21 123.666.41 -66.1 -1.70 -127.77 -162.75 49.01 125.926.46 -66.0 -1.71 -129.45 -164.76 49.76 128.096.51 -66.3 -1.71 -131.39 -166.91 50.61 130.496.56 -66.5 -1.73 -133.27 -169.26 51.41 132.896.61 -66.3 -1.73 -135.09 -171.28 52.20 135.126.66 -66.6 -1.75 -136.83 -173.49 53.05 137.596.71 -66.8 -1.75 -138.78 -175.71 53.89 140.066.76 -67.0 -1.77 -140.79 -178.06 54.76 142.66
Table F.5 IDT Strength Data (KL 58-40 #10), continued
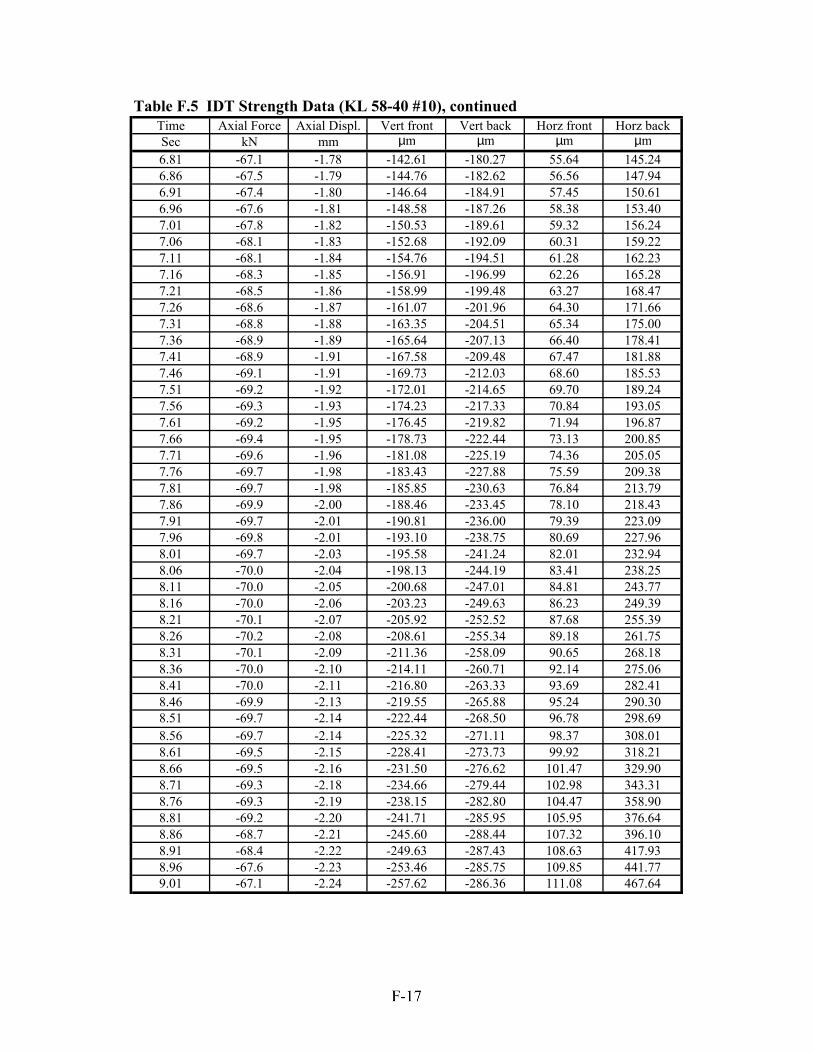
Time Axial Force Axial Displ. Vert front Vert back Horz front Horz backSec kN mm µm µm µm µm6.81 -67.1 -1.78 -142.61 -180.27 55.64 145.246.86 -67.5 -1.79 -144.76 -182.62 56.56 147.946.91 -67.4 -1.80 -146.64 -184.91 57.45 150.616.96 -67.6 -1.81 -148.58 -187.26 58.38 153.407.01 -67.8 -1.82 -150.53 -189.61 59.32 156.247.06 -68.1 -1.83 -152.68 -192.09 60.31 159.227.11 -68.1 -1.84 -154.76 -194.51 61.28 162.237.16 -68.3 -1.85 -156.91 -196.99 62.26 165.287.21 -68.5 -1.86 -158.99 -199.48 63.27 168.477.26 -68.6 -1.87 -161.07 -201.96 64.30 171.667.31 -68.8 -1.88 -163.35 -204.51 65.34 175.007.36 -68.9 -1.89 -165.64 -207.13 66.40 178.417.41 -68.9 -1.91 -167.58 -209.48 67.47 181.887.46 -69.1 -1.91 -169.73 -212.03 68.60 185.537.51 -69.2 -1.92 -172.01 -214.65 69.70 189.247.56 -69.3 -1.93 -174.23 -217.33 70.84 193.057.61 -69.2 -1.95 -176.45 -219.82 71.94 196.877.66 -69.4 -1.95 -178.73 -222.44 73.13 200.857.71 -69.6 -1.96 -181.08 -225.19 74.36 205.057.76 -69.7 -1.98 -183.43 -227.88 75.59 209.387.81 -69.7 -1.98 -185.85 -230.63 76.84 213.797.86 -69.9 -2.00 -188.46 -233.45 78.10 218.437.91 -69.7 -2.01 -190.81 -236.00 79.39 223.097.96 -69.8 -2.01 -193.10 -238.75 80.69 227.968.01 -69.7 -2.03 -195.58 -241.24 82.01 232.948.06 -70.0 -2.04 -198.13 -244.19 83.41 238.258.11 -70.0 -2.05 -200.68 -247.01 84.81 243.778.16 -70.0 -2.06 -203.23 -249.63 86.23 249.398.21 -70.1 -2.07 -205.92 -252.52 87.68 255.398.26 -70.2 -2.08 -208.61 -255.34 89.18 261.758.31 -70.1 -2.09 -211.36 -258.09 90.65 268.188.36 -70.0 -2.10 -214.11 -260.71 92.14 275.068.41 -70.0 -2.11 -216.80 -263.33 93.69 282.418.46 -69.9 -2.13 -219.55 -265.88 95.24 290.308.51 -69.7 -2.14 -222.44 -268.50 96.78 298.698.56 -69.7 -2.14 -225.32 -271.11 98.37 308.018.61 -69.5 -2.15 -228.41 -273.73 99.92 318.218.66 -69.5 -2.16 -231.50 -276.62 101.47 329.908.71 -69.3 -2.18 -234.66 -279.44 102.98 343.318.76 -69.3 -2.19 -238.15 -282.80 104.47 358.908.81 -69.2 -2.20 -241.71 -285.95 105.95 376.648.86 -68.7 -2.21 -245.60 -288.44 107.32 396.108.91 -68.4 -2.22 -249.63 -287.43 108.63 417.938.96 -67.6 -2.23 -253.46 -285.75 109.85 441.779.01 -67.1 -2.24 -257.62 -286.36 111.08 467.64
Table F.5 IDT Strength Data (KL 58-40 #10), continued
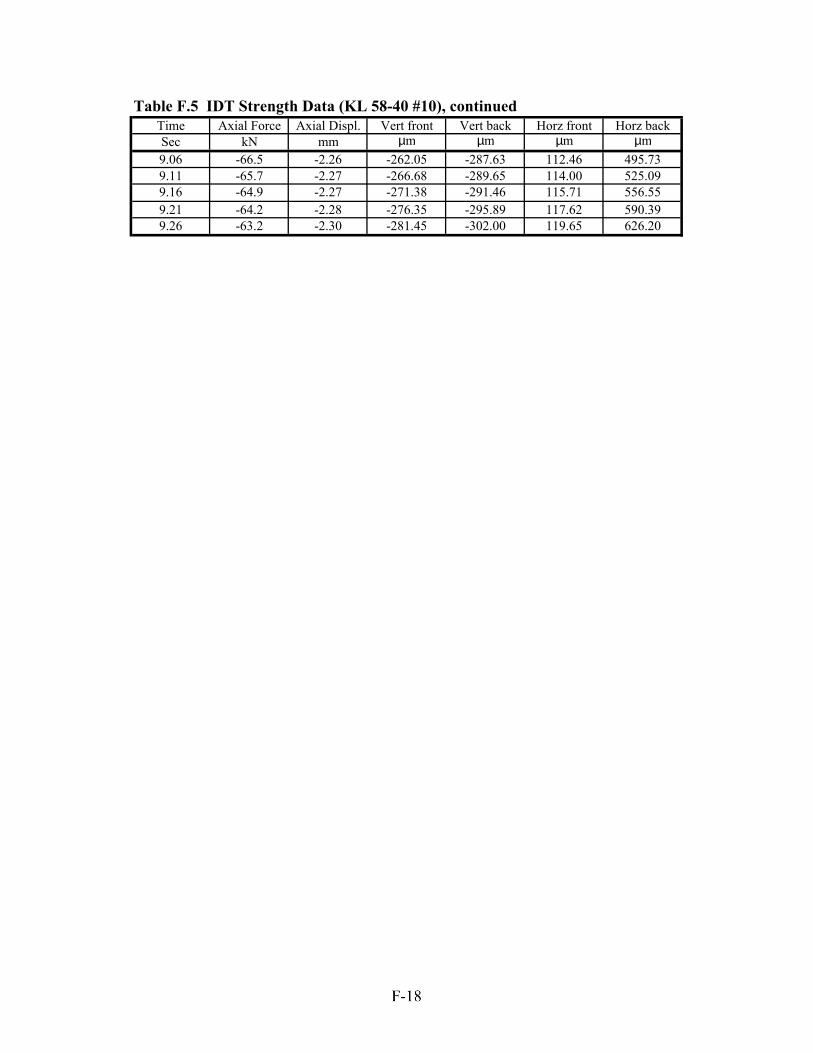
Time Axial Force Axial Displ. Vert front Vert back Horz front Horz backSec kN mm µm µm µm µm9.06 -66.5 -2.26 -262.05 -287.63 112.46 495.739.11 -65.7 -2.27 -266.68 -289.65 114.00 525.099.16 -64.9 -2.27 -271.38 -291.46 115.71 556.559.21 -64.2 -2.28 -276.35 -295.89 117.62 590.399.26 -63.2 -2.30 -281.45 -302.00 119.65 626.20
Table F.5 IDT Strength Data (KL 58-40 #10), continued
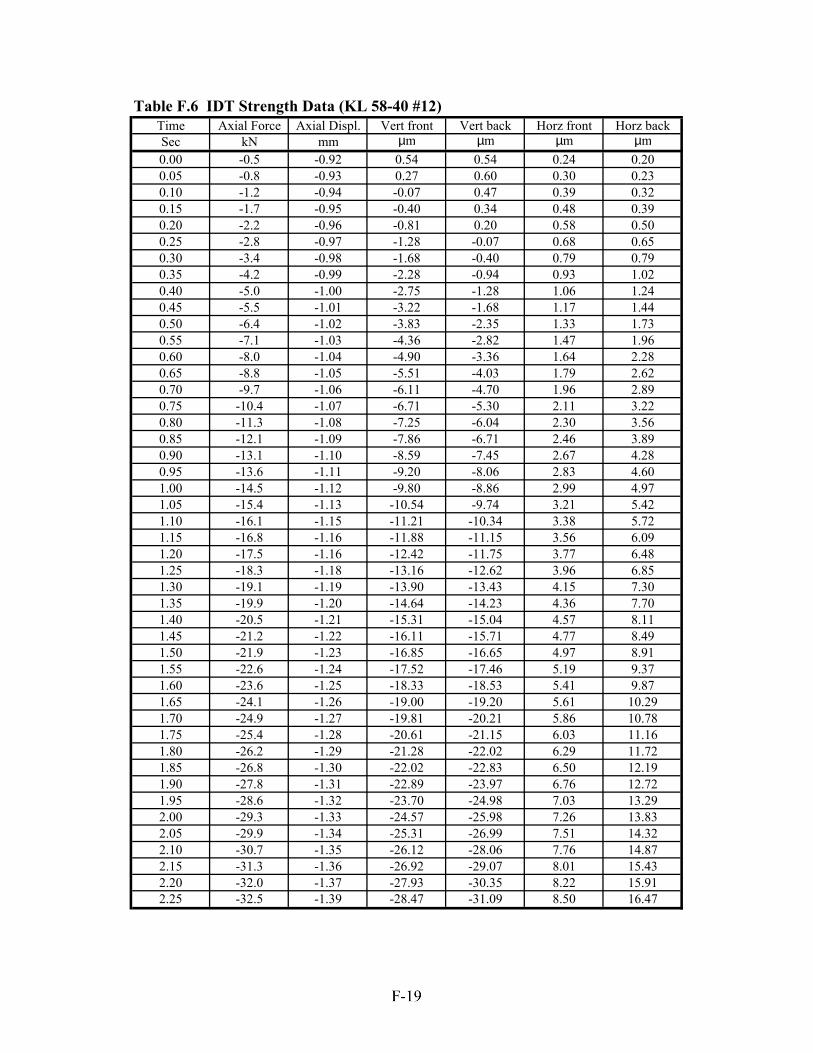
Time Axial Force Axial Displ. Vert front Vert back Horz front Horz backSec kN mm µm µm µm µm0.00 -0.5 -0.92 0.54 0.54 0.24 0.200.05 -0.8 -0.93 0.27 0.60 0.30 0.230.10 -1.2 -0.94 -0.07 0.47 0.39 0.320.15 -1.7 -0.95 -0.40 0.34 0.48 0.390.20 -2.2 -0.96 -0.81 0.20 0.58 0.500.25 -2.8 -0.97 -1.28 -0.07 0.68 0.650.30 -3.4 -0.98 -1.68 -0.40 0.79 0.790.35 -4.2 -0.99 -2.28 -0.94 0.93 1.020.40 -5.0 -1.00 -2.75 -1.28 1.06 1.240.45 -5.5 -1.01 -3.22 -1.68 1.17 1.440.50 -6.4 -1.02 -3.83 -2.35 1.33 1.730.55 -7.1 -1.03 -4.36 -2.82 1.47 1.960.60 -8.0 -1.04 -4.90 -3.36 1.64 2.280.65 -8.8 -1.05 -5.51 -4.03 1.79 2.620.70 -9.7 -1.06 -6.11 -4.70 1.96 2.890.75 -10.4 -1.07 -6.71 -5.30 2.11 3.220.80 -11.3 -1.08 -7.25 -6.04 2.30 3.560.85 -12.1 -1.09 -7.86 -6.71 2.46 3.890.90 -13.1 -1.10 -8.59 -7.45 2.67 4.280.95 -13.6 -1.11 -9.20 -8.06 2.83 4.601.00 -14.5 -1.12 -9.80 -8.86 2.99 4.971.05 -15.4 -1.13 -10.54 -9.74 3.21 5.421.10 -16.1 -1.15 -11.21 -10.34 3.38 5.721.15 -16.8 -1.16 -11.88 -11.15 3.56 6.091.20 -17.5 -1.16 -12.42 -11.75 3.77 6.481.25 -18.3 -1.18 -13.16 -12.62 3.96 6.851.30 -19.1 -1.19 -13.90 -13.43 4.15 7.301.35 -19.9 -1.20 -14.64 -14.23 4.36 7.701.40 -20.5 -1.21 -15.31 -15.04 4.57 8.111.45 -21.2 -1.22 -16.11 -15.71 4.77 8.491.50 -21.9 -1.23 -16.85 -16.65 4.97 8.911.55 -22.6 -1.24 -17.52 -17.46 5.19 9.371.60 -23.6 -1.25 -18.33 -18.53 5.41 9.871.65 -24.1 -1.26 -19.00 -19.20 5.61 10.291.70 -24.9 -1.27 -19.81 -20.21 5.86 10.781.75 -25.4 -1.28 -20.61 -21.15 6.03 11.161.80 -26.2 -1.29 -21.28 -22.02 6.29 11.721.85 -26.8 -1.30 -22.02 -22.83 6.50 12.191.90 -27.8 -1.31 -22.89 -23.97 6.76 12.721.95 -28.6 -1.32 -23.70 -24.98 7.03 13.292.00 -29.3 -1.33 -24.57 -25.98 7.26 13.832.05 -29.9 -1.34 -25.31 -26.99 7.51 14.322.10 -30.7 -1.35 -26.12 -28.06 7.76 14.872.15 -31.3 -1.36 -26.92 -29.07 8.01 15.432.20 -32.0 -1.37 -27.93 -30.35 8.22 15.912.25 -32.5 -1.39 -28.47 -31.09 8.50 16.47
Table F.6 IDT Strength Data (KL 58-40 #12)

Time Axial Force Axial Displ. Vert front Vert back Horz front Horz backSec kN mm µm µm µm µm2.30 -33.1 -1.40 -29.27 -32.09 8.73 16.992.35 -34.0 -1.40 -30.15 -33.10 9.04 17.712.40 -34.7 -1.42 -31.22 -34.58 9.30 18.262.45 -35.2 -1.43 -31.96 -35.58 9.55 18.852.50 -36.0 -1.44 -32.90 -36.66 9.84 19.492.55 -36.7 -1.45 -33.91 -37.87 10.13 20.092.60 -37.2 -1.46 -34.78 -39.01 10.38 20.712.65 -37.9 -1.47 -35.72 -40.15 10.68 21.372.70 -38.4 -1.48 -36.46 -41.36 10.96 21.972.75 -39.0 -1.49 -37.40 -42.50 11.23 22.612.80 -39.7 -1.50 -38.34 -43.71 11.53 23.282.85 -40.4 -1.51 -39.21 -44.98 11.85 23.992.90 -40.7 -1.52 -40.08 -46.13 12.11 24.572.95 -41.5 -1.53 -41.22 -47.54 12.42 25.263.00 -42.2 -1.54 -42.16 -48.74 12.73 26.023.05 -42.8 -1.55 -43.17 -50.02 13.04 26.723.10 -43.4 -1.56 -44.25 -51.43 13.36 27.443.15 -43.8 -1.57 -45.05 -52.57 13.64 28.153.20 -44.5 -1.58 -46.19 -53.91 13.97 29.243.25 -44.9 -1.59 -47.13 -55.19 14.28 29.943.30 -45.6 -1.60 -48.14 -56.40 14.61 30.753.35 -46.5 -1.61 -49.42 -58.14 14.96 31.593.40 -46.9 -1.62 -50.49 -59.35 15.29 32.363.45 -47.4 -1.63 -51.50 -60.70 15.63 33.623.50 -48.1 -1.64 -52.64 -62.24 15.98 34.863.55 -48.7 -1.65 -53.78 -63.78 16.33 35.803.60 -49.1 -1.66 -54.92 -65.19 16.68 36.633.65 -49.7 -1.67 -56.00 -66.54 17.03 37.483.70 -50.0 -1.69 -57.20 -68.08 17.36 38.273.75 -50.4 -1.70 -58.21 -69.42 17.68 39.083.80 -51.0 -1.71 -59.42 -70.90 18.04 39.933.85 -51.5 -1.72 -60.49 -72.44 18.40 40.773.90 -52.2 -1.72 -61.77 -73.99 18.80 41.733.95 -52.7 -1.74 -62.91 -75.60 19.18 42.624.00 -53.2 -1.75 -64.19 -77.14 19.55 43.474.05 -53.6 -1.76 -65.46 -78.55 19.92 44.314.10 -54.0 -1.76 -66.67 -80.17 20.29 45.154.15 -54.5 -1.78 -67.81 -81.58 20.67 46.024.20 -55.1 -1.79 -69.15 -83.32 21.11 47.004.25 -55.7 -1.80 -70.50 -85.00 21.51 47.904.30 -56.2 -1.81 -71.77 -86.95 21.92 48.904.35 -56.6 -1.82 -72.98 -88.36 22.35 49.894.40 -56.9 -1.83 -74.26 -89.90 22.75 50.764.45 -57.5 -1.84 -75.67 -91.71 23.18 51.804.50 -57.8 -1.85 -76.94 -93.39 23.62 52.76
Table F.6 IDT Strength Data (KL 58-40 #12), continued
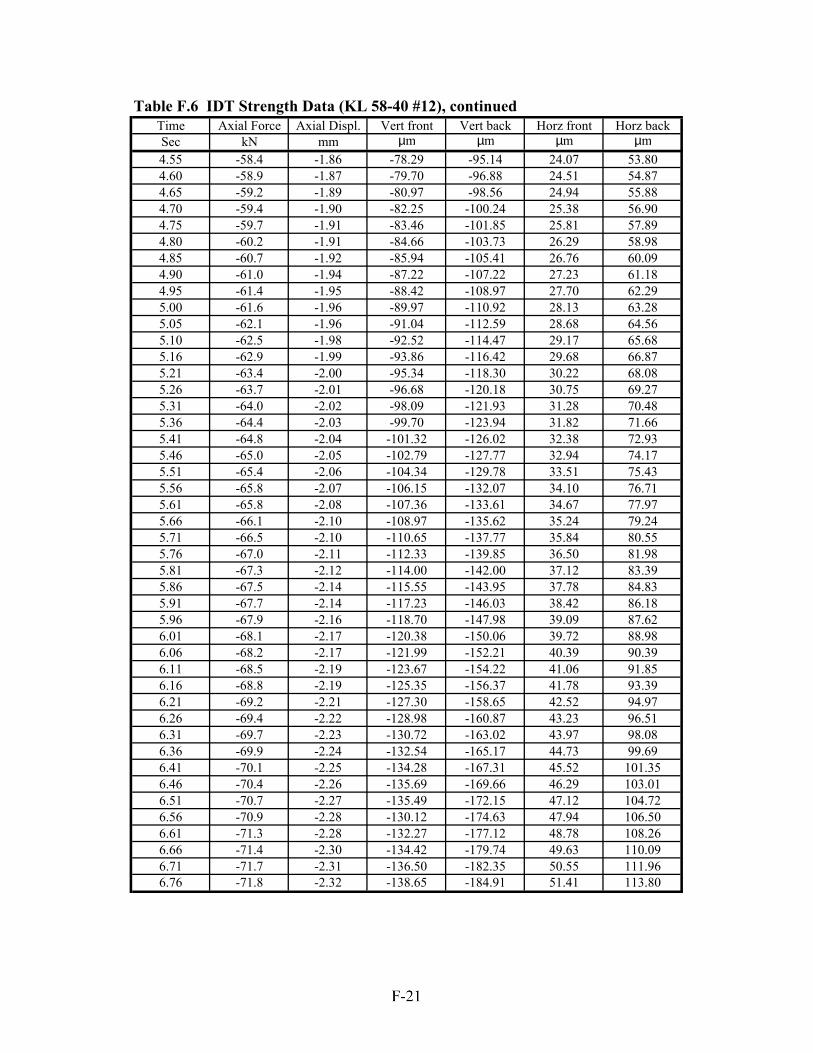
Time Axial Force Axial Displ. Vert front Vert back Horz front Horz backSec kN mm µm µm µm µm4.55 -58.4 -1.86 -78.29 -95.14 24.07 53.804.60 -58.9 -1.87 -79.70 -96.88 24.51 54.874.65 -59.2 -1.89 -80.97 -98.56 24.94 55.884.70 -59.4 -1.90 -82.25 -100.24 25.38 56.904.75 -59.7 -1.91 -83.46 -101.85 25.81 57.894.80 -60.2 -1.91 -84.66 -103.73 26.29 58.984.85 -60.7 -1.92 -85.94 -105.41 26.76 60.094.90 -61.0 -1.94 -87.22 -107.22 27.23 61.184.95 -61.4 -1.95 -88.42 -108.97 27.70 62.295.00 -61.6 -1.96 -89.97 -110.92 28.13 63.285.05 -62.1 -1.96 -91.04 -112.59 28.68 64.565.10 -62.5 -1.98 -92.52 -114.47 29.17 65.685.16 -62.9 -1.99 -93.86 -116.42 29.68 66.875.21 -63.4 -2.00 -95.34 -118.30 30.22 68.085.26 -63.7 -2.01 -96.68 -120.18 30.75 69.275.31 -64.0 -2.02 -98.09 -121.93 31.28 70.485.36 -64.4 -2.03 -99.70 -123.94 31.82 71.665.41 -64.8 -2.04 -101.32 -126.02 32.38 72.935.46 -65.0 -2.05 -102.79 -127.77 32.94 74.175.51 -65.4 -2.06 -104.34 -129.78 33.51 75.435.56 -65.8 -2.07 -106.15 -132.07 34.10 76.715.61 -65.8 -2.08 -107.36 -133.61 34.67 77.975.66 -66.1 -2.10 -108.97 -135.62 35.24 79.245.71 -66.5 -2.10 -110.65 -137.77 35.84 80.555.76 -67.0 -2.11 -112.33 -139.85 36.50 81.985.81 -67.3 -2.12 -114.00 -142.00 37.12 83.395.86 -67.5 -2.14 -115.55 -143.95 37.78 84.835.91 -67.7 -2.14 -117.23 -146.03 38.42 86.185.96 -67.9 -2.16 -118.70 -147.98 39.09 87.626.01 -68.1 -2.17 -120.38 -150.06 39.72 88.986.06 -68.2 -2.17 -121.99 -152.21 40.39 90.396.11 -68.5 -2.19 -123.67 -154.22 41.06 91.856.16 -68.8 -2.19 -125.35 -156.37 41.78 93.396.21 -69.2 -2.21 -127.30 -158.65 42.52 94.976.26 -69.4 -2.22 -128.98 -160.87 43.23 96.516.31 -69.7 -2.23 -130.72 -163.02 43.97 98.086.36 -69.9 -2.24 -132.54 -165.17 44.73 99.696.41 -70.1 -2.25 -134.28 -167.31 45.52 101.356.46 -70.4 -2.26 -135.69 -169.66 46.29 103.016.51 -70.7 -2.27 -135.49 -172.15 47.12 104.726.56 -70.9 -2.28 -130.12 -174.63 47.94 106.506.61 -71.3 -2.28 -132.27 -177.12 48.78 108.266.66 -71.4 -2.30 -134.42 -179.74 49.63 110.096.71 -71.7 -2.31 -136.50 -182.35 50.55 111.966.76 -71.8 -2.32 -138.65 -184.91 51.41 113.80
Table F.6 IDT Strength Data (KL 58-40 #12), continued
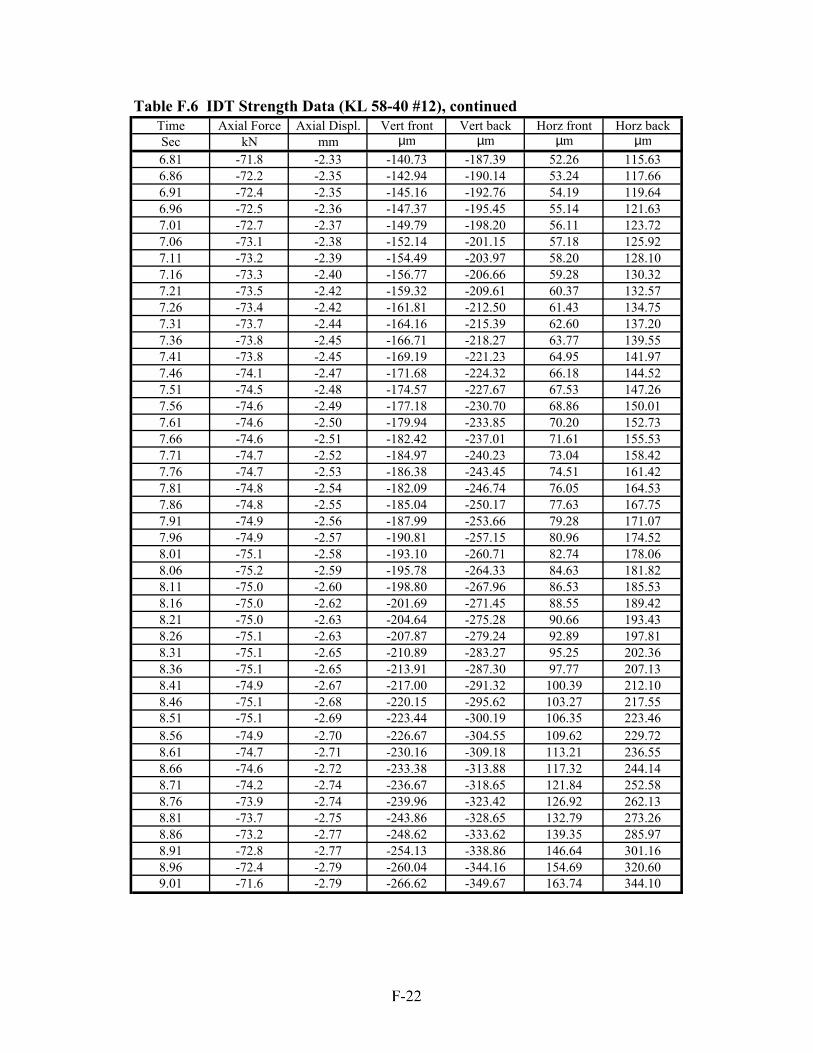
Time Axial Force Axial Displ. Vert front Vert back Horz front Horz backSec kN mm µm µm µm µm6.81 -71.8 -2.33 -140.73 -187.39 52.26 115.636.86 -72.2 -2.35 -142.94 -190.14 53.24 117.666.91 -72.4 -2.35 -145.16 -192.76 54.19 119.646.96 -72.5 -2.36 -147.37 -195.45 55.14 121.637.01 -72.7 -2.37 -149.79 -198.20 56.11 123.727.06 -73.1 -2.38 -152.14 -201.15 57.18 125.927.11 -73.2 -2.39 -154.49 -203.97 58.20 128.107.16 -73.3 -2.40 -156.77 -206.66 59.28 130.327.21 -73.5 -2.42 -159.32 -209.61 60.37 132.577.26 -73.4 -2.42 -161.81 -212.50 61.43 134.757.31 -73.7 -2.44 -164.16 -215.39 62.60 137.207.36 -73.8 -2.45 -166.71 -218.27 63.77 139.557.41 -73.8 -2.45 -169.19 -221.23 64.95 141.977.46 -74.1 -2.47 -171.68 -224.32 66.18 144.527.51 -74.5 -2.48 -174.57 -227.67 67.53 147.267.56 -74.6 -2.49 -177.18 -230.70 68.86 150.017.61 -74.6 -2.50 -179.94 -233.85 70.20 152.737.66 -74.6 -2.51 -182.42 -237.01 71.61 155.537.71 -74.7 -2.52 -184.97 -240.23 73.04 158.427.76 -74.7 -2.53 -186.38 -243.45 74.51 161.427.81 -74.8 -2.54 -182.09 -246.74 76.05 164.537.86 -74.8 -2.55 -185.04 -250.17 77.63 167.757.91 -74.9 -2.56 -187.99 -253.66 79.28 171.077.96 -74.9 -2.57 -190.81 -257.15 80.96 174.528.01 -75.1 -2.58 -193.10 -260.71 82.74 178.068.06 -75.2 -2.59 -195.78 -264.33 84.63 181.828.11 -75.0 -2.60 -198.80 -267.96 86.53 185.538.16 -75.0 -2.62 -201.69 -271.45 88.55 189.428.21 -75.0 -2.63 -204.64 -275.28 90.66 193.438.26 -75.1 -2.63 -207.87 -279.24 92.89 197.818.31 -75.1 -2.65 -210.89 -283.27 95.25 202.368.36 -75.1 -2.65 -213.91 -287.30 97.77 207.138.41 -74.9 -2.67 -217.00 -291.32 100.39 212.108.46 -75.1 -2.68 -220.15 -295.62 103.27 217.558.51 -75.1 -2.69 -223.44 -300.19 106.35 223.468.56 -74.9 -2.70 -226.67 -304.55 109.62 229.728.61 -74.7 -2.71 -230.16 -309.18 113.21 236.558.66 -74.6 -2.72 -233.38 -313.88 117.32 244.148.71 -74.2 -2.74 -236.67 -318.65 121.84 252.588.76 -73.9 -2.74 -239.96 -323.42 126.92 262.138.81 -73.7 -2.75 -243.86 -328.65 132.79 273.268.86 -73.2 -2.77 -248.62 -333.62 139.35 285.978.91 -72.8 -2.77 -254.13 -338.86 146.64 301.168.96 -72.4 -2.79 -260.04 -344.16 154.69 320.609.01 -71.6 -2.79 -266.62 -349.67 163.74 344.10
Table F.6 IDT Strength Data (KL 58-40 #12), continued
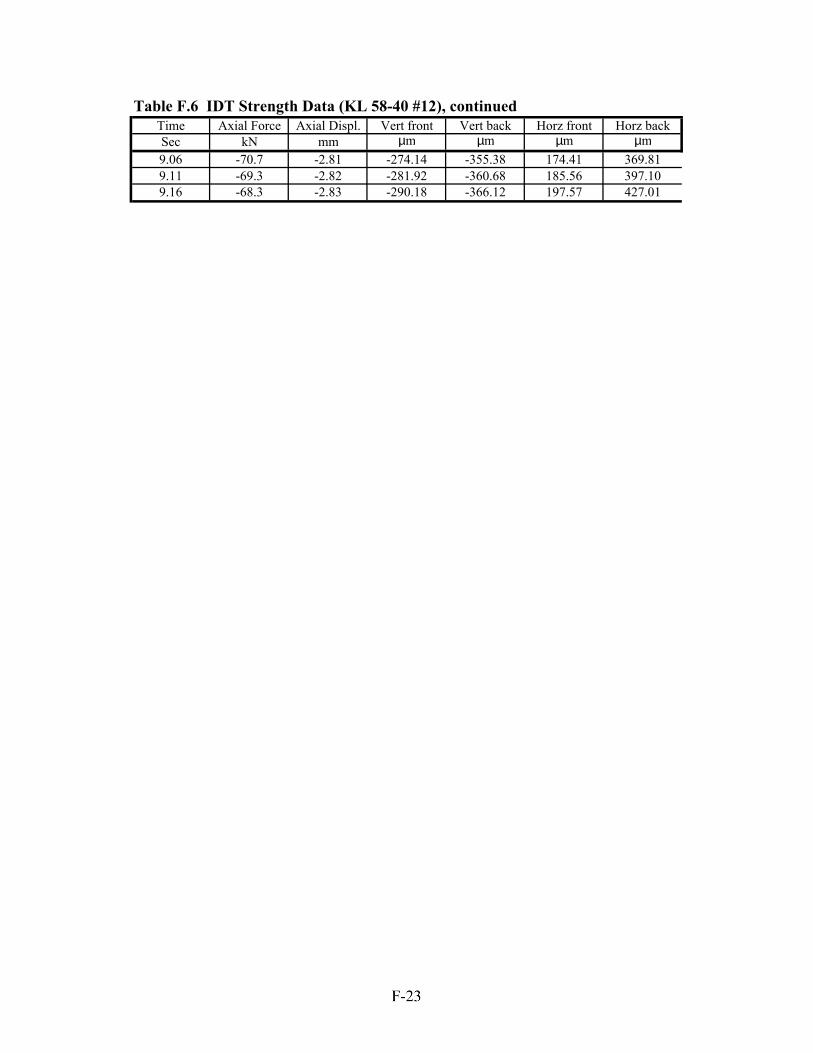
Time Axial Force Axial Displ. Vert front Vert back Horz front Horz backSec kN mm µm µm µm µm9.06 -70.7 -2.81 -274.14 -355.38 174.41 369.819.11 -69.3 -2.82 -281.92 -360.68 185.56 397.109.16 -68.3 -2.83 -290.18 -366.12 197.57 427.01
Table F.6 IDT Strength Data (KL 58-40 #12), continued
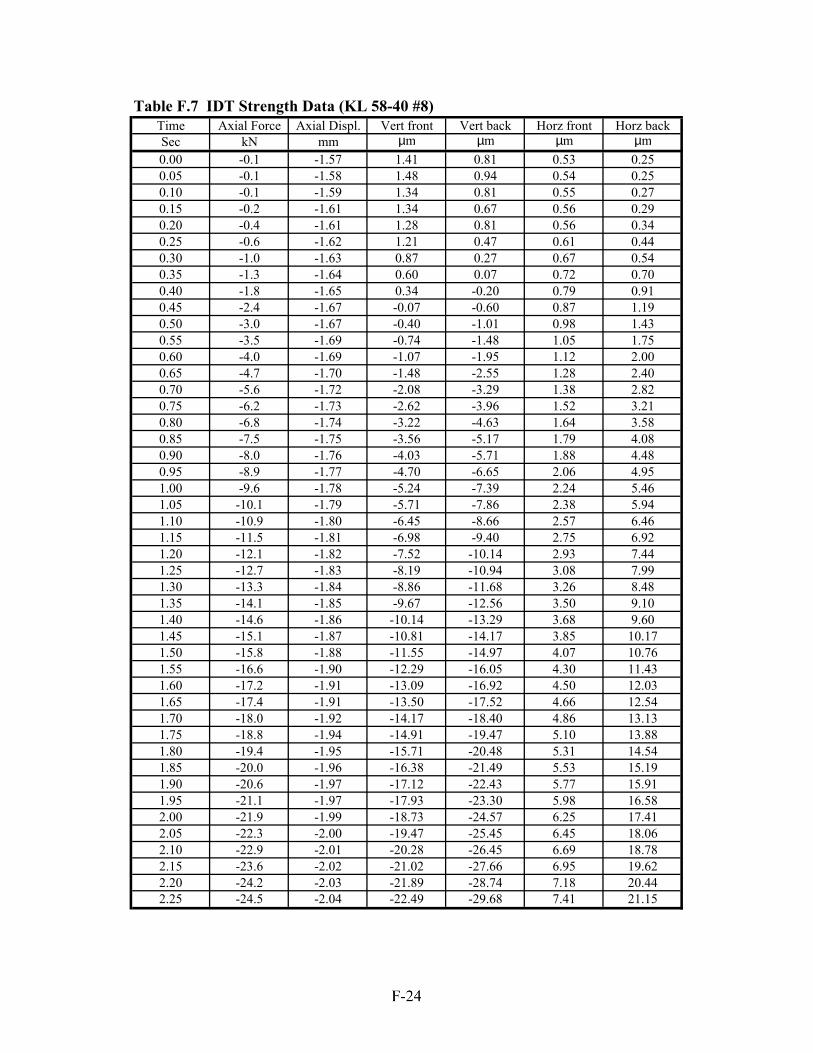
Time Axial Force Axial Displ. Vert front Vert back Horz front Horz backSec kN mm µm µm µm µm0.00 -0.1 -1.57 1.41 0.81 0.53 0.250.05 -0.1 -1.58 1.48 0.94 0.54 0.250.10 -0.1 -1.59 1.34 0.81 0.55 0.270.15 -0.2 -1.61 1.34 0.67 0.56 0.290.20 -0.4 -1.61 1.28 0.81 0.56 0.340.25 -0.6 -1.62 1.21 0.47 0.61 0.440.30 -1.0 -1.63 0.87 0.27 0.67 0.540.35 -1.3 -1.64 0.60 0.07 0.72 0.700.40 -1.8 -1.65 0.34 -0.20 0.79 0.910.45 -2.4 -1.67 -0.07 -0.60 0.87 1.190.50 -3.0 -1.67 -0.40 -1.01 0.98 1.430.55 -3.5 -1.69 -0.74 -1.48 1.05 1.750.60 -4.0 -1.69 -1.07 -1.95 1.12 2.000.65 -4.7 -1.70 -1.48 -2.55 1.28 2.400.70 -5.6 -1.72 -2.08 -3.29 1.38 2.820.75 -6.2 -1.73 -2.62 -3.96 1.52 3.210.80 -6.8 -1.74 -3.22 -4.63 1.64 3.580.85 -7.5 -1.75 -3.56 -5.17 1.79 4.080.90 -8.0 -1.76 -4.03 -5.71 1.88 4.480.95 -8.9 -1.77 -4.70 -6.65 2.06 4.951.00 -9.6 -1.78 -5.24 -7.39 2.24 5.461.05 -10.1 -1.79 -5.71 -7.86 2.38 5.941.10 -10.9 -1.80 -6.45 -8.66 2.57 6.461.15 -11.5 -1.81 -6.98 -9.40 2.75 6.921.20 -12.1 -1.82 -7.52 -10.14 2.93 7.441.25 -12.7 -1.83 -8.19 -10.94 3.08 7.991.30 -13.3 -1.84 -8.86 -11.68 3.26 8.481.35 -14.1 -1.85 -9.67 -12.56 3.50 9.101.40 -14.6 -1.86 -10.14 -13.29 3.68 9.601.45 -15.1 -1.87 -10.81 -14.17 3.85 10.171.50 -15.8 -1.88 -11.55 -14.97 4.07 10.761.55 -16.6 -1.90 -12.29 -16.05 4.30 11.431.60 -17.2 -1.91 -13.09 -16.92 4.50 12.031.65 -17.4 -1.91 -13.50 -17.52 4.66 12.541.70 -18.0 -1.92 -14.17 -18.40 4.86 13.131.75 -18.8 -1.94 -14.91 -19.47 5.10 13.881.80 -19.4 -1.95 -15.71 -20.48 5.31 14.541.85 -20.0 -1.96 -16.38 -21.49 5.53 15.191.90 -20.6 -1.97 -17.12 -22.43 5.77 15.911.95 -21.1 -1.97 -17.93 -23.30 5.98 16.582.00 -21.9 -1.99 -18.73 -24.57 6.25 17.412.05 -22.3 -2.00 -19.47 -25.45 6.45 18.062.10 -22.9 -2.01 -20.28 -26.45 6.69 18.782.15 -23.6 -2.02 -21.02 -27.66 6.95 19.622.20 -24.2 -2.03 -21.89 -28.74 7.18 20.442.25 -24.5 -2.04 -22.49 -29.68 7.41 21.15
Table F.7 IDT Strength Data (KL 58-40 #8)
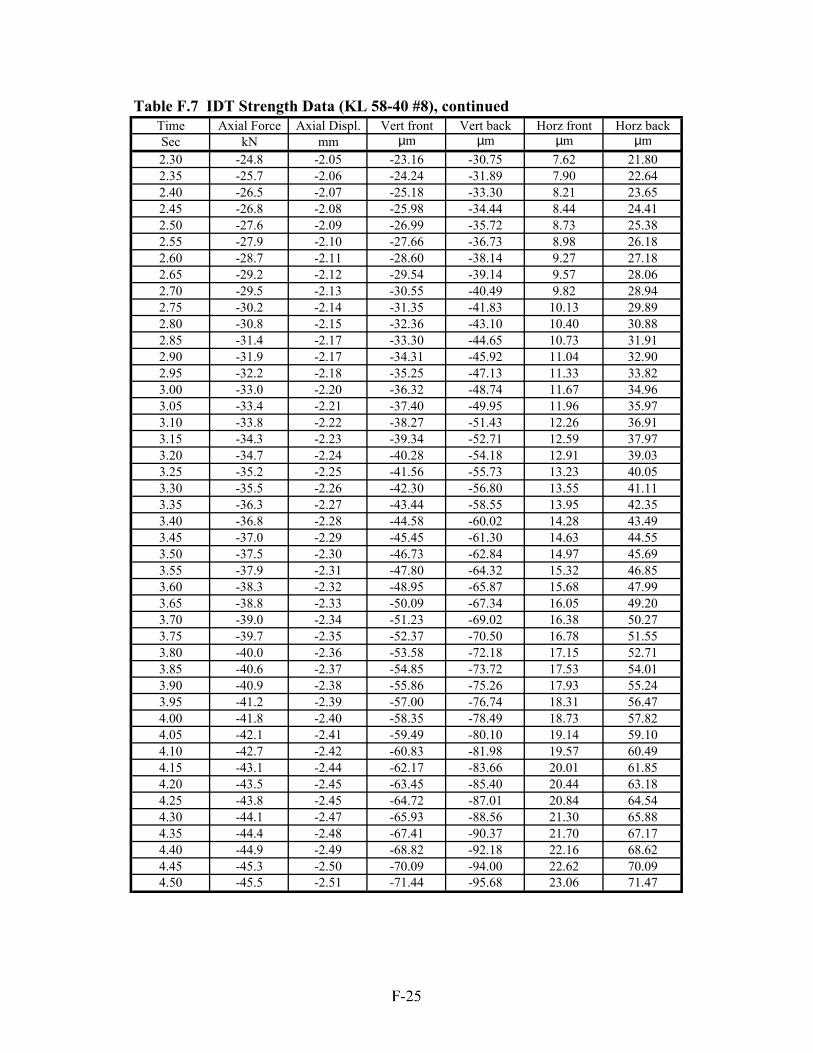
Time Axial Force Axial Displ. Vert front Vert back Horz front Horz backSec kN mm µm µm µm µm2.30 -24.8 -2.05 -23.16 -30.75 7.62 21.802.35 -25.7 -2.06 -24.24 -31.89 7.90 22.642.40 -26.5 -2.07 -25.18 -33.30 8.21 23.652.45 -26.8 -2.08 -25.98 -34.44 8.44 24.412.50 -27.6 -2.09 -26.99 -35.72 8.73 25.382.55 -27.9 -2.10 -27.66 -36.73 8.98 26.182.60 -28.7 -2.11 -28.60 -38.14 9.27 27.182.65 -29.2 -2.12 -29.54 -39.14 9.57 28.062.70 -29.5 -2.13 -30.55 -40.49 9.82 28.942.75 -30.2 -2.14 -31.35 -41.83 10.13 29.892.80 -30.8 -2.15 -32.36 -43.10 10.40 30.882.85 -31.4 -2.17 -33.30 -44.65 10.73 31.912.90 -31.9 -2.17 -34.31 -45.92 11.04 32.902.95 -32.2 -2.18 -35.25 -47.13 11.33 33.823.00 -33.0 -2.20 -36.32 -48.74 11.67 34.963.05 -33.4 -2.21 -37.40 -49.95 11.96 35.973.10 -33.8 -2.22 -38.27 -51.43 12.26 36.913.15 -34.3 -2.23 -39.34 -52.71 12.59 37.973.20 -34.7 -2.24 -40.28 -54.18 12.91 39.033.25 -35.2 -2.25 -41.56 -55.73 13.23 40.053.30 -35.5 -2.26 -42.30 -56.80 13.55 41.113.35 -36.3 -2.27 -43.44 -58.55 13.95 42.353.40 -36.8 -2.28 -44.58 -60.02 14.28 43.493.45 -37.0 -2.29 -45.45 -61.30 14.63 44.553.50 -37.5 -2.30 -46.73 -62.84 14.97 45.693.55 -37.9 -2.31 -47.80 -64.32 15.32 46.853.60 -38.3 -2.32 -48.95 -65.87 15.68 47.993.65 -38.8 -2.33 -50.09 -67.34 16.05 49.203.70 -39.0 -2.34 -51.23 -69.02 16.38 50.273.75 -39.7 -2.35 -52.37 -70.50 16.78 51.553.80 -40.0 -2.36 -53.58 -72.18 17.15 52.713.85 -40.6 -2.37 -54.85 -73.72 17.53 54.013.90 -40.9 -2.38 -55.86 -75.26 17.93 55.243.95 -41.2 -2.39 -57.00 -76.74 18.31 56.474.00 -41.8 -2.40 -58.35 -78.49 18.73 57.824.05 -42.1 -2.41 -59.49 -80.10 19.14 59.104.10 -42.7 -2.42 -60.83 -81.98 19.57 60.494.15 -43.1 -2.44 -62.17 -83.66 20.01 61.854.20 -43.5 -2.45 -63.45 -85.40 20.44 63.184.25 -43.8 -2.45 -64.72 -87.01 20.84 64.544.30 -44.1 -2.47 -65.93 -88.56 21.30 65.884.35 -44.4 -2.48 -67.41 -90.37 21.70 67.174.40 -44.9 -2.49 -68.82 -92.18 22.16 68.624.45 -45.3 -2.50 -70.09 -94.00 22.62 70.094.50 -45.5 -2.51 -71.44 -95.68 23.06 71.47
Table F.7 IDT Strength Data (KL 58-40 #8), continued
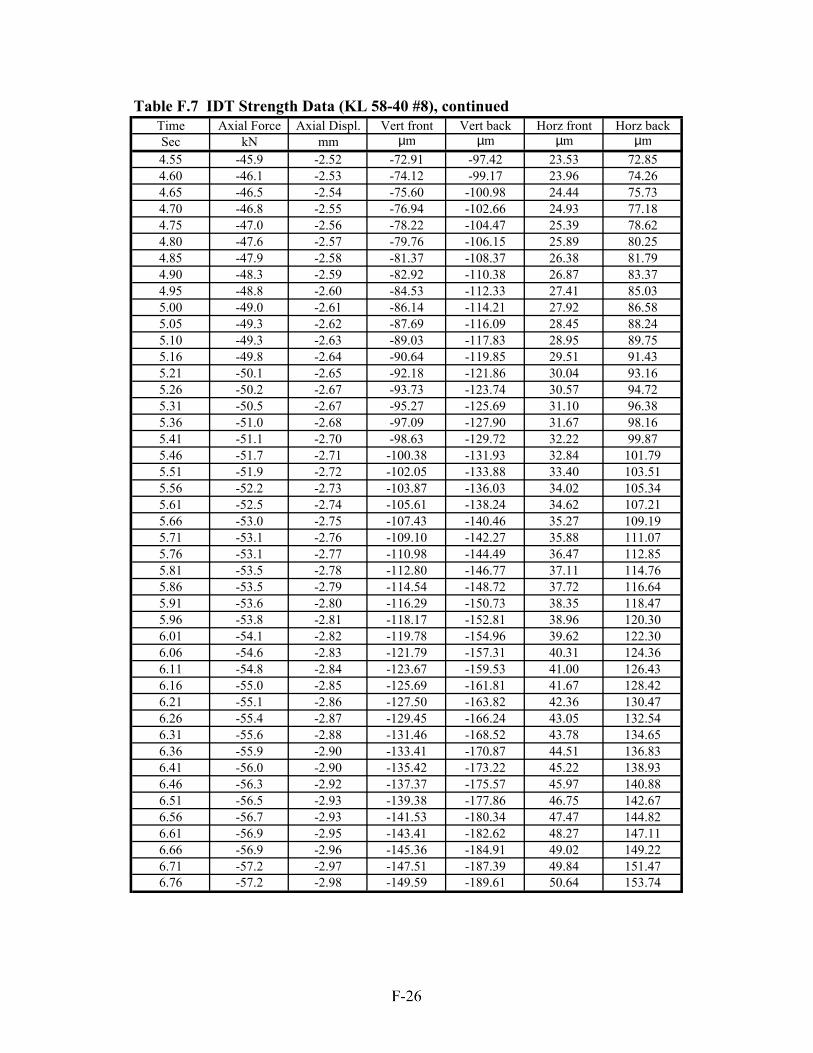
Time Axial Force Axial Displ. Vert front Vert back Horz front Horz backSec kN mm µm µm µm µm4.55 -45.9 -2.52 -72.91 -97.42 23.53 72.854.60 -46.1 -2.53 -74.12 -99.17 23.96 74.264.65 -46.5 -2.54 -75.60 -100.98 24.44 75.734.70 -46.8 -2.55 -76.94 -102.66 24.93 77.184.75 -47.0 -2.56 -78.22 -104.47 25.39 78.624.80 -47.6 -2.57 -79.76 -106.15 25.89 80.254.85 -47.9 -2.58 -81.37 -108.37 26.38 81.794.90 -48.3 -2.59 -82.92 -110.38 26.87 83.374.95 -48.8 -2.60 -84.53 -112.33 27.41 85.035.00 -49.0 -2.61 -86.14 -114.21 27.92 86.585.05 -49.3 -2.62 -87.69 -116.09 28.45 88.245.10 -49.3 -2.63 -89.03 -117.83 28.95 89.755.16 -49.8 -2.64 -90.64 -119.85 29.51 91.435.21 -50.1 -2.65 -92.18 -121.86 30.04 93.165.26 -50.2 -2.67 -93.73 -123.74 30.57 94.725.31 -50.5 -2.67 -95.27 -125.69 31.10 96.385.36 -51.0 -2.68 -97.09 -127.90 31.67 98.165.41 -51.1 -2.70 -98.63 -129.72 32.22 99.875.46 -51.7 -2.71 -100.38 -131.93 32.84 101.795.51 -51.9 -2.72 -102.05 -133.88 33.40 103.515.56 -52.2 -2.73 -103.87 -136.03 34.02 105.345.61 -52.5 -2.74 -105.61 -138.24 34.62 107.215.66 -53.0 -2.75 -107.43 -140.46 35.27 109.195.71 -53.1 -2.76 -109.10 -142.27 35.88 111.075.76 -53.1 -2.77 -110.98 -144.49 36.47 112.855.81 -53.5 -2.78 -112.80 -146.77 37.11 114.765.86 -53.5 -2.79 -114.54 -148.72 37.72 116.645.91 -53.6 -2.80 -116.29 -150.73 38.35 118.475.96 -53.8 -2.81 -118.17 -152.81 38.96 120.306.01 -54.1 -2.82 -119.78 -154.96 39.62 122.306.06 -54.6 -2.83 -121.79 -157.31 40.31 124.366.11 -54.8 -2.84 -123.67 -159.53 41.00 126.436.16 -55.0 -2.85 -125.69 -161.81 41.67 128.426.21 -55.1 -2.86 -127.50 -163.82 42.36 130.476.26 -55.4 -2.87 -129.45 -166.24 43.05 132.546.31 -55.6 -2.88 -131.46 -168.52 43.78 134.656.36 -55.9 -2.90 -133.41 -170.87 44.51 136.836.41 -56.0 -2.90 -135.42 -173.22 45.22 138.936.46 -56.3 -2.92 -137.37 -175.57 45.97 140.886.51 -56.5 -2.93 -139.38 -177.86 46.75 142.676.56 -56.7 -2.93 -141.53 -180.34 47.47 144.826.61 -56.9 -2.95 -143.41 -182.62 48.27 147.116.66 -56.9 -2.96 -145.36 -184.91 49.02 149.226.71 -57.2 -2.97 -147.51 -187.39 49.84 151.476.76 -57.2 -2.98 -149.59 -189.61 50.64 153.74
Table F.7 IDT Strength Data (KL 58-40 #8), continued
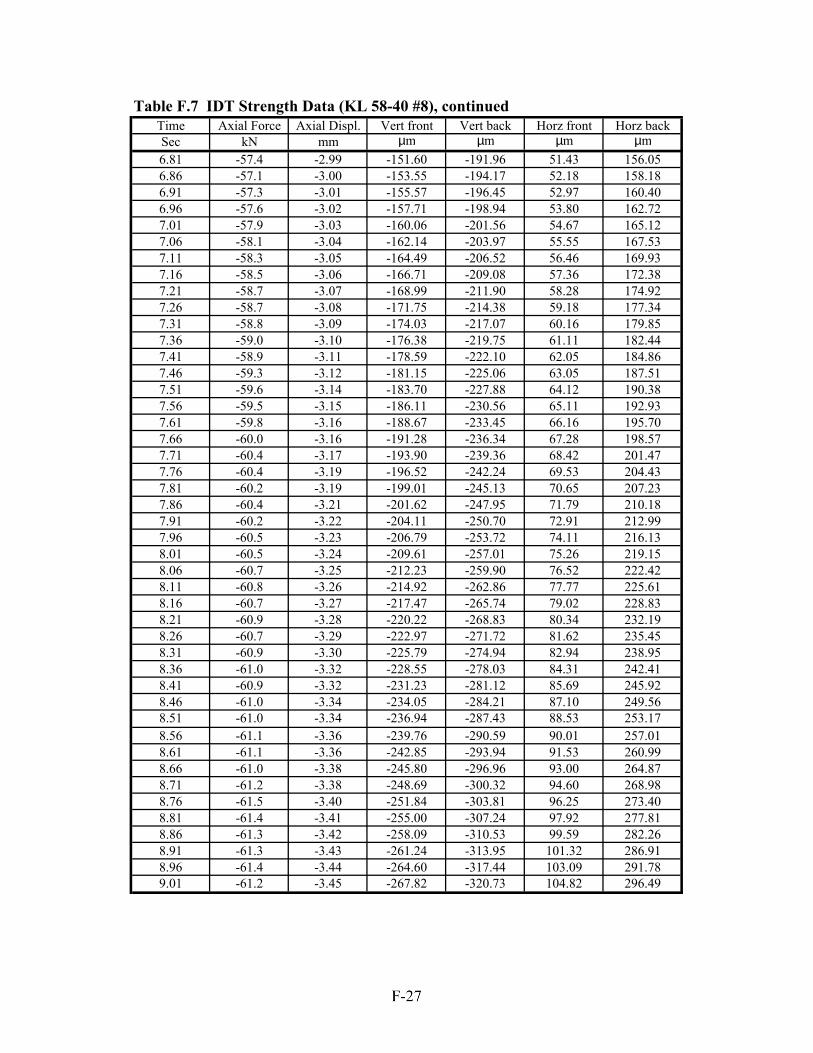
Time Axial Force Axial Displ. Vert front Vert back Horz front Horz backSec kN mm µm µm µm µm6.81 -57.4 -2.99 -151.60 -191.96 51.43 156.056.86 -57.1 -3.00 -153.55 -194.17 52.18 158.186.91 -57.3 -3.01 -155.57 -196.45 52.97 160.406.96 -57.6 -3.02 -157.71 -198.94 53.80 162.727.01 -57.9 -3.03 -160.06 -201.56 54.67 165.127.06 -58.1 -3.04 -162.14 -203.97 55.55 167.537.11 -58.3 -3.05 -164.49 -206.52 56.46 169.937.16 -58.5 -3.06 -166.71 -209.08 57.36 172.387.21 -58.7 -3.07 -168.99 -211.90 58.28 174.927.26 -58.7 -3.08 -171.75 -214.38 59.18 177.347.31 -58.8 -3.09 -174.03 -217.07 60.16 179.857.36 -59.0 -3.10 -176.38 -219.75 61.11 182.447.41 -58.9 -3.11 -178.59 -222.10 62.05 184.867.46 -59.3 -3.12 -181.15 -225.06 63.05 187.517.51 -59.6 -3.14 -183.70 -227.88 64.12 190.387.56 -59.5 -3.15 -186.11 -230.56 65.11 192.937.61 -59.8 -3.16 -188.67 -233.45 66.16 195.707.66 -60.0 -3.16 -191.28 -236.34 67.28 198.577.71 -60.4 -3.17 -193.90 -239.36 68.42 201.477.76 -60.4 -3.19 -196.52 -242.24 69.53 204.437.81 -60.2 -3.19 -199.01 -245.13 70.65 207.237.86 -60.4 -3.21 -201.62 -247.95 71.79 210.187.91 -60.2 -3.22 -204.11 -250.70 72.91 212.997.96 -60.5 -3.23 -206.79 -253.72 74.11 216.138.01 -60.5 -3.24 -209.61 -257.01 75.26 219.158.06 -60.7 -3.25 -212.23 -259.90 76.52 222.428.11 -60.8 -3.26 -214.92 -262.86 77.77 225.618.16 -60.7 -3.27 -217.47 -265.74 79.02 228.838.21 -60.9 -3.28 -220.22 -268.83 80.34 232.198.26 -60.7 -3.29 -222.97 -271.72 81.62 235.458.31 -60.9 -3.30 -225.79 -274.94 82.94 238.958.36 -61.0 -3.32 -228.55 -278.03 84.31 242.418.41 -60.9 -3.32 -231.23 -281.12 85.69 245.928.46 -61.0 -3.34 -234.05 -284.21 87.10 249.568.51 -61.0 -3.34 -236.94 -287.43 88.53 253.178.56 -61.1 -3.36 -239.76 -290.59 90.01 257.018.61 -61.1 -3.36 -242.85 -293.94 91.53 260.998.66 -61.0 -3.38 -245.80 -296.96 93.00 264.878.71 -61.2 -3.38 -248.69 -300.32 94.60 268.988.76 -61.5 -3.40 -251.84 -303.81 96.25 273.408.81 -61.4 -3.41 -255.00 -307.24 97.92 277.818.86 -61.3 -3.42 -258.09 -310.53 99.59 282.268.91 -61.3 -3.43 -261.24 -313.95 101.32 286.918.96 -61.4 -3.44 -264.60 -317.44 103.09 291.789.01 -61.2 -3.45 -267.82 -320.73 104.82 296.49
Table F.7 IDT Strength Data (KL 58-40 #8), continued
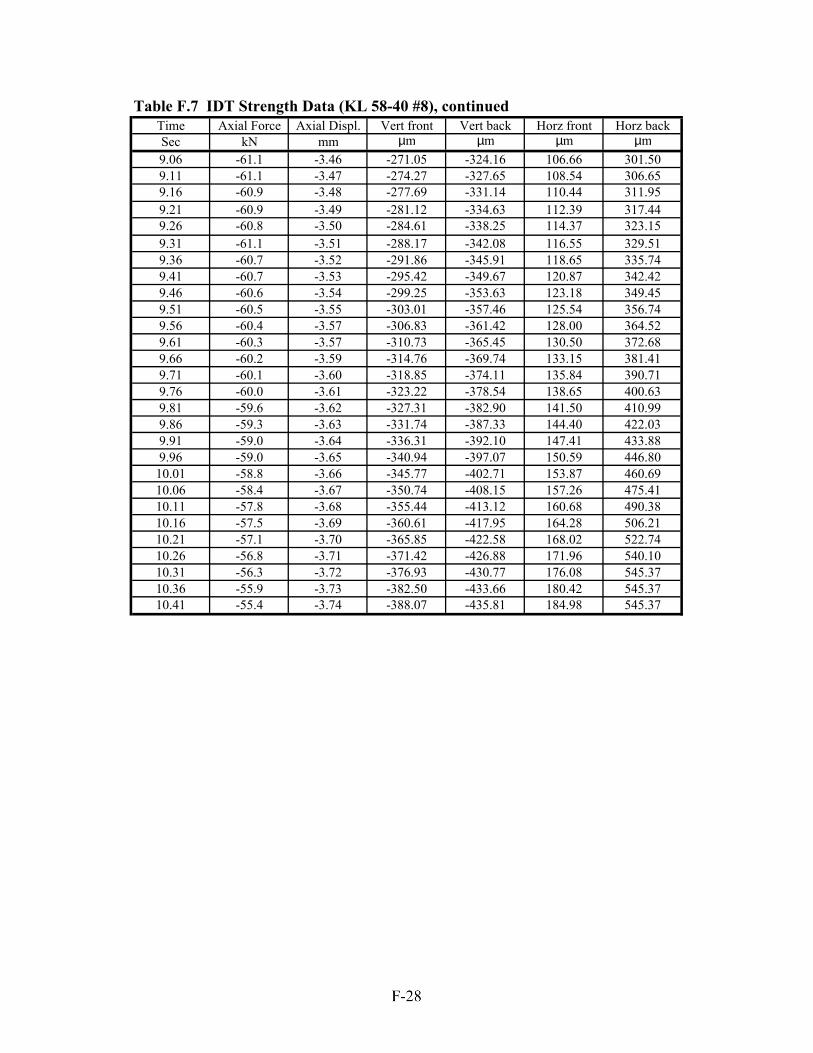
Time Axial Force Axial Displ. Vert front Vert back Horz front Horz backSec kN mm µm µm µm µm9.06 -61.1 -3.46 -271.05 -324.16 106.66 301.509.11 -61.1 -3.47 -274.27 -327.65 108.54 306.659.16 -60.9 -3.48 -277.69 -331.14 110.44 311.959.21 -60.9 -3.49 -281.12 -334.63 112.39 317.449.26 -60.8 -3.50 -284.61 -338.25 114.37 323.159.31 -61.1 -3.51 -288.17 -342.08 116.55 329.519.36 -60.7 -3.52 -291.86 -345.91 118.65 335.749.41 -60.7 -3.53 -295.42 -349.67 120.87 342.429.46 -60.6 -3.54 -299.25 -353.63 123.18 349.459.51 -60.5 -3.55 -303.01 -357.46 125.54 356.749.56 -60.4 -3.57 -306.83 -361.42 128.00 364.529.61 -60.3 -3.57 -310.73 -365.45 130.50 372.689.66 -60.2 -3.59 -314.76 -369.74 133.15 381.419.71 -60.1 -3.60 -318.85 -374.11 135.84 390.719.76 -60.0 -3.61 -323.22 -378.54 138.65 400.639.81 -59.6 -3.62 -327.31 -382.90 141.50 410.999.86 -59.3 -3.63 -331.74 -387.33 144.40 422.039.91 -59.0 -3.64 -336.31 -392.10 147.41 433.889.96 -59.0 -3.65 -340.94 -397.07 150.59 446.80
10.01 -58.8 -3.66 -345.77 -402.71 153.87 460.6910.06 -58.4 -3.67 -350.74 -408.15 157.26 475.4110.11 -57.8 -3.68 -355.44 -413.12 160.68 490.3810.16 -57.5 -3.69 -360.61 -417.95 164.28 506.2110.21 -57.1 -3.70 -365.85 -422.58 168.02 522.7410.26 -56.8 -3.71 -371.42 -426.88 171.96 540.1010.31 -56.3 -3.72 -376.93 -430.77 176.08 545.3710.36 -55.9 -3.73 -382.50 -433.66 180.42 545.3710.41 -55.4 -3.74 -388.07 -435.81 184.98 545.37
Table F.7 IDT Strength Data (KL 58-40 #8), continued
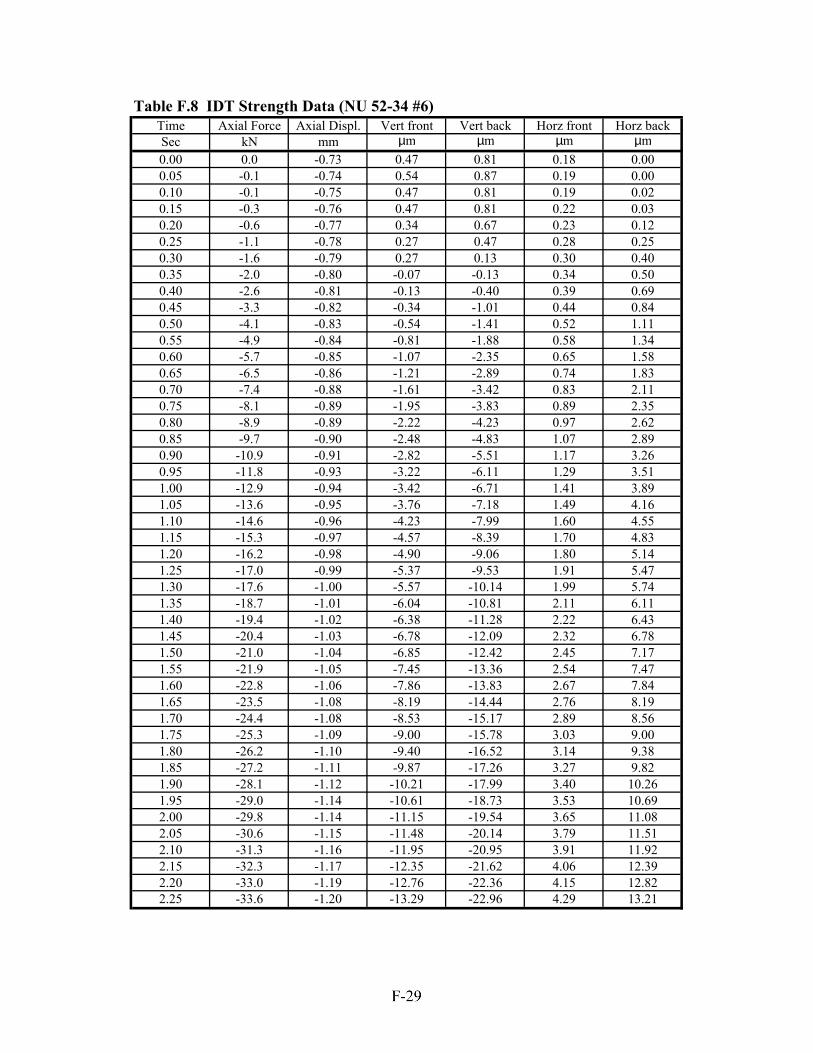
Time Axial Force Axial Displ. Vert front Vert back Horz front Horz backSec kN mm µm µm µm µm0.00 0.0 -0.73 0.47 0.81 0.18 0.000.05 -0.1 -0.74 0.54 0.87 0.19 0.000.10 -0.1 -0.75 0.47 0.81 0.19 0.020.15 -0.3 -0.76 0.47 0.81 0.22 0.030.20 -0.6 -0.77 0.34 0.67 0.23 0.120.25 -1.1 -0.78 0.27 0.47 0.28 0.250.30 -1.6 -0.79 0.27 0.13 0.30 0.400.35 -2.0 -0.80 -0.07 -0.13 0.34 0.500.40 -2.6 -0.81 -0.13 -0.40 0.39 0.690.45 -3.3 -0.82 -0.34 -1.01 0.44 0.840.50 -4.1 -0.83 -0.54 -1.41 0.52 1.110.55 -4.9 -0.84 -0.81 -1.88 0.58 1.340.60 -5.7 -0.85 -1.07 -2.35 0.65 1.580.65 -6.5 -0.86 -1.21 -2.89 0.74 1.830.70 -7.4 -0.88 -1.61 -3.42 0.83 2.110.75 -8.1 -0.89 -1.95 -3.83 0.89 2.350.80 -8.9 -0.89 -2.22 -4.23 0.97 2.620.85 -9.7 -0.90 -2.48 -4.83 1.07 2.890.90 -10.9 -0.91 -2.82 -5.51 1.17 3.260.95 -11.8 -0.93 -3.22 -6.11 1.29 3.511.00 -12.9 -0.94 -3.42 -6.71 1.41 3.891.05 -13.6 -0.95 -3.76 -7.18 1.49 4.161.10 -14.6 -0.96 -4.23 -7.99 1.60 4.551.15 -15.3 -0.97 -4.57 -8.39 1.70 4.831.20 -16.2 -0.98 -4.90 -9.06 1.80 5.141.25 -17.0 -0.99 -5.37 -9.53 1.91 5.471.30 -17.6 -1.00 -5.57 -10.14 1.99 5.741.35 -18.7 -1.01 -6.04 -10.81 2.11 6.111.40 -19.4 -1.02 -6.38 -11.28 2.22 6.431.45 -20.4 -1.03 -6.78 -12.09 2.32 6.781.50 -21.0 -1.04 -6.85 -12.42 2.45 7.171.55 -21.9 -1.05 -7.45 -13.36 2.54 7.471.60 -22.8 -1.06 -7.86 -13.83 2.67 7.841.65 -23.5 -1.08 -8.19 -14.44 2.76 8.191.70 -24.4 -1.08 -8.53 -15.17 2.89 8.561.75 -25.3 -1.09 -9.00 -15.78 3.03 9.001.80 -26.2 -1.10 -9.40 -16.52 3.14 9.381.85 -27.2 -1.11 -9.87 -17.26 3.27 9.821.90 -28.1 -1.12 -10.21 -17.99 3.40 10.261.95 -29.0 -1.14 -10.61 -18.73 3.53 10.692.00 -29.8 -1.14 -11.15 -19.54 3.65 11.082.05 -30.6 -1.15 -11.48 -20.14 3.79 11.512.10 -31.3 -1.16 -11.95 -20.95 3.91 11.922.15 -32.3 -1.17 -12.35 -21.62 4.06 12.392.20 -33.0 -1.19 -12.76 -22.36 4.15 12.822.25 -33.6 -1.20 -13.29 -22.96 4.29 13.21
Table F.8 IDT Strength Data (NU 52-34 #6)

Time Axial Force Axial Displ. Vert front Vert back Horz front Horz backSec kN mm µm µm µm µm2.30 -34.5 -1.21 -13.70 -23.77 4.41 13.662.35 -35.6 -1.21 -14.10 -24.57 4.57 14.222.40 -36.6 -1.23 -14.57 -25.45 4.72 14.742.45 -37.3 -1.24 -15.04 -26.25 4.86 15.222.50 -38.0 -1.25 -15.44 -26.92 4.98 15.712.55 -38.6 -1.26 -15.91 -27.73 5.09 16.132.60 -39.4 -1.27 -16.38 -28.40 5.25 16.632.65 -40.5 -1.28 -16.92 -29.47 5.40 17.222.70 -41.2 -1.29 -17.39 -30.21 5.54 17.742.75 -41.9 -1.30 -17.79 -30.95 5.68 18.212.80 -42.6 -1.31 -18.26 -31.76 5.82 18.782.85 -43.3 -1.32 -18.73 -32.63 5.94 19.272.90 -44.1 -1.33 -19.27 -33.44 6.10 19.862.95 -44.8 -1.34 -19.74 -34.38 6.24 20.433.00 -45.9 -1.35 -20.41 -35.38 6.40 21.083.05 -46.4 -1.36 -20.81 -36.12 6.55 21.643.10 -47.1 -1.37 -21.28 -36.99 6.68 22.223.15 -47.8 -1.38 -21.82 -37.73 6.83 22.813.20 -48.6 -1.39 -22.22 -38.67 6.99 23.423.25 -49.1 -1.40 -22.89 -39.61 7.13 24.043.30 -49.8 -1.41 -23.30 -40.49 7.26 24.643.35 -50.5 -1.42 -23.57 -41.09 7.45 25.353.40 -51.1 -1.43 -24.51 -42.43 7.57 25.933.45 -51.6 -1.45 -24.77 -43.04 7.74 26.573.50 -53.0 -1.46 -25.38 -44.25 7.93 27.383.55 -53.5 -1.46 -26.05 -45.05 8.07 28.123.60 -54.0 -1.48 -26.59 -46.13 8.23 28.773.65 -54.7 -1.48 -27.12 -47.00 8.41 29.493.70 -55.5 -1.50 -27.80 -48.01 8.56 30.303.75 -56.1 -1.51 -28.33 -48.95 8.75 31.073.80 -56.9 -1.52 -29.00 -50.09 8.90 31.943.85 -57.4 -1.53 -29.61 -51.09 9.08 32.803.90 -57.8 -1.54 -30.01 -51.90 9.22 33.543.95 -58.6 -1.55 -30.68 -53.04 9.40 34.434.00 -59.1 -1.56 -31.22 -54.05 9.57 35.324.05 -59.9 -1.57 -31.89 -55.12 9.75 36.194.10 -60.5 -1.58 -32.50 -56.26 9.93 37.104.15 -61.1 -1.59 -33.17 -57.41 10.12 38.044.20 -61.5 -1.60 -33.77 -58.28 10.27 38.914.25 -61.8 -1.61 -34.38 -59.35 10.45 39.804.30 -62.4 -1.62 -35.05 -60.36 10.62 40.704.35 -62.9 -1.63 -35.58 -61.50 10.80 41.664.40 -63.7 -1.64 -36.32 -62.64 11.01 42.704.45 -64.2 -1.65 -37.06 -63.92 11.19 43.744.50 -64.7 -1.66 -37.73 -64.99 11.38 44.78
Table F.8 IDT Strength Data (NU 52-34 #6), continued
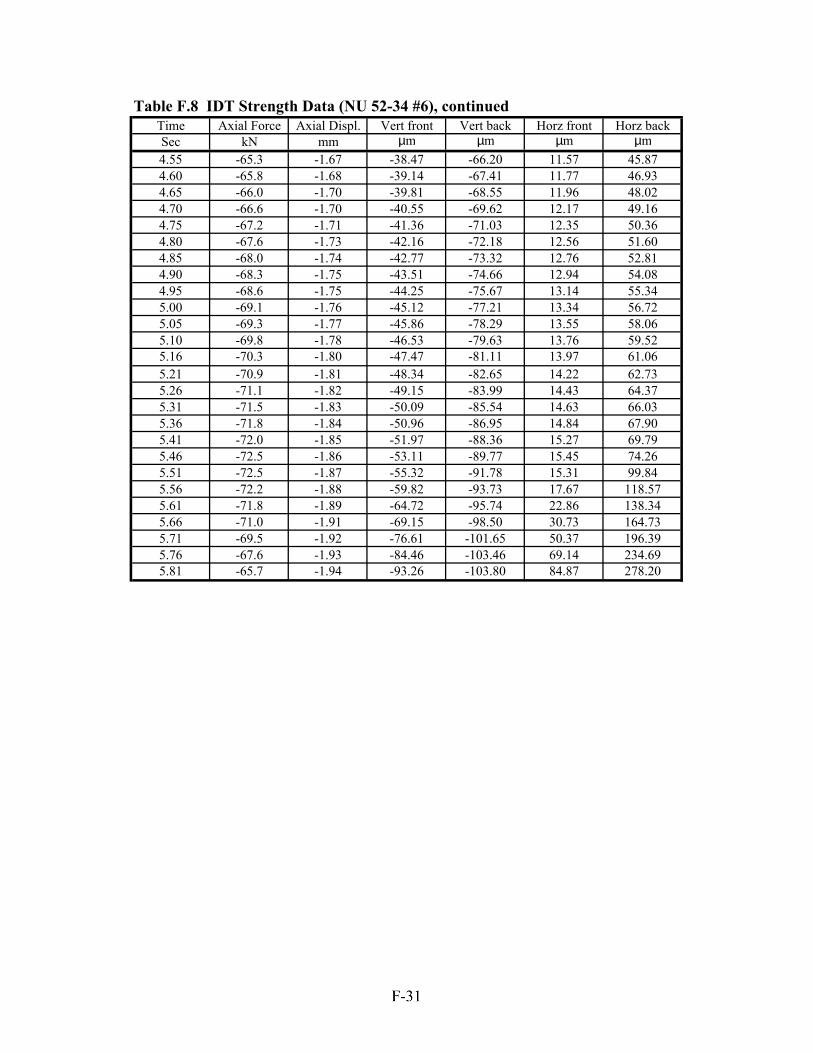
Time Axial Force Axial Displ. Vert front Vert back Horz front Horz backSec kN mm µm µm µm µm4.55 -65.3 -1.67 -38.47 -66.20 11.57 45.874.60 -65.8 -1.68 -39.14 -67.41 11.77 46.934.65 -66.0 -1.70 -39.81 -68.55 11.96 48.024.70 -66.6 -1.70 -40.55 -69.62 12.17 49.164.75 -67.2 -1.71 -41.36 -71.03 12.35 50.364.80 -67.6 -1.73 -42.16 -72.18 12.56 51.604.85 -68.0 -1.74 -42.77 -73.32 12.76 52.814.90 -68.3 -1.75 -43.51 -74.66 12.94 54.084.95 -68.6 -1.75 -44.25 -75.67 13.14 55.345.00 -69.1 -1.76 -45.12 -77.21 13.34 56.725.05 -69.3 -1.77 -45.86 -78.29 13.55 58.065.10 -69.8 -1.78 -46.53 -79.63 13.76 59.525.16 -70.3 -1.80 -47.47 -81.11 13.97 61.065.21 -70.9 -1.81 -48.34 -82.65 14.22 62.735.26 -71.1 -1.82 -49.15 -83.99 14.43 64.375.31 -71.5 -1.83 -50.09 -85.54 14.63 66.035.36 -71.8 -1.84 -50.96 -86.95 14.84 67.905.41 -72.0 -1.85 -51.97 -88.36 15.27 69.795.46 -72.5 -1.86 -53.11 -89.77 15.45 74.265.51 -72.5 -1.87 -55.32 -91.78 15.31 99.845.56 -72.2 -1.88 -59.82 -93.73 17.67 118.575.61 -71.8 -1.89 -64.72 -95.74 22.86 138.345.66 -71.0 -1.91 -69.15 -98.50 30.73 164.735.71 -69.5 -1.92 -76.61 -101.65 50.37 196.395.76 -67.6 -1.93 -84.46 -103.46 69.14 234.695.81 -65.7 -1.94 -93.26 -103.80 84.87 278.20
Table F.8 IDT Strength Data (NU 52-34 #6), continued
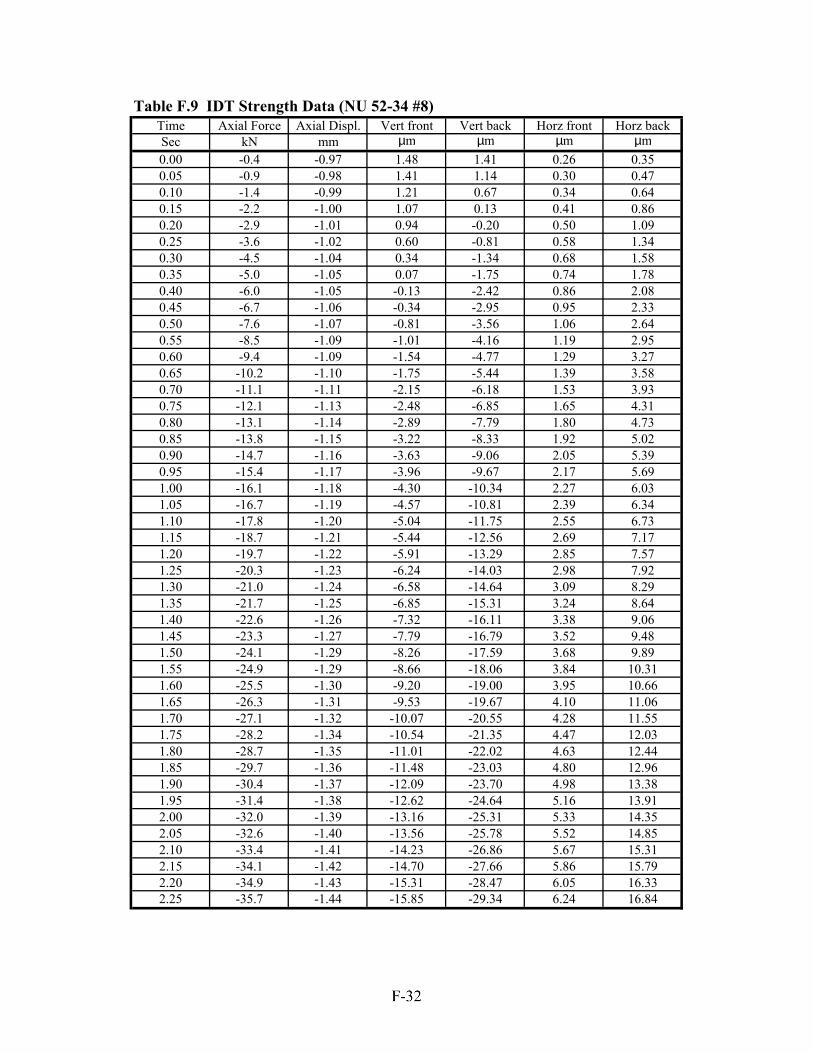
Time Axial Force Axial Displ. Vert front Vert back Horz front Horz backSec kN mm µm µm µm µm0.00 -0.4 -0.97 1.48 1.41 0.26 0.350.05 -0.9 -0.98 1.41 1.14 0.30 0.470.10 -1.4 -0.99 1.21 0.67 0.34 0.640.15 -2.2 -1.00 1.07 0.13 0.41 0.860.20 -2.9 -1.01 0.94 -0.20 0.50 1.090.25 -3.6 -1.02 0.60 -0.81 0.58 1.340.30 -4.5 -1.04 0.34 -1.34 0.68 1.580.35 -5.0 -1.05 0.07 -1.75 0.74 1.780.40 -6.0 -1.05 -0.13 -2.42 0.86 2.080.45 -6.7 -1.06 -0.34 -2.95 0.95 2.330.50 -7.6 -1.07 -0.81 -3.56 1.06 2.640.55 -8.5 -1.09 -1.01 -4.16 1.19 2.950.60 -9.4 -1.09 -1.54 -4.77 1.29 3.270.65 -10.2 -1.10 -1.75 -5.44 1.39 3.580.70 -11.1 -1.11 -2.15 -6.18 1.53 3.930.75 -12.1 -1.13 -2.48 -6.85 1.65 4.310.80 -13.1 -1.14 -2.89 -7.79 1.80 4.730.85 -13.8 -1.15 -3.22 -8.33 1.92 5.020.90 -14.7 -1.16 -3.63 -9.06 2.05 5.390.95 -15.4 -1.17 -3.96 -9.67 2.17 5.691.00 -16.1 -1.18 -4.30 -10.34 2.27 6.031.05 -16.7 -1.19 -4.57 -10.81 2.39 6.341.10 -17.8 -1.20 -5.04 -11.75 2.55 6.731.15 -18.7 -1.21 -5.44 -12.56 2.69 7.171.20 -19.7 -1.22 -5.91 -13.29 2.85 7.571.25 -20.3 -1.23 -6.24 -14.03 2.98 7.921.30 -21.0 -1.24 -6.58 -14.64 3.09 8.291.35 -21.7 -1.25 -6.85 -15.31 3.24 8.641.40 -22.6 -1.26 -7.32 -16.11 3.38 9.061.45 -23.3 -1.27 -7.79 -16.79 3.52 9.481.50 -24.1 -1.29 -8.26 -17.59 3.68 9.891.55 -24.9 -1.29 -8.66 -18.06 3.84 10.311.60 -25.5 -1.30 -9.20 -19.00 3.95 10.661.65 -26.3 -1.31 -9.53 -19.67 4.10 11.061.70 -27.1 -1.32 -10.07 -20.55 4.28 11.551.75 -28.2 -1.34 -10.54 -21.35 4.47 12.031.80 -28.7 -1.35 -11.01 -22.02 4.63 12.441.85 -29.7 -1.36 -11.48 -23.03 4.80 12.961.90 -30.4 -1.37 -12.09 -23.70 4.98 13.381.95 -31.4 -1.38 -12.62 -24.64 5.16 13.912.00 -32.0 -1.39 -13.16 -25.31 5.33 14.352.05 -32.6 -1.40 -13.56 -25.78 5.52 14.852.10 -33.4 -1.41 -14.23 -26.86 5.67 15.312.15 -34.1 -1.42 -14.70 -27.66 5.86 15.792.20 -34.9 -1.43 -15.31 -28.47 6.05 16.332.25 -35.7 -1.44 -15.85 -29.34 6.24 16.84
Table F.9 IDT Strength Data (NU 52-34 #8)
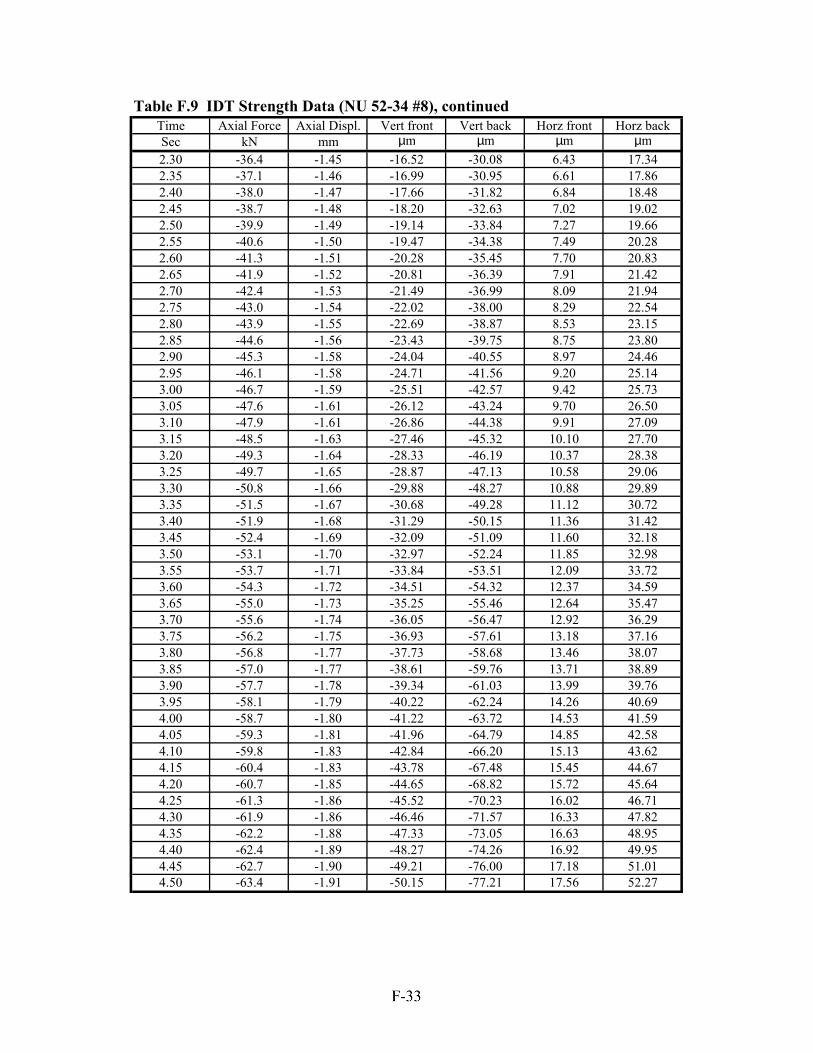
Time Axial Force Axial Displ. Vert front Vert back Horz front Horz backSec kN mm µm µm µm µm2.30 -36.4 -1.45 -16.52 -30.08 6.43 17.342.35 -37.1 -1.46 -16.99 -30.95 6.61 17.862.40 -38.0 -1.47 -17.66 -31.82 6.84 18.482.45 -38.7 -1.48 -18.20 -32.63 7.02 19.022.50 -39.9 -1.49 -19.14 -33.84 7.27 19.662.55 -40.6 -1.50 -19.47 -34.38 7.49 20.282.60 -41.3 -1.51 -20.28 -35.45 7.70 20.832.65 -41.9 -1.52 -20.81 -36.39 7.91 21.422.70 -42.4 -1.53 -21.49 -36.99 8.09 21.942.75 -43.0 -1.54 -22.02 -38.00 8.29 22.542.80 -43.9 -1.55 -22.69 -38.87 8.53 23.152.85 -44.6 -1.56 -23.43 -39.75 8.75 23.802.90 -45.3 -1.58 -24.04 -40.55 8.97 24.462.95 -46.1 -1.58 -24.71 -41.56 9.20 25.143.00 -46.7 -1.59 -25.51 -42.57 9.42 25.733.05 -47.6 -1.61 -26.12 -43.24 9.70 26.503.10 -47.9 -1.61 -26.86 -44.38 9.91 27.093.15 -48.5 -1.63 -27.46 -45.32 10.10 27.703.20 -49.3 -1.64 -28.33 -46.19 10.37 28.383.25 -49.7 -1.65 -28.87 -47.13 10.58 29.063.30 -50.8 -1.66 -29.88 -48.27 10.88 29.893.35 -51.5 -1.67 -30.68 -49.28 11.12 30.723.40 -51.9 -1.68 -31.29 -50.15 11.36 31.423.45 -52.4 -1.69 -32.09 -51.09 11.60 32.183.50 -53.1 -1.70 -32.97 -52.24 11.85 32.983.55 -53.7 -1.71 -33.84 -53.51 12.09 33.723.60 -54.3 -1.72 -34.51 -54.32 12.37 34.593.65 -55.0 -1.73 -35.25 -55.46 12.64 35.473.70 -55.6 -1.74 -36.05 -56.47 12.92 36.293.75 -56.2 -1.75 -36.93 -57.61 13.18 37.163.80 -56.8 -1.77 -37.73 -58.68 13.46 38.073.85 -57.0 -1.77 -38.61 -59.76 13.71 38.893.90 -57.7 -1.78 -39.34 -61.03 13.99 39.763.95 -58.1 -1.79 -40.22 -62.24 14.26 40.694.00 -58.7 -1.80 -41.22 -63.72 14.53 41.594.05 -59.3 -1.81 -41.96 -64.79 14.85 42.584.10 -59.8 -1.83 -42.84 -66.20 15.13 43.624.15 -60.4 -1.83 -43.78 -67.48 15.45 44.674.20 -60.7 -1.85 -44.65 -68.82 15.72 45.644.25 -61.3 -1.86 -45.52 -70.23 16.02 46.714.30 -61.9 -1.86 -46.46 -71.57 16.33 47.824.35 -62.2 -1.88 -47.33 -73.05 16.63 48.954.40 -62.4 -1.89 -48.27 -74.26 16.92 49.954.45 -62.7 -1.90 -49.21 -76.00 17.18 51.014.50 -63.4 -1.91 -50.15 -77.21 17.56 52.27
Table F.9 IDT Strength Data (NU 52-34 #8), continued
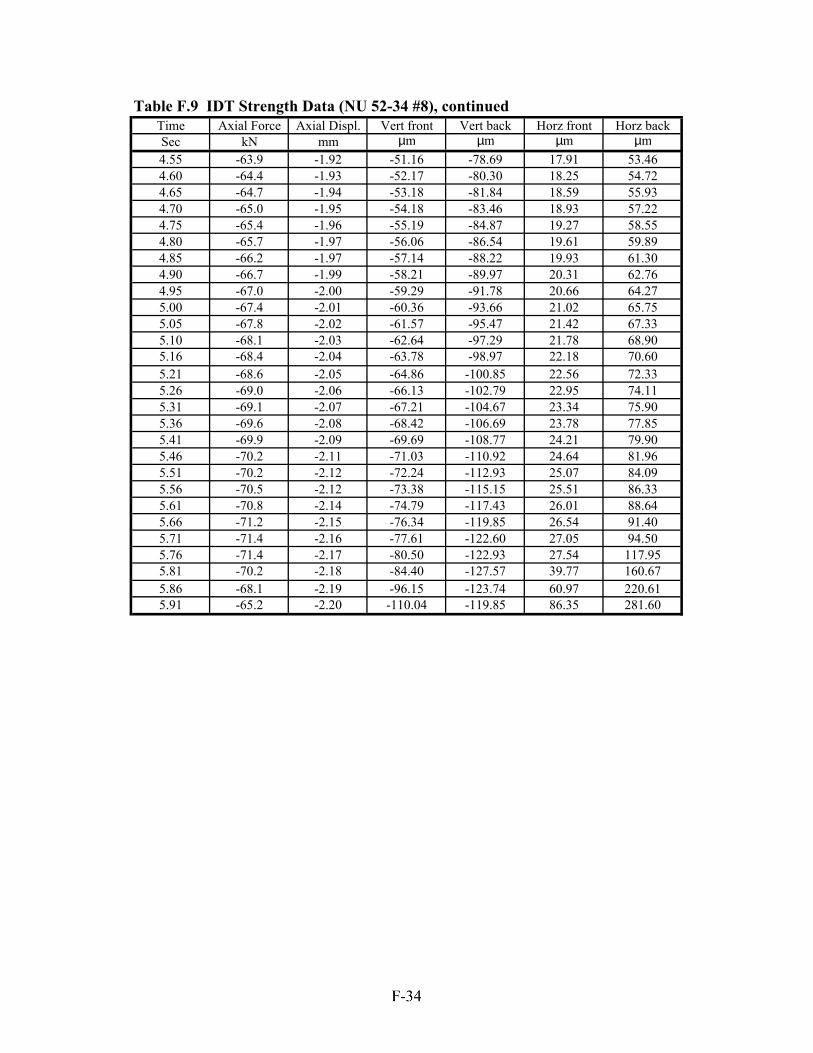
Time Axial Force Axial Displ. Vert front Vert back Horz front Horz backSec kN mm µm µm µm µm4.55 -63.9 -1.92 -51.16 -78.69 17.91 53.464.60 -64.4 -1.93 -52.17 -80.30 18.25 54.724.65 -64.7 -1.94 -53.18 -81.84 18.59 55.934.70 -65.0 -1.95 -54.18 -83.46 18.93 57.224.75 -65.4 -1.96 -55.19 -84.87 19.27 58.554.80 -65.7 -1.97 -56.06 -86.54 19.61 59.894.85 -66.2 -1.97 -57.14 -88.22 19.93 61.304.90 -66.7 -1.99 -58.21 -89.97 20.31 62.764.95 -67.0 -2.00 -59.29 -91.78 20.66 64.275.00 -67.4 -2.01 -60.36 -93.66 21.02 65.755.05 -67.8 -2.02 -61.57 -95.47 21.42 67.335.10 -68.1 -2.03 -62.64 -97.29 21.78 68.905.16 -68.4 -2.04 -63.78 -98.97 22.18 70.605.21 -68.6 -2.05 -64.86 -100.85 22.56 72.335.26 -69.0 -2.06 -66.13 -102.79 22.95 74.115.31 -69.1 -2.07 -67.21 -104.67 23.34 75.905.36 -69.6 -2.08 -68.42 -106.69 23.78 77.855.41 -69.9 -2.09 -69.69 -108.77 24.21 79.905.46 -70.2 -2.11 -71.03 -110.92 24.64 81.965.51 -70.2 -2.12 -72.24 -112.93 25.07 84.095.56 -70.5 -2.12 -73.38 -115.15 25.51 86.335.61 -70.8 -2.14 -74.79 -117.43 26.01 88.645.66 -71.2 -2.15 -76.34 -119.85 26.54 91.405.71 -71.4 -2.16 -77.61 -122.60 27.05 94.505.76 -71.4 -2.17 -80.50 -122.93 27.54 117.955.81 -70.2 -2.18 -84.40 -127.57 39.77 160.675.86 -68.1 -2.19 -96.15 -123.74 60.97 220.615.91 -65.2 -2.20 -110.04 -119.85 86.35 281.60
Table F.9 IDT Strength Data (NU 52-34 #8), continued
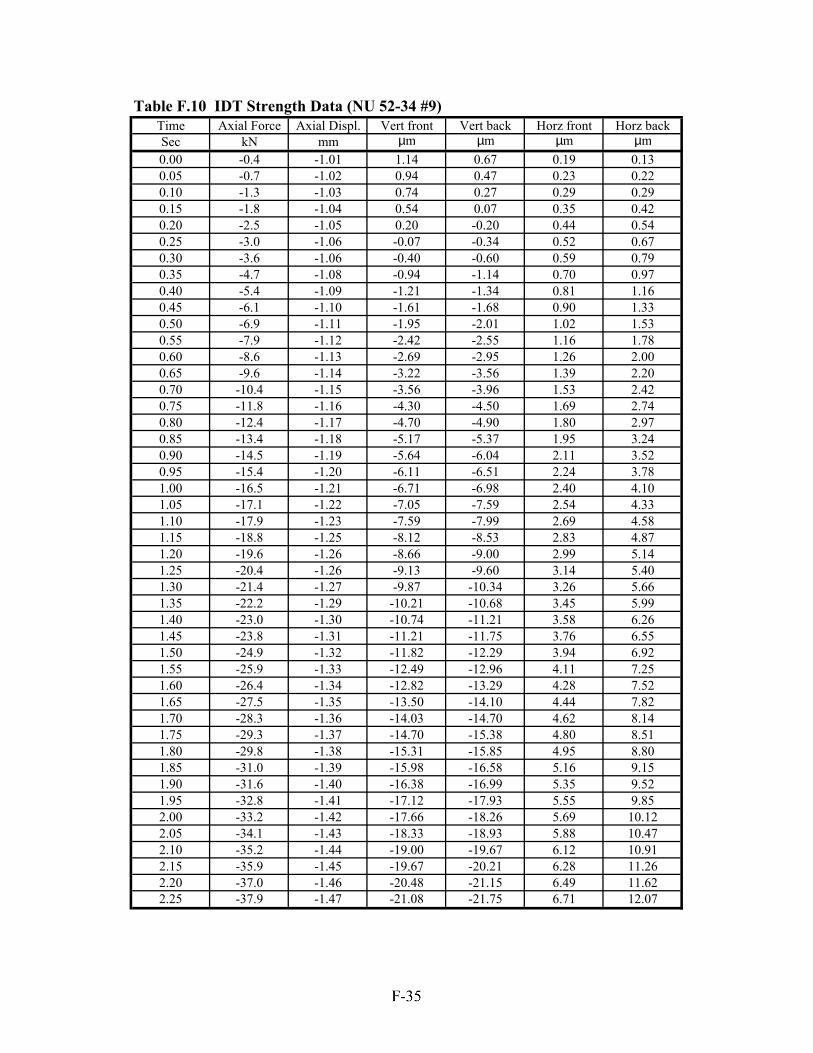
Time Axial Force Axial Displ. Vert front Vert back Horz front Horz backSec kN mm µm µm µm µm0.00 -0.4 -1.01 1.14 0.67 0.19 0.130.05 -0.7 -1.02 0.94 0.47 0.23 0.220.10 -1.3 -1.03 0.74 0.27 0.29 0.290.15 -1.8 -1.04 0.54 0.07 0.35 0.420.20 -2.5 -1.05 0.20 -0.20 0.44 0.540.25 -3.0 -1.06 -0.07 -0.34 0.52 0.670.30 -3.6 -1.06 -0.40 -0.60 0.59 0.790.35 -4.7 -1.08 -0.94 -1.14 0.70 0.970.40 -5.4 -1.09 -1.21 -1.34 0.81 1.160.45 -6.1 -1.10 -1.61 -1.68 0.90 1.330.50 -6.9 -1.11 -1.95 -2.01 1.02 1.530.55 -7.9 -1.12 -2.42 -2.55 1.16 1.780.60 -8.6 -1.13 -2.69 -2.95 1.26 2.000.65 -9.6 -1.14 -3.22 -3.56 1.39 2.200.70 -10.4 -1.15 -3.56 -3.96 1.53 2.420.75 -11.8 -1.16 -4.30 -4.50 1.69 2.740.80 -12.4 -1.17 -4.70 -4.90 1.80 2.970.85 -13.4 -1.18 -5.17 -5.37 1.95 3.240.90 -14.5 -1.19 -5.64 -6.04 2.11 3.520.95 -15.4 -1.20 -6.11 -6.51 2.24 3.781.00 -16.5 -1.21 -6.71 -6.98 2.40 4.101.05 -17.1 -1.22 -7.05 -7.59 2.54 4.331.10 -17.9 -1.23 -7.59 -7.99 2.69 4.581.15 -18.8 -1.25 -8.12 -8.53 2.83 4.871.20 -19.6 -1.26 -8.66 -9.00 2.99 5.141.25 -20.4 -1.26 -9.13 -9.60 3.14 5.401.30 -21.4 -1.27 -9.87 -10.34 3.26 5.661.35 -22.2 -1.29 -10.21 -10.68 3.45 5.991.40 -23.0 -1.30 -10.74 -11.21 3.58 6.261.45 -23.8 -1.31 -11.21 -11.75 3.76 6.551.50 -24.9 -1.32 -11.82 -12.29 3.94 6.921.55 -25.9 -1.33 -12.49 -12.96 4.11 7.251.60 -26.4 -1.34 -12.82 -13.29 4.28 7.521.65 -27.5 -1.35 -13.50 -14.10 4.44 7.821.70 -28.3 -1.36 -14.03 -14.70 4.62 8.141.75 -29.3 -1.37 -14.70 -15.38 4.80 8.511.80 -29.8 -1.38 -15.31 -15.85 4.95 8.801.85 -31.0 -1.39 -15.98 -16.58 5.16 9.151.90 -31.6 -1.40 -16.38 -16.99 5.35 9.521.95 -32.8 -1.41 -17.12 -17.93 5.55 9.852.00 -33.2 -1.42 -17.66 -18.26 5.69 10.122.05 -34.1 -1.43 -18.33 -18.93 5.88 10.472.10 -35.2 -1.44 -19.00 -19.67 6.12 10.912.15 -35.9 -1.45 -19.67 -20.21 6.28 11.262.20 -37.0 -1.46 -20.48 -21.15 6.49 11.622.25 -37.9 -1.47 -21.08 -21.75 6.71 12.07
Table F.10 IDT Strength Data (NU 52-34 #9)
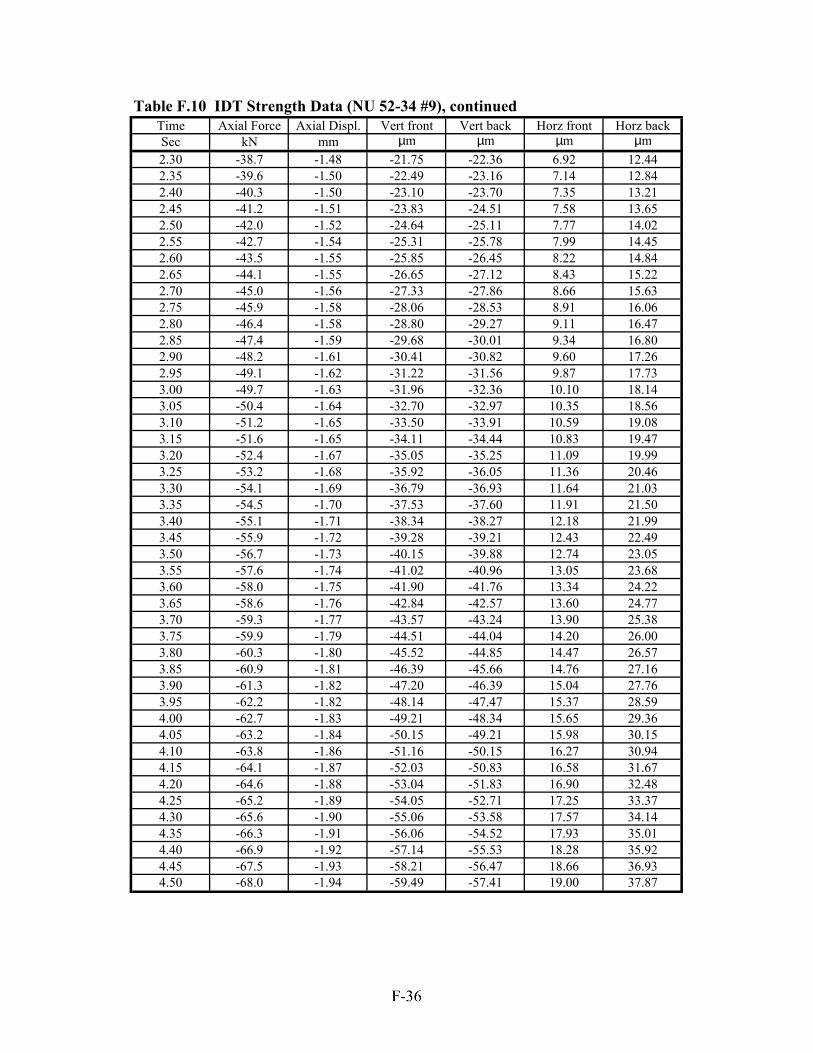
Time Axial Force Axial Displ. Vert front Vert back Horz front Horz backSec kN mm µm µm µm µm2.30 -38.7 -1.48 -21.75 -22.36 6.92 12.442.35 -39.6 -1.50 -22.49 -23.16 7.14 12.842.40 -40.3 -1.50 -23.10 -23.70 7.35 13.212.45 -41.2 -1.51 -23.83 -24.51 7.58 13.652.50 -42.0 -1.52 -24.64 -25.11 7.77 14.022.55 -42.7 -1.54 -25.31 -25.78 7.99 14.452.60 -43.5 -1.55 -25.85 -26.45 8.22 14.842.65 -44.1 -1.55 -26.65 -27.12 8.43 15.222.70 -45.0 -1.56 -27.33 -27.86 8.66 15.632.75 -45.9 -1.58 -28.06 -28.53 8.91 16.062.80 -46.4 -1.58 -28.80 -29.27 9.11 16.472.85 -47.4 -1.59 -29.68 -30.01 9.34 16.802.90 -48.2 -1.61 -30.41 -30.82 9.60 17.262.95 -49.1 -1.62 -31.22 -31.56 9.87 17.733.00 -49.7 -1.63 -31.96 -32.36 10.10 18.143.05 -50.4 -1.64 -32.70 -32.97 10.35 18.563.10 -51.2 -1.65 -33.50 -33.91 10.59 19.083.15 -51.6 -1.65 -34.11 -34.44 10.83 19.473.20 -52.4 -1.67 -35.05 -35.25 11.09 19.993.25 -53.2 -1.68 -35.92 -36.05 11.36 20.463.30 -54.1 -1.69 -36.79 -36.93 11.64 21.033.35 -54.5 -1.70 -37.53 -37.60 11.91 21.503.40 -55.1 -1.71 -38.34 -38.27 12.18 21.993.45 -55.9 -1.72 -39.28 -39.21 12.43 22.493.50 -56.7 -1.73 -40.15 -39.88 12.74 23.053.55 -57.6 -1.74 -41.02 -40.96 13.05 23.683.60 -58.0 -1.75 -41.90 -41.76 13.34 24.223.65 -58.6 -1.76 -42.84 -42.57 13.60 24.773.70 -59.3 -1.77 -43.57 -43.24 13.90 25.383.75 -59.9 -1.79 -44.51 -44.04 14.20 26.003.80 -60.3 -1.80 -45.52 -44.85 14.47 26.573.85 -60.9 -1.81 -46.39 -45.66 14.76 27.163.90 -61.3 -1.82 -47.20 -46.39 15.04 27.763.95 -62.2 -1.82 -48.14 -47.47 15.37 28.594.00 -62.7 -1.83 -49.21 -48.34 15.65 29.364.05 -63.2 -1.84 -50.15 -49.21 15.98 30.154.10 -63.8 -1.86 -51.16 -50.15 16.27 30.944.15 -64.1 -1.87 -52.03 -50.83 16.58 31.674.20 -64.6 -1.88 -53.04 -51.83 16.90 32.484.25 -65.2 -1.89 -54.05 -52.71 17.25 33.374.30 -65.6 -1.90 -55.06 -53.58 17.57 34.144.35 -66.3 -1.91 -56.06 -54.52 17.93 35.014.40 -66.9 -1.92 -57.14 -55.53 18.28 35.924.45 -67.5 -1.93 -58.21 -56.47 18.66 36.934.50 -68.0 -1.94 -59.49 -57.41 19.00 37.87
Table F.10 IDT Strength Data (NU 52-34 #9), continued
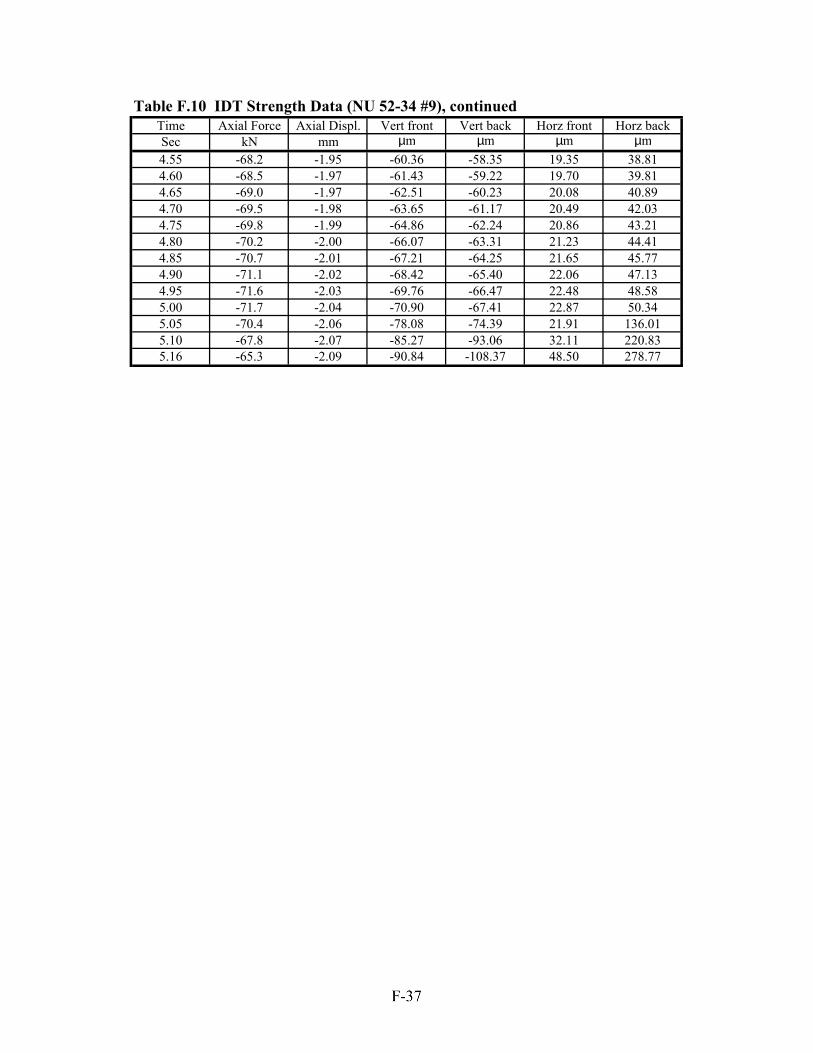
Time Axial Force Axial Displ. Vert front Vert back Horz front Horz backSec kN mm µm µm µm µm4.55 -68.2 -1.95 -60.36 -58.35 19.35 38.814.60 -68.5 -1.97 -61.43 -59.22 19.70 39.814.65 -69.0 -1.97 -62.51 -60.23 20.08 40.894.70 -69.5 -1.98 -63.65 -61.17 20.49 42.034.75 -69.8 -1.99 -64.86 -62.24 20.86 43.214.80 -70.2 -2.00 -66.07 -63.31 21.23 44.414.85 -70.7 -2.01 -67.21 -64.25 21.65 45.774.90 -71.1 -2.02 -68.42 -65.40 22.06 47.134.95 -71.6 -2.03 -69.76 -66.47 22.48 48.585.00 -71.7 -2.04 -70.90 -67.41 22.87 50.345.05 -70.4 -2.06 -78.08 -74.39 21.91 136.015.10 -67.8 -2.07 -85.27 -93.06 32.11 220.835.16 -65.3 -2.09 -90.84 -108.37 48.50 278.77
Table F.10 IDT Strength Data (NU 52-34 #9), continued
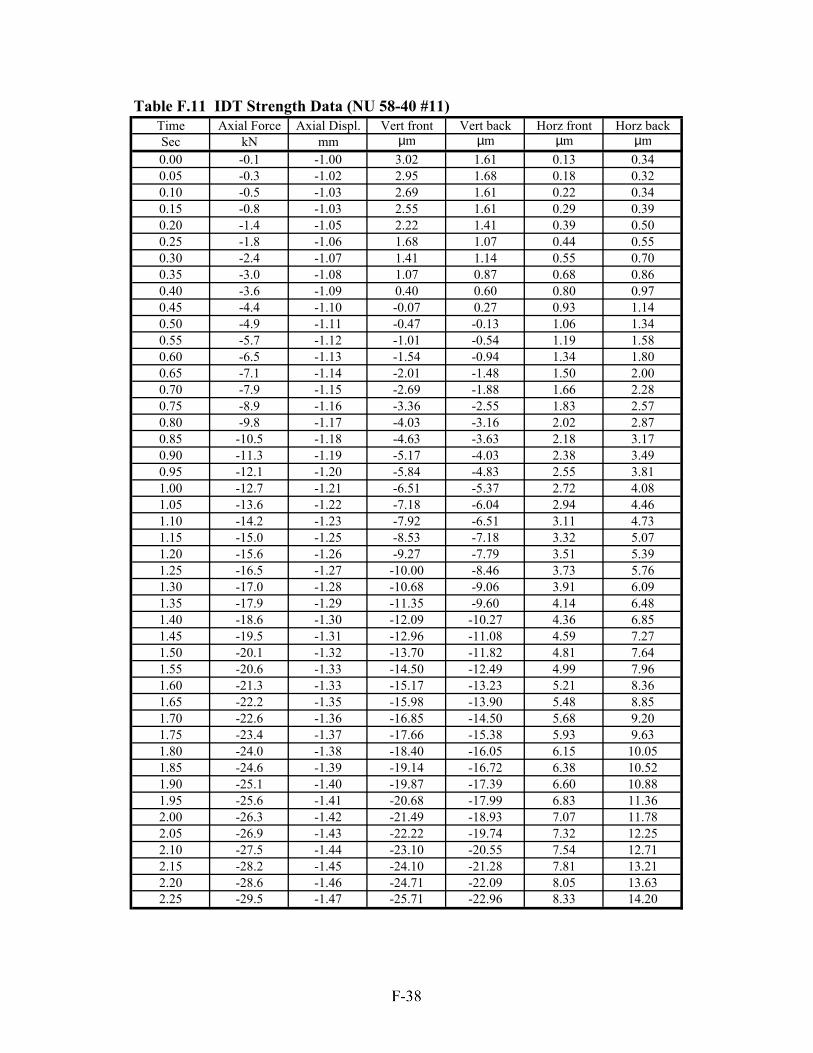
Time Axial Force Axial Displ. Vert front Vert back Horz front Horz backSec kN mm µm µm µm µm0.00 -0.1 -1.00 3.02 1.61 0.13 0.340.05 -0.3 -1.02 2.95 1.68 0.18 0.320.10 -0.5 -1.03 2.69 1.61 0.22 0.340.15 -0.8 -1.03 2.55 1.61 0.29 0.390.20 -1.4 -1.05 2.22 1.41 0.39 0.500.25 -1.8 -1.06 1.68 1.07 0.44 0.550.30 -2.4 -1.07 1.41 1.14 0.55 0.700.35 -3.0 -1.08 1.07 0.87 0.68 0.860.40 -3.6 -1.09 0.40 0.60 0.80 0.970.45 -4.4 -1.10 -0.07 0.27 0.93 1.140.50 -4.9 -1.11 -0.47 -0.13 1.06 1.340.55 -5.7 -1.12 -1.01 -0.54 1.19 1.580.60 -6.5 -1.13 -1.54 -0.94 1.34 1.800.65 -7.1 -1.14 -2.01 -1.48 1.50 2.000.70 -7.9 -1.15 -2.69 -1.88 1.66 2.280.75 -8.9 -1.16 -3.36 -2.55 1.83 2.570.80 -9.8 -1.17 -4.03 -3.16 2.02 2.870.85 -10.5 -1.18 -4.63 -3.63 2.18 3.170.90 -11.3 -1.19 -5.17 -4.03 2.38 3.490.95 -12.1 -1.20 -5.84 -4.83 2.55 3.811.00 -12.7 -1.21 -6.51 -5.37 2.72 4.081.05 -13.6 -1.22 -7.18 -6.04 2.94 4.461.10 -14.2 -1.23 -7.92 -6.51 3.11 4.731.15 -15.0 -1.25 -8.53 -7.18 3.32 5.071.20 -15.6 -1.26 -9.27 -7.79 3.51 5.391.25 -16.5 -1.27 -10.00 -8.46 3.73 5.761.30 -17.0 -1.28 -10.68 -9.06 3.91 6.091.35 -17.9 -1.29 -11.35 -9.60 4.14 6.481.40 -18.6 -1.30 -12.09 -10.27 4.36 6.851.45 -19.5 -1.31 -12.96 -11.08 4.59 7.271.50 -20.1 -1.32 -13.70 -11.82 4.81 7.641.55 -20.6 -1.33 -14.50 -12.49 4.99 7.961.60 -21.3 -1.33 -15.17 -13.23 5.21 8.361.65 -22.2 -1.35 -15.98 -13.90 5.48 8.851.70 -22.6 -1.36 -16.85 -14.50 5.68 9.201.75 -23.4 -1.37 -17.66 -15.38 5.93 9.631.80 -24.0 -1.38 -18.40 -16.05 6.15 10.051.85 -24.6 -1.39 -19.14 -16.72 6.38 10.521.90 -25.1 -1.40 -19.87 -17.39 6.60 10.881.95 -25.6 -1.41 -20.68 -17.99 6.83 11.362.00 -26.3 -1.42 -21.49 -18.93 7.07 11.782.05 -26.9 -1.43 -22.22 -19.74 7.32 12.252.10 -27.5 -1.44 -23.10 -20.55 7.54 12.712.15 -28.2 -1.45 -24.10 -21.28 7.81 13.212.20 -28.6 -1.46 -24.71 -22.09 8.05 13.632.25 -29.5 -1.47 -25.71 -22.96 8.33 14.20
Table F.11 IDT Strength Data (NU 58-40 #11)
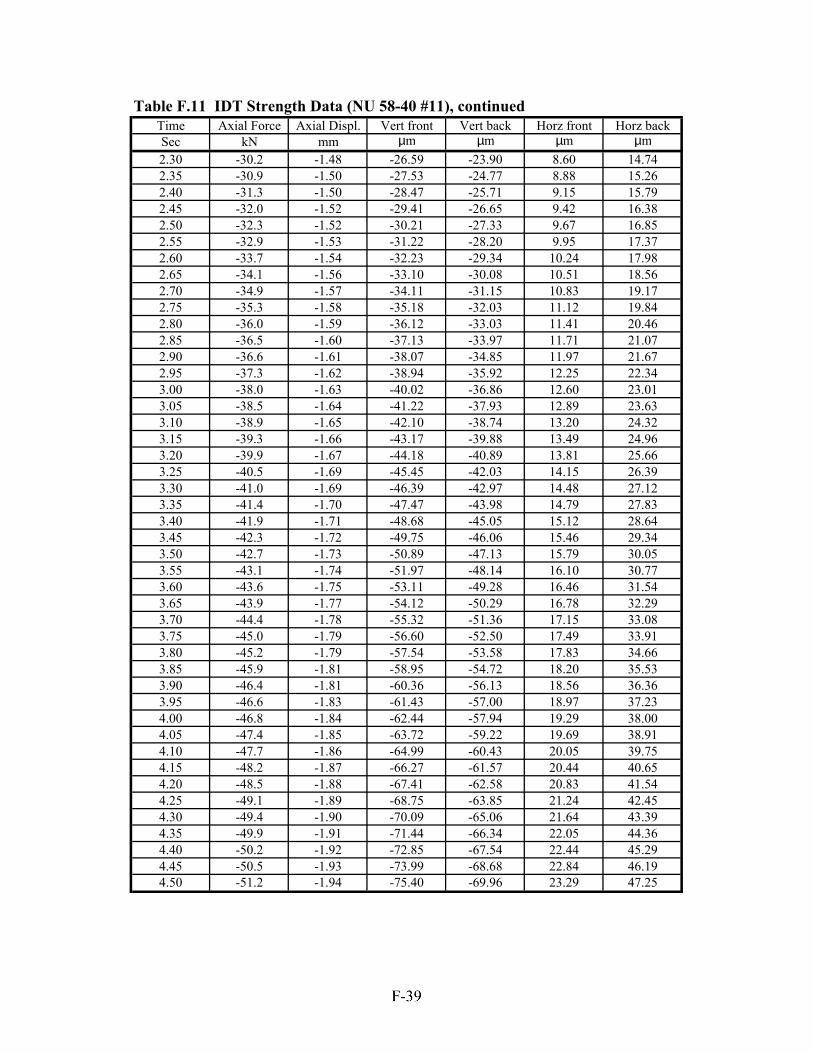
Time Axial Force Axial Displ. Vert front Vert back Horz front Horz backSec kN mm µm µm µm µm2.30 -30.2 -1.48 -26.59 -23.90 8.60 14.742.35 -30.9 -1.50 -27.53 -24.77 8.88 15.262.40 -31.3 -1.50 -28.47 -25.71 9.15 15.792.45 -32.0 -1.52 -29.41 -26.65 9.42 16.382.50 -32.3 -1.52 -30.21 -27.33 9.67 16.852.55 -32.9 -1.53 -31.22 -28.20 9.95 17.372.60 -33.7 -1.54 -32.23 -29.34 10.24 17.982.65 -34.1 -1.56 -33.10 -30.08 10.51 18.562.70 -34.9 -1.57 -34.11 -31.15 10.83 19.172.75 -35.3 -1.58 -35.18 -32.03 11.12 19.842.80 -36.0 -1.59 -36.12 -33.03 11.41 20.462.85 -36.5 -1.60 -37.13 -33.97 11.71 21.072.90 -36.6 -1.61 -38.07 -34.85 11.97 21.672.95 -37.3 -1.62 -38.94 -35.92 12.25 22.343.00 -38.0 -1.63 -40.02 -36.86 12.60 23.013.05 -38.5 -1.64 -41.22 -37.93 12.89 23.633.10 -38.9 -1.65 -42.10 -38.74 13.20 24.323.15 -39.3 -1.66 -43.17 -39.88 13.49 24.963.20 -39.9 -1.67 -44.18 -40.89 13.81 25.663.25 -40.5 -1.69 -45.45 -42.03 14.15 26.393.30 -41.0 -1.69 -46.39 -42.97 14.48 27.123.35 -41.4 -1.70 -47.47 -43.98 14.79 27.833.40 -41.9 -1.71 -48.68 -45.05 15.12 28.643.45 -42.3 -1.72 -49.75 -46.06 15.46 29.343.50 -42.7 -1.73 -50.89 -47.13 15.79 30.053.55 -43.1 -1.74 -51.97 -48.14 16.10 30.773.60 -43.6 -1.75 -53.11 -49.28 16.46 31.543.65 -43.9 -1.77 -54.12 -50.29 16.78 32.293.70 -44.4 -1.78 -55.32 -51.36 17.15 33.083.75 -45.0 -1.79 -56.60 -52.50 17.49 33.913.80 -45.2 -1.79 -57.54 -53.58 17.83 34.663.85 -45.9 -1.81 -58.95 -54.72 18.20 35.533.90 -46.4 -1.81 -60.36 -56.13 18.56 36.363.95 -46.6 -1.83 -61.43 -57.00 18.97 37.234.00 -46.8 -1.84 -62.44 -57.94 19.29 38.004.05 -47.4 -1.85 -63.72 -59.22 19.69 38.914.10 -47.7 -1.86 -64.99 -60.43 20.05 39.754.15 -48.2 -1.87 -66.27 -61.57 20.44 40.654.20 -48.5 -1.88 -67.41 -62.58 20.83 41.544.25 -49.1 -1.89 -68.75 -63.85 21.24 42.454.30 -49.4 -1.90 -70.09 -65.06 21.64 43.394.35 -49.9 -1.91 -71.44 -66.34 22.05 44.364.40 -50.2 -1.92 -72.85 -67.54 22.44 45.294.45 -50.5 -1.93 -73.99 -68.68 22.84 46.194.50 -51.2 -1.94 -75.40 -69.96 23.29 47.25
Table F.11 IDT Strength Data (NU 58-40 #11), continued
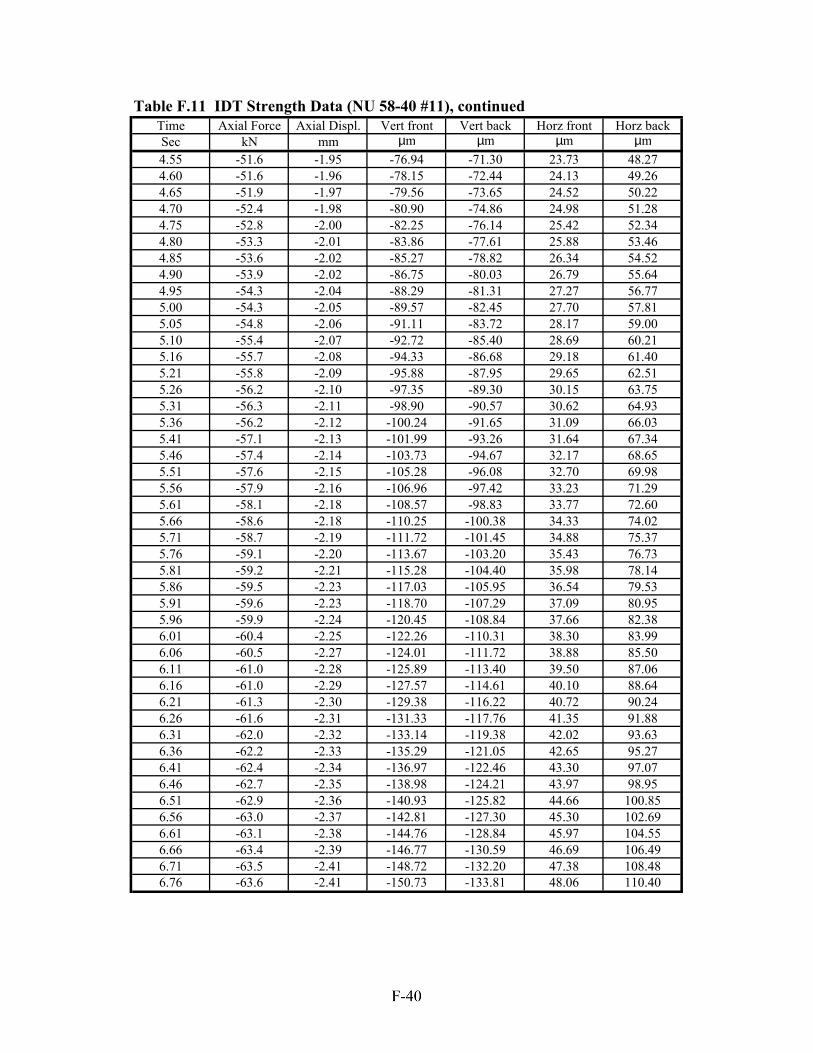
Time Axial Force Axial Displ. Vert front Vert back Horz front Horz backSec kN mm µm µm µm µm4.55 -51.6 -1.95 -76.94 -71.30 23.73 48.274.60 -51.6 -1.96 -78.15 -72.44 24.13 49.264.65 -51.9 -1.97 -79.56 -73.65 24.52 50.224.70 -52.4 -1.98 -80.90 -74.86 24.98 51.284.75 -52.8 -2.00 -82.25 -76.14 25.42 52.344.80 -53.3 -2.01 -83.86 -77.61 25.88 53.464.85 -53.6 -2.02 -85.27 -78.82 26.34 54.524.90 -53.9 -2.02 -86.75 -80.03 26.79 55.644.95 -54.3 -2.04 -88.29 -81.31 27.27 56.775.00 -54.3 -2.05 -89.57 -82.45 27.70 57.815.05 -54.8 -2.06 -91.11 -83.72 28.17 59.005.10 -55.4 -2.07 -92.72 -85.40 28.69 60.215.16 -55.7 -2.08 -94.33 -86.68 29.18 61.405.21 -55.8 -2.09 -95.88 -87.95 29.65 62.515.26 -56.2 -2.10 -97.35 -89.30 30.15 63.755.31 -56.3 -2.11 -98.90 -90.57 30.62 64.935.36 -56.2 -2.12 -100.24 -91.65 31.09 66.035.41 -57.1 -2.13 -101.99 -93.26 31.64 67.345.46 -57.4 -2.14 -103.73 -94.67 32.17 68.655.51 -57.6 -2.15 -105.28 -96.08 32.70 69.985.56 -57.9 -2.16 -106.96 -97.42 33.23 71.295.61 -58.1 -2.18 -108.57 -98.83 33.77 72.605.66 -58.6 -2.18 -110.25 -100.38 34.33 74.025.71 -58.7 -2.19 -111.72 -101.45 34.88 75.375.76 -59.1 -2.20 -113.67 -103.20 35.43 76.735.81 -59.2 -2.21 -115.28 -104.40 35.98 78.145.86 -59.5 -2.23 -117.03 -105.95 36.54 79.535.91 -59.6 -2.23 -118.70 -107.29 37.09 80.955.96 -59.9 -2.24 -120.45 -108.84 37.66 82.386.01 -60.4 -2.25 -122.26 -110.31 38.30 83.996.06 -60.5 -2.27 -124.01 -111.72 38.88 85.506.11 -61.0 -2.28 -125.89 -113.40 39.50 87.066.16 -61.0 -2.29 -127.57 -114.61 40.10 88.646.21 -61.3 -2.30 -129.38 -116.22 40.72 90.246.26 -61.6 -2.31 -131.33 -117.76 41.35 91.886.31 -62.0 -2.32 -133.14 -119.38 42.02 93.636.36 -62.2 -2.33 -135.29 -121.05 42.65 95.276.41 -62.4 -2.34 -136.97 -122.46 43.30 97.076.46 -62.7 -2.35 -138.98 -124.21 43.97 98.956.51 -62.9 -2.36 -140.93 -125.82 44.66 100.856.56 -63.0 -2.37 -142.81 -127.30 45.30 102.696.61 -63.1 -2.38 -144.76 -128.84 45.97 104.556.66 -63.4 -2.39 -146.77 -130.59 46.69 106.496.71 -63.5 -2.41 -148.72 -132.20 47.38 108.486.76 -63.6 -2.41 -150.73 -133.81 48.06 110.40
Table F.11 IDT Strength Data (NU 58-40 #11), continued
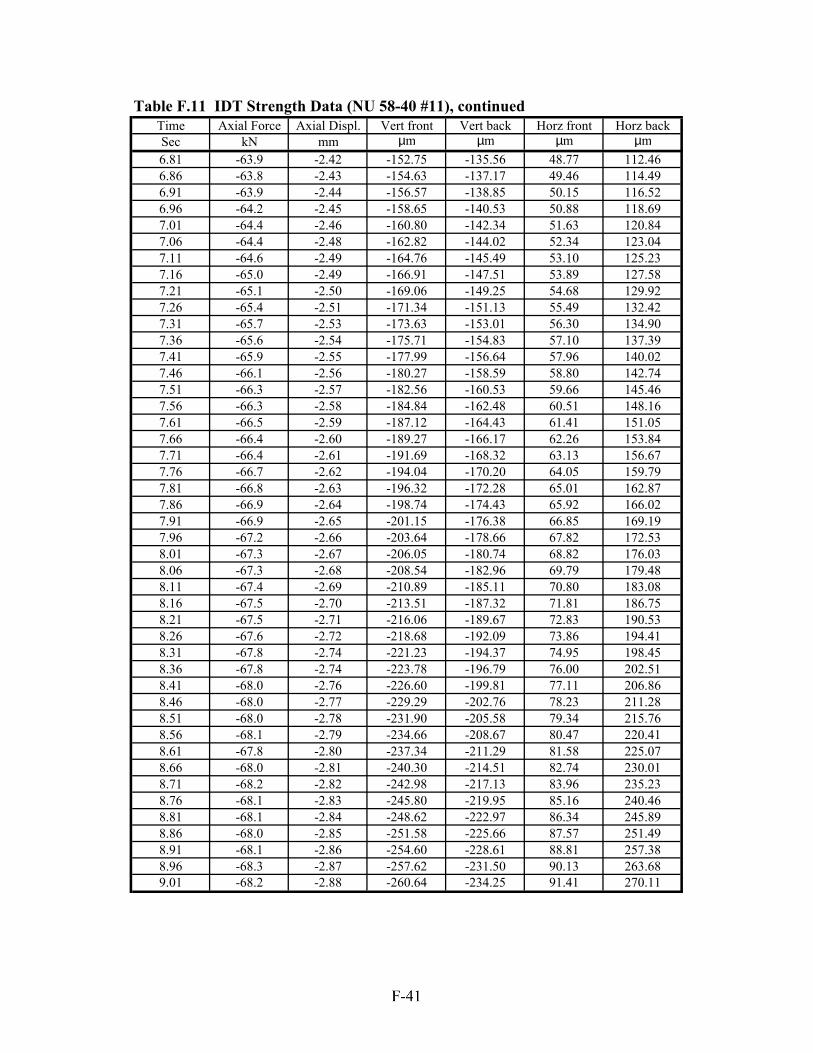
Time Axial Force Axial Displ. Vert front Vert back Horz front Horz backSec kN mm µm µm µm µm6.81 -63.9 -2.42 -152.75 -135.56 48.77 112.466.86 -63.8 -2.43 -154.63 -137.17 49.46 114.496.91 -63.9 -2.44 -156.57 -138.85 50.15 116.526.96 -64.2 -2.45 -158.65 -140.53 50.88 118.697.01 -64.4 -2.46 -160.80 -142.34 51.63 120.847.06 -64.4 -2.48 -162.82 -144.02 52.34 123.047.11 -64.6 -2.49 -164.76 -145.49 53.10 125.237.16 -65.0 -2.49 -166.91 -147.51 53.89 127.587.21 -65.1 -2.50 -169.06 -149.25 54.68 129.927.26 -65.4 -2.51 -171.34 -151.13 55.49 132.427.31 -65.7 -2.53 -173.63 -153.01 56.30 134.907.36 -65.6 -2.54 -175.71 -154.83 57.10 137.397.41 -65.9 -2.55 -177.99 -156.64 57.96 140.027.46 -66.1 -2.56 -180.27 -158.59 58.80 142.747.51 -66.3 -2.57 -182.56 -160.53 59.66 145.467.56 -66.3 -2.58 -184.84 -162.48 60.51 148.167.61 -66.5 -2.59 -187.12 -164.43 61.41 151.057.66 -66.4 -2.60 -189.27 -166.17 62.26 153.847.71 -66.4 -2.61 -191.69 -168.32 63.13 156.677.76 -66.7 -2.62 -194.04 -170.20 64.05 159.797.81 -66.8 -2.63 -196.32 -172.28 65.01 162.877.86 -66.9 -2.64 -198.74 -174.43 65.92 166.027.91 -66.9 -2.65 -201.15 -176.38 66.85 169.197.96 -67.2 -2.66 -203.64 -178.66 67.82 172.538.01 -67.3 -2.67 -206.05 -180.74 68.82 176.038.06 -67.3 -2.68 -208.54 -182.96 69.79 179.488.11 -67.4 -2.69 -210.89 -185.11 70.80 183.088.16 -67.5 -2.70 -213.51 -187.32 71.81 186.758.21 -67.5 -2.71 -216.06 -189.67 72.83 190.538.26 -67.6 -2.72 -218.68 -192.09 73.86 194.418.31 -67.8 -2.74 -221.23 -194.37 74.95 198.458.36 -67.8 -2.74 -223.78 -196.79 76.00 202.518.41 -68.0 -2.76 -226.60 -199.81 77.11 206.868.46 -68.0 -2.77 -229.29 -202.76 78.23 211.288.51 -68.0 -2.78 -231.90 -205.58 79.34 215.768.56 -68.1 -2.79 -234.66 -208.67 80.47 220.418.61 -67.8 -2.80 -237.34 -211.29 81.58 225.078.66 -68.0 -2.81 -240.30 -214.51 82.74 230.018.71 -68.2 -2.82 -242.98 -217.13 83.96 235.238.76 -68.1 -2.83 -245.80 -219.95 85.16 240.468.81 -68.1 -2.84 -248.62 -222.97 86.34 245.898.86 -68.0 -2.85 -251.58 -225.66 87.57 251.498.91 -68.1 -2.86 -254.60 -228.61 88.81 257.388.96 -68.3 -2.87 -257.62 -231.50 90.13 263.689.01 -68.2 -2.88 -260.64 -234.25 91.41 270.11
Table F.11 IDT Strength Data (NU 58-40 #11), continued
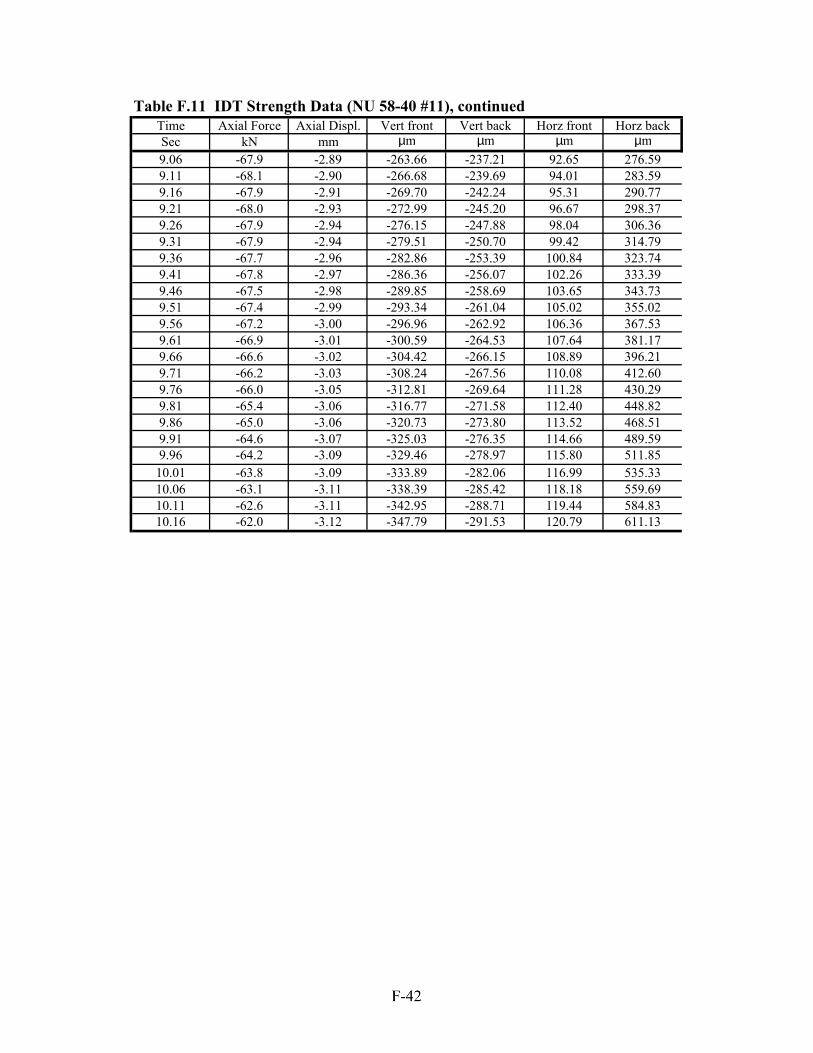
Time Axial Force Axial Displ. Vert front Vert back Horz front Horz backSec kN mm µm µm µm µm9.06 -67.9 -2.89 -263.66 -237.21 92.65 276.599.11 -68.1 -2.90 -266.68 -239.69 94.01 283.599.16 -67.9 -2.91 -269.70 -242.24 95.31 290.779.21 -68.0 -2.93 -272.99 -245.20 96.67 298.379.26 -67.9 -2.94 -276.15 -247.88 98.04 306.369.31 -67.9 -2.94 -279.51 -250.70 99.42 314.799.36 -67.7 -2.96 -282.86 -253.39 100.84 323.749.41 -67.8 -2.97 -286.36 -256.07 102.26 333.399.46 -67.5 -2.98 -289.85 -258.69 103.65 343.739.51 -67.4 -2.99 -293.34 -261.04 105.02 355.029.56 -67.2 -3.00 -296.96 -262.92 106.36 367.539.61 -66.9 -3.01 -300.59 -264.53 107.64 381.179.66 -66.6 -3.02 -304.42 -266.15 108.89 396.219.71 -66.2 -3.03 -308.24 -267.56 110.08 412.609.76 -66.0 -3.05 -312.81 -269.64 111.28 430.299.81 -65.4 -3.06 -316.77 -271.58 112.40 448.829.86 -65.0 -3.06 -320.73 -273.80 113.52 468.519.91 -64.6 -3.07 -325.03 -276.35 114.66 489.599.96 -64.2 -3.09 -329.46 -278.97 115.80 511.85
10.01 -63.8 -3.09 -333.89 -282.06 116.99 535.3310.06 -63.1 -3.11 -338.39 -285.42 118.18 559.6910.11 -62.6 -3.11 -342.95 -288.71 119.44 584.8310.16 -62.0 -3.12 -347.79 -291.53 120.79 611.13
Table F.11 IDT Strength Data (NU 58-40 #11), continued
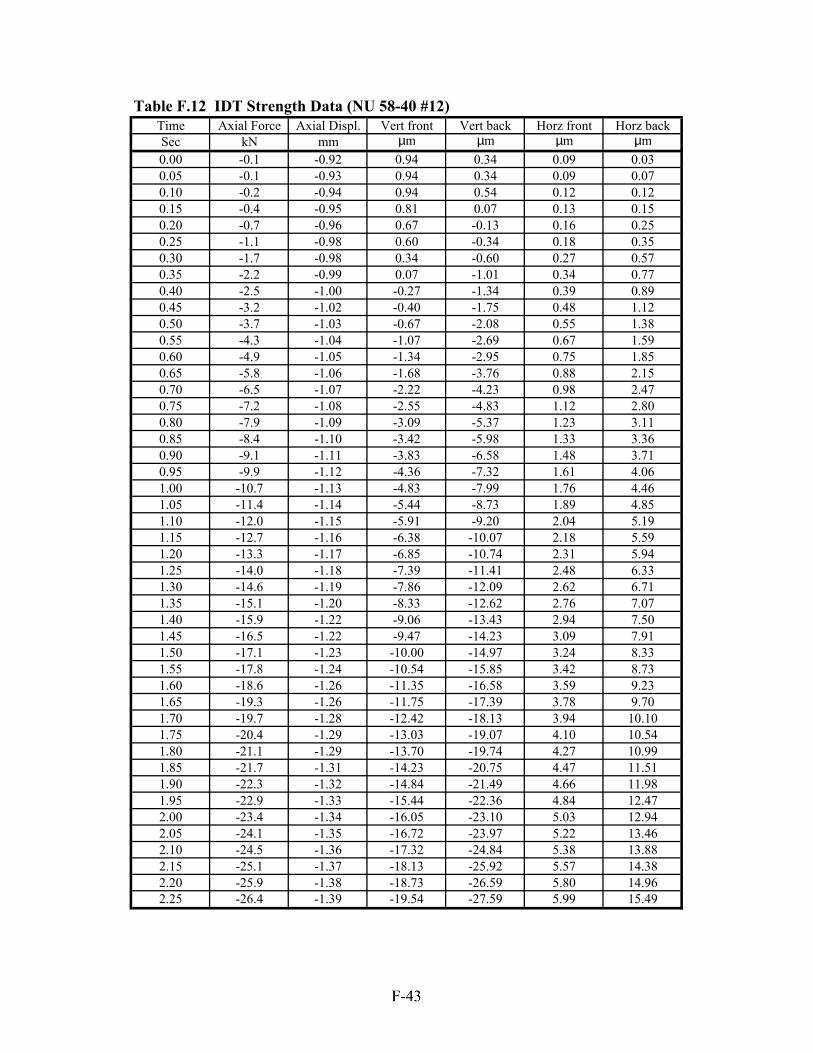
Time Axial Force Axial Displ. Vert front Vert back Horz front Horz backSec kN mm µm µm µm µm0.00 -0.1 -0.92 0.94 0.34 0.09 0.030.05 -0.1 -0.93 0.94 0.34 0.09 0.070.10 -0.2 -0.94 0.94 0.54 0.12 0.120.15 -0.4 -0.95 0.81 0.07 0.13 0.150.20 -0.7 -0.96 0.67 -0.13 0.16 0.250.25 -1.1 -0.98 0.60 -0.34 0.18 0.350.30 -1.7 -0.98 0.34 -0.60 0.27 0.570.35 -2.2 -0.99 0.07 -1.01 0.34 0.770.40 -2.5 -1.00 -0.27 -1.34 0.39 0.890.45 -3.2 -1.02 -0.40 -1.75 0.48 1.120.50 -3.7 -1.03 -0.67 -2.08 0.55 1.380.55 -4.3 -1.04 -1.07 -2.69 0.67 1.590.60 -4.9 -1.05 -1.34 -2.95 0.75 1.850.65 -5.8 -1.06 -1.68 -3.76 0.88 2.150.70 -6.5 -1.07 -2.22 -4.23 0.98 2.470.75 -7.2 -1.08 -2.55 -4.83 1.12 2.800.80 -7.9 -1.09 -3.09 -5.37 1.23 3.110.85 -8.4 -1.10 -3.42 -5.98 1.33 3.360.90 -9.1 -1.11 -3.83 -6.58 1.48 3.710.95 -9.9 -1.12 -4.36 -7.32 1.61 4.061.00 -10.7 -1.13 -4.83 -7.99 1.76 4.461.05 -11.4 -1.14 -5.44 -8.73 1.89 4.851.10 -12.0 -1.15 -5.91 -9.20 2.04 5.191.15 -12.7 -1.16 -6.38 -10.07 2.18 5.591.20 -13.3 -1.17 -6.85 -10.74 2.31 5.941.25 -14.0 -1.18 -7.39 -11.41 2.48 6.331.30 -14.6 -1.19 -7.86 -12.09 2.62 6.711.35 -15.1 -1.20 -8.33 -12.62 2.76 7.071.40 -15.9 -1.22 -9.06 -13.43 2.94 7.501.45 -16.5 -1.22 -9.47 -14.23 3.09 7.911.50 -17.1 -1.23 -10.00 -14.97 3.24 8.331.55 -17.8 -1.24 -10.54 -15.85 3.42 8.731.60 -18.6 -1.26 -11.35 -16.58 3.59 9.231.65 -19.3 -1.26 -11.75 -17.39 3.78 9.701.70 -19.7 -1.28 -12.42 -18.13 3.94 10.101.75 -20.4 -1.29 -13.03 -19.07 4.10 10.541.80 -21.1 -1.29 -13.70 -19.74 4.27 10.991.85 -21.7 -1.31 -14.23 -20.75 4.47 11.511.90 -22.3 -1.32 -14.84 -21.49 4.66 11.981.95 -22.9 -1.33 -15.44 -22.36 4.84 12.472.00 -23.4 -1.34 -16.05 -23.10 5.03 12.942.05 -24.1 -1.35 -16.72 -23.97 5.22 13.462.10 -24.5 -1.36 -17.32 -24.84 5.38 13.882.15 -25.1 -1.37 -18.13 -25.92 5.57 14.382.20 -25.9 -1.38 -18.73 -26.59 5.80 14.962.25 -26.4 -1.39 -19.54 -27.59 5.99 15.49
Table F.12 IDT Strength Data (NU 58-40 #12)
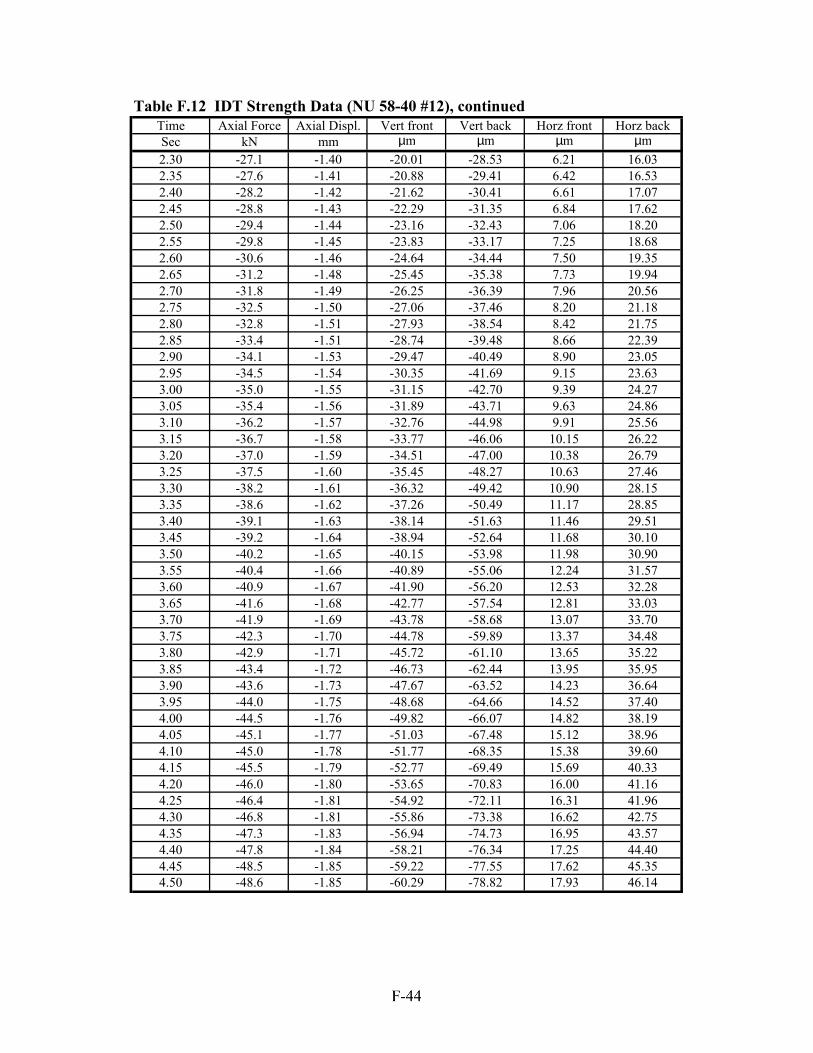
Time Axial Force Axial Displ. Vert front Vert back Horz front Horz backSec kN mm µm µm µm µm2.30 -27.1 -1.40 -20.01 -28.53 6.21 16.032.35 -27.6 -1.41 -20.88 -29.41 6.42 16.532.40 -28.2 -1.42 -21.62 -30.41 6.61 17.072.45 -28.8 -1.43 -22.29 -31.35 6.84 17.622.50 -29.4 -1.44 -23.16 -32.43 7.06 18.202.55 -29.8 -1.45 -23.83 -33.17 7.25 18.682.60 -30.6 -1.46 -24.64 -34.44 7.50 19.352.65 -31.2 -1.48 -25.45 -35.38 7.73 19.942.70 -31.8 -1.49 -26.25 -36.39 7.96 20.562.75 -32.5 -1.50 -27.06 -37.46 8.20 21.182.80 -32.8 -1.51 -27.93 -38.54 8.42 21.752.85 -33.4 -1.51 -28.74 -39.48 8.66 22.392.90 -34.1 -1.53 -29.47 -40.49 8.90 23.052.95 -34.5 -1.54 -30.35 -41.69 9.15 23.633.00 -35.0 -1.55 -31.15 -42.70 9.39 24.273.05 -35.4 -1.56 -31.89 -43.71 9.63 24.863.10 -36.2 -1.57 -32.76 -44.98 9.91 25.563.15 -36.7 -1.58 -33.77 -46.06 10.15 26.223.20 -37.0 -1.59 -34.51 -47.00 10.38 26.793.25 -37.5 -1.60 -35.45 -48.27 10.63 27.463.30 -38.2 -1.61 -36.32 -49.42 10.90 28.153.35 -38.6 -1.62 -37.26 -50.49 11.17 28.853.40 -39.1 -1.63 -38.14 -51.63 11.46 29.513.45 -39.2 -1.64 -38.94 -52.64 11.68 30.103.50 -40.2 -1.65 -40.15 -53.98 11.98 30.903.55 -40.4 -1.66 -40.89 -55.06 12.24 31.573.60 -40.9 -1.67 -41.90 -56.20 12.53 32.283.65 -41.6 -1.68 -42.77 -57.54 12.81 33.033.70 -41.9 -1.69 -43.78 -58.68 13.07 33.703.75 -42.3 -1.70 -44.78 -59.89 13.37 34.483.80 -42.9 -1.71 -45.72 -61.10 13.65 35.223.85 -43.4 -1.72 -46.73 -62.44 13.95 35.953.90 -43.6 -1.73 -47.67 -63.52 14.23 36.643.95 -44.0 -1.75 -48.68 -64.66 14.52 37.404.00 -44.5 -1.76 -49.82 -66.07 14.82 38.194.05 -45.1 -1.77 -51.03 -67.48 15.12 38.964.10 -45.0 -1.78 -51.77 -68.35 15.38 39.604.15 -45.5 -1.79 -52.77 -69.49 15.69 40.334.20 -46.0 -1.80 -53.65 -70.83 16.00 41.164.25 -46.4 -1.81 -54.92 -72.11 16.31 41.964.30 -46.8 -1.81 -55.86 -73.38 16.62 42.754.35 -47.3 -1.83 -56.94 -74.73 16.95 43.574.40 -47.8 -1.84 -58.21 -76.34 17.25 44.404.45 -48.5 -1.85 -59.22 -77.55 17.62 45.354.50 -48.6 -1.85 -60.29 -78.82 17.93 46.14
Table F.12 IDT Strength Data (NU 58-40 #12), continued
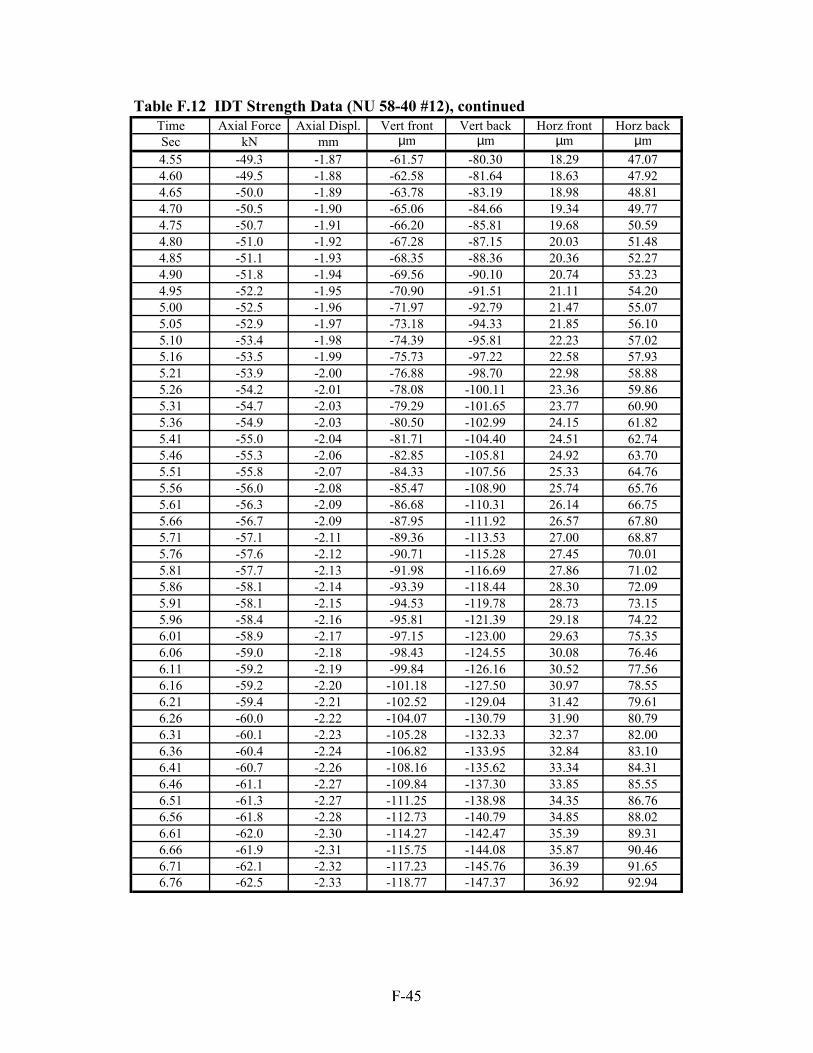
Time Axial Force Axial Displ. Vert front Vert back Horz front Horz backSec kN mm µm µm µm µm4.55 -49.3 -1.87 -61.57 -80.30 18.29 47.074.60 -49.5 -1.88 -62.58 -81.64 18.63 47.924.65 -50.0 -1.89 -63.78 -83.19 18.98 48.814.70 -50.5 -1.90 -65.06 -84.66 19.34 49.774.75 -50.7 -1.91 -66.20 -85.81 19.68 50.594.80 -51.0 -1.92 -67.28 -87.15 20.03 51.484.85 -51.1 -1.93 -68.35 -88.36 20.36 52.274.90 -51.8 -1.94 -69.56 -90.10 20.74 53.234.95 -52.2 -1.95 -70.90 -91.51 21.11 54.205.00 -52.5 -1.96 -71.97 -92.79 21.47 55.075.05 -52.9 -1.97 -73.18 -94.33 21.85 56.105.10 -53.4 -1.98 -74.39 -95.81 22.23 57.025.16 -53.5 -1.99 -75.73 -97.22 22.58 57.935.21 -53.9 -2.00 -76.88 -98.70 22.98 58.885.26 -54.2 -2.01 -78.08 -100.11 23.36 59.865.31 -54.7 -2.03 -79.29 -101.65 23.77 60.905.36 -54.9 -2.03 -80.50 -102.99 24.15 61.825.41 -55.0 -2.04 -81.71 -104.40 24.51 62.745.46 -55.3 -2.06 -82.85 -105.81 24.92 63.705.51 -55.8 -2.07 -84.33 -107.56 25.33 64.765.56 -56.0 -2.08 -85.47 -108.90 25.74 65.765.61 -56.3 -2.09 -86.68 -110.31 26.14 66.755.66 -56.7 -2.09 -87.95 -111.92 26.57 67.805.71 -57.1 -2.11 -89.36 -113.53 27.00 68.875.76 -57.6 -2.12 -90.71 -115.28 27.45 70.015.81 -57.7 -2.13 -91.98 -116.69 27.86 71.025.86 -58.1 -2.14 -93.39 -118.44 28.30 72.095.91 -58.1 -2.15 -94.53 -119.78 28.73 73.155.96 -58.4 -2.16 -95.81 -121.39 29.18 74.226.01 -58.9 -2.17 -97.15 -123.00 29.63 75.356.06 -59.0 -2.18 -98.43 -124.55 30.08 76.466.11 -59.2 -2.19 -99.84 -126.16 30.52 77.566.16 -59.2 -2.20 -101.18 -127.50 30.97 78.556.21 -59.4 -2.21 -102.52 -129.04 31.42 79.616.26 -60.0 -2.22 -104.07 -130.79 31.90 80.796.31 -60.1 -2.23 -105.28 -132.33 32.37 82.006.36 -60.4 -2.24 -106.82 -133.95 32.84 83.106.41 -60.7 -2.26 -108.16 -135.62 33.34 84.316.46 -61.1 -2.27 -109.84 -137.30 33.85 85.556.51 -61.3 -2.27 -111.25 -138.98 34.35 86.766.56 -61.8 -2.28 -112.73 -140.79 34.85 88.026.61 -62.0 -2.30 -114.27 -142.47 35.39 89.316.66 -61.9 -2.31 -115.75 -144.08 35.87 90.466.71 -62.1 -2.32 -117.23 -145.76 36.39 91.656.76 -62.5 -2.33 -118.77 -147.37 36.92 92.94
Table F.12 IDT Strength Data (NU 58-40 #12), continued
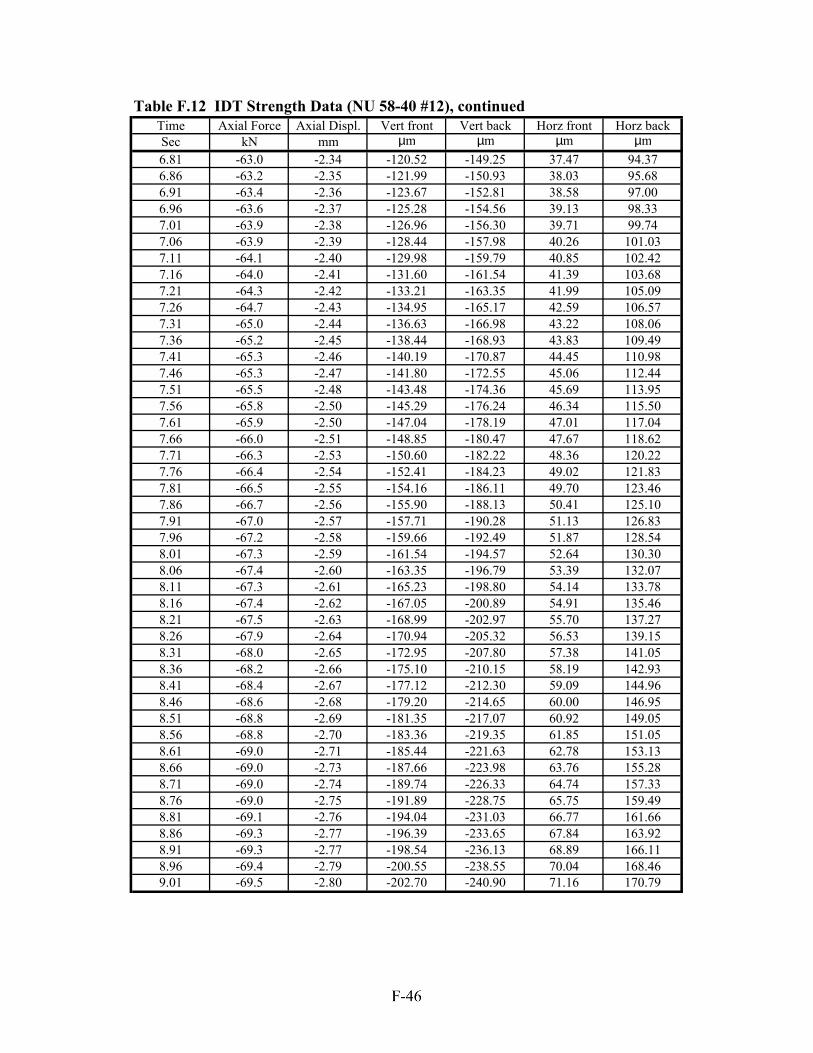
Time Axial Force Axial Displ. Vert front Vert back Horz front Horz backSec kN mm µm µm µm µm6.81 -63.0 -2.34 -120.52 -149.25 37.47 94.376.86 -63.2 -2.35 -121.99 -150.93 38.03 95.686.91 -63.4 -2.36 -123.67 -152.81 38.58 97.006.96 -63.6 -2.37 -125.28 -154.56 39.13 98.337.01 -63.9 -2.38 -126.96 -156.30 39.71 99.747.06 -63.9 -2.39 -128.44 -157.98 40.26 101.037.11 -64.1 -2.40 -129.98 -159.79 40.85 102.427.16 -64.0 -2.41 -131.60 -161.54 41.39 103.687.21 -64.3 -2.42 -133.21 -163.35 41.99 105.097.26 -64.7 -2.43 -134.95 -165.17 42.59 106.577.31 -65.0 -2.44 -136.63 -166.98 43.22 108.067.36 -65.2 -2.45 -138.44 -168.93 43.83 109.497.41 -65.3 -2.46 -140.19 -170.87 44.45 110.987.46 -65.3 -2.47 -141.80 -172.55 45.06 112.447.51 -65.5 -2.48 -143.48 -174.36 45.69 113.957.56 -65.8 -2.50 -145.29 -176.24 46.34 115.507.61 -65.9 -2.50 -147.04 -178.19 47.01 117.047.66 -66.0 -2.51 -148.85 -180.47 47.67 118.627.71 -66.3 -2.53 -150.60 -182.22 48.36 120.227.76 -66.4 -2.54 -152.41 -184.23 49.02 121.837.81 -66.5 -2.55 -154.16 -186.11 49.70 123.467.86 -66.7 -2.56 -155.90 -188.13 50.41 125.107.91 -67.0 -2.57 -157.71 -190.28 51.13 126.837.96 -67.2 -2.58 -159.66 -192.49 51.87 128.548.01 -67.3 -2.59 -161.54 -194.57 52.64 130.308.06 -67.4 -2.60 -163.35 -196.79 53.39 132.078.11 -67.3 -2.61 -165.23 -198.80 54.14 133.788.16 -67.4 -2.62 -167.05 -200.89 54.91 135.468.21 -67.5 -2.63 -168.99 -202.97 55.70 137.278.26 -67.9 -2.64 -170.94 -205.32 56.53 139.158.31 -68.0 -2.65 -172.95 -207.80 57.38 141.058.36 -68.2 -2.66 -175.10 -210.15 58.19 142.938.41 -68.4 -2.67 -177.12 -212.30 59.09 144.968.46 -68.6 -2.68 -179.20 -214.65 60.00 146.958.51 -68.8 -2.69 -181.35 -217.07 60.92 149.058.56 -68.8 -2.70 -183.36 -219.35 61.85 151.058.61 -69.0 -2.71 -185.44 -221.63 62.78 153.138.66 -69.0 -2.73 -187.66 -223.98 63.76 155.288.71 -69.0 -2.74 -189.74 -226.33 64.74 157.338.76 -69.0 -2.75 -191.89 -228.75 65.75 159.498.81 -69.1 -2.76 -194.04 -231.03 66.77 161.668.86 -69.3 -2.77 -196.39 -233.65 67.84 163.928.91 -69.3 -2.77 -198.54 -236.13 68.89 166.118.96 -69.4 -2.79 -200.55 -238.55 70.04 168.469.01 -69.5 -2.80 -202.70 -240.90 71.16 170.79
Table F.12 IDT Strength Data (NU 58-40 #12), continued
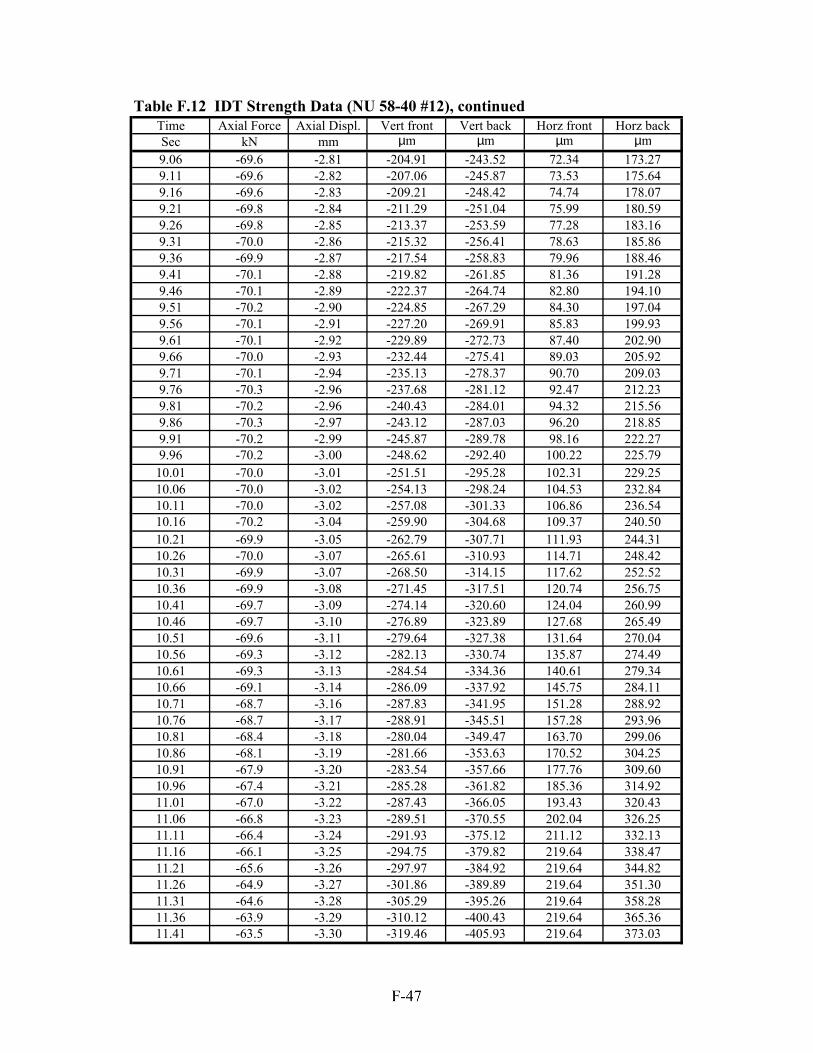
Time Axial Force Axial Displ. Vert front Vert back Horz front Horz backSec kN mm µm µm µm µm9.06 -69.6 -2.81 -204.91 -243.52 72.34 173.279.11 -69.6 -2.82 -207.06 -245.87 73.53 175.649.16 -69.6 -2.83 -209.21 -248.42 74.74 178.079.21 -69.8 -2.84 -211.29 -251.04 75.99 180.599.26 -69.8 -2.85 -213.37 -253.59 77.28 183.169.31 -70.0 -2.86 -215.32 -256.41 78.63 185.869.36 -69.9 -2.87 -217.54 -258.83 79.96 188.469.41 -70.1 -2.88 -219.82 -261.85 81.36 191.289.46 -70.1 -2.89 -222.37 -264.74 82.80 194.109.51 -70.2 -2.90 -224.85 -267.29 84.30 197.049.56 -70.1 -2.91 -227.20 -269.91 85.83 199.939.61 -70.1 -2.92 -229.89 -272.73 87.40 202.909.66 -70.0 -2.93 -232.44 -275.41 89.03 205.929.71 -70.1 -2.94 -235.13 -278.37 90.70 209.039.76 -70.3 -2.96 -237.68 -281.12 92.47 212.239.81 -70.2 -2.96 -240.43 -284.01 94.32 215.569.86 -70.3 -2.97 -243.12 -287.03 96.20 218.859.91 -70.2 -2.99 -245.87 -289.78 98.16 222.279.96 -70.2 -3.00 -248.62 -292.40 100.22 225.79
10.01 -70.0 -3.01 -251.51 -295.28 102.31 229.2510.06 -70.0 -3.02 -254.13 -298.24 104.53 232.8410.11 -70.0 -3.02 -257.08 -301.33 106.86 236.5410.16 -70.2 -3.04 -259.90 -304.68 109.37 240.5010.21 -69.9 -3.05 -262.79 -307.71 111.93 244.3110.26 -70.0 -3.07 -265.61 -310.93 114.71 248.4210.31 -69.9 -3.07 -268.50 -314.15 117.62 252.5210.36 -69.9 -3.08 -271.45 -317.51 120.74 256.7510.41 -69.7 -3.09 -274.14 -320.60 124.04 260.9910.46 -69.7 -3.10 -276.89 -323.89 127.68 265.4910.51 -69.6 -3.11 -279.64 -327.38 131.64 270.0410.56 -69.3 -3.12 -282.13 -330.74 135.87 274.4910.61 -69.3 -3.13 -284.54 -334.36 140.61 279.3410.66 -69.1 -3.14 -286.09 -337.92 145.75 284.1110.71 -68.7 -3.16 -287.83 -341.95 151.28 288.9210.76 -68.7 -3.17 -288.91 -345.51 157.28 293.9610.81 -68.4 -3.18 -280.04 -349.47 163.70 299.0610.86 -68.1 -3.19 -281.66 -353.63 170.52 304.2510.91 -67.9 -3.20 -283.54 -357.66 177.76 309.6010.96 -67.4 -3.21 -285.28 -361.82 185.36 314.9211.01 -67.0 -3.22 -287.43 -366.05 193.43 320.4311.06 -66.8 -3.23 -289.51 -370.55 202.04 326.2511.11 -66.4 -3.24 -291.93 -375.12 211.12 332.1311.16 -66.1 -3.25 -294.75 -379.82 219.64 338.4711.21 -65.6 -3.26 -297.97 -384.92 219.64 344.8211.26 -64.9 -3.27 -301.86 -389.89 219.64 351.3011.31 -64.6 -3.28 -305.29 -395.26 219.64 358.2811.36 -63.9 -3.29 -310.12 -400.43 219.64 365.3611.41 -63.5 -3.30 -319.46 -405.93 219.64 373.03
Table F.12 IDT Strength Data (NU 58-40 #12), continued
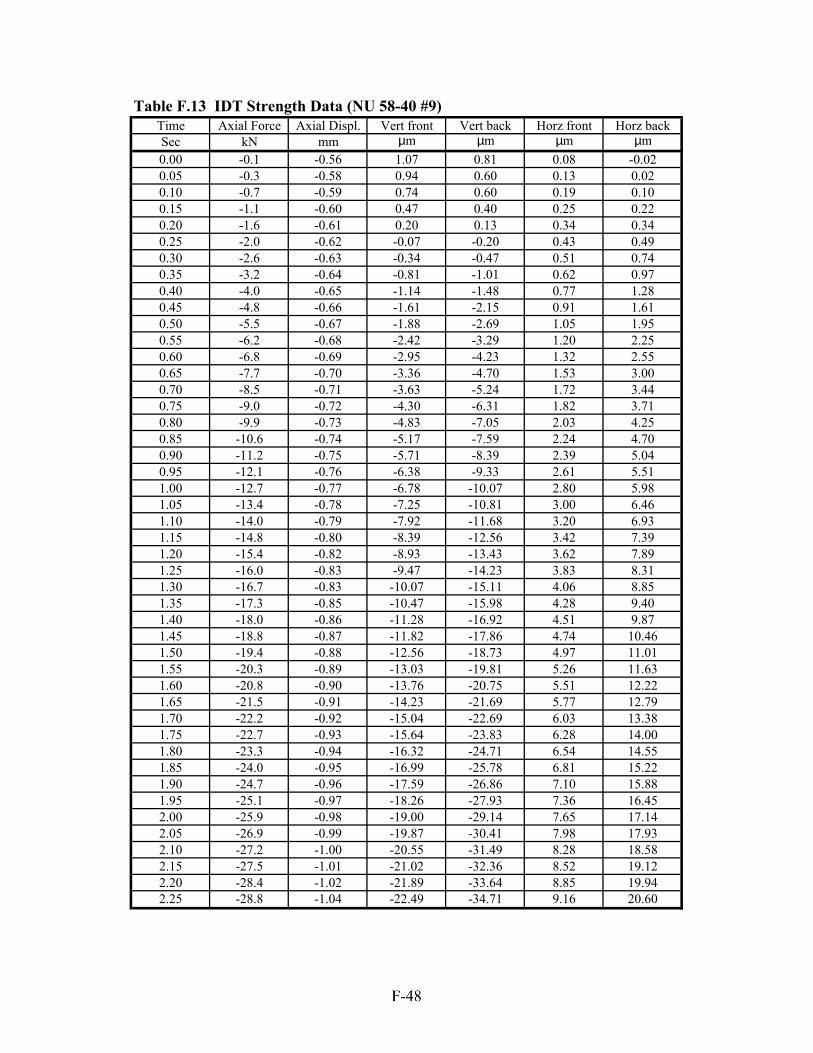
Time Axial Force Axial Displ. Vert front Vert back Horz front Horz backSec kN mm µm µm µm µm0.00 -0.1 -0.56 1.07 0.81 0.08 -0.020.05 -0.3 -0.58 0.94 0.60 0.13 0.020.10 -0.7 -0.59 0.74 0.60 0.19 0.100.15 -1.1 -0.60 0.47 0.40 0.25 0.220.20 -1.6 -0.61 0.20 0.13 0.34 0.340.25 -2.0 -0.62 -0.07 -0.20 0.43 0.490.30 -2.6 -0.63 -0.34 -0.47 0.51 0.740.35 -3.2 -0.64 -0.81 -1.01 0.62 0.970.40 -4.0 -0.65 -1.14 -1.48 0.77 1.280.45 -4.8 -0.66 -1.61 -2.15 0.91 1.610.50 -5.5 -0.67 -1.88 -2.69 1.05 1.950.55 -6.2 -0.68 -2.42 -3.29 1.20 2.250.60 -6.8 -0.69 -2.95 -4.23 1.32 2.550.65 -7.7 -0.70 -3.36 -4.70 1.53 3.000.70 -8.5 -0.71 -3.63 -5.24 1.72 3.440.75 -9.0 -0.72 -4.30 -6.31 1.82 3.710.80 -9.9 -0.73 -4.83 -7.05 2.03 4.250.85 -10.6 -0.74 -5.17 -7.59 2.24 4.700.90 -11.2 -0.75 -5.71 -8.39 2.39 5.040.95 -12.1 -0.76 -6.38 -9.33 2.61 5.511.00 -12.7 -0.77 -6.78 -10.07 2.80 5.981.05 -13.4 -0.78 -7.25 -10.81 3.00 6.461.10 -14.0 -0.79 -7.92 -11.68 3.20 6.931.15 -14.8 -0.80 -8.39 -12.56 3.42 7.391.20 -15.4 -0.82 -8.93 -13.43 3.62 7.891.25 -16.0 -0.83 -9.47 -14.23 3.83 8.311.30 -16.7 -0.83 -10.07 -15.11 4.06 8.851.35 -17.3 -0.85 -10.47 -15.98 4.28 9.401.40 -18.0 -0.86 -11.28 -16.92 4.51 9.871.45 -18.8 -0.87 -11.82 -17.86 4.74 10.461.50 -19.4 -0.88 -12.56 -18.73 4.97 11.011.55 -20.3 -0.89 -13.03 -19.81 5.26 11.631.60 -20.8 -0.90 -13.76 -20.75 5.51 12.221.65 -21.5 -0.91 -14.23 -21.69 5.77 12.791.70 -22.2 -0.92 -15.04 -22.69 6.03 13.381.75 -22.7 -0.93 -15.64 -23.83 6.28 14.001.80 -23.3 -0.94 -16.32 -24.71 6.54 14.551.85 -24.0 -0.95 -16.99 -25.78 6.81 15.221.90 -24.7 -0.96 -17.59 -26.86 7.10 15.881.95 -25.1 -0.97 -18.26 -27.93 7.36 16.452.00 -25.9 -0.98 -19.00 -29.14 7.65 17.142.05 -26.9 -0.99 -19.87 -30.41 7.98 17.932.10 -27.2 -1.00 -20.55 -31.49 8.28 18.582.15 -27.5 -1.01 -21.02 -32.36 8.52 19.122.20 -28.4 -1.02 -21.89 -33.64 8.85 19.942.25 -28.8 -1.04 -22.49 -34.71 9.16 20.60
Table F.13 IDT Strength Data (NU 58-40 #9)
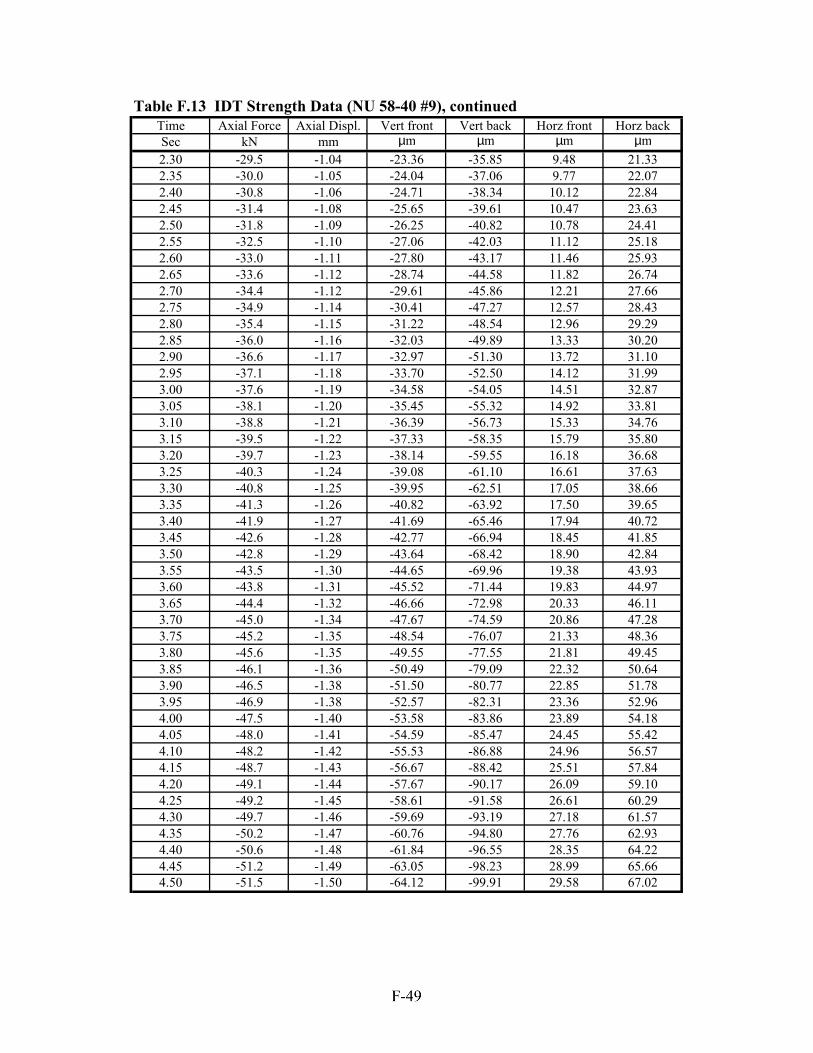
Time Axial Force Axial Displ. Vert front Vert back Horz front Horz backSec kN mm µm µm µm µm2.30 -29.5 -1.04 -23.36 -35.85 9.48 21.332.35 -30.0 -1.05 -24.04 -37.06 9.77 22.072.40 -30.8 -1.06 -24.71 -38.34 10.12 22.842.45 -31.4 -1.08 -25.65 -39.61 10.47 23.632.50 -31.8 -1.09 -26.25 -40.82 10.78 24.412.55 -32.5 -1.10 -27.06 -42.03 11.12 25.182.60 -33.0 -1.11 -27.80 -43.17 11.46 25.932.65 -33.6 -1.12 -28.74 -44.58 11.82 26.742.70 -34.4 -1.12 -29.61 -45.86 12.21 27.662.75 -34.9 -1.14 -30.41 -47.27 12.57 28.432.80 -35.4 -1.15 -31.22 -48.54 12.96 29.292.85 -36.0 -1.16 -32.03 -49.89 13.33 30.202.90 -36.6 -1.17 -32.97 -51.30 13.72 31.102.95 -37.1 -1.18 -33.70 -52.50 14.12 31.993.00 -37.6 -1.19 -34.58 -54.05 14.51 32.873.05 -38.1 -1.20 -35.45 -55.32 14.92 33.813.10 -38.8 -1.21 -36.39 -56.73 15.33 34.763.15 -39.5 -1.22 -37.33 -58.35 15.79 35.803.20 -39.7 -1.23 -38.14 -59.55 16.18 36.683.25 -40.3 -1.24 -39.08 -61.10 16.61 37.633.30 -40.8 -1.25 -39.95 -62.51 17.05 38.663.35 -41.3 -1.26 -40.82 -63.92 17.50 39.653.40 -41.9 -1.27 -41.69 -65.46 17.94 40.723.45 -42.6 -1.28 -42.77 -66.94 18.45 41.853.50 -42.8 -1.29 -43.64 -68.42 18.90 42.843.55 -43.5 -1.30 -44.65 -69.96 19.38 43.933.60 -43.8 -1.31 -45.52 -71.44 19.83 44.973.65 -44.4 -1.32 -46.66 -72.98 20.33 46.113.70 -45.0 -1.34 -47.67 -74.59 20.86 47.283.75 -45.2 -1.35 -48.54 -76.07 21.33 48.363.80 -45.6 -1.35 -49.55 -77.55 21.81 49.453.85 -46.1 -1.36 -50.49 -79.09 22.32 50.643.90 -46.5 -1.38 -51.50 -80.77 22.85 51.783.95 -46.9 -1.38 -52.57 -82.31 23.36 52.964.00 -47.5 -1.40 -53.58 -83.86 23.89 54.184.05 -48.0 -1.41 -54.59 -85.47 24.45 55.424.10 -48.2 -1.42 -55.53 -86.88 24.96 56.574.15 -48.7 -1.43 -56.67 -88.42 25.51 57.844.20 -49.1 -1.44 -57.67 -90.17 26.09 59.104.25 -49.2 -1.45 -58.61 -91.58 26.61 60.294.30 -49.7 -1.46 -59.69 -93.19 27.18 61.574.35 -50.2 -1.47 -60.76 -94.80 27.76 62.934.40 -50.6 -1.48 -61.84 -96.55 28.35 64.224.45 -51.2 -1.49 -63.05 -98.23 28.99 65.664.50 -51.5 -1.50 -64.12 -99.91 29.58 67.02
Table F.13 IDT Strength Data (NU 58-40 #9), continued
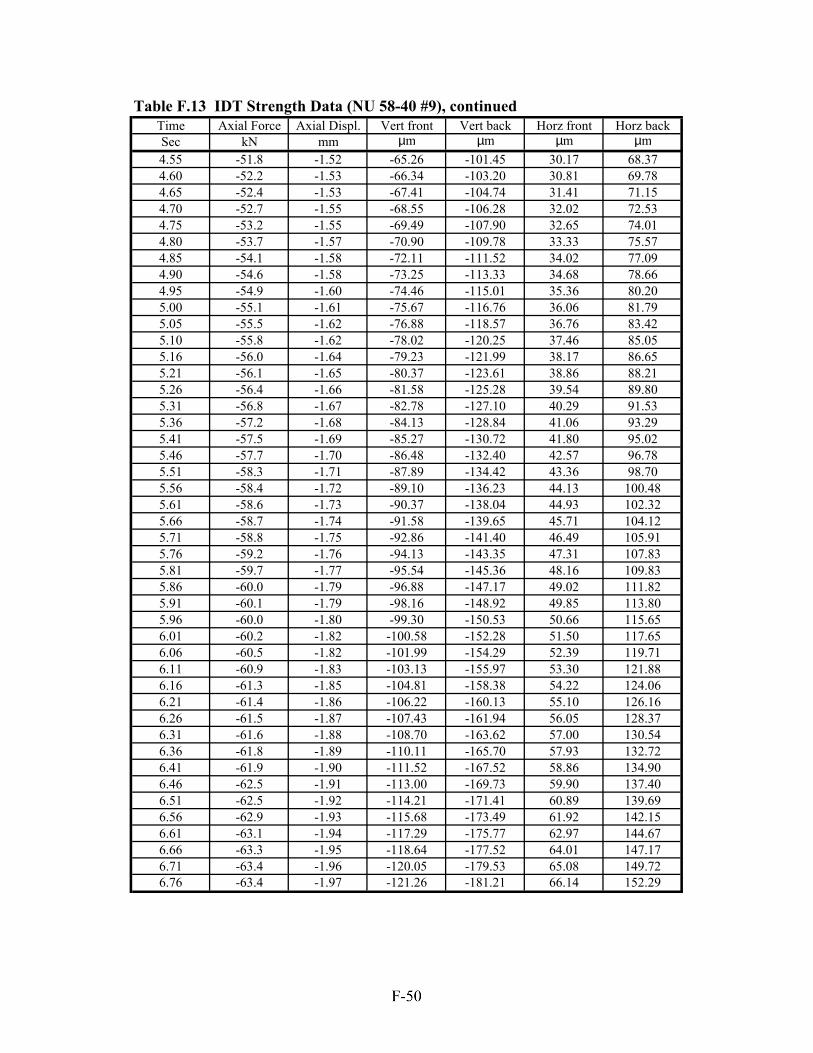
Time Axial Force Axial Displ. Vert front Vert back Horz front Horz backSec kN mm µm µm µm µm4.55 -51.8 -1.52 -65.26 -101.45 30.17 68.374.60 -52.2 -1.53 -66.34 -103.20 30.81 69.784.65 -52.4 -1.53 -67.41 -104.74 31.41 71.154.70 -52.7 -1.55 -68.55 -106.28 32.02 72.534.75 -53.2 -1.55 -69.49 -107.90 32.65 74.014.80 -53.7 -1.57 -70.90 -109.78 33.33 75.574.85 -54.1 -1.58 -72.11 -111.52 34.02 77.094.90 -54.6 -1.58 -73.25 -113.33 34.68 78.664.95 -54.9 -1.60 -74.46 -115.01 35.36 80.205.00 -55.1 -1.61 -75.67 -116.76 36.06 81.795.05 -55.5 -1.62 -76.88 -118.57 36.76 83.425.10 -55.8 -1.62 -78.02 -120.25 37.46 85.055.16 -56.0 -1.64 -79.23 -121.99 38.17 86.655.21 -56.1 -1.65 -80.37 -123.61 38.86 88.215.26 -56.4 -1.66 -81.58 -125.28 39.54 89.805.31 -56.8 -1.67 -82.78 -127.10 40.29 91.535.36 -57.2 -1.68 -84.13 -128.84 41.06 93.295.41 -57.5 -1.69 -85.27 -130.72 41.80 95.025.46 -57.7 -1.70 -86.48 -132.40 42.57 96.785.51 -58.3 -1.71 -87.89 -134.42 43.36 98.705.56 -58.4 -1.72 -89.10 -136.23 44.13 100.485.61 -58.6 -1.73 -90.37 -138.04 44.93 102.325.66 -58.7 -1.74 -91.58 -139.65 45.71 104.125.71 -58.8 -1.75 -92.86 -141.40 46.49 105.915.76 -59.2 -1.76 -94.13 -143.35 47.31 107.835.81 -59.7 -1.77 -95.54 -145.36 48.16 109.835.86 -60.0 -1.79 -96.88 -147.17 49.02 111.825.91 -60.1 -1.79 -98.16 -148.92 49.85 113.805.96 -60.0 -1.80 -99.30 -150.53 50.66 115.656.01 -60.2 -1.82 -100.58 -152.28 51.50 117.656.06 -60.5 -1.82 -101.99 -154.29 52.39 119.716.11 -60.9 -1.83 -103.13 -155.97 53.30 121.886.16 -61.3 -1.85 -104.81 -158.38 54.22 124.066.21 -61.4 -1.86 -106.22 -160.13 55.10 126.166.26 -61.5 -1.87 -107.43 -161.94 56.05 128.376.31 -61.6 -1.88 -108.70 -163.62 57.00 130.546.36 -61.8 -1.89 -110.11 -165.70 57.93 132.726.41 -61.9 -1.90 -111.52 -167.52 58.86 134.906.46 -62.5 -1.91 -113.00 -169.73 59.90 137.406.51 -62.5 -1.92 -114.21 -171.41 60.89 139.696.56 -62.9 -1.93 -115.68 -173.49 61.92 142.156.61 -63.1 -1.94 -117.29 -175.77 62.97 144.676.66 -63.3 -1.95 -118.64 -177.52 64.01 147.176.71 -63.4 -1.96 -120.05 -179.53 65.08 149.726.76 -63.4 -1.97 -121.26 -181.21 66.14 152.29
Table F.13 IDT Strength Data (NU 58-40 #9), continued
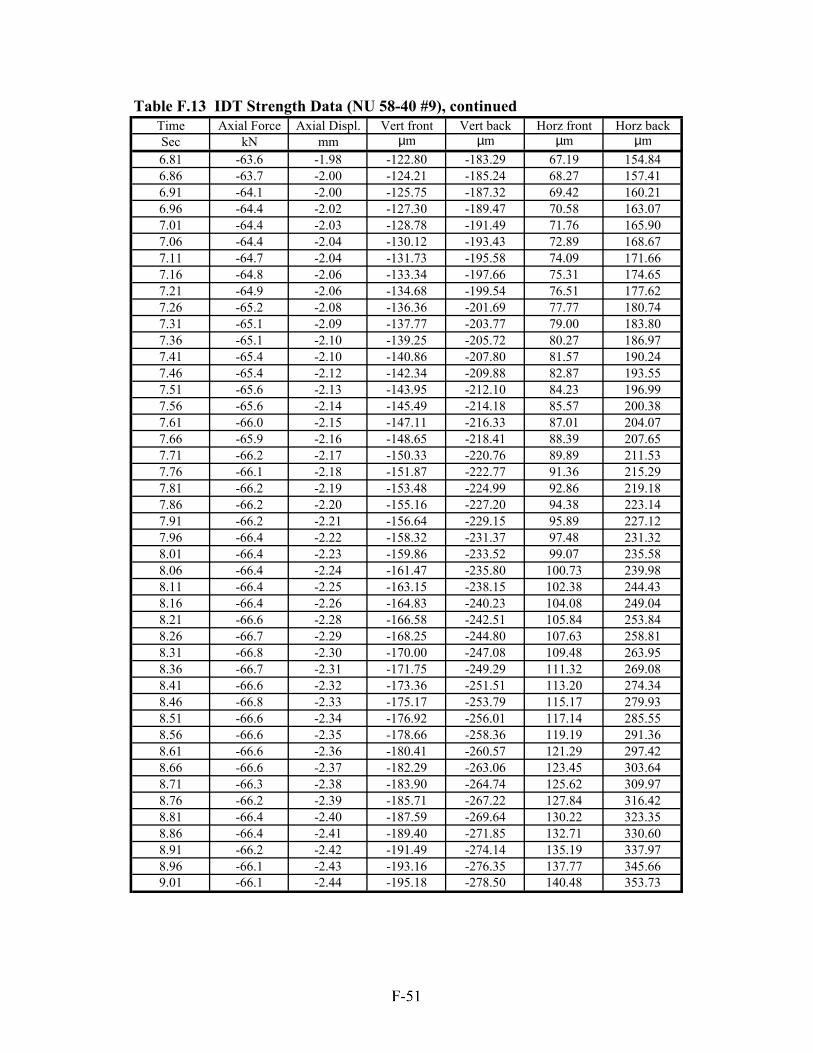
Time Axial Force Axial Displ. Vert front Vert back Horz front Horz backSec kN mm µm µm µm µm6.81 -63.6 -1.98 -122.80 -183.29 67.19 154.846.86 -63.7 -2.00 -124.21 -185.24 68.27 157.416.91 -64.1 -2.00 -125.75 -187.32 69.42 160.216.96 -64.4 -2.02 -127.30 -189.47 70.58 163.077.01 -64.4 -2.03 -128.78 -191.49 71.76 165.907.06 -64.4 -2.04 -130.12 -193.43 72.89 168.677.11 -64.7 -2.04 -131.73 -195.58 74.09 171.667.16 -64.8 -2.06 -133.34 -197.66 75.31 174.657.21 -64.9 -2.06 -134.68 -199.54 76.51 177.627.26 -65.2 -2.08 -136.36 -201.69 77.77 180.747.31 -65.1 -2.09 -137.77 -203.77 79.00 183.807.36 -65.1 -2.10 -139.25 -205.72 80.27 186.977.41 -65.4 -2.10 -140.86 -207.80 81.57 190.247.46 -65.4 -2.12 -142.34 -209.88 82.87 193.557.51 -65.6 -2.13 -143.95 -212.10 84.23 196.997.56 -65.6 -2.14 -145.49 -214.18 85.57 200.387.61 -66.0 -2.15 -147.11 -216.33 87.01 204.077.66 -65.9 -2.16 -148.65 -218.41 88.39 207.657.71 -66.2 -2.17 -150.33 -220.76 89.89 211.537.76 -66.1 -2.18 -151.87 -222.77 91.36 215.297.81 -66.2 -2.19 -153.48 -224.99 92.86 219.187.86 -66.2 -2.20 -155.16 -227.20 94.38 223.147.91 -66.2 -2.21 -156.64 -229.15 95.89 227.127.96 -66.4 -2.22 -158.32 -231.37 97.48 231.328.01 -66.4 -2.23 -159.86 -233.52 99.07 235.588.06 -66.4 -2.24 -161.47 -235.80 100.73 239.988.11 -66.4 -2.25 -163.15 -238.15 102.38 244.438.16 -66.4 -2.26 -164.83 -240.23 104.08 249.048.21 -66.6 -2.28 -166.58 -242.51 105.84 253.848.26 -66.7 -2.29 -168.25 -244.80 107.63 258.818.31 -66.8 -2.30 -170.00 -247.08 109.48 263.958.36 -66.7 -2.31 -171.75 -249.29 111.32 269.088.41 -66.6 -2.32 -173.36 -251.51 113.20 274.348.46 -66.8 -2.33 -175.17 -253.79 115.17 279.938.51 -66.6 -2.34 -176.92 -256.01 117.14 285.558.56 -66.6 -2.35 -178.66 -258.36 119.19 291.368.61 -66.6 -2.36 -180.41 -260.57 121.29 297.428.66 -66.6 -2.37 -182.29 -263.06 123.45 303.648.71 -66.3 -2.38 -183.90 -264.74 125.62 309.978.76 -66.2 -2.39 -185.71 -267.22 127.84 316.428.81 -66.4 -2.40 -187.59 -269.64 130.22 323.358.86 -66.4 -2.41 -189.40 -271.85 132.71 330.608.91 -66.2 -2.42 -191.49 -274.14 135.19 337.978.96 -66.1 -2.43 -193.16 -276.35 137.77 345.669.01 -66.1 -2.44 -195.18 -278.50 140.48 353.73
Table F.13 IDT Strength Data (NU 58-40 #9), continued
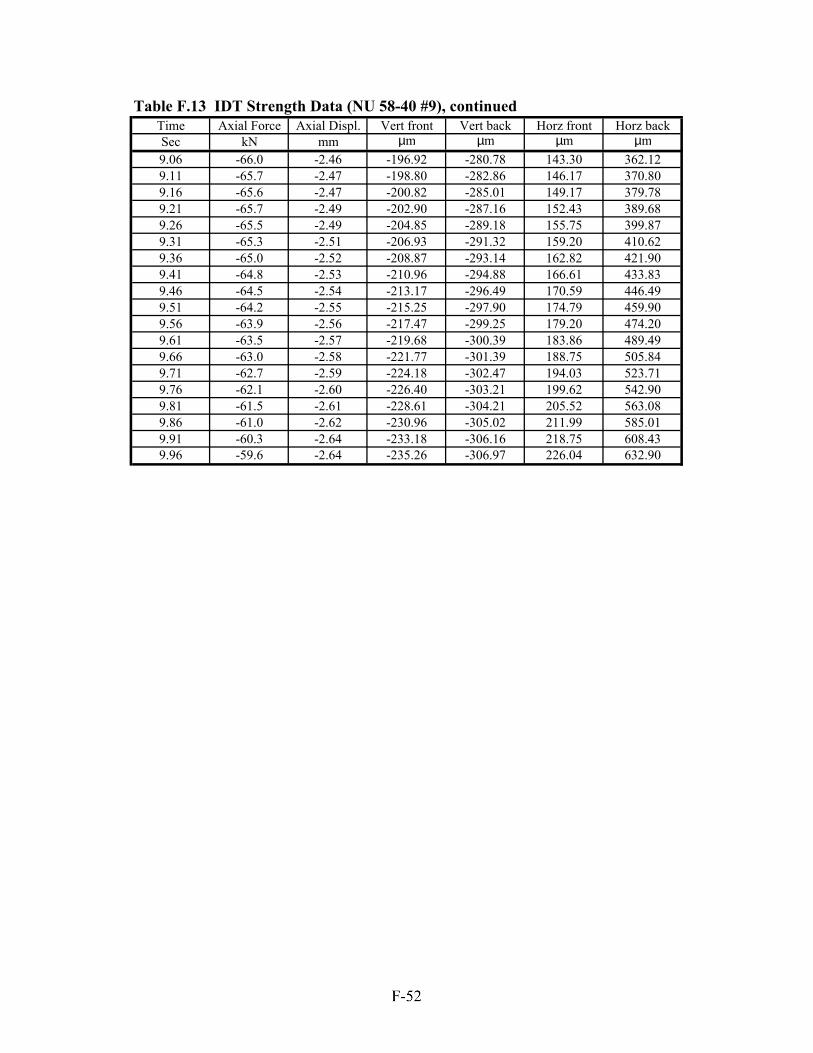
Time Axial Force Axial Displ. Vert front Vert back Horz front Horz backSec kN mm µm µm µm µm9.06 -66.0 -2.46 -196.92 -280.78 143.30 362.129.11 -65.7 -2.47 -198.80 -282.86 146.17 370.809.16 -65.6 -2.47 -200.82 -285.01 149.17 379.789.21 -65.7 -2.49 -202.90 -287.16 152.43 389.689.26 -65.5 -2.49 -204.85 -289.18 155.75 399.879.31 -65.3 -2.51 -206.93 -291.32 159.20 410.629.36 -65.0 -2.52 -208.87 -293.14 162.82 421.909.41 -64.8 -2.53 -210.96 -294.88 166.61 433.839.46 -64.5 -2.54 -213.17 -296.49 170.59 446.499.51 -64.2 -2.55 -215.25 -297.90 174.79 459.909.56 -63.9 -2.56 -217.47 -299.25 179.20 474.209.61 -63.5 -2.57 -219.68 -300.39 183.86 489.499.66 -63.0 -2.58 -221.77 -301.39 188.75 505.849.71 -62.7 -2.59 -224.18 -302.47 194.03 523.719.76 -62.1 -2.60 -226.40 -303.21 199.62 542.909.81 -61.5 -2.61 -228.61 -304.21 205.52 563.089.86 -61.0 -2.62 -230.96 -305.02 211.99 585.019.91 -60.3 -2.64 -233.18 -306.16 218.75 608.439.96 -59.6 -2.64 -235.26 -306.97 226.04 632.90
Table F.13 IDT Strength Data (NU 58-40 #9), continued


