Page 1
Supplement of Atmos. Chem. Phys., 16, 11899–11913, 2016http://www.atmos-chem-phys.net/16/11899/2016/doi:10.5194/acp-16-11899-2016-supplement© Author(s) 2016. CC Attribution 3.0 License.
Supplement of
Molecular composition of organic aerosols in central Amazonia:an ultra-high-resolution mass spectrometry studyIvan Kourtchev et al.
Correspondence to: Ivan Kourtchev ([email protected] ) and Markus Kalberer ([email protected] )
The copyright of individual parts of the supplement might differ from the CC-BY 3.0 licence.
Page 2
2
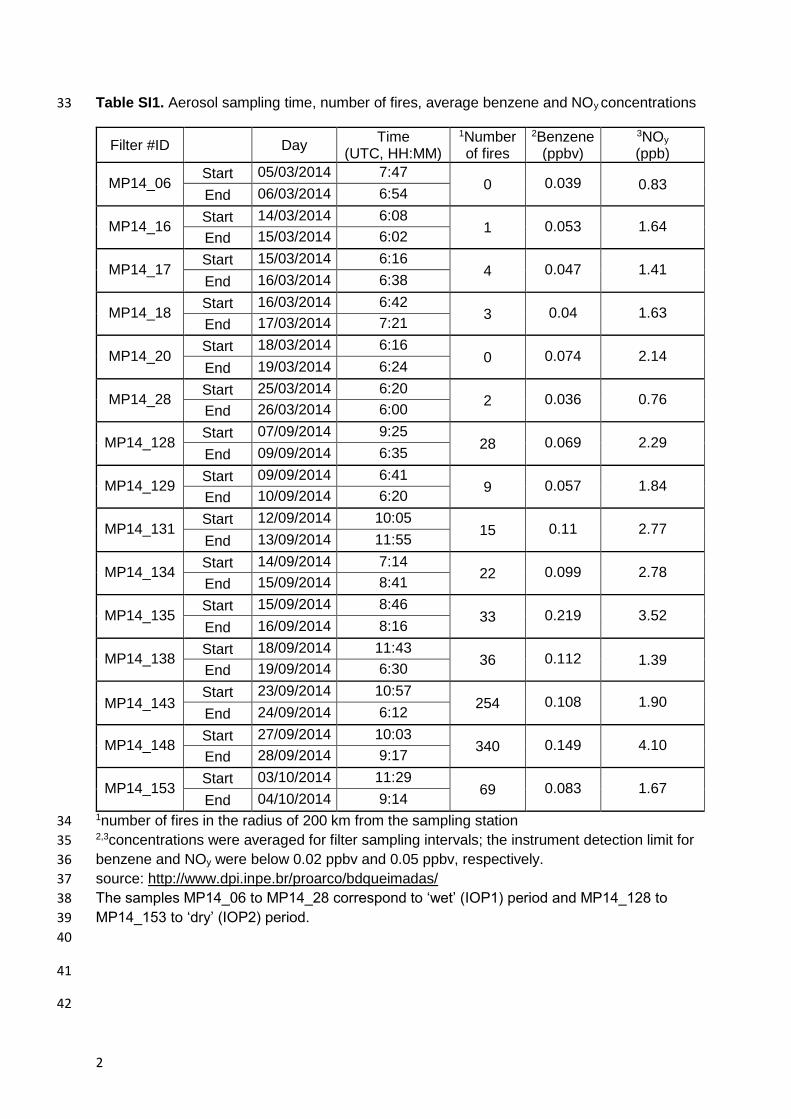
Table SI1. Aerosol sampling time, number of fires, average benzene and NOy concentrations 33
Filter #ID Day Time
(UTC, HH:MM)
1Number of fires
2Benzene (ppbv)
3NOy (ppb)
MP14_06 Start 05/03/2014 7:47
0 0.039 0.83 End 06/03/2014 6:54
MP14_16 Start 14/03/2014 6:08
1 0.053 1.64 End 15/03/2014 6:02
MP14_17 Start 15/03/2014 6:16
4 0.047 1.41 End 16/03/2014 6:38
MP14_18 Start 16/03/2014 6:42
3 0.04 1.63 End 17/03/2014 7:21
MP14_20 Start 18/03/2014 6:16
0 0.074 2.14 End 19/03/2014 6:24
MP14_28 Start 25/03/2014 6:20
2 0.036 0.76 End 26/03/2014 6:00
MP14_128 Start 07/09/2014 9:25
28 0.069 2.29 End 09/09/2014 6:35
MP14_129 Start 09/09/2014 6:41
9 0.057 1.84 End 10/09/2014 6:20
MP14_131 Start 12/09/2014 10:05
15 0.11 2.77 End 13/09/2014 11:55
MP14_134 Start 14/09/2014 7:14
22 0.099 2.78 End 15/09/2014 8:41
MP14_135 Start 15/09/2014 8:46
33 0.219 3.52 End 16/09/2014 8:16
MP14_138 Start 18/09/2014 11:43
36 0.112 1.39 End 19/09/2014 6:30
MP14_143 Start 23/09/2014 10:57
254 0.108 1.90 End 24/09/2014 6:12
MP14_148 Start 27/09/2014 10:03
340 0.149 4.10 End 28/09/2014 9:17
MP14_153 Start 03/10/2014 11:29
69 0.083 1.67 End 04/10/2014 9:14
1number of fires in the radius of 200 km from the sampling station 34 2,3concentrations were averaged for filter sampling intervals; the instrument detection limit for 35
benzene and NOy were below 0.02 ppbv and 0.05 ppbv, respectively. 36
source: http://www.dpi.inpe.br/proarco/bdqueimadas/ 37
The samples MP14_06 to MP14_28 correspond to ‘wet’ (IOP1) period and MP14_128 to 38
MP14_153 to ‘dry’ (IOP2) period. 39
40
41
42
Page 3
3
Table SI2. Average percent occurrence of formula groups to all peaks assigned molecular 43
formulae in the mass spectra during IOP1 and IOP2 periods. 44
Elemental constituents
Percent occurrence
IOP1 IOP2
C,H,O 58 63
C,H,O,N 30 25
C,H,O,S 10 10
C,H,O,N,S 2 2
45
46
47
48
49
50
Page 4
4
51
52
53
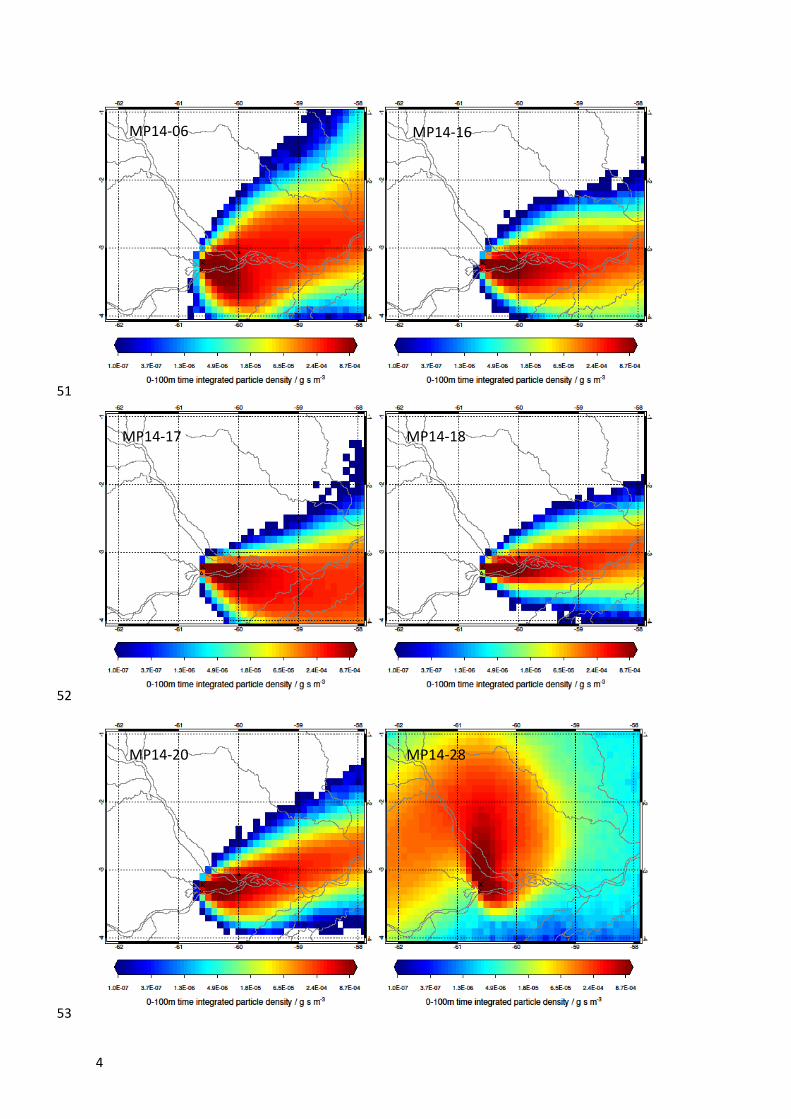
MP14-06 MP14-16
MP14-17 MP14-18
MP14-20 MP14-28
Page 5
5
54
55
56
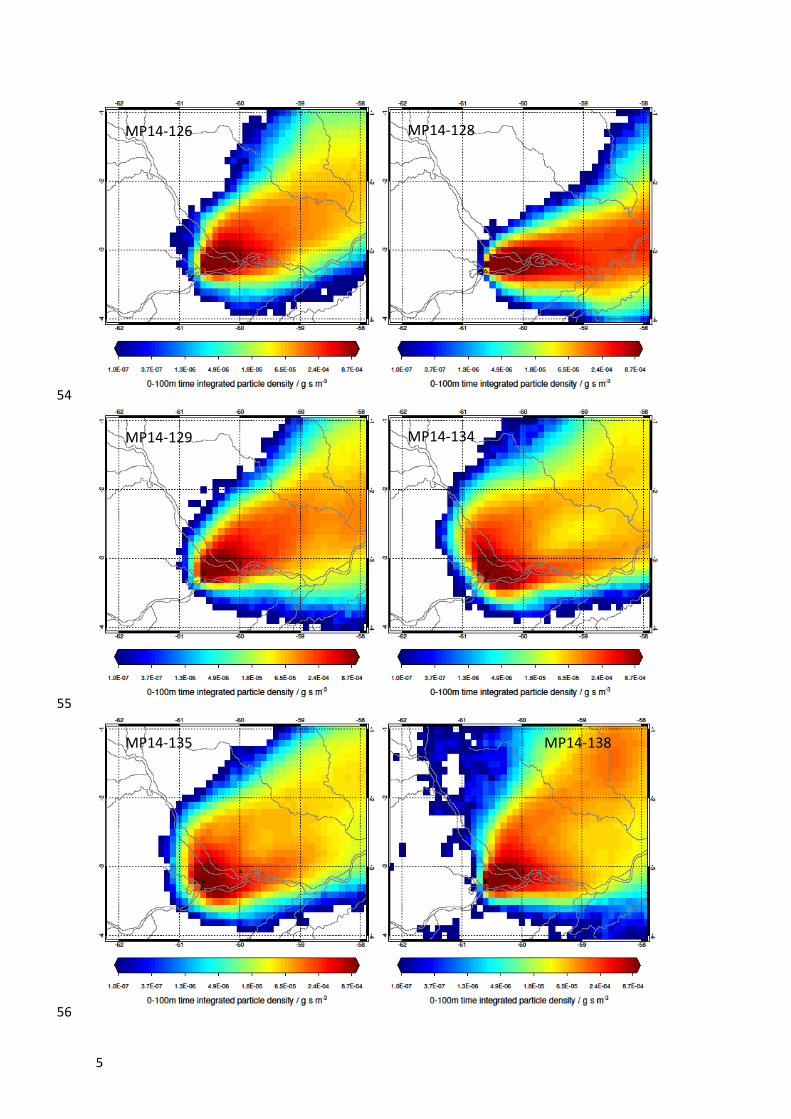
MP14-126 MP14-128
MP14-129 MP14-134
MP14-135 MP14-138
Page 6
6
57
58
Figure SI1. 72 h back air mass history (‘footprints’) arriving at the T3 station for the periods 59
of the analysed filters (labelled as e.g. MP14-06, MP14-16, MP14-17). Warmer colours 60
indicate a greater probability of a particle passing near the surface in a grid box. The 61
sampling site is indicated by a cross symbol. Manaus and Manacupuru cities are indicated 62
as triangles (far right and below of the sampling site, respectively). 63
64
MP14-143 MP14-148
MP14-153
Page 7
7
65
Figure SI2. Relative humidity (RH) at the T3 sampling site during (a) IOP1 and (b) IOP2 The 66
arrows indicate sample collection periods. Atmospheric Radiation Measurement (ARM) data 67
source http://www.archive.arm.gov. The continuous dashed line indicates the lowest and 68
highest RH vales during both seasons. 69
70
71
72
Figure SI3. Correlation between benzene and CO average concentrations during IOP1 and 73
IOP2 sampling periods at sampling T3 site. The data was averaged for aerosol filter 74
sampling intervals. Filled markers correspond to the average data points from the IOP1 and 75
empty circles correspond to that from the IOP2 period. 76
Page 8
8
77
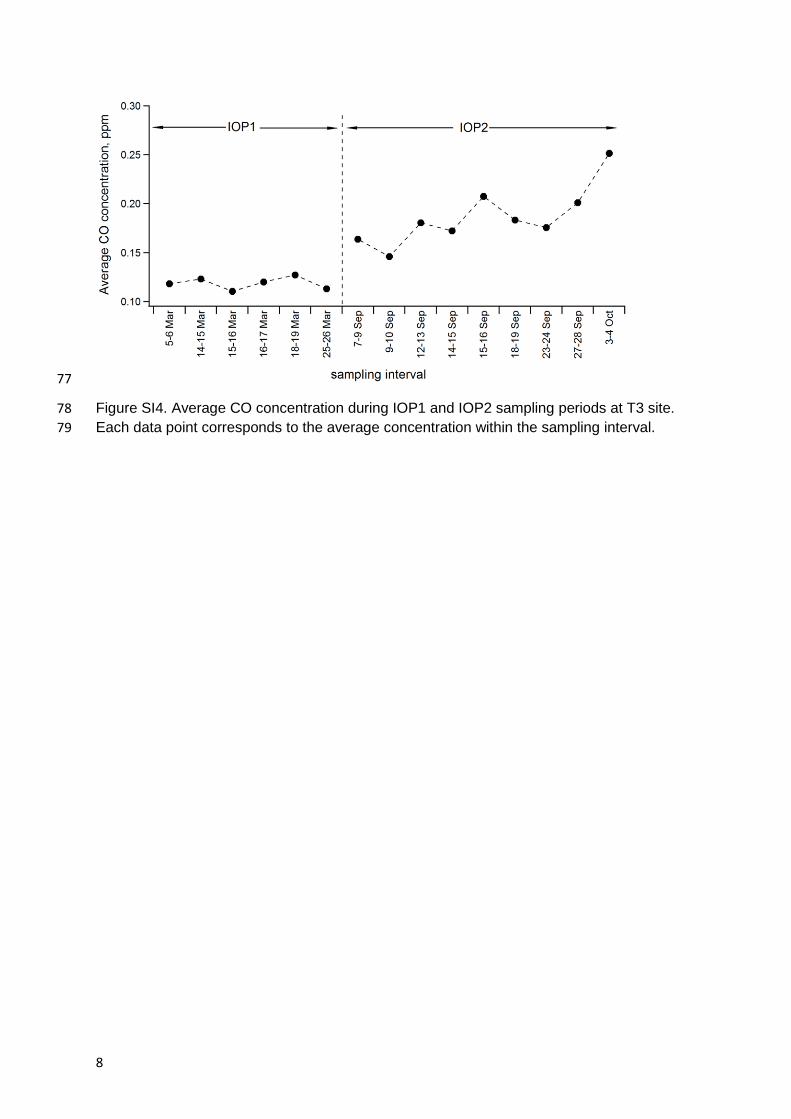
Figure SI4. Average CO concentration during IOP1 and IOP2 sampling periods at T3 site. 78
Each data point corresponds to the average concentration within the sampling interval. 79
Page 9
9
80
81
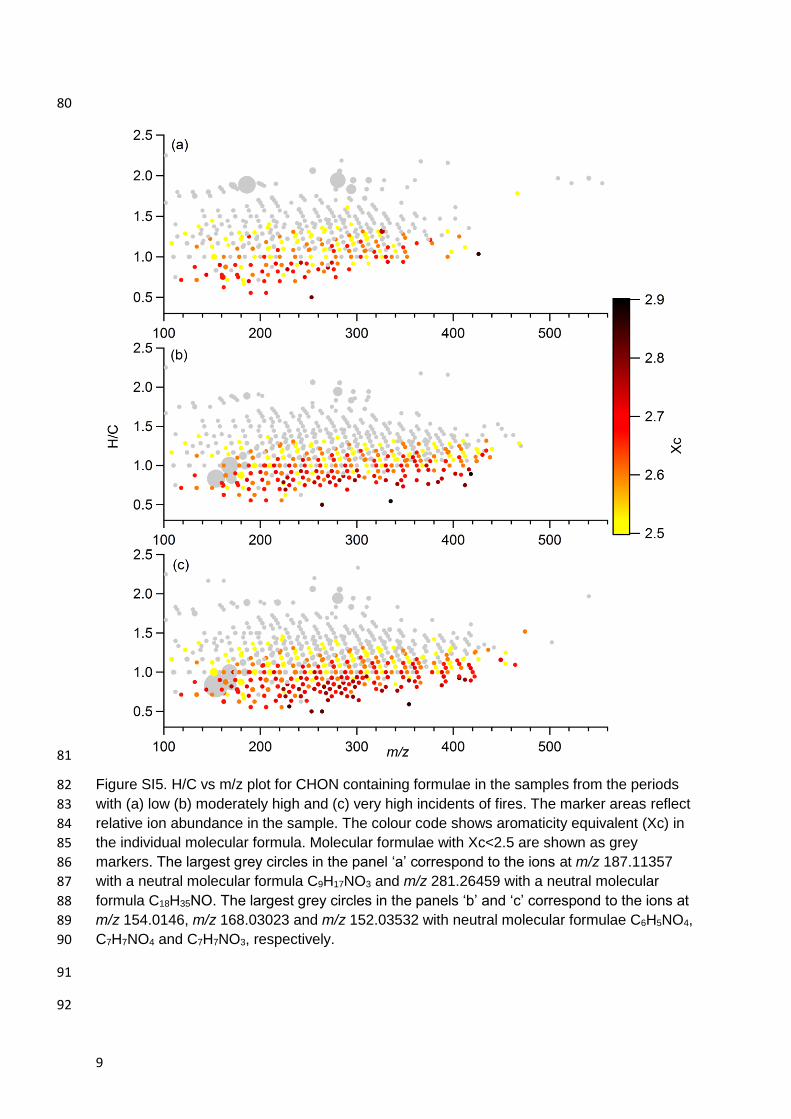
Figure SI5. H/C vs m/z plot for CHON containing formulae in the samples from the periods 82
with (a) low (b) moderately high and (c) very high incidents of fires. The marker areas reflect 83
relative ion abundance in the sample. The colour code shows aromaticity equivalent (Xc) in 84
the individual molecular formula. Molecular formulae with Xc<2.5 are shown as grey 85
markers. The largest grey circles in the panel ‘a’ correspond to the ions at m/z 187.11357 86
with a neutral molecular formula C9H17NO3 and m/z 281.26459 with a neutral molecular 87
formula C18H35NO. The largest grey circles in the panels ‘b’ and ‘c’ correspond to the ions at 88
m/z 154.0146, m/z 168.03023 and m/z 152.03532 with neutral molecular formulae C6H5NO4, 89
C7H7NO4 and C7H7NO3, respectively. 90
91
92
Page 10
10
93
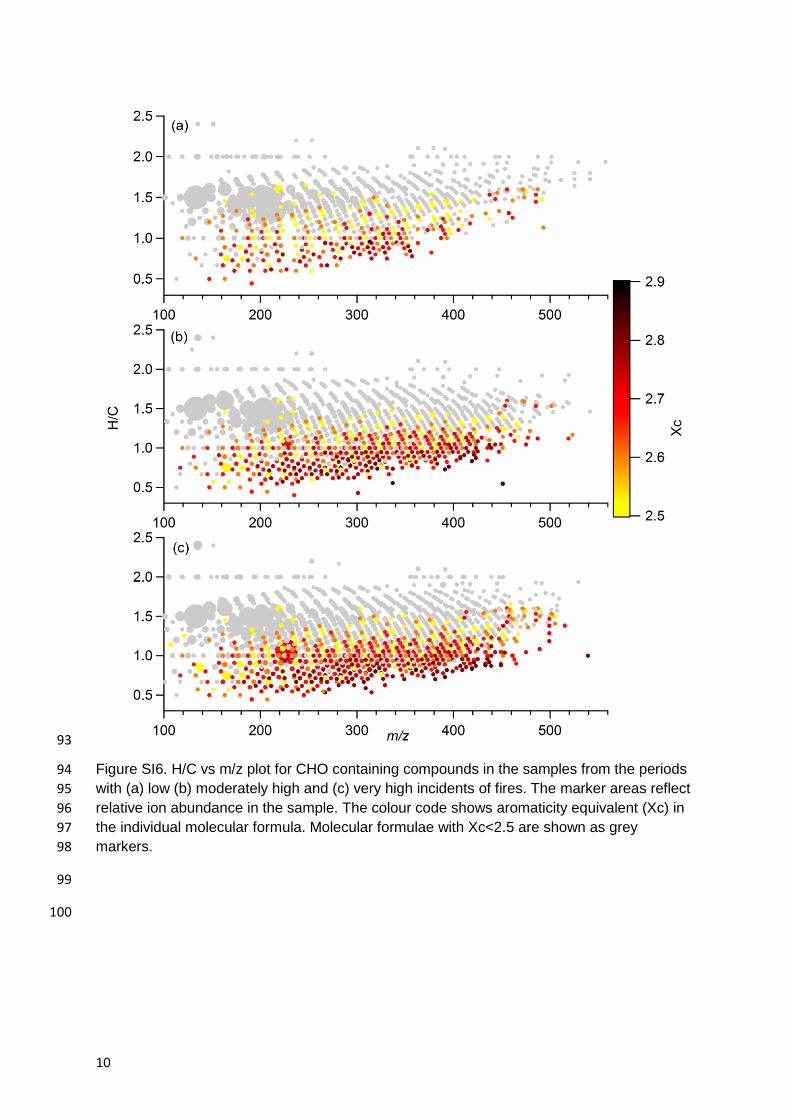
Figure SI6. H/C vs m/z plot for CHO containing compounds in the samples from the periods 94
with (a) low (b) moderately high and (c) very high incidents of fires. The marker areas reflect 95
relative ion abundance in the sample. The colour code shows aromaticity equivalent (Xc) in 96
the individual molecular formula. Molecular formulae with Xc<2.5 are shown as grey 97
markers. 98
99
100
Page 11
11
101
Figure SI7. H/C vs m/z plot for CHON containing compounds in the samples from the 102
periods with (a) low (b) moderately high and (c) very high incidents of fires. The marker 103
areas reflect relative ion abundance in the sample. The colour code shows double bond 104
equivalent (DBE) the individual molecular formula. Molecular formulae with DBE<5 are 105
shown as grey markers. The largest grey circles in panel ‘a’ correspond to ions at m/z 106
186.11357 and m/z 280.26459 with neutral molecular formulae C9H17NO3 and C18H35NO, 107
respectively. The yellow circles in panels ‘b’ and ‘c’ correspond to the ions at m/z 154.0146, 108
m/z 168.03023 and m/z 152.03532 with molecular formulae C6H5NO4, C7H7NO4 and 109
C7H7NO3, respectively, which are known biomass burning marker compounds (see 110
discussion in the main text). 111
112
113


![INDEX []€¦ · January , 2017 Start date (DD/MM/YYYY) End date (DD/MM/YYYY) Start Time (HH:MM) End Time (HH:MM) Name of the Seller Category State Name of the Buyer Category State](https://static.documents.pub/doc/80x56/5f85870f087fbf7a9e5cadbe/index-january-2017-start-date-ddmmyyyy-end-date-ddmmyyyy-start-time.jpg)

