N O T F D I C I N S U R E D | N O B A N K G U A R A N T E E | M A Y L O S E V A L U E J P M o r g a n F u n d s s t a t i s t i c s r e p o r t : H e d g e d E q u i t y F u n d T h e f u n d i s o f f e r e d o n a l i m i t e d b a s i s . D a t a a s o f D e c e m b e r 3 1 , 2 0 2 1 j p m o r g a n f u n d s . c o m
Transcript
NOT FDIC INSURED | NO BANK GUARANTEE | MAY LOSE VALUE
JPMorgan Funds statistics report:Hedged Equity FundThe fund is offered on a limited basis.
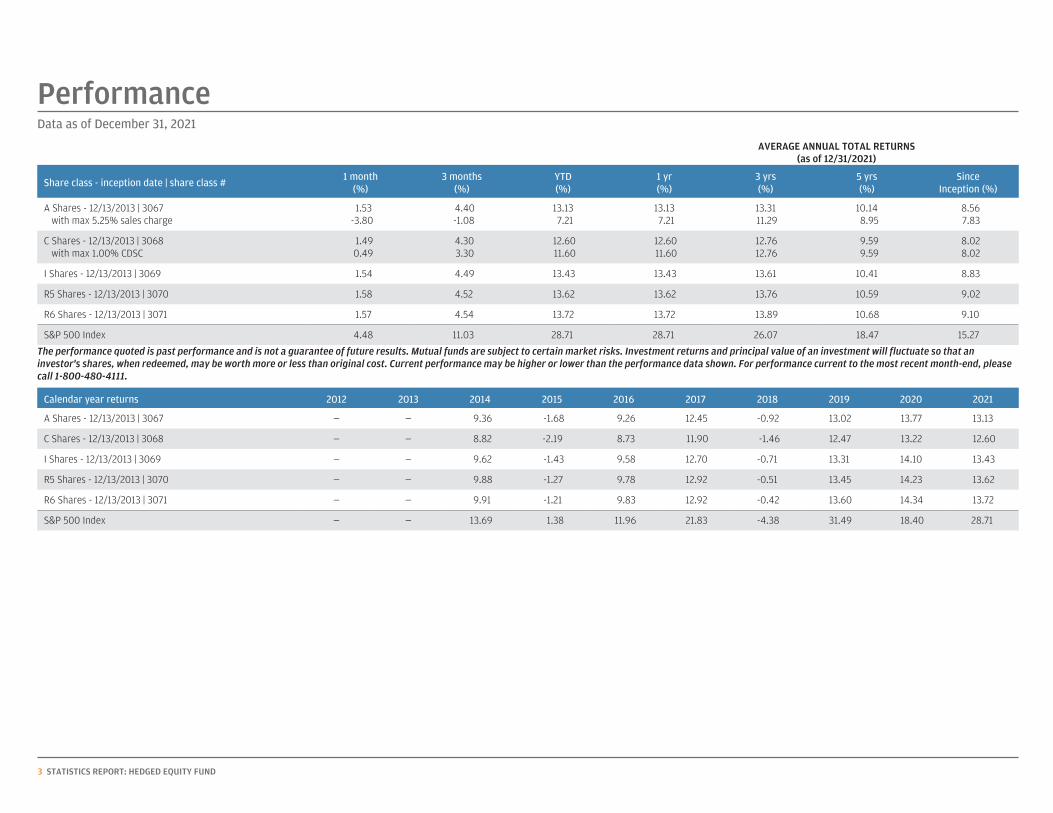
A Shares - 12/13/2013 | 3067with max 5.25% sales charge
SinceInception (%)
5 yrs(%)
3 yrs(%)
1 yr(%)
YTD(%)
3 months(%)
1 month(%)
Share class - inception date | share class #
The performance quoted is past performance and is not a guarantee of future results. Mutual funds are subject to certain market risks. Investment returns and principal value of an investment will fluctuate so that aninvestor's shares, when redeemed, may be worth more or less than original cost. Current performance may be higher or lower than the performance data shown. For performance current to the most recent month-end, pleasecall 1-800-480-4111.
28.7118.4031.49-4.3821.8311.961.3813.69——S&P 500 Index
26.4026.89Return on equity - hist 1 yr12.2914.36Return on assets - last 12 months3.113.36Price to sales weighted harmonic average21.9221.20Price to earnings - next 12 months**22.0921.48Price to cash flow - trailing 12 months4.644.60Price to book weighted harmonic average500181Number of holdings
$221.39$193.54Market cap weighted median ($ billions)$675.55$715.09Market cap weighted average ($ billions)$34.53$62.44Market cap median ($ billions)15.1715.04Earnings per share growth - 5 yr12.4012.86Earnings per share growth - 2 yr101.4998.28Debt to equity
36.80Active share (%)*
BenchmarkFund
*Data is for the underlying long only account**J.P. Morgan estimate
Percentage of portfolio***
2.91Cash-0.03Derivatives0.00Intl/ADR (by country)0.00ETFs4.17Non US Securities41.23Out of Index92.92US97.12Stocks
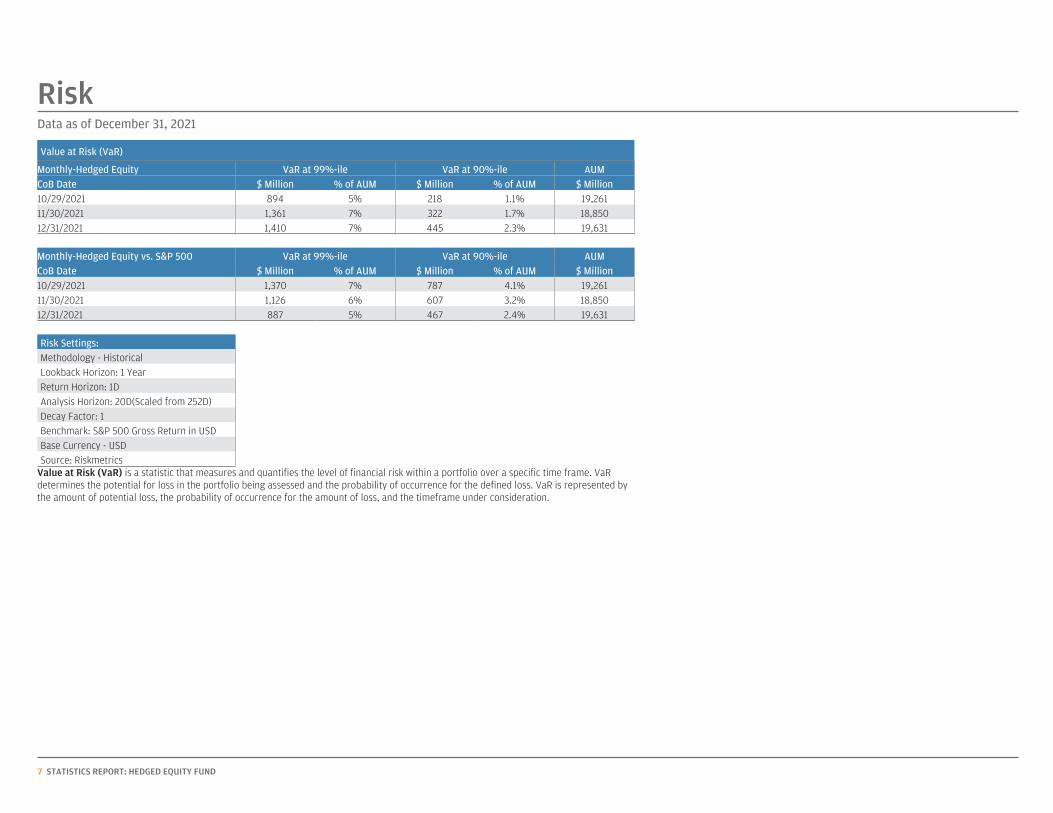
Value at Risk (VaR) is a statistic that measures and quantifies the level of financial risk within a portfolio over a specific time frame. VaRdetermines the potential for loss in the portfolio being assessed and the probability of occurrence for the defined loss. VaR is represented bythe amount of potential loss, the probability of occurrence for the amount of loss, and the timeframe under consideration.
Value at Risk (VaR) is a statistic that measures and quantifies the level of financial risk within a portfolio over a specific time frame. VaRdetermines the potential for loss in the portfolio being assessed and the probability of occurrence for the defined loss. VaR is represented bythe amount of potential loss, the probability of occurrence for the amount of loss, and the timeframe under consideration.
8 STATISTICS REPORT: HEDGED EQUITY FUND
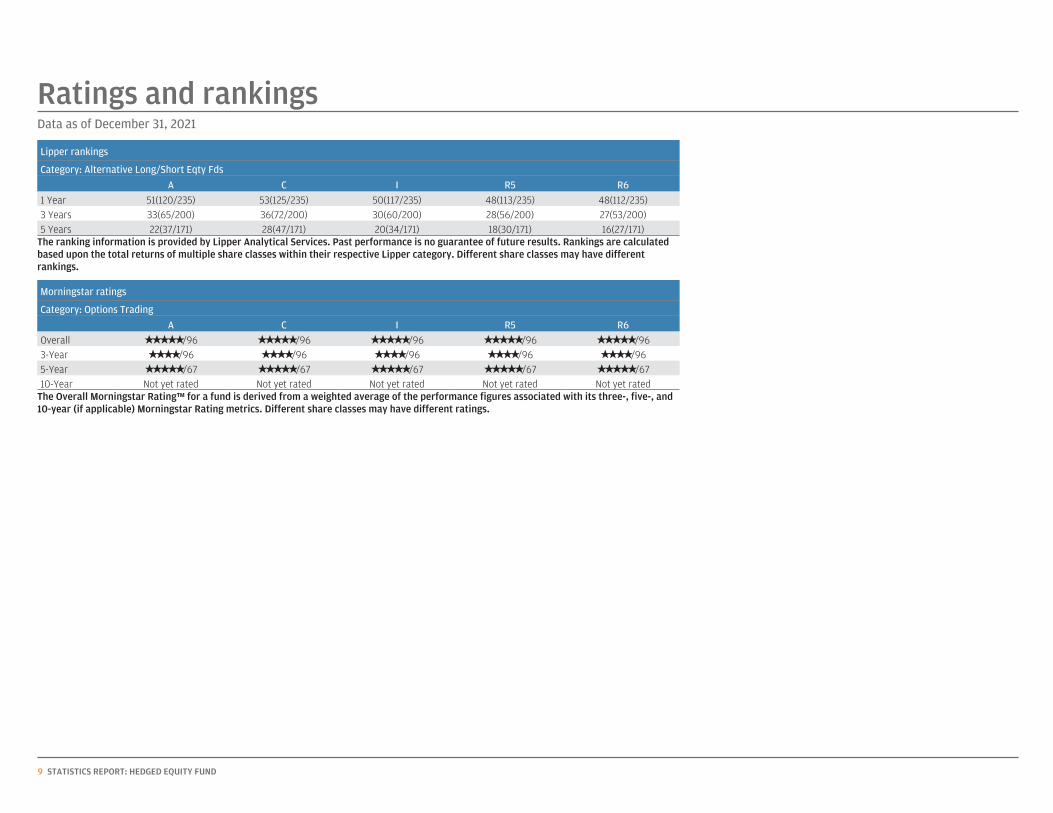
Ratings and rankingsData as of December 31, 2021
Lipper rankings
Category: Alternative Long/Short Eqty Fds
16(27/171)18(30/171)20(34/171)28(47/171)22(37/171)5 Years27(53/200)28(56/200)30(60/200)36(72/200)33(65/200)3 Years48(112/235)48(113/235)50(117/235)53(125/235)51(120/235)1 Year
R6R5ICA
The ranking information is provided by Lipper Analytical Services. Past performance is no guarantee of future results. Rankings are calculatedbased upon the total returns of multiple share classes within their respective Lipper category. Different share classes may have differentrankings.
The Overall Morningstar Rating™ for a fund is derived from a weighted average of the performance figures associated with its three-, five-, and10-year (if applicable) Morningstar Rating metrics. Different share classes may have different ratings.
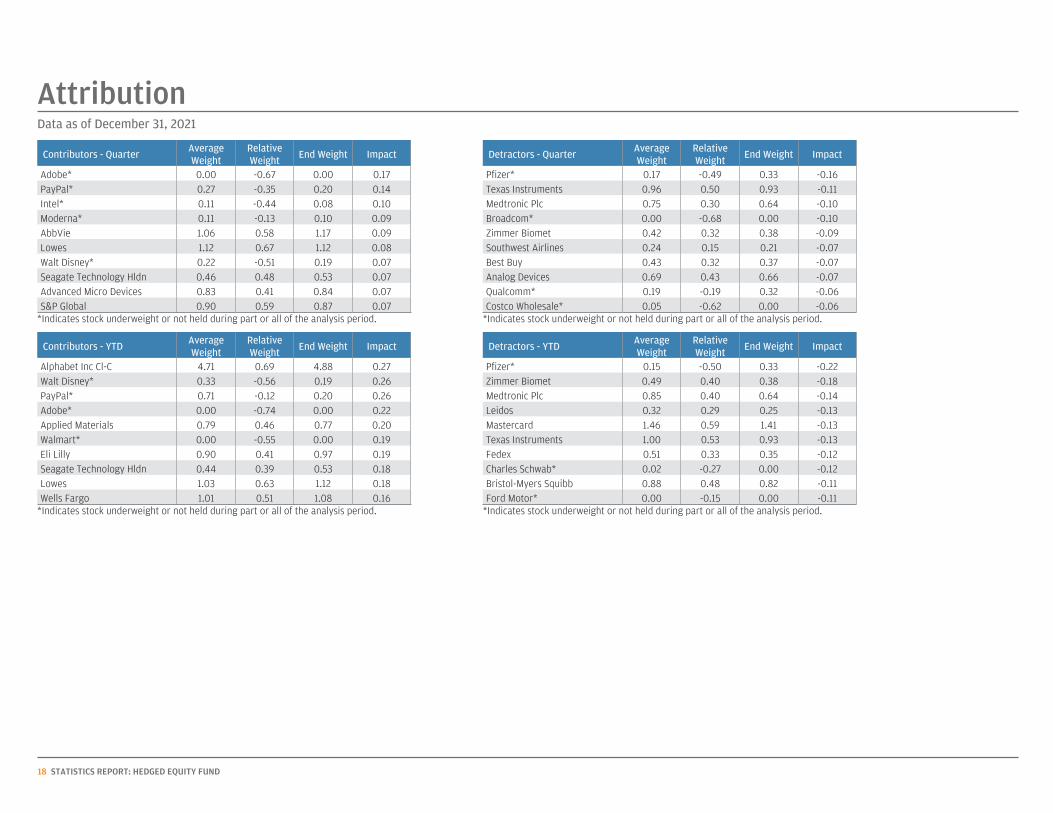
*Indicates stock underweight or not held during part or all of the analysis period.-0.060.00-0.620.05Costco Wholesale*-0.060.32-0.190.19Qualcomm*-0.070.660.430.69Analog Devices-0.070.370.320.43Best Buy-0.070.210.150.24Southwest Airlines-0.090.380.320.42Zimmer Biomet-0.100.00-0.680.00Broadcom*-0.100.640.300.75Medtronic Plc-0.110.930.500.96Texas Instruments-0.160.33-0.490.17Pfizer*
ImpactEnd WeightRelativeWeight
AverageWeight
Detractors - Quarter
*Indicates stock underweight or not held during part or all of the analysis period.
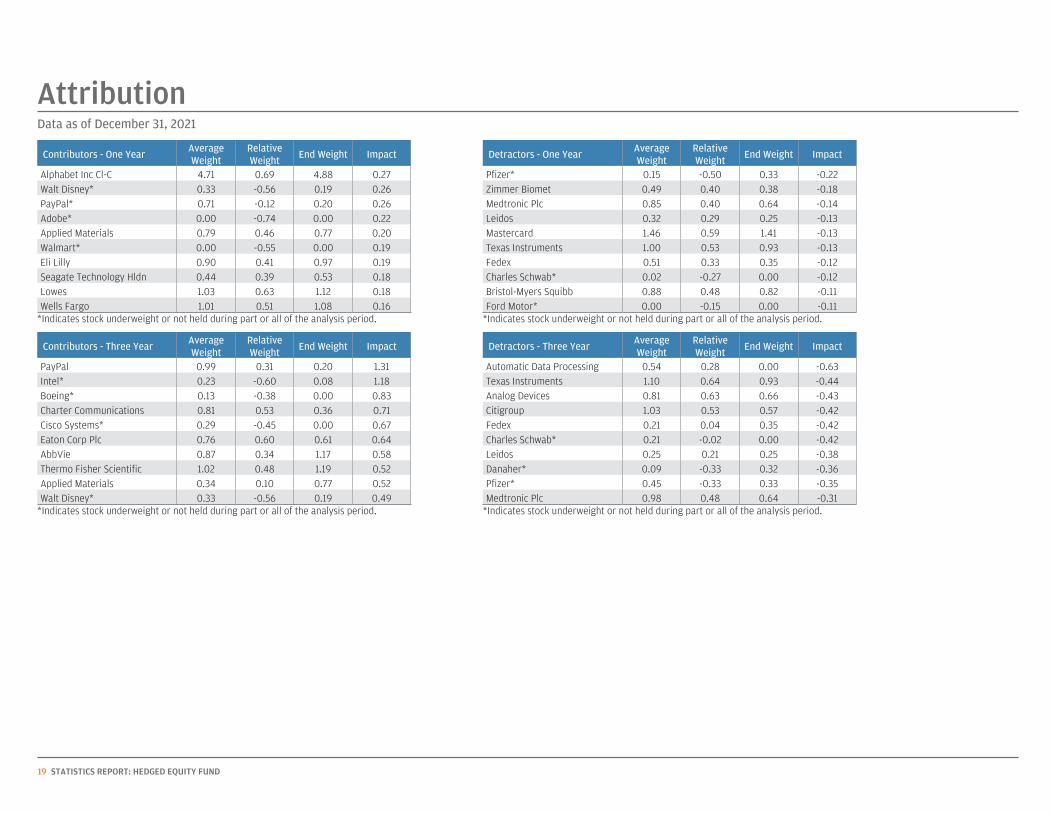
*Indicates stock underweight or not held during part or all of the analysis period.-0.110.00-0.150.00Ford Motor*-0.110.820.480.88Bristol-Myers Squibb-0.120.00-0.270.02Charles Schwab*-0.120.350.330.51Fedex-0.130.930.531.00Texas Instruments-0.131.410.591.46Mastercard-0.130.250.290.32Leidos-0.140.640.400.85Medtronic Plc-0.180.380.400.49Zimmer Biomet-0.220.33-0.500.15Pfizer*
ImpactEnd WeightRelativeWeight
AverageWeight
Detractors - YTD
*Indicates stock underweight or not held during part or all of the analysis period.
*Indicates stock underweight or not held during part or all of the analysis period.-0.110.00-0.150.00Ford Motor*-0.110.820.480.88Bristol-Myers Squibb-0.120.00-0.270.02Charles Schwab*-0.120.350.330.51Fedex-0.130.930.531.00Texas Instruments-0.131.410.591.46Mastercard-0.130.250.290.32Leidos-0.140.640.400.85Medtronic Plc-0.180.380.400.49Zimmer Biomet-0.220.33-0.500.15Pfizer*
ImpactEnd WeightRelativeWeight
AverageWeight
Detractors - One Year
*Indicates stock underweight or not held during part or all of the analysis period.
*Indicates stock underweight or not held during part or all of the analysis period.-0.310.640.480.98Medtronic Plc-0.350.33-0.330.45Pfizer*-0.360.32-0.330.09Danaher*-0.380.250.210.25Leidos-0.420.00-0.020.21Charles Schwab*-0.420.350.040.21Fedex-0.420.570.531.03Citigroup-0.430.660.630.81Analog Devices-0.440.930.641.10Texas Instruments-0.630.000.280.54Automatic Data Processing
ImpactEnd WeightRelativeWeight
AverageWeight
Detractors - Three Year
*Indicates stock underweight or not held during part or all of the analysis period.
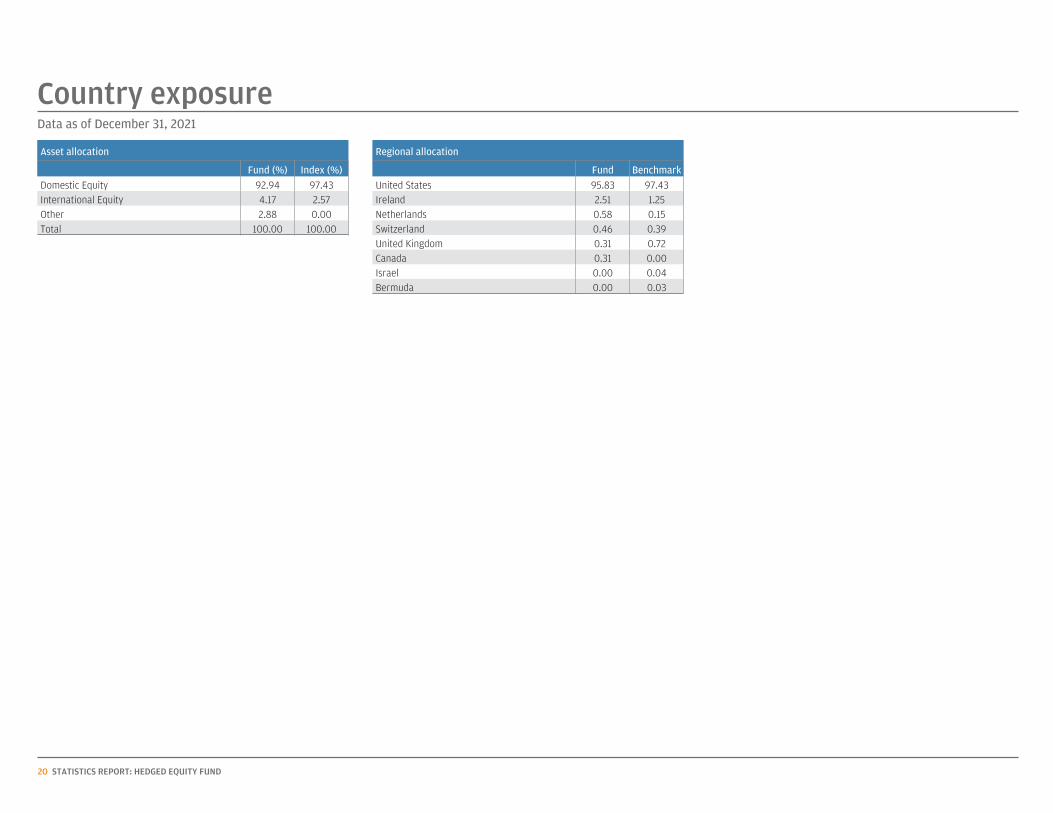
0.030.00Bermuda0.040.00Israel0.000.31Canada0.720.31United Kingdom0.390.46Switzerland0.150.58Netherlands1.252.51Ireland97.4395.83United States
BenchmarkFund
20 STATISTICS REPORT: HEDGED EQUITY FUND
STATISTICS REPORT: HEDGED EQUITY FUND
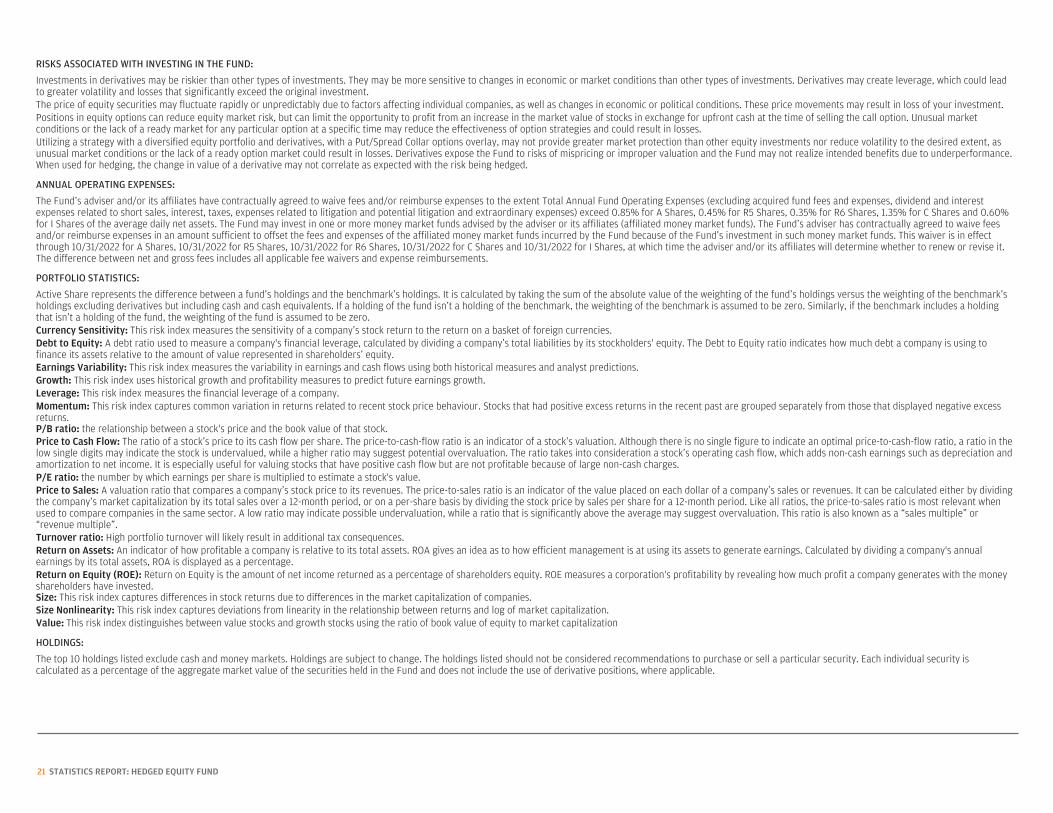
RISKS ASSOCIATED WITH INVESTING IN THE FUND:
Investments in derivatives may be riskier than other types of investments. They may be more sensitive to changes in economic or market conditions than other types of investments. Derivatives may create leverage, which could leadto greater volatility and losses that significantly exceed the original investment.The price of equity securities may fluctuate rapidly or unpredictably due to factors affecting individual companies, as well as changes in economic or political conditions. These price movements may result in loss of your investment.Positions in equity options can reduce equity market risk, but can limit the opportunity to profit from an increase in the market value of stocks in exchange for upfront cash at the time of selling the call option. Unusual marketconditions or the lack of a ready market for any particular option at a specific time may reduce the effectiveness of option strategies and could result in losses.Utilizing a strategy with a diversified equity portfolio and derivatives, with a Put/Spread Collar options overlay, may not provide greater market protection than other equity investments nor reduce volatility to the desired extent, asunusual market conditions or the lack of a ready option market could result in losses. Derivatives expose the Fund to risks of mispricing or improper valuation and the Fund may not realize intended benefits due to underperformance.When used for hedging, the change in value of a derivative may not correlate as expected with the risk being hedged.
ANNUAL OPERATING EXPENSES:
The Fund’s adviser and/or its affiliates have contractually agreed to waive fees and/or reimburse expenses to the extent Total Annual Fund Operating Expenses (excluding acquired fund fees and expenses, dividend and interestexpenses related to short sales, interest, taxes, expenses related to litigation and potential litigation and extraordinary expenses) exceed 0.85% for A Shares, 0.45% for R5 Shares, 0.35% for R6 Shares, 1.35% for C Shares and 0.60%for I Shares of the average daily net assets. The Fund may invest in one or more money market funds advised by the adviser or its affiliates (affiliated money market funds). The Fund’s adviser has contractually agreed to waive feesand/or reimburse expenses in an amount sufficient to offset the fees and expenses of the affiliated money market funds incurred by the Fund because of the Fund’s investment in such money market funds. This waiver is in effectthrough 10/31/2022 for A Shares, 10/31/2022 for R5 Shares, 10/31/2022 for R6 Shares, 10/31/2022 for C Shares and 10/31/2022 for I Shares, at which time the adviser and/or its affiliates will determine whether to renew or revise it.The difference between net and gross fees includes all applicable fee waivers and expense reimbursements.
PORTFOLIO STATISTICS:
Active Share represents the difference between a fund’s holdings and the benchmark’s holdings. It is calculated by taking the sum of the absolute value of the weighting of the fund’s holdings versus the weighting of the benchmark’sholdings excluding derivatives but including cash and cash equivalents. If a holding of the fund isn’t a holding of the benchmark, the weighting of the benchmark is assumed to be zero. Similarly, if the benchmark includes a holdingthat isn’t a holding of the fund, the weighting of the fund is assumed to be zero.Currency Sensitivity: This risk index measures the sensitivity of a company’s stock return to the return on a basket of foreign currencies.Debt to Equity: A debt ratio used to measure a company's financial leverage, calculated by dividing a company’s total liabilities by its stockholders' equity. The Debt to Equity ratio indicates how much debt a company is using tofinance its assets relative to the amount of value represented in shareholders’ equity.Earnings Variability: This risk index measures the variability in earnings and cash flows using both historical measures and analyst predictions.Growth: This risk index uses historical growth and profitability measures to predict future earnings growth.Leverage: This risk index measures the financial leverage of a company.Momentum: This risk index captures common variation in returns related to recent stock price behaviour. Stocks that had positive excess returns in the recent past are grouped separately from those that displayed negative excessreturns.P/B ratio: the relationship between a stock's price and the book value of that stock.Price to Cash Flow: The ratio of a stock’s price to its cash flow per share. The price-to-cash-flow ratio is an indicator of a stock’s valuation. Although there is no single figure to indicate an optimal price-to-cash-flow ratio, a ratio in thelow single digits may indicate the stock is undervalued, while a higher ratio may suggest potential overvaluation. The ratio takes into consideration a stock’s operating cash flow, which adds non-cash earnings such as depreciation andamortization to net income. It is especially useful for valuing stocks that have positive cash flow but are not profitable because of large non-cash charges.P/E ratio: the number by which earnings per share is multiplied to estimate a stock's value.Price to Sales: A valuation ratio that compares a company’s stock price to its revenues. The price-to-sales ratio is an indicator of the value placed on each dollar of a company’s sales or revenues. It can be calculated either by dividingthe company’s market capitalization by its total sales over a 12-month period, or on a per-share basis by dividing the stock price by sales per share for a 12-month period. Like all ratios, the price-to-sales ratio is most relevant whenused to compare companies in the same sector. A low ratio may indicate possible undervaluation, while a ratio that is significantly above the average may suggest overvaluation. This ratio is also known as a “sales multiple” or“revenue multiple”.Turnover ratio: High portfolio turnover will likely result in additional tax consequences.Return on Assets: An indicator of how profitable a company is relative to its total assets. ROA gives an idea as to how efficient management is at using its assets to generate earnings. Calculated by dividing a company's annualearnings by its total assets, ROA is displayed as a percentage.Return on Equity (ROE): Return on Equity is the amount of net income returned as a percentage of shareholders equity. ROE measures a corporation's profitability by revealing how much profit a company generates with the moneyshareholders have invested.Size: This risk index captures differences in stock returns due to differences in the market capitalization of companies.Size Nonlinearity: This risk index captures deviations from linearity in the relationship between returns and log of market capitalization.Value: This risk index distinguishes between value stocks and growth stocks using the ratio of book value of equity to market capitalization
HOLDINGS:
The top 10 holdings listed exclude cash and money markets. Holdings are subject to change. The holdings listed should not be considered recommendations to purchase or sell a particular security. Each individual security iscalculated as a percentage of the aggregate market value of the securities held in the Fund and does not include the use of derivative positions, where applicable.
21
STATISTICS REPORT: HEDGED EQUITY FUND
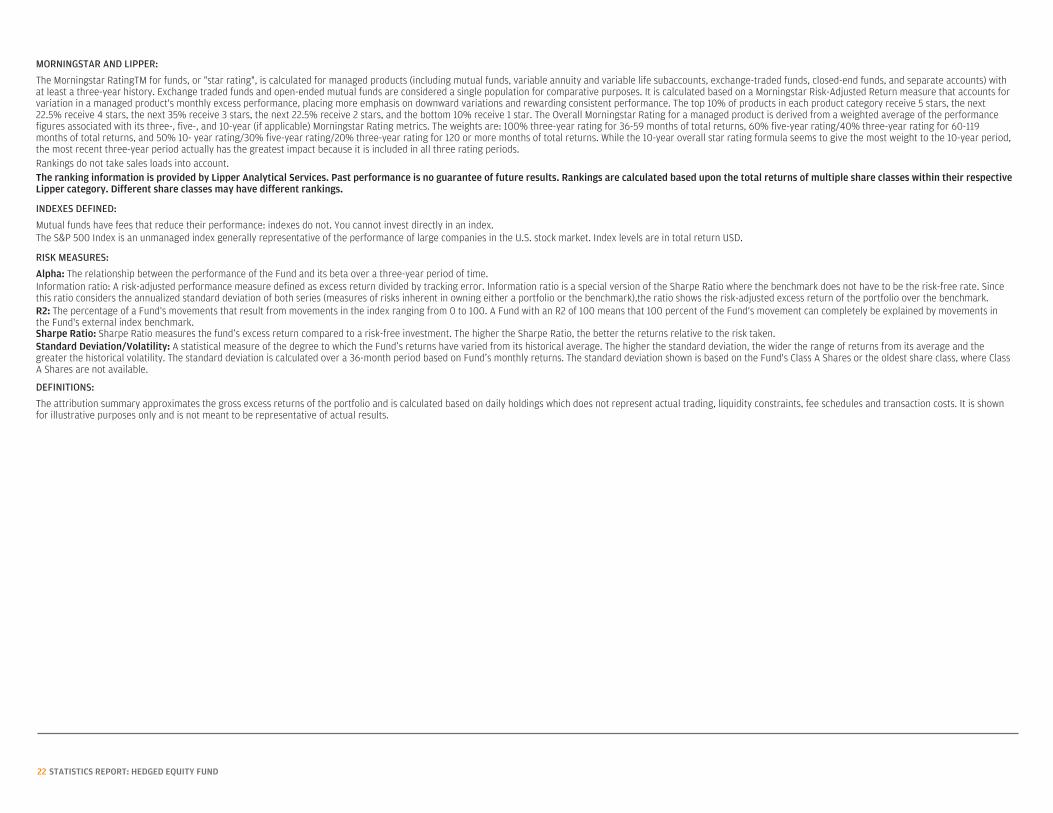
MORNINGSTAR AND LIPPER:
The Morningstar RatingTM for funds, or "star rating", is calculated for managed products (including mutual funds, variable annuity and variable life subaccounts, exchange-traded funds, closed-end funds, and separate accounts) withat least a three-year history. Exchange traded funds and open-ended mutual funds are considered a single population for comparative purposes. It is calculated based on a Morningstar Risk-Adjusted Return measure that accounts forvariation in a managed product's monthly excess performance, placing more emphasis on downward variations and rewarding consistent performance. The top 10% of products in each product category receive 5 stars, the next22.5% receive 4 stars, the next 35% receive 3 stars, the next 22.5% receive 2 stars, and the bottom 10% receive 1 star. The Overall Morningstar Rating for a managed product is derived from a weighted average of the performancefigures associated with its three-, five-, and 10-year (if applicable) Morningstar Rating metrics. The weights are: 100% three-year rating for 36-59 months of total returns, 60% five-year rating/40% three-year rating for 60-119months of total returns, and 50% 10- year rating/30% five-year rating/20% three-year rating for 120 or more months of total returns. While the 10-year overall star rating formula seems to give the most weight to the 10-year period,the most recent three-year period actually has the greatest impact because it is included in all three rating periods.Rankings do not take sales loads into account.The ranking information is provided by Lipper Analytical Services. Past performance is no guarantee of future results. Rankings are calculated based upon the total returns of multiple share classes within their respectiveLipper category. Different share classes may have different rankings.
INDEXES DEFINED:
Mutual funds have fees that reduce their performance: indexes do not. You cannot invest directly in an index.The S&P 500 Index is an unmanaged index generally representative of the performance of large companies in the U.S. stock market. Index levels are in total return USD.
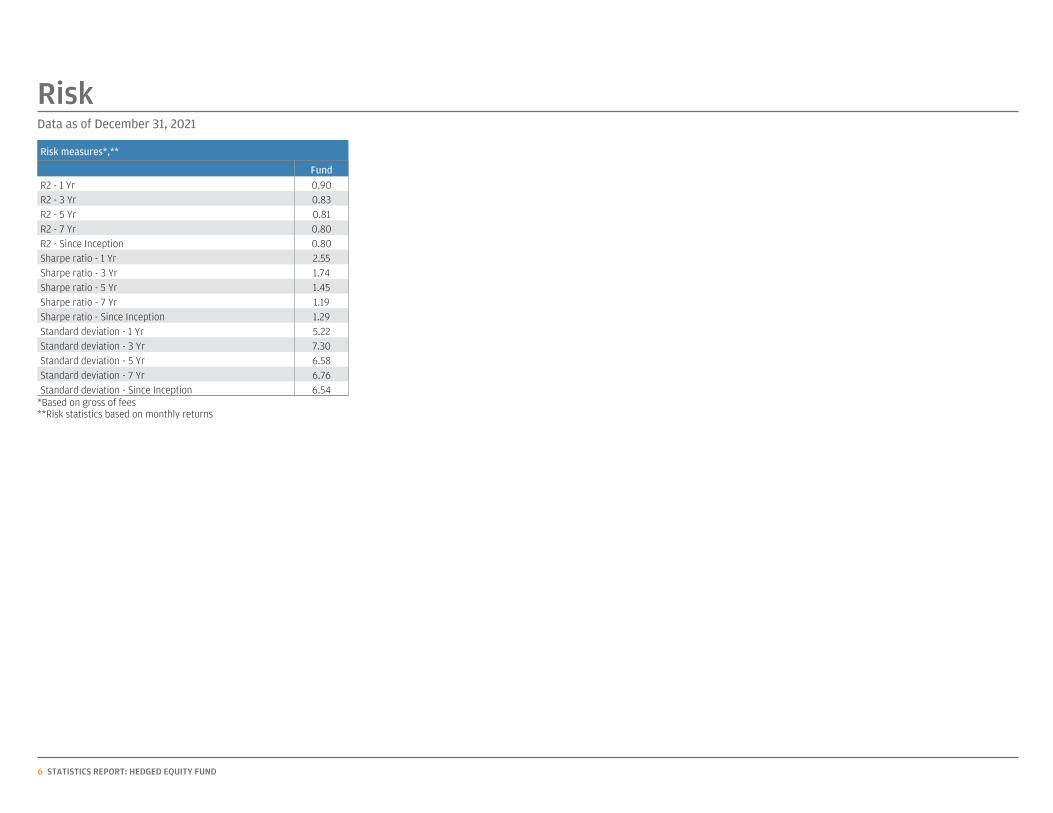
RISK MEASURES:
Alpha: The relationship between the performance of the Fund and its beta over a three-year period of time.Information ratio: A risk-adjusted performance measure defined as excess return divided by tracking error. Information ratio is a special version of the Sharpe Ratio where the benchmark does not have to be the risk-free rate. Sincethis ratio considers the annualized standard deviation of both series (measures of risks inherent in owning either a portfolio or the benchmark),the ratio shows the risk-adjusted excess return of the portfolio over the benchmark.R2: The percentage of a Fund's movements that result from movements in the index ranging from 0 to 100. A Fund with an R2 of 100 means that 100 percent of the Fund's movement can completely be explained by movements inthe Fund's external index benchmark.Sharpe Ratio: Sharpe Ratio measures the fund’s excess return compared to a risk-free investment. The higher the Sharpe Ratio, the better the returns relative to the risk taken.Standard Deviation/Volatility: A statistical measure of the degree to which the Fund’s returns have varied from its historical average. The higher the standard deviation, the wider the range of returns from its average and thegreater the historical volatility. The standard deviation is calculated over a 36-month period based on Fund’s monthly returns. The standard deviation shown is based on the Fund's Class A Shares or the oldest share class, where ClassA Shares are not available.
DEFINITIONS:
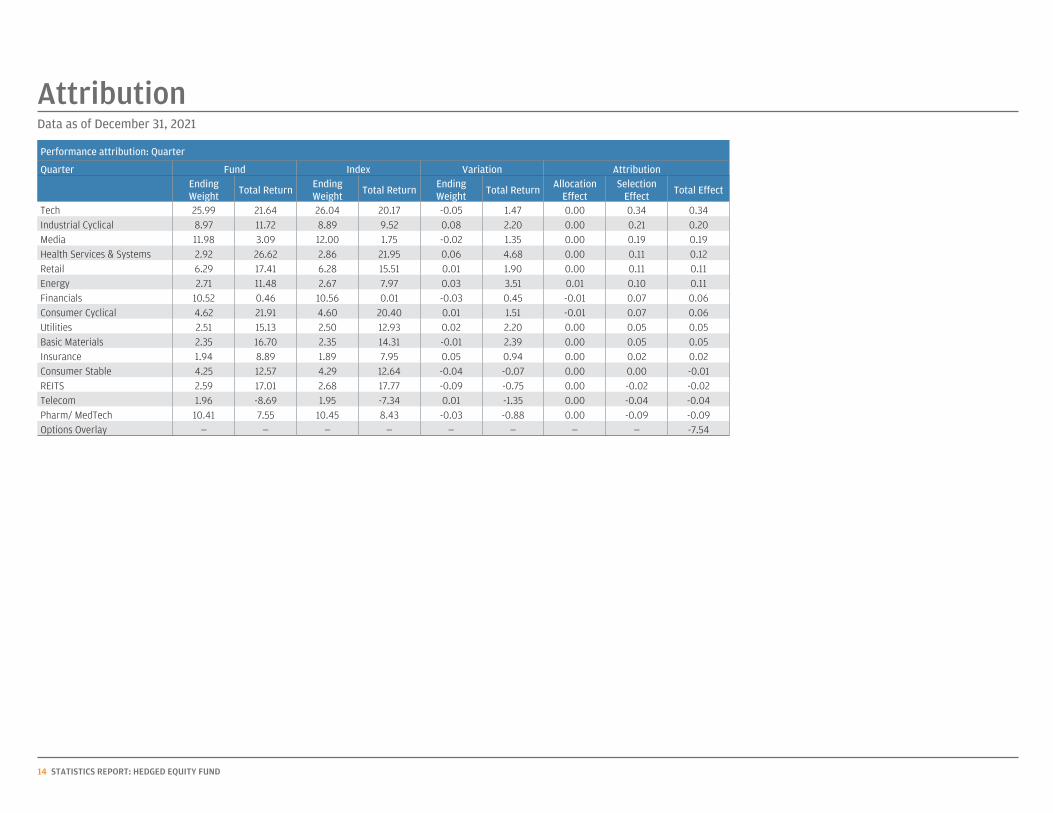
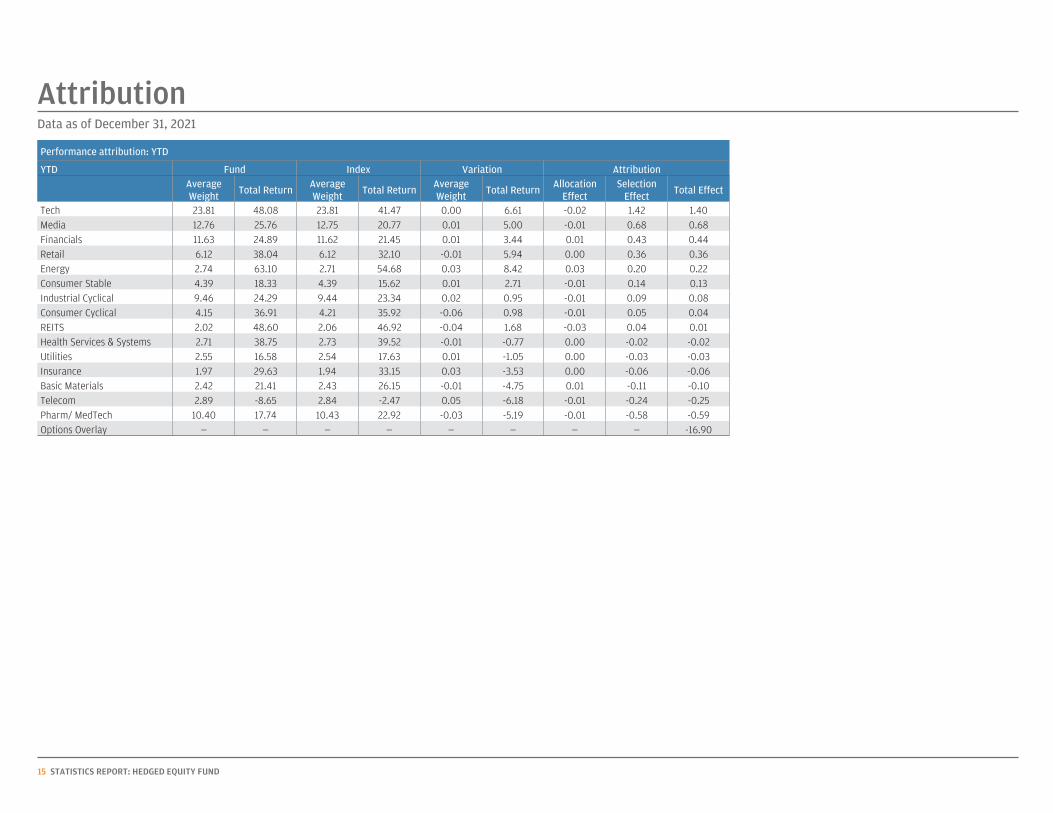
The attribution summary approximates the gross excess returns of the portfolio and is calculated based on daily holdings which does not represent actual trading, liquidity constraints, fee schedules and transaction costs. It is shownfor illustrative purposes only and is not meant to be representative of actual results.
22
NOT FDIC INSURED | NO BANK GUARANTEE | MAY LOSE VALUE