S 1 Cancer Cell, 20 Supplemental Information A Two-in-One Antibody against HER3 and EGFR Has Superior Inhibitory Activity Compared with Monospecific Antibodies Gabriele Schaefer, Lauric Haber, Lisa M. Crocker, Steven Shia, Lily Shao, Donald Dowbenko, Klara Totpal, Anne Wong, Chingwei V. Lee, Scott Stawicki, Robyn Clark, Carter Fields, Gail D. Lewis Phillips, Rodney A. Prell, Dimitry M. Danilenko, Yvonne Franke, Jean‐Philippe Stephan, Jiyoung Hwang, Yan Wu, Jenny Bostrom, Mark X. Sliwkowski, Germaine Fuh, and Charles Eigenbrot SUPPLEMENTAL INFORMATION INVENTORY: Supplemental Data Figure S1, related to Figure 2 Table S1, related to Figure 2 Table S2, related to Figure 2 Figure S2, related to Figure 3 Table S3, related to Figure 3 Table S4, related to Figure 3 Figure S3, related to Figure 4 Table S5, related to Figure 6 Supplemental Expreimental Procedures upplemental References
Transcript
S
1
Cancer Cell, 20
Supplemental Information
A Two-in-One Antibody against HER3 and EGFR
Has Superior Inhibitory Activity Compared with
Monospecific Antibodies
Gabriele Schaefer, Lauric Haber, Lisa M. Crocker, Steven Shia, Lily Shao, Donald Dowbenko, Klara Totpal, Anne Wong, Chingwei V. Lee, Scott Stawicki, Robyn Clark, Carter Fields, Gail D. Lewis Phillips, Rodney A. Prell, Dimitry M. Danilenko, Yvonne Franke, Jean‐Philippe Stephan, Jiyoung Hwang, Yan Wu, Jenny Bostrom, Mark X. Sliwkowski, Germaine Fuh, and Charles Eigenbrot
SUPPLEMENTAL INFORMATION INVENTORY:
Supplemental Data
Figure S1, related to Figure 2
Table S1, related to Figure 2
Table S2, related to Figure 2
Figure S2, related to Figure 3
Table S3, related to Figure 3
Table S4, related to Figure 3
Figure S3, related to Figure 4
Table S5, related to Figure 6
Supplemental Expreimental Procedures
upplemental References
2
3
Figure S1, related to Figure 2, Characterization of EGFR antibody
(A) Binding of 125I –EGF to the ECD of EGFR, that was expressed as an Fc fusion protein (EGFR-
ECD-Fc). The binding of radio-labeled EGF in the presence of increasing concentration of D1.5 is
expressed as percentage of total protein bound 125I –EGF. (B) EGFR-NR6 cells treated with indicated
concentrations of D1.5 were stimulated with 5 nM TGF for 10 min and cell lysates were subjected to
immunoblotting to detect pAKT (Ser473), pERK1/2 (Thr202/Tyr204), and total EGFR. EGFR-NR6
cells only express EGFR, therefore, a pTyr antibody was used to detect all phosphorylation sites of
EGFR. (C) The average sizes of A431 tumor in mice during weekly treatment of cetuximab (50
mg/kg, green), or D1.5 (50 mg/kg, orange) or vehicle (black) were plotted. First dose was given as a
2x loading dose. Arrows indicate treatments. Data are presented as mean tumor volume ± SEM.
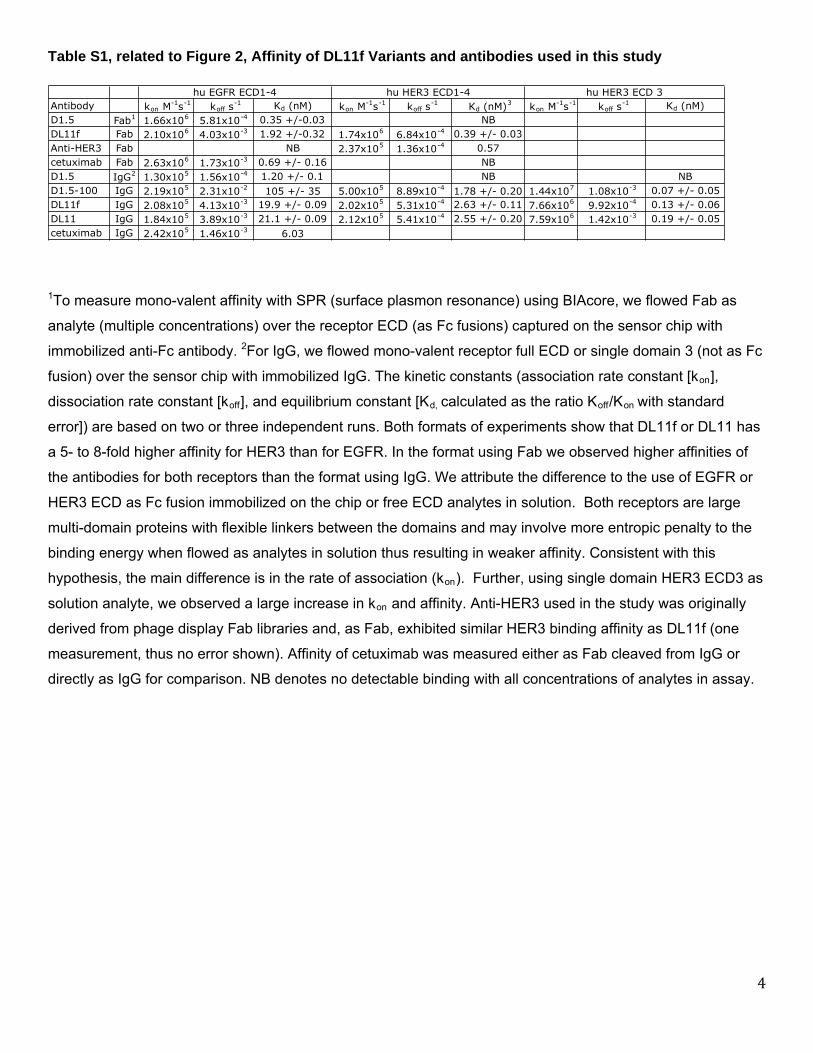
Table S1, related to Figure 2, Affinity of DL11f Variants and antibodies used in this study
Final Rc, RFREE 0.182, 0.215 0.245, 0.323 0.227, 0.280
number of protein residues 636 935 863
number of sugar residues 7 4 0
number solvent molecules 650 0 14
number of atomsd 5590 (187) 7205 (0) 6526 (42)
Mean B-factore (Å2) 25 96 44
Rmsd bonds (Å) 0.009 0.008 0.010
Rmsd angles (˚) 1.2 1.1 1.3
Rmsd bonded Bs (Å2) 2.4/3.6 0.5/1.8 2.2/2.5
Number of TLS groups 0 10 4
RMSD NCS (tight/medium) (Å) - - 0.04 / 0.27
Ramachandran analysis (%) 90.3/9.1/0.2/0.4 79.9/18.9/0.6/0.6 88.1/10.3/0.4/0.5 a Rsym = ||I| - |<I>||/|<I>|, where I is the intensity of a single observation and <I> the average intensity for symmetry
equivalent observations. b In parenthesis, for the highest resolution shell. c R = |Fo-Fc|/|Fo|, where Fo and Fc are observed and calculated structure factor amplitudes, respectively. RFREE is
calculated as R for reflections sequestered from refinement. d In parenthesis, the number of atoms assigned less than unit occupancy. e Without TLS components.
Table S4, related to Figure 3, Shotgun alanine scanning of DL11f for binding to EGFR and HER3
The effects of mutation to alanine (mut) are calculated as the ratio of occurrence of wild type over mutant (wt/mut) for EGFR or HER3 binding clones. The wt/mut ratios are corrected for protein folding effects by division with wt/mut ratios from display/expression selection to obtain the F values. Display selection was performed independently by selecting clones binding to Protein L, which binds the framework region of the LC variable kappa domain. When only the wild type residue appears, the F values are shown as “>”. The substitutions are shown as superscripts on the F values. Noted that when the wt is alanine, it was mutated to glycine. ∆∆Gwt/mut are calculated using the formula ∆∆G=RTln(Ka,wt /Ka,mut )=RTln(Fwt/mut) as described in theMethods. Three mutation in CDR-H2 (G54, Y56, D58), not included in the shotgun scanning, were assayed as single mutant to derive ∆∆G=RTln(K
s a,wt /Ka,mut ) using the ratio of apparent affinity. Mutation effects (∆∆G) are
in red when mutation has significant effect (∆∆G >/= 1.5 kcal/mol), in green or cyan when mutation hasignificantly greater effect on binding EGFR or HER3 only, respectively.
9
10
11
Figure S3, related to Figure 4, Characterization of MEHD7945A
(A) EGFR-NR6 cells treated with 10 g/ml MEHD7945A, cetuximab or anti-HER3 were stimulated
with amphiregulin (16.5 ng/mL) or betacellulin (0.9 ng/mL) for 10 min and cell lysates were subjected
to immunoblotting to detect indicated proteins. (B) Binding of 125I–HRG to the ECD of HER3,
expressed as an Fc fusion protein (HER3-ECD-Fc) and binding of 125I–EGF to the ECD of EGFR,
expressed as an Fc fusion protein (EGFR-ECD-Fc). The binding of radio-labeled HRG or EGF in the
presence of increasing concentration of MEHD7945A is expressed as percentage of total protein
bound 125I–HRG or 125I–EGF respectively. (C) FaDu cells were treated with indicated concentrations
of MEHD7945A, cetuximab or anti-HER3 in the presence of 10% bovine serum albumin for 1 hour
and and cell lysates were subjected to immunoblotting to detect indicated proteins. (D) A431 and
BxPC3 cells were treated for 3 hours with MEHD7945A (10g/mL) cetuximab (10g/mL), anti-HER3
(10g/mL), or the combination of cetuximab plus anti-HER3 (10g/mL of each antibody) and
stimulated with HRG (0.5 nM), TGF (0.5 nM) or combination of both ligands for 10 min. Cell lysates
were immunoblotted to detect pHER3 (Tyr1289), pAKT (Ser473), pEGFR (Tyr1068), pERK1/2
(Thr202/Tyr204), and tubulin.
12
Table S5, related to Figure 6, Tumor growth inhibitory effect of MEHD7945A compared to cetuximab or anti-HER3 in numerous murine xenograft models
Model phenotype Cetuximab MEHD7945A anti-HER3 Cetuximab +
anti-HER3
NCI-H292 NSCLC +++ +++ - n/a
NCI-H1975 NSCLC +++ +++ - n/a
SW948 CRC ++ ++ + n/a
OVXF550 ovarian ++ ++ ++ ++
A431 epidermoid +++ +++ ++ n/a
Cal27 HNSCC +++ +++ ++ n/a
FaDu HNSCC ++ +++ +++ n/a
LXF983 NSCLC ++ +++ ++ +++
MAXF449 breast - +++ +++ +++
A549 NSCLC - ++ + +++
Calu-3 NSCLC - ++ + ++
BxPC3 pancreas - ++ + n/a
NSCLC= non-small cell lung cancer, HNSSC= head and neck squamous cell carcinoma, CRC= colorectal
cancer, n/a= non applicable. OVXF550, MAXF449 and LXF983 models are human patient derived transplant
models. Mice were treated with 25mg/kg MEHD7945A, 25 mg/kg cetuximab, 50 mg/kg anti-HER3 or the
combination of 25mg/kg cetuximab plus 50 mg/kg anti-HER3, once a week for 4 cycles. MAXF449, OVXF550
and LX983 were treated with 30 mg/kg MEHD7945A, 30 mg/kg cetuximab, 60 mg/kg anti-HER3 or the
combination of 30 mg/kg cetuximab plus 60 mg/kg anti-HER3, once a week for 4 cycles. Initial dose was a 2x
loading dose for all treatments. Percent of tumor growth inhibition (TGI) was calculated for each study based
on the last day of study in which the majority of mice remained in the vehicle group. TGI below 25% is
indicated as -, TGI between 25-50 % is indicated as +, TGI between 51-75% is indicated as ++, and TGI of
76% and above as +++.
13
Supplemental Experimental Procedures
Ligand binding assay 125I-EGF was purchased from Perkin Elmer, Waltham, MA. Binding assays were performed in Nunc
break-apart strip wells (Thermo-Fisher Scientific, Rochester, NY). Plates were coated at 4C
overnight with 100 Lof 5 g/mL rabbit anti-human IgG antibody (Dako, Denmark) in 50 mM
carbonate buffer (pH 9.6). Plates were rinsed twice with wash buffer (PBS/0.05% Tween 20) and
blocked with 100 L PBS with 1% bovine serum albumin (BSA) for 30 minutes. Buffer was removed
and each well was incubated with 50 ng of EGFR-ECD-Fc in PBS with 1% BSA for 1.5 hours. Plates
were rinsed two times with wash buffer. Increasing concentrations of D1.5 (0.006200 nM in RPMI
1640 medium (Invitrogen; Carlsbad, CA) with 0.2% BSA were pre-bound to EGFR-ECD-Fc, and 125I-EGF (specific activity: 366 Ci/g, 45,000 cpm/well) was added immediately after in a total assay
volume of 130 L. Plates were incubated for 2 hours at room temperature, rinsed twice, and individual
wells were counted using a 100 Series Iso Data -counter. Samples were assayed in quadruplicates.
Plotting was performed using KaleidaGraph 3.6 software.
Affinity maturation
For the affinity maturation of anti-EGFR clones, several CDRs were mutated in combination, and the
generated Fab libraries underwent stringent selection and screening for high affinity clones as
described previously (Lee et al., 2006). To determine the binding epitope of selected EGFR-clones
the binding of Fab displaying phage to immobilized EGFR was measured in the presence or absence
of cetuximab (100nM), or TGF (50 nM) by ELISA, and competitive binding was studied as described
(Lee et al., 2006).
Light chain libraries construction
A subset of randomized light chain positions were tailored to represent amino acids of the natural
repertoire at these sites, whereas the remaining sites were randomized to include all 20 amino acids
or restricted to the amino acid type similar to the template antibodies. In all of the libraries the heavy
chain sequence was not changed from the parent clone sequence. The library templates contained a
stop codon (Sidhu et al., 2004) embedded in CDR L1
14
).
Shotgun scanning mutagenesis for dual affinity improvement
A phagemid was created to display D1.5-100 or DL11f on phage with the light chain C-terminally
fused to an epitope (gD) tag and heavy chain C-terminally fused to the C-terminal domain of M13
minor coat protein P3 (cP3). Separate heavy chain and light chain alanine and/or homolog scanning
libraries were constructed. Selections were performed on immobilized EGFR, HER3, protein L or anti-
gD mIgG followed by ELISA screening for target binding, and sequence analysis of ~100 unique
sequences from each selection. The wild type/mutation (wt/mut) ratios were calculated and corrected
for protein folding and expression effects by division with protein-L binding wt/mut ratios to yield the
Fwt/mut. ∆∆G of each mutation was calculated using the formula ∆∆G=RTln(Ka,wt/Ka,mut)=RTln(Fwt/mut)
as described (Vajdos et al., 2002) (Table S4
Affinity measurement
To determine binding affinities, Fabs and IgGs were expressed in E. coli and HEK293 cells
respectively, and purified as described (Lee et al., 2004). Surface plasmon resonance (SPR)
measurements with BIAcoreTM-2000 were used to determine the monovalent binding affinities of Fabs
and IgGs as described (Lee et al., 2004). To determine the affinity of Fabs, hIgG1 was coated onto
CM5 biosensor chips and the Fab was injected as the analyte over the receptor –Fc fusions that were
captured by hIgG1. For hIgG1 measurement, hIgG1 was directly immobilized on CM5 chips (at ~150
RU), and EGFR-ECD (12.5 nM to 200 nM) was injected into the flow cell. Binding response was
corrected by subtracting RU from a blank flow cell. For kinetic analysis, the 1:1 Languir model of
simultaneous fitting of kon and koff was used.
ELISA
For competition assays, HER3-ECD-Fc or EGFR-ECD-Fc, were immobilized on Nunc-immuno
maxisorp 384-well plates. After several wash steps using wash buffer (PBS, pH 7.4, with 0.05%
Polysorbate 20) wells were blocked with blocking buffer (PBS, pH 7.4, with 0.5% bovine serum
albumin (BSA) and 15 ppm Proclin) for 1 hour at room temperature. Plates were then washed with
wash buffer before the addition of MEHD7945A and samples containing MEHD7945A plus soluble
15
EGFR-ECD or soluble HER3-ECD in (PBS, pH 7.4, with 0.5% BSA, 0.05% Tween 20, 0.25% Chaps,
5 mM EDTA, and 15 ppm Proclin) supplemented with 0.35 M NaCl. Wells were incubated for 2 hours
and bound MEHD7945A was then detected with horseradish peroxidase (HRP) –conjugated F(ab)2
fragments of polyclonal goat antihuman F(ab)2 antibodies followed by the addition of substrate
tetramethylbenzidine. Absorbances were then measured at 450 nm reference 620 nm wavelengths
and reported as optical density (OD). For alanine scanning experiments, EGFR-ECD Fc was
immobilized on Nunc-immuno maxisorp 96-well plates. DL11f was incubated with increasing
concentrations of wild type or mutant receptors in solution for 2 h and unbound DL11f was captured
on the EGFR-ECD-Fc coated wells and measured as above. IC50 is the concentration of the receptor
variants that inhibit 50% of DL11f from binding to the EGFR coated wells. Receptor variants that
showed severely disrupted binding to DL11f were analyzed with other receptor binding antibodies to
determine proper folding. Receptor variants were generated by transient transfection of 293 cells.
Generation of Receptor Fragments for Crystallization
Baculovirus expression constructs
ECD domains 1-3 of human HER3 (Ser1-His513, numbering based on mature protein) and ECD
domain 3 of human EGFR (Arg310-Lys514, numbering based on mature protein) were cloned by
PCR amplification from in-house generated full length clones using Taq polymerase. Using these
cDNAs as templates for subcloning, sets of four PCR primers were designed to amplify the domains
of interest from EGFR and HER3. The primers contained the coding sequences for a C-terminal His6
tag as well as the nucleotides required for adding portions of the restriction sites BamHI and EcoRI to
the resulting PCR products. Denaturation and reannealing of these PCR products produced a DNA
population in which 25% of the products contained the appropriate nucleotides to represent BamHI
and EcoRI overhangs at the 5’ and 3’ ends of the domains of interest, respectively. This DNA mixture
was ligated into a modified pAcGP67 baculovirus transfer vector (BD Pharmingen) for baculovirus
generation and extracellular expression in Spodoptera frugiperda (Sf9) (HER3) or Trichoplusia ni
(Tni) (EGFR) insect cells (Expression Systems, LLC, Woodland, CA). The integrity of all expression
constructs was confirmed by DNA sequencing.
Protein Expression
16
un
Sf9 and Tni cells were maintained in suspension in ESF921 (Expression Systems, LLC) at 270 C as
recommended by the vendor. Sf9 and Tni cells at a density of 2x10⁶ cells/mL were infected with virus
containing HER3 and EGFR at an MOI >1, respectively. Scale-up productions of 5 L or more were
performed using a Wave Bioreactor (GE Bioscience). At 48 h (Tni cells) and 72 h (Sf9 cells) post
infection, the medium was adjusted with 50 ml of 1 M Tris-HCL, pH 8, 5 mL of 0.25 M CaCl2 and 1
mL of 1 M NiCl2 per liter of medium. After an incubation period of 30 min, cells and debris were sp
down at 3,000 rpm for 20 min. The supernatant containing the proteins was subsequently filtered
(0.22 m).
Detailed Crystallization, structure determination and refinement protocols
DL11 was produced in E. coli. Frozen cell paste (210 g) was thawed in 1 L of lysis buffer containing
890 mL PBS, 100 mL 0.25 M EDTA and 10 mL 0.1 M PMSF and homogenized. The suspension was
treated twice in a microfluidizer and then centrifuged at 1200 rpm in 250 mL tubes for 30 min. A
XK26/20 protein G affinity column was equilibrated with 100 mL lysis buffer. A lysate aliquot (250 mL)
was loaded at 5 mL/min, washed with 100 mL lysis buffer, eluted with 0.58% acetic acid and the first
75 mL of eluant pooled according the SDS-PAGE analysis. This affinity step was repeated with 4
additional 250 mL aliquots. The total pool was loaded on a prepacked 5 mL SPHP ion exchange
column equilibrated with buffer A containing 20 mM MES pH 5.5 at 3 mL/min washed to baseline with
buffer A, and then eluted with buffer A augmented with 1 M NaCl, collecting 2 mL fractions. Total yield
was 175 mg.
The HER3 ECD domains 1-3 (Ser1-His513) and EGFR ECD domain 3 (Arg310-Lys514) with C-
terminal histidine affinity tags (-GNSHis6) were each produced in baculovirus infected insect cells (sf9
for HER3 and T. ni for EGFR). Ten L of HER3-containing media were loaded on to a 10 mL XK26/20
prepacked Ni2+-NTA column, the column washed with 200 mL of buffer containing 50 mM TRIS pH 8,
500 mM NaCl, 10% glycerol and 10 mM imidazole. Elution occurred during a 20 column-volume
gradient to 250 mM imidazole. Pooled fractions, determined from SDS-PAGE analysis, were
concentrated to 8 mL and loaded on a 320 mL S200 size exclusion column equilibrated with 20 mM
TRIS pH 8 and 150 mM NaCl. Five mg of protein from eluted fractions were combined with 10 mg
17
ent
m
DL11 and incubated for 1 h at 4˚C. The complex was separated from excess DL11 by size exclusion
as described above and concentrated to 8 mg/mL. For EGFR domain 3, a higher fermentation yield
required 2 size exclusion runs of 8 mL each and yielded 16 mg total. After incubation with a slightly
sub-stoichiometric amount of DL11, size exclusion was used to separate complex from excess EGFR
domain 3, and the pool was concentrated to 10 mg/mL.
DL11 alone and its complexes with HER3 and EGFR fragments were subjected to sparse matrix
crystallization trials in sitting drops. The sequence of DL11 differs from that of DL11f in only three
places, having heavy chain Leu48 instead of Val48 and Asp/Leu for light chain 28/29 instead of
Asn/Ile. DL11 alone formed rod-shaped crystals from a 1:1 mixture of protein and reservoir (0.1M
TRIS pH 8.5, 0.2M MgCl2•6H2O, 25% PEG3350) after 7 days at 4 ˚C. The HER3 complex formed
rod-shaped crystals from a 1:1 mixture of protein and reservoir (100 mM CAPSO pH 9, 25% PEG
1500) after 3 days at 22 ˚C. The EGFR complex formed rod-shaped crystals from a 1:1 mixture of
protein and reservoir (0.2M K2(HPO4), 20% PEG3350, 0.1M sodium dextran sulfate) after 3 days at
13 ˚C. Crystals for data collection were treated with modified mother liquors containing glycerol (20%
for the complexes, 30% for DL11 alone) and plunged into liquid nitrogen. Data for DL11 alone
extending to 2.85Å resolution were collected at ALS beamline 5.0.1 in a primitive monoclinic space
group, later determined to P21. Data for the HER3 complex extending to 3.5Å resolution were
collected at ALS beamline 5.0.2 in space group C2. Data for the EGFR complex were collected at
SSRL beamline 7-1 and also at ALS beamline 5.0.1, the latter extending to 1.8Å resolution in a
primitive orthorhombic space group later determined to be P21212. Data were reduced using
HKL2000 (Otwinowski and Minor, 1996) and elements of the CCP4 suite (CCP4, 1994). Refinem
was performed using REFMAC5 (Murshudov et al., 1997) and model building employed Coot
(Emsley et al., 2010). The structures were solved using molecular replacement (PHASER (McCoy et
al., 2007). For DL11 alone, two Fabs were located using highly homologous Fv and constant region
structures as probes and refinement included noncrystallographic symmetry (NCS) restraints. Some
guidance from the higher resolution version of DL11 from the EGFR complex was applied where
electron density maps of moderate resolution were ambiguous. For the HER3 complex, an intact
DL11 and domains 1-3 of the HER3 structure in pdb 1M6B were used as probes. Very limited
refinement was possible due to the limited resolution. A few HER3 side chains at the interface
between DL11 and HER3 (Arg 407, Lys466 and Arg472) were altered only to relieve untenable steric
conflicts but without useful guidance from electron density maps. Otherwise, side chain rotomers fro
18
the search probes are intact. For the EGFR complex, an intact DL11 and domain 3 from the EGFR
structure 1MOX (www.rcsb.org) served as probes. The electron density maps were of excellent
quality and permitted inclusion of many solvent molecules. Data reduction and final refinement
all
et
ities
for anti-HER3 binding to HER3-ECD was
ore SPR analysis (data not shown).
-HCL
l protein (2211, Cell Signaling Technology), -pTyr (clone PY20, EMD)
or -tubulin (T9026, Sigma).
statistics appear in Table S3.
Cell lines and antibodies
MDA-MB-175, MCF-7, BxPC3, Calu-3, H1666, A431, NCI-H292, NCI-H1975 and FaDu cells were
purchased from American Type Cell Culture and maintained in RPMI medium supplemented with
10% fetal bovine serum. EGFR-NR6 cells have been maintained as described previously (Schaefer
al., 2007). Cetuximab (ImClone Systems) was purchased from Wholesale Pharmacy. Pertuzumab
and anti-HER3 are antibodies generated at Genentech Inc. In brief, the HER3 antibody YW57.88.5,
designated anti-HER3, was generated using human phage antibody libraries with synthetic divers
in the selected CDRs, and phage selection was performed as described previously (Liang et al.,
2007). HER3- ECD-Fc fusion protein comprising of amino acid 1- 500 fused to the constant domain of
human IgG was used as antigen. A binding affinity of 1 nM
measured using Biac
Immunoblotting
Cells were plated in 12 well plates. Following serum starvation MCF-7, BxPC3, A431 or EGFR-NR6
cells were pre-incubated with indicated concentrations of antibody in RPMI, 0.2% BSA for 1-2 hours.
Cells were then stimulated with 0.5 to 5 nM ligand at room temperature for 10 minutes, supernatant
aspirated off and cells were immediately lysed in sample buffer (5% SDS, 1% DTT,25 mM Tris
pH6.8). Western blots were probed with -HER3 (sc285, Santa Cruz), -pHER3 (4791, Cell
EGFR-NR6 cells (3000 cells/well) were plated in 96 well plates. The next day cells were treated with
indicated concentrations of antibody in 1% serum containing medium. Depending on the cell line
ligand was added simultaneously. After 3-4 days AlamarBlue (Inv
fluorescence was read using a 96-well fluorometer wit
The results are expressed in relative fluorescence units (RFU).
Determination of Drug Synergy
Cells were seeded in 384-well plates at a density of 1,000 cells per well. Concentration range
chosen to span the complete dose-response range of both drugs. Depending on the ce
between 100ng/ml-150g/ml of MEHD7945A, gemcitabine hydrochloride (0.8nM -2M) (LC
Laboratories) or the combination of both were added to the cells in quadruplicate. Cell
proliferation/viability was measured after 5 days using the Cell Titer-Glo Luminescent reagent
(Promega). Multiple drug effect analysis was performed by using CalcuSyn software (Biosoft, Inc
hich quantitatively describes the interaction between two or more drugs (Chw
T
s
ADCC assay
A431 or NCI-H292 cells were plated in 96 well plates in the presence of indicated concentrations of
antibodies. After pre-incubation for 30 minutes at 37 °C isolated peripheral blood mononuclear cell
(PBMC) were added and the incubation continued for 4 more hours at 37 °C. After 4 hours, the
were centrifuged and the supernatants were harvested. The LDH activity in the supernatants was
determined according to the Promega CytoTox-O
procedure. To determine the per
calculated and the background was subtracted.
siRNA
Small interfering RNA oligo (siRNA) pools for HER3 (M-003127-03), EGFR (M-003114-01) and non
targeting control (D-001206-14-20) were purchased from Dharmacon Lafayette, CO. siRNAs were
introduced into BxPC3 cells by reverse transfection. 4000 cells/well were seeded in 96 well microtite
20
Dharmacon) transfection reagent diluted in OPTI-MEM (Invitrogen) as per manufacturer’s
cell proliferation was measured by AlamarBlue
staining.
and
or
7
eatments
asured
50, and
ies were dosed for four consecutive weeks with the first dose (day of randomization) being a
h calipers at least once a week for the duration of the
study.
plates containing a pre-incubated mix of pooled RNAi oligos at 50 mmol/L and DharmaFECT#1 (T-
2001-02,
recommendation. 96h post transfection the effect on
In vivo efficacy studies
In vivo studies, conducted at Genentech were reviewed and approved by the Institutional Animal
Care and Use Committee (IACUC). In vivo studies conducted at Oncotest GmbH where reviewed
approved by the Regierungs-präsidium Freiburg, Germany and conducted according to the guidelines
of the German Animal Welfare Act. In detail for xenograft studies at Genentech, 8 to 12 week old
naïve SCID beige or C.B-17 SCID mice (Charles River Laboratories, San Diego, CA or Hollister, CA)
were inoculated subcutaneously with Calu3, NCI-H292, BxPC3, NCI-H1975, SW948, A431, Cal27,
FaDu, cells. SCID beige mice were inoculated with 5 million Calu3 cells, or 5 million NCI-H1975 cells,
or 5 million A431 cells or 7.5 million SW948, or 20 million Cal27 cells suspended in HBSS. C.B-1
SCID mice were inoculated with 5 million NCI-H292, or 5 million FaDu cells, or 10 million BxPC3 cells
cells suspended in HBSS. When tumors reached a mean volume of 150 to 350 mm3, mice with
similarly sized tumors were randomized into treatment cohorts (n = 8 or 9 mice/group) and tr
were started. All treatments were administered intraperitoneally. Single dose studies consisted of a
single treatment on the day of randomization. Multiple dose studies consisted of 4 weeks of
treatment, with the first dose (day of randomization) being a 2x loading dose. Tumors were me
with calipers at least once a week for the duration of the study. Mice were housed in standard rodent
microisolator cages at the Genentech, Inc. South San Francisco, CA campus and maintained
according to the ILAR Guide for the Care and Use of Laboratory Animals. MAXF449, OVXF5
LXF983 are xenograft models established at Oncotest GmbH from primary patient material after
informed consent. Xenografts were subcutaneously grown in athymic NMRI nu/nu mice and
randomized after reaching tumor volumes of 100 mm3. Mice were treated with antibodies once a
week intravenously with the exception of Pertuzumab, which was administered intraperitoneally.
Antibod
2x loading dose. Tumors were measured wit
21
CCP4 Suite: Programs for Protein Crystallography. Acta Crystallogr D50, 760-763.
cta
.
674.
es rystallogr D53, 240-255.
, S. S., Li, B., Chen, Y., Fellouse, F. A., Eigenbrot, C., and Fuh, G. (2004). Phage-displayed 9-
de Vos, A. M., and Sidhu, S. S. (2002). omprehensive functional maps of the antigen-binding site of an anti-ErbB2 antibody obtained with hotgun scanning mutagenesis. J Mol Biol 320, 415-428.
Supplemental References
CCP4 (1994). The
Emsley, P., Lohkamp, B., Scott, W., and Cowtan, K. (2010). Features and Development of Coot. ACrystallogr D66.
Liang, W. C., Dennis, M. S., Stawicki, S., Chanthery, Y., Pan, Q., Chen, Y., Eigenbrot, C., Yin, J., Koch, A. W., Wu, X., et al. (2007). Function blocking antibodies to neuropilin-1 generated from a designed human synthetic antibody phage library. J Mol Biol 366, 815-829
McCoy, A. J., Grosse-Kunstleve, R. W., Adams, P. D., Winn, M. D., Storoni, L. C., and Read, R. J. (2007). Phaser crystallographic software. J Appl Crystallogr 40, 658-
Murshudov, G. N., Vagin, A. A., and Dodson, E. J. (1997). Refinement of macromolecular structurby the maximum-likelihood method. Acta C
Otwinowski, Z., and Minor, W. (1996). Processing of X-ray diffraction data collected in oscillation mode. Methods in Enzymol 276, 307-326.
Sidhuantibody libraries of synthetic heavy chain complementarity determining regions. J Mol Biol 338, 29310.
Vajdos, F. F., Adams, C. W., Breece, T. N., Presta, L. G., Cs