Injectable and bioresponsive hydrogels for on-demand matrix metalloproteinase inhibition
Supplemental methods
Solid-phase peptide synthesis
The solid-phase resin (Rink Amide MBHA resin, 100-200 mesh, Novabiochem) was deprotected
with 20% (v/v) piperidine in N,N-dimethylformamide (DMF) solution and Fmoc protected
amino acids (Novabiochem) were activated with HBTU (Novabiochem) in 0.4 M N-
methylmorpholine in DMF prior to reaction with deprotected resin. Amino acids were reacted at
4x excess to solid-phase resin using an automated solid phase peptide synthesizer (PS 3, Protein
Technologies, Inc.). A hydrazide was incorporated into the amino acid sequence by utilizing a
protected free acid form, Tri-Boc-hydrazinoacetic acid (Sigma, 68972). After completion, the
polypeptide was cleaved from the resin with a 90% trifluoroacetic acid, 5% tri-isopropylsilane,
5% water solution for 3 hrs at room temperature. The polypeptide was then precipitated in ethyl
ether solution at -80°C for 2 hrs, spun down and dried against vacuum pump pressure overnight.
Matrix-assisted laser desorption/ionization-Time of Flight (MALDI-TOF) mass spectroscopy
was used to verify successful polypeptide mass based on theoretical calculation.
HA-maleimide synthesis
74kDa sodium hyaluronate (NaHy, Lifecore) was first converted to a tetrabutylammonium
(TBA) salt of HA (HATBA) by mixing NaHy with an ion exchange resin in DI water for 8hrs at
RT. The resin was then filtered from the aqueous solution and the solution was pH’d to 7.02
with TBAOH, frozen and lyophilized. HATBA was dissolved in DMSO and then reacted with
SUPPLEMENTARY INFORMATIONDOI: 10.1038/NMAT3922
NATURE MATERIALS | www.nature.com/naturematerials 1
© 2014 Macmillan Publishers Limited. All rights reserved.
N-(2-aminoethyl)maleimide trifluoroacetate salt (Sigma) in the presence of benzotriazol-1-
yloxytris(dimethylamino)-phosphonium hexafluorophosphate for 2 hrs at RT. The reaction
solution was then dialyzed against DI water for 14 days, frozen and lyophilized. Percent
maleimide modification of HA was determined to be ~35% of the HA repeat units by
normalizing the area under the maleimide 1H peak to the aminomethyl protons on the HA
backbone.
Solid-phase rTIMP-3 binding assay
HA-ALD, DS-ALD, and heparin (Sigma) at 2.5µM in PBS were coated overnight at 25°C on to
heparin binding plates (BD Life Sciences) 1. Wells were washed in TNC buffer (50 mM
Tris/HCl, 150 mM NaCl, 10 mM CaCl2, 0.05 % Brij-35 and 0.02 % sodium azide) containing 0.1
% Tween 20 between each subsequent incubation. Wells were blocked with 0.2% gelatin in TNC
buffer and then incubated with rTIMP-3-His (0.02-3µg/mL in blocking solution for 3 h at 37°C).
Bound rTIMP-3-His was detected using a biotin labeled antibody against the 6xHis tag on
rTIMP-3 (Abcam, catalogue number ab27025, for 3 h at 37◦C), followed by streptavidin coupled
to horseradish peroxidase (R&D Systems) for 1 hr at 37°C. Hydrolysis of a 1:1 mixture of H2O2
and tetramethylbenzidine was measured at 450 nm using a microplate reader (Tecan).
Hydrogel gelation (range of macromer concentrations)
A range of macromer concentrations (1 to 5 wt%) at 1:1 ALD:HYD was investigated, where
concentrations greater than 5 wt% were too viscous to pipette or eject through a syringe and
concentrations less than 1 wt% did not form stable hydrogels. 5, 3.5, 2 and 1 macromer wt%
hydrogels were prepared with the following components:
2 NATURE MATERIALS | www.nature.com/naturematerials
SUPPLEMENTARY INFORMATION DOI: 10.1038/NMAT3922
© 2014 Macmillan Publishers Limited. All rights reserved.
• 5 wt% : 3.4% HA-ALD, 2% DS-ALD, and 4.6% HA-MMP-HYD (w/v) • 3.5 wt%: 2.4% HA-ALD, 1.4% DS-ALD, and 3.2% HA-MMP-HYD (w/v) • 2 wt%: 1.4% HA-ALD, 0.8% DS-ALD, and 1.8% HA-MMP-HYD (w/v) • 1 wt%: 0.7% HA-ALD, 0.4% DS-ALD, and 0.9% HA-MMP-HYD (w/v)
ALD containing polymers were dissolved together in PBS and HYD containing polymers were
dissolved separately in PBS. Gels were crosslinked by mixing ALD and HYD components at a
1:1 (v/v) ratio and incubating at 37°C.
rTIMP-3 immunoblotting
LV extracts (80 µg of total protein) underwent electrophoretic separation, transferred to a
nitrocellulose, incubated with TIMP-3 anti-sera (1:2000, Cat#AB6000, Millipore, Billerica, MA,
overnight 4°C), the immune-positive signal detected by chemiluminescence (Western Lighting,
Perkin Elmer). Uniform loading conditions were achieved by identical amounts of myocardial
protein extract (80 µg, Bradford assay; #500-0001, BioRad) loaded on each lane of the
electrophoretic gel. Uniform protein loading and electrophoretic separation was further
confirmed by Coomassie Blue staining (Brilliant Blue R250, Fisher). In order to confirm the
presence and absence of rTIMP-3 within the LV targeted regions, immunoblotting was
performed using His-tag antisera (1:1000, Cat#ab27025, Abcam, Cambridge, MA, overnight
4°C).
Histology
Full thickness LV samples from the injection area were embedded in O.C.T., sectioned (8 µm),
fixed in formalin and stained with hematoxylin and eosin. Hydrogel was identified by uniform
regions of dark purple stain. Hydrogel areas were quantified manually by drawing around voids
in tissue lined by dark purple hydrogel remnants and calculating an area using ImageScope
NATURE MATERIALS | www.nature.com/naturematerials 3
SUPPLEMENTARY INFORMATIONDOI: 10.1038/NMAT3922
© 2014 Macmillan Publishers Limited. All rights reserved.
(Aperio). Areas from 2 distant sections were averaged per tissue sample. Sections were
incubated in hyaluronidase solution to confirm presence of HA hydrogel. Formalin fixed full
thickness LV samples were embedded in paraffin, sectioned (7 µm), and stained with picrosirius
red for fibrillar collagen, and the percent area of collagen within the remote and MI regions were
computed using computer assisted morphometry 2. Immunostaining was used to colocalize with
cells that stained positive for α-smooth muscle actin (1:100; α-smooth muscle actin: Sigma
A5228), a marker for actin present in vascular smooth muscle cells as well as myofibroblasts,
using approaches described previously 3.
PCR analysis
For RNA extraction, the quantity and quality of the RNA was determined (Experion Automated
Electrophoresis System; Bio-Rad Laboratories, Hercules, CA). RNA (1 µg) was reverse
transcribed to generate cDNA (iScript cDNA Synthesis Kit; Bio-Rad). The cDNA was amplified
with gene/pig specific primer/probe sets (RT2 Profiler PCR Custom Array, Qiagen) presented in
Fig. S2. The array was designed to contain primers for each gene of interest, along with internal
controls and contamination controls. The reaction was performed (RT2 SYBR Green@qPCR
Mastermix, Qiagen) and quantified by real time PCR (CFX96 real-time PCR detection system,
Bio-Rad). The real-time PCR fluorescence signal was converted to cycle times (Ct) normalized
to GAPDH (ΔCt) and final results expressed as 2-∆Ct×10-3. All PCR assays were performed in
duplicate.
Data and statistical analysis
4 NATURE MATERIALS | www.nature.com/naturematerials
SUPPLEMENTARY INFORMATION DOI: 10.1038/NMAT3922
© 2014 Macmillan Publishers Limited. All rights reserved.
LV geometry and function were compared between sham and MI groups using a one-way
analysis of variance (ANOVA). Post-hoc separation following ANOVA was performed using
pairwise comparisons with a Bonferroni analysis (prcomp module, STATA). The interstitial
global MMP activity was evaluated by ANOVA and subsequently compared against the control
values of 100% by a Student’s t-test. For TIMP-3 levels, values from each group were first
evaluated by ANOVA, and then a post-hoc separation following ANOVA was performed using
pairwise comparisons with a Bonferroni analysis. For hydrogel areas in tissue sections, values
were compared between groups using a Student’s t-test, followed by a Bonferroni correction for
multiple comparisons. Results are presented as a mean ± standard error of the mean (SEM), and
values of p<0.05 were considered to be statistically significant.
Supplemental References
1 Mahoney, D. J. et al. A method for the non-covalent immobilization of heparin to
surfaces. Anal Biochem 330, 123-129 (2004). 2 Mukherjee, R. et al. Myocardial infarct expansion and matrix metalloproteinase
inhibition. Circulation 107, 618-625 (2003). 3 Mukherjee, R. et al. Long-term localized high-frequency electric stimulation within the
myocardial infarct: effects on matrix metalloproteinases and regional remodeling. Circulation 122, 20-32 (2010)
NATURE MATERIALS | www.nature.com/naturematerials 5
SUPPLEMENTARY INFORMATIONDOI: 10.1038/NMAT3922
© 2014 Macmillan Publishers Limited. All rights reserved.
Supplemental Figures
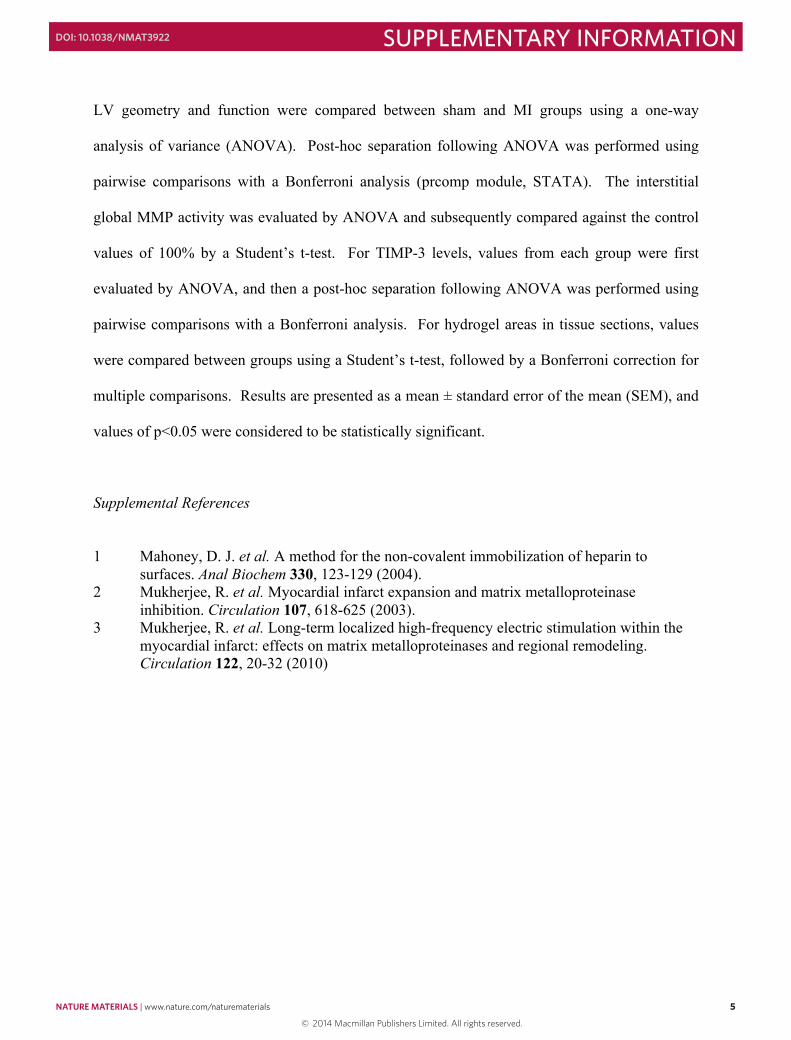
Figure S1. Aldehyde modifications. Aldehyde groups were synthesized on HA (a) and DS (b) polysaccharide using sodium periodate (NaIO4) oxidation of diol group. Different reaction conditions were chosen for each polysaccharide due to differences in the amount of diol groups per repeat unit. For HA modification, 1:2 NaIO4:HA for 2 hr was used, while for DS modification, 2:1 NaIO4:HA for 5 hr was used.
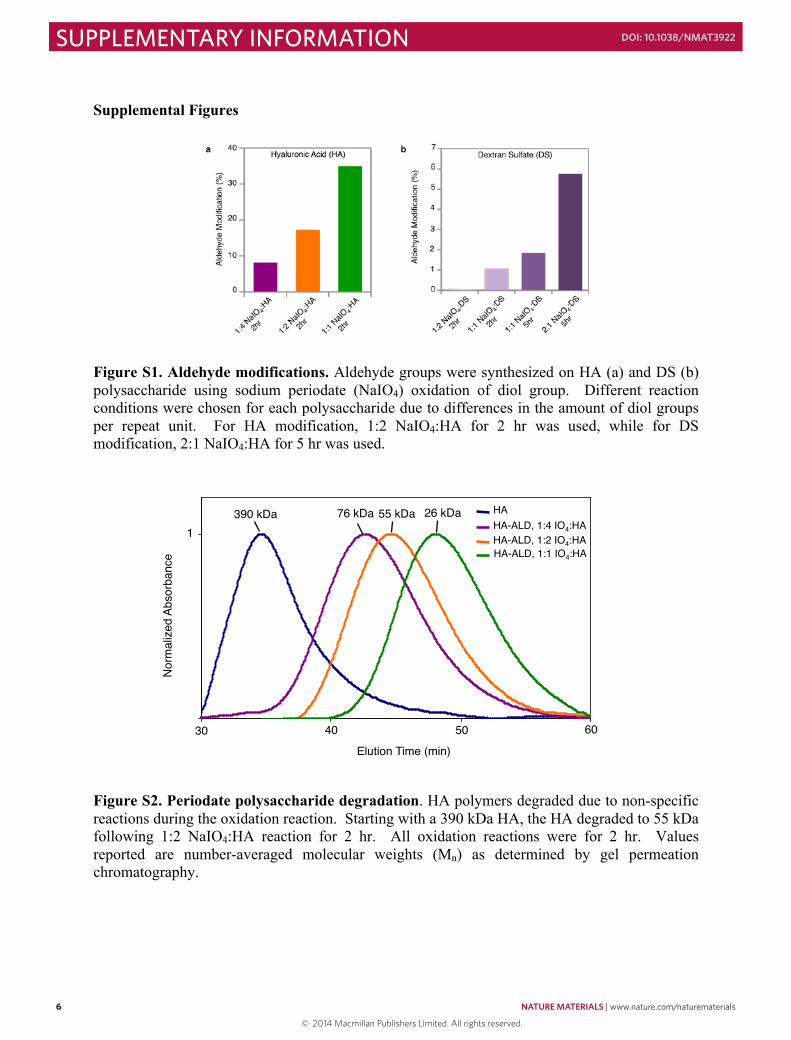
Figure S2. Periodate polysaccharide degradation. HA polymers degraded due to non-specific reactions during the oxidation reaction. Starting with a 390 kDa HA, the HA degraded to 55 kDa following 1:2 NaIO4:HA reaction for 2 hr. All oxidation reactions were for 2 hr. Values reported are number-averaged molecular weights (Mn) as determined by gel permeation chromatography.
30! 40! 50! 60!
1!
Elution Time (min) !
Norm
alize
d Ab
sorb
ance!
HA!HA-ALD, 1:4 IO4:HA!
HA-ALD, 1:2 IO4:HA!HA-ALD, 1:1 IO4:HA!
390 kDa! 76 kDa!55 kDa! 26 kDa!
6 NATURE MATERIALS | www.nature.com/naturematerials
SUPPLEMENTARY INFORMATION DOI: 10.1038/NMAT3922
© 2014 Macmillan Publishers Limited. All rights reserved.
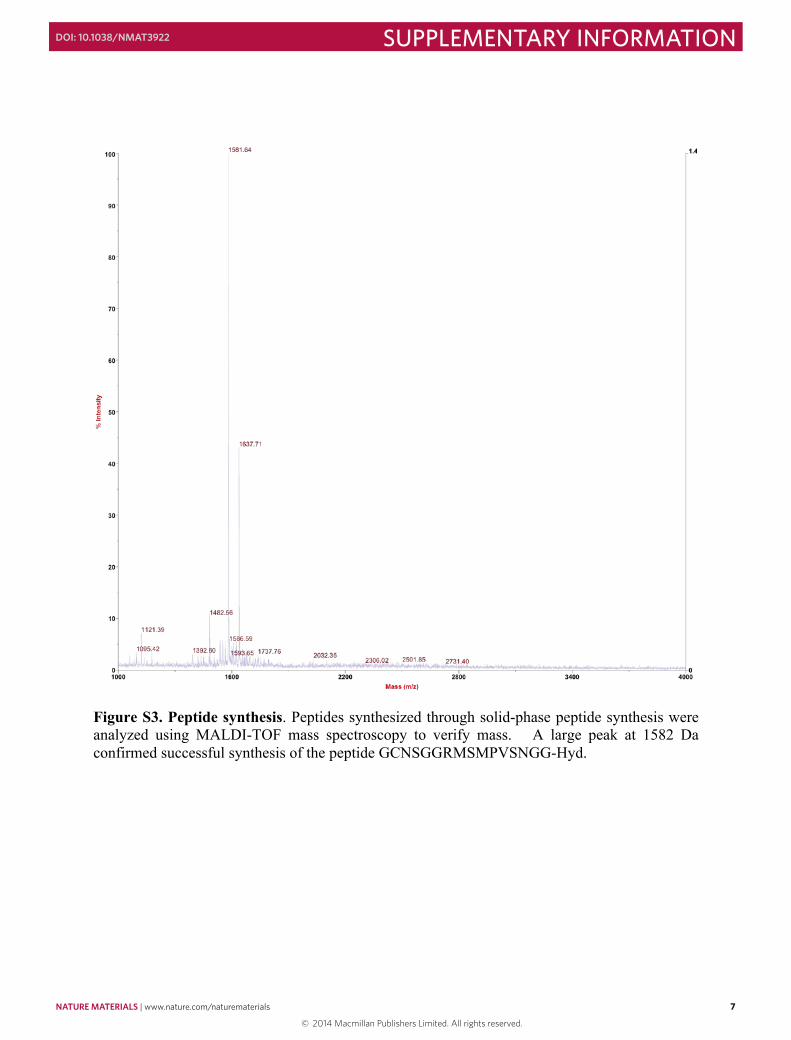
Figure S3. Peptide synthesis. Peptides synthesized through solid-phase peptide synthesis were analyzed using MALDI-TOF mass spectroscopy to verify mass. A large peak at 1582 Da confirmed successful synthesis of the peptide GCNSGGRMSMPVSNGG-Hyd.
NATURE MATERIALS | www.nature.com/naturematerials 7
SUPPLEMENTARY INFORMATIONDOI: 10.1038/NMAT3922
© 2014 Macmillan Publishers Limited. All rights reserved.
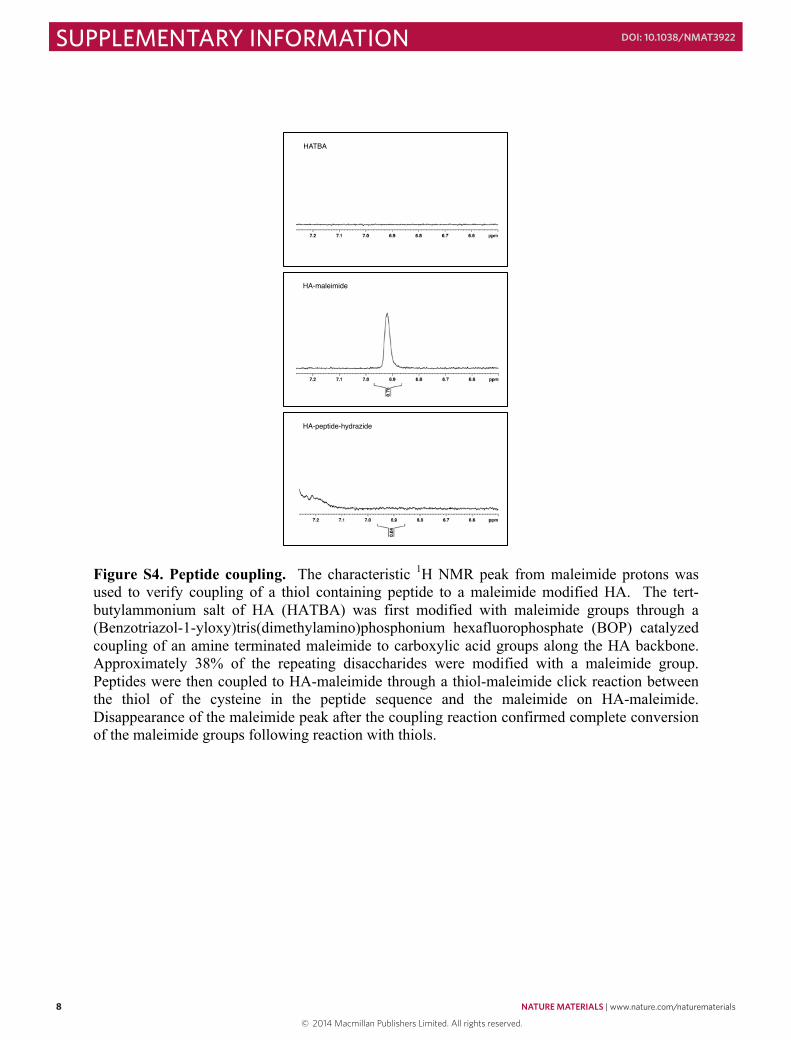
Figure S4. Peptide coupling. The characteristic 1H NMR peak from maleimide protons was used to verify coupling of a thiol containing peptide to a maleimide modified HA. The tert-butylammonium salt of HA (HATBA) was first modified with maleimide groups through a (Benzotriazol-1-yloxy)tris(dimethylamino)phosphonium hexafluorophosphate (BOP) catalyzed coupling of an amine terminated maleimide to carboxylic acid groups along the HA backbone. Approximately 38% of the repeating disaccharides were modified with a maleimide group. Peptides were then coupled to HA-maleimide through a thiol-maleimide click reaction between the thiol of the cysteine in the peptide sequence and the maleimide on HA-maleimide. Disappearance of the maleimide peak after the coupling reaction confirmed complete conversion of the maleimide groups following reaction with thiols.
HATBA!
HA-maleimide!
HA-peptide-hydrazide!
8 NATURE MATERIALS | www.nature.com/naturematerials
SUPPLEMENTARY INFORMATION DOI: 10.1038/NMAT3922
© 2014 Macmillan Publishers Limited. All rights reserved.
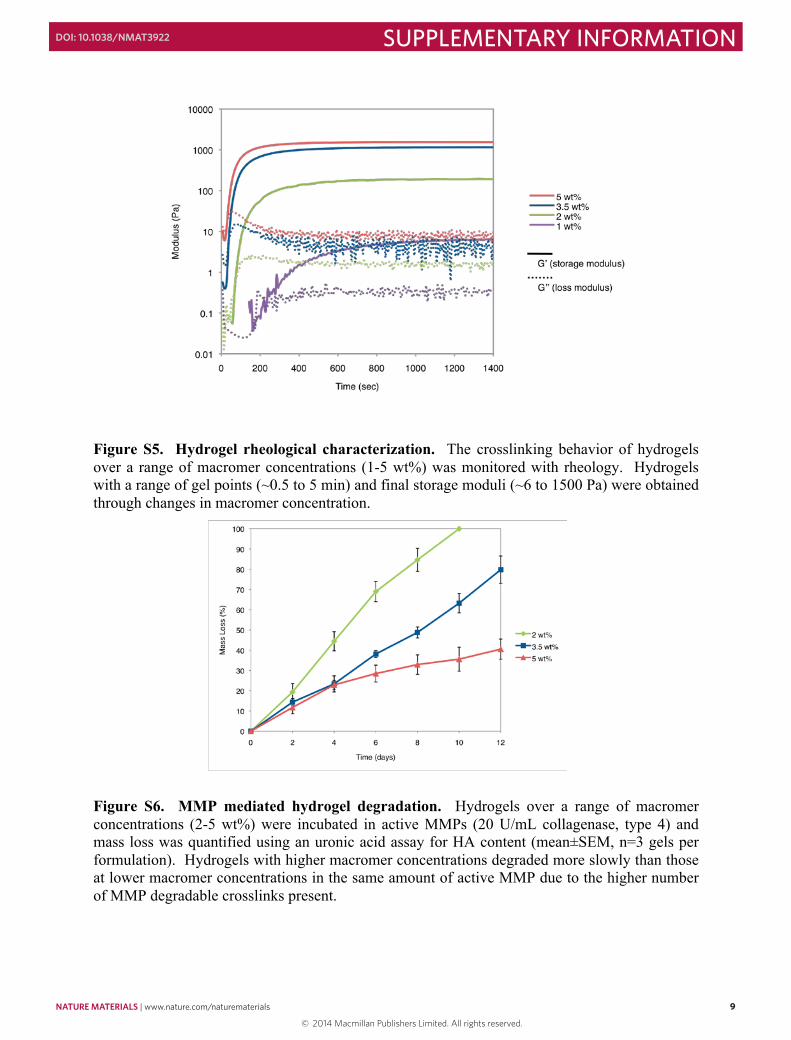
Figure S5. Hydrogel rheological characterization. The crosslinking behavior of hydrogels over a range of macromer concentrations (1-5 wt%) was monitored with rheology. Hydrogels with a range of gel points (~0.5 to 5 min) and final storage moduli (~6 to 1500 Pa) were obtained through changes in macromer concentration.
Figure S6. MMP mediated hydrogel degradation. Hydrogels over a range of macromer concentrations (2-5 wt%) were incubated in active MMPs (20 U/mL collagenase, type 4) and mass loss was quantified using an uronic acid assay for HA content (mean±SEM, n=3 gels per formulation). Hydrogels with higher macromer concentrations degraded more slowly than those at lower macromer concentrations in the same amount of active MMP due to the higher number of MMP degradable crosslinks present.
NATURE MATERIALS | www.nature.com/naturematerials 9
SUPPLEMENTARY INFORMATIONDOI: 10.1038/NMAT3922
© 2014 Macmillan Publishers Limited. All rights reserved.
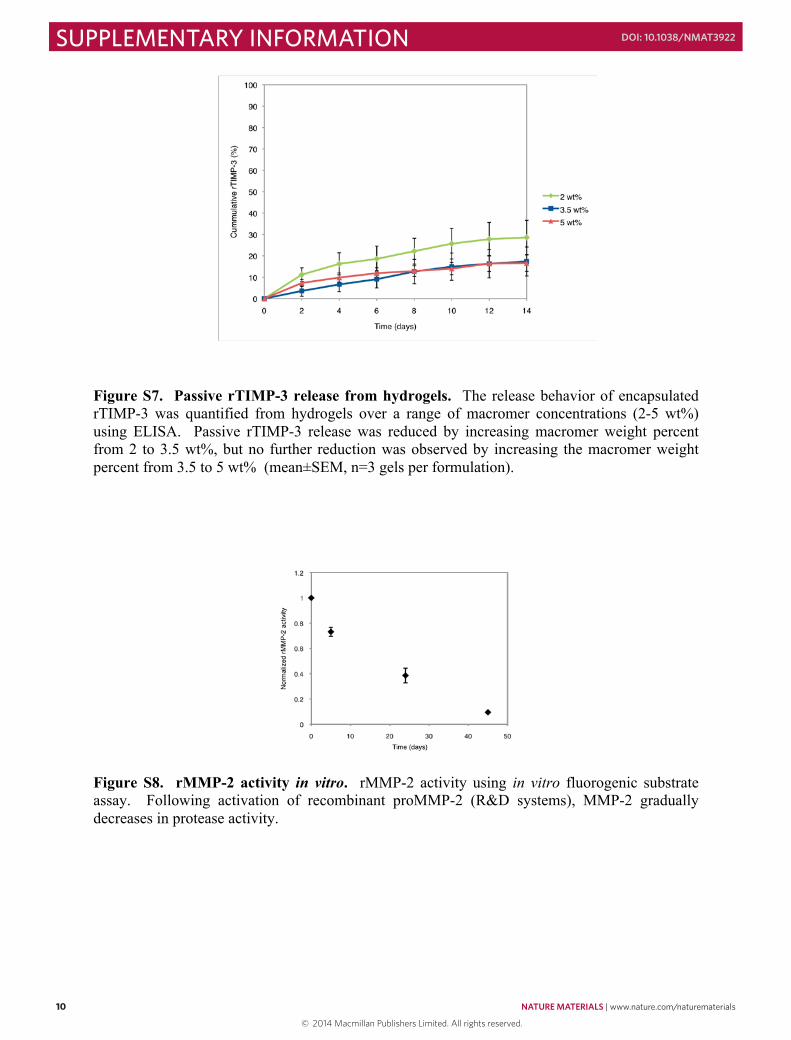
Figure S7. Passive rTIMP-3 release from hydrogels. The release behavior of encapsulated rTIMP-3 was quantified from hydrogels over a range of macromer concentrations (2-5 wt%) using ELISA. Passive rTIMP-3 release was reduced by increasing macromer weight percent from 2 to 3.5 wt%, but no further reduction was observed by increasing the macromer weight percent from 3.5 to 5 wt% (mean±SEM, n=3 gels per formulation).
Figure S8. rMMP-2 activity in vitro. rMMP-2 activity using in vitro fluorogenic substrate assay. Following activation of recombinant proMMP-2 (R&D systems), MMP-2 gradually decreases in protease activity.
10 NATURE MATERIALS | www.nature.com/naturematerials
SUPPLEMENTARY INFORMATION DOI: 10.1038/NMAT3922
© 2014 Macmillan Publishers Limited. All rights reserved.
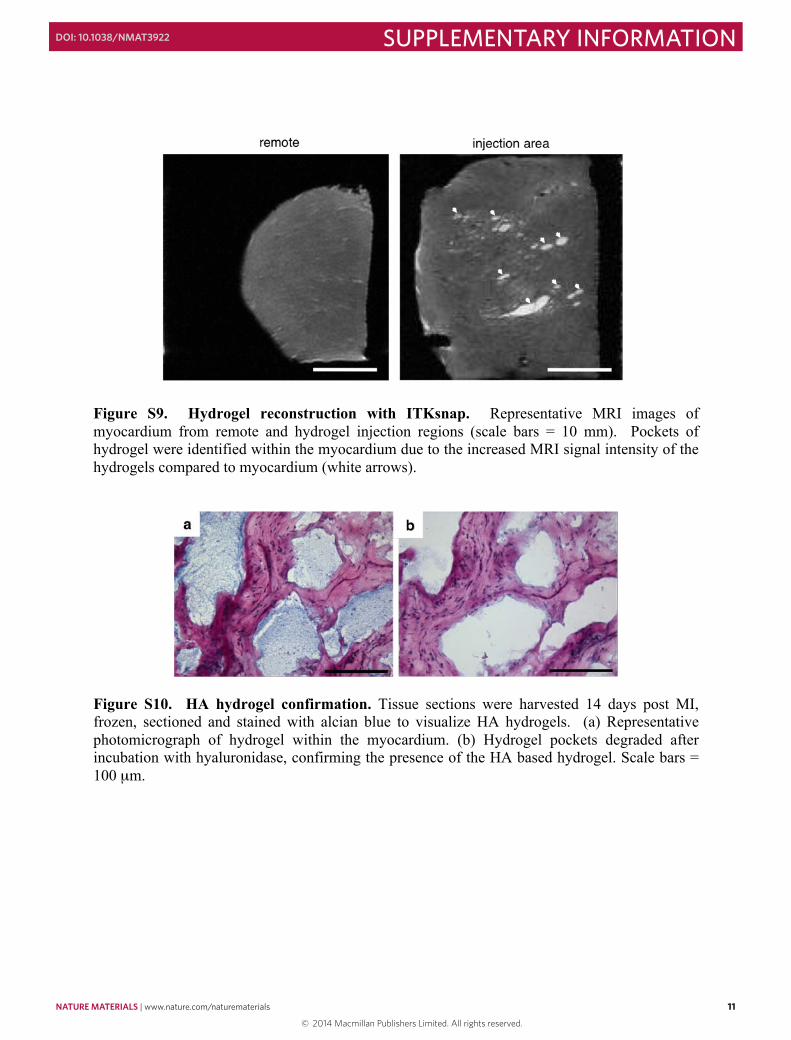
Figure S9. Hydrogel reconstruction with ITKsnap. Representative MRI images of myocardium from remote and hydrogel injection regions (scale bars = 10 mm). Pockets of hydrogel were identified within the myocardium due to the increased MRI signal intensity of the hydrogels compared to myocardium (white arrows).
Figure S10. HA hydrogel confirmation. Tissue sections were harvested 14 days post MI, frozen, sectioned and stained with alcian blue to visualize HA hydrogels. (a) Representative photomicrograph of hydrogel within the myocardium. (b) Hydrogel pockets degraded after incubation with hyaluronidase, confirming the presence of the HA based hydrogel. Scale bars = 100 µm.
NATURE MATERIALS | www.nature.com/naturematerials 11
SUPPLEMENTARY INFORMATIONDOI: 10.1038/NMAT3922
© 2014 Macmillan Publishers Limited. All rights reserved.
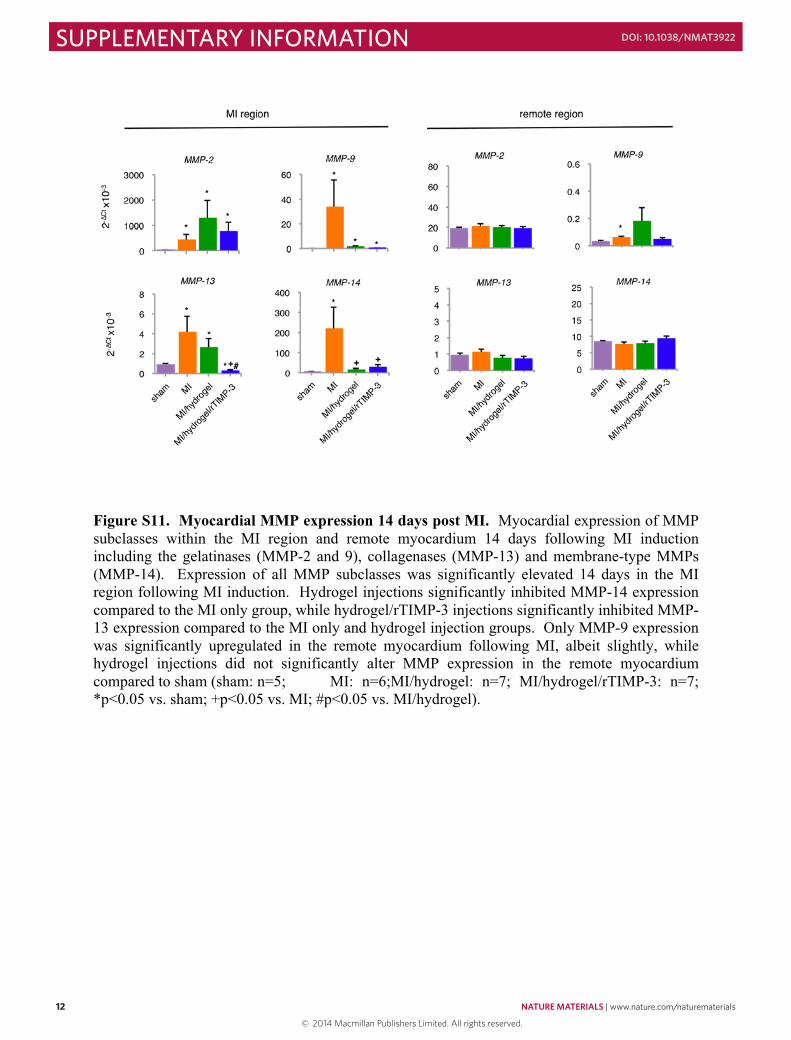
Figure S11. Myocardial MMP expression 14 days post MI. Myocardial expression of MMP subclasses within the MI region and remote myocardium 14 days following MI induction including the gelatinases (MMP-2 and 9), collagenases (MMP-13) and membrane-type MMPs (MMP-14). Expression of all MMP subclasses was significantly elevated 14 days in the MI region following MI induction. Hydrogel injections significantly inhibited MMP-14 expression compared to the MI only group, while hydrogel/rTIMP-3 injections significantly inhibited MMP-13 expression compared to the MI only and hydrogel injection groups. Only MMP-9 expression was significantly upregulated in the remote myocardium following MI, albeit slightly, while hydrogel injections did not significantly alter MMP expression in the remote myocardium compared to sham (sham: n=5; MI: n=6;MI/hydrogel: n=7; MI/hydrogel/rTIMP-3: n=7; *p<0.05 vs. sham; +p<0.05 vs. MI; #p<0.05 vs. MI/hydrogel).
12 NATURE MATERIALS | www.nature.com/naturematerials
SUPPLEMENTARY INFORMATION DOI: 10.1038/NMAT3922
© 2014 Macmillan Publishers Limited. All rights reserved.
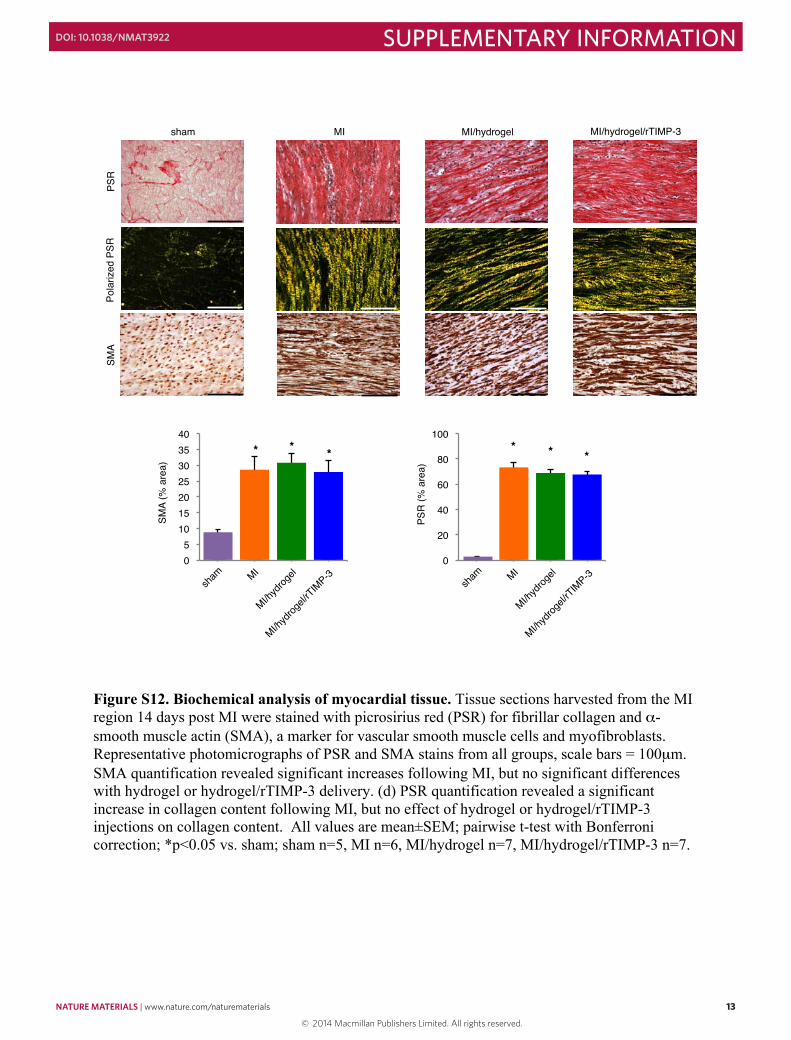
Figure S12. Biochemical analysis of myocardial tissue. Tissue sections harvested from the MI region 14 days post MI were stained with picrosirius red (PSR) for fibrillar collagen and α-smooth muscle actin (SMA), a marker for vascular smooth muscle cells and myofibroblasts. Representative photomicrographs of PSR and SMA stains from all groups, scale bars = 100µm. SMA quantification revealed significant increases following MI, but no significant differences with hydrogel or hydrogel/rTIMP-3 delivery. (d) PSR quantification revealed a significant increase in collagen content following MI, but no effect of hydrogel or hydrogel/rTIMP-3 injections on collagen content. All values are mean±SEM; pairwise t-test with Bonferroni correction; *p<0.05 vs. sham; sham n=5, MI n=6, MI/hydrogel n=7, MI/hydrogel/rTIMP-3 n=7.
0!
20!
40!
60!
80!
100!
0!5!
10!15!20!25!30!35!40!
sham! MI/hydrogel/rTIMP-3!
PSR!
Pola
rized
PSR
!SM
A!
MI! MI/hydrogel!
*! *! *! *! *! *!
sham!
MI!
MI/hyd
rogel!
MI/hyd
rogel/
rTIMP-3!
sham!
MI!
MI/hyd
rogel!
MI/hyd
rogel/
rTIMP-3!
SMA
(% a
rea)!
PSR
(% a
rea)!
NATURE MATERIALS | www.nature.com/naturematerials 13
SUPPLEMENTARY INFORMATIONDOI: 10.1038/NMAT3922
© 2014 Macmillan Publishers Limited. All rights reserved.
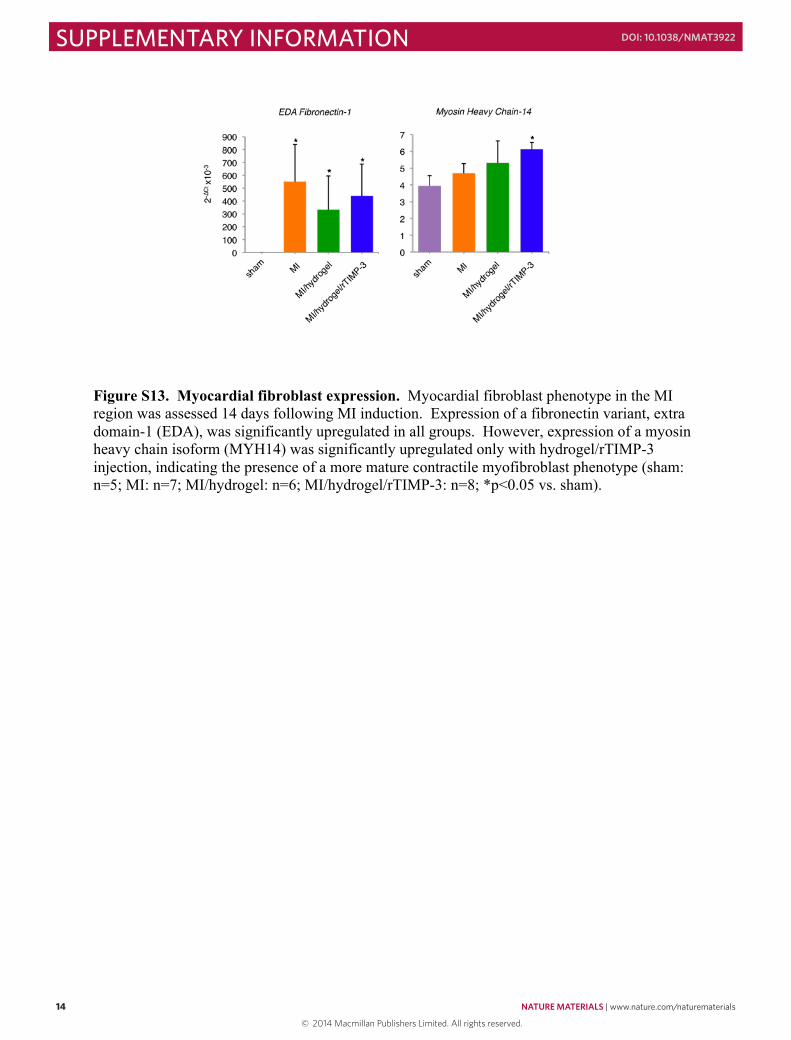
Figure S13. Myocardial fibroblast expression. Myocardial fibroblast phenotype in the MI region was assessed 14 days following MI induction. Expression of a fibronectin variant, extra domain-1 (EDA), was significantly upregulated in all groups. However, expression of a myosin heavy chain isoform (MYH14) was significantly upregulated only with hydrogel/rTIMP-3 injection, indicating the presence of a more mature contractile myofibroblast phenotype (sham: n=5; MI: n=7; MI/hydrogel: n=6; MI/hydrogel/rTIMP-3: n=8; *p<0.05 vs. sham).
14 NATURE MATERIALS | www.nature.com/naturematerials
SUPPLEMENTARY INFORMATION DOI: 10.1038/NMAT3922
© 2014 Macmillan Publishers Limited. All rights reserved.
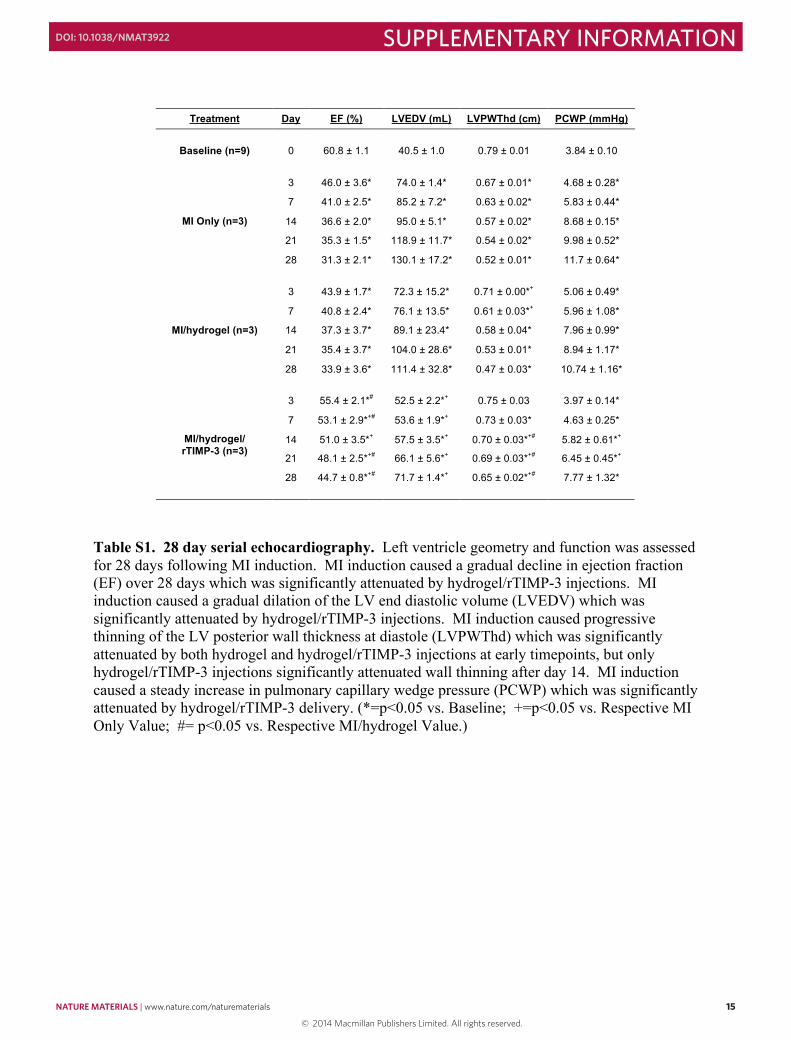
Table S1. 28 day serial echocardiography. Left ventricle geometry and function was assessed for 28 days following MI induction. MI induction caused a gradual decline in ejection fraction (EF) over 28 days which was significantly attenuated by hydrogel/rTIMP-3 injections. MI induction caused a gradual dilation of the LV end diastolic volume (LVEDV) which was significantly attenuated by hydrogel/rTIMP-3 injections. MI induction caused progressive thinning of the LV posterior wall thickness at diastole (LVPWThd) which was significantly attenuated by both hydrogel and hydrogel/rTIMP-3 injections at early timepoints, but only hydrogel/rTIMP-3 injections significantly attenuated wall thinning after day 14. MI induction caused a steady increase in pulmonary capillary wedge pressure (PCWP) which was significantly attenuated by hydrogel/rTIMP-3 delivery. (*=p<0.05 vs. Baseline; +=p<0.05 vs. Respective MI Only Value; #= p<0.05 vs. Respective MI/hydrogel Value.)
Treatment Day EF (%) LVEDV (mL) LVPWThd (cm) PCWP (mmHg)
Baseline (n=9) 0 60.8 ± 1.1 40.5 ± 1.0 0.79 ± 0.01 3.84 ± 0.10
3 46.0 ± 3.6* 74.0 ± 1.4* 0.67 ± 0.01* 4.68 ± 0.28*
7 41.0 ± 2.5* 85.2 ± 7.2* 0.63 ± 0.02* 5.83 ± 0.44*
14 36.6 ± 2.0* 95.0 ± 5.1* 0.57 ± 0.02* 8.68 ± 0.15*
21 35.3 ± 1.5* 118.9 ± 11.7* 0.54 ± 0.02* 9.98 ± 0.52*
MI Only (n=3)
28 31.3 ± 2.1* 130.1 ± 17.2* 0.52 ± 0.01* 11.7 ± 0.64*
3 43.9 ± 1.7* 72.3 ± 15.2* 0.71 ± 0.00*+ 5.06 ± 0.49*
7 40.8 ± 2.4* 76.1 ± 13.5* 0.61 ± 0.03*+ 5.96 ± 1.08*
14 37.3 ± 3.7* 89.1 ± 23.4* 0.58 ± 0.04* 7.96 ± 0.99*
21 35.4 ± 3.7* 104.0 ± 28.6* 0.53 ± 0.01* 8.94 ± 1.17*
MI/hydrogel (n=3)
28 33.9 ± 3.6* 111.4 ± 32.8* 0.47 ± 0.03* 10.74 ± 1.16*
3 55.4 ± 2.1*# 52.5 ± 2.2*+ 0.75 ± 0.03 3.97 ± 0.14*
7 53.1 ± 2.9*+# 53.6 ± 1.9*+ 0.73 ± 0.03* 4.63 ± 0.25*
14 51.0 ± 3.5*+ 57.5 ± 3.5*+ 0.70 ± 0.03*+# 5.82 ± 0.61*+
21 48.1 ± 2.5*+# 66.1 ± 5.6*+ 0.69 ± 0.03*+# 6.45 ± 0.45*+
28 44.7 ± 0.8*+# 71.7 ± 1.4*+ 0.65 ± 0.02*+# 7.77 ± 1.32*
MI/hydrogel/ rTIMP-3 (n=3)
NATURE MATERIALS | www.nature.com/naturematerials 15
SUPPLEMENTARY INFORMATIONDOI: 10.1038/NMAT3922
© 2014 Macmillan Publishers Limited. All rights reserved.
UniGene GenBank # Matrix Metalloproteinases (MMPs) MMP-2 Ssc. 5713 NM_214192 MMP-9 PPS01420 NM_001038004 MMP-13 Ssc. 16053 XM_003129808 MMP-14 Ssc. 734 NM_214239 Myofibroblast FN1 (EDA) Ssc. 16743 XM_003133641 MYH14 Ssc. 93295 XM_003127360
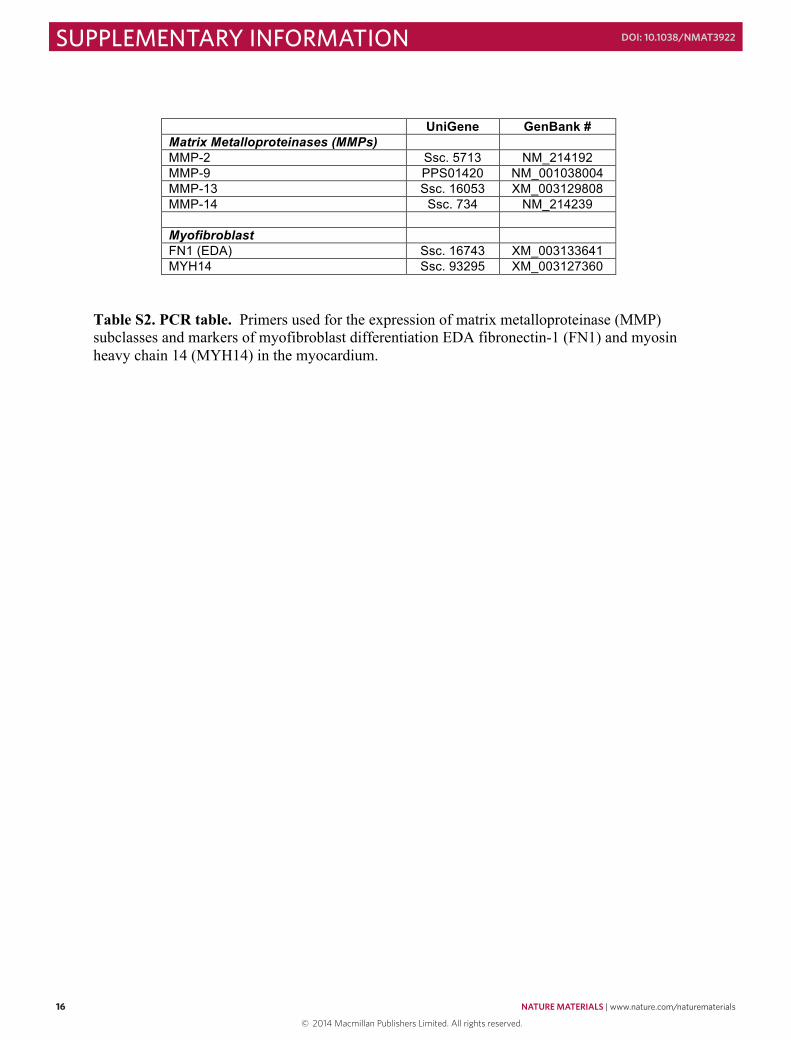
Table S2. PCR table. Primers used for the expression of matrix metalloproteinase (MMP) subclasses and markers of myofibroblast differentiation EDA fibronectin-1 (FN1) and myosin heavy chain 14 (MYH14) in the myocardium.
16 NATURE MATERIALS | www.nature.com/naturematerials
SUPPLEMENTARY INFORMATION DOI: 10.1038/NMAT3922
© 2014 Macmillan Publishers Limited. All rights reserved.