Page 1
Supplemental Nutrition Assistance Program
STATE ACTIVITY REPORT Fiscal Year 2016
Food and Nutrition Service Supplemental Nutrition Assistance Program
Program Accountability and Administration Division September 2017
Page 2
TABLE OF CONTENTS
Introduction..............................................................................................................1
National Summary FY 2015 - 2016............................................................................2
I. State Participation and Issuance..........................................................................3
II. Administrative Costs..........................................................................................10
III. Fair Hearings......................................................................................................18
VI. Fraud Investigations, Prosecutions, and Administrative Disqualification Hearings.......................................................21
VII. Recipient Claims..............................................................................................30
VII. Participation and Issuance Rankings..............................................................36
VIII. Multi-Year Comparisons.................................................................................42
End Notes...............................................................................................................57
Page 3
INTRODUCTION
This is a report of State activity in the Supplemental Nutrition Assistance Program (SNAP). The data contained herein is State reported data or data calculated from State reported data.
The tables are based on data for all of Fiscal Year 2016. Fiscal Year 2016 data in this report reflects National Data Bank totals as of May 2017.
As may be expected in a report of this size, which consolidates information taken from multiple data sources, there are some apparent discrepancies in reported data. States report nearly all of the data in this report on a quarterly or yearly basis. Differences between State reporting methods and timeframes may lead to minor discrepancies between some similar data elements in this report. In addition, some data may still be revised after the publication of this report.
To assist the reader, end notes are provided at the conclusion of the report identifying the data sources and other pertinent information for each individual section. All data, with one exception, was compiled from the National Data Bank, the official repository of SNAP data. The report was prepared by the Program Accountability and Administration Division. Some of the data highlighted in this report are:
• Recipient Claims Table: Reports onthe methods used by Stateagencies to collect claims againstrecipient households. Some of the
data included in the recipient claims table is derived from administrative offset weekly statistical reports prepared by the U. S. Department of the Treasury.
• Ranking Section: Tables that rankparticipation and issuance data,from high to low, for each State.
This entire report is available on the SNAP web page at: www.fns.usda.gov/pd/snapmain.html.
If there are any questions concerning the data in this publication, contact the State Administration Branch at [email protected] .
1
Page 4
Supplemental Nutrition Assistance Program (SNAP) Activity - FY 2015-2016National Summary Tables
FY 2015 FY 2016 Percent ChangePersons Participating (monthly average, in millions) 45.8 44.2 -3.38%Households Participating (monthly average, in millions) 22.5 21.8 -3.30%Total Issuance (in millions) $69,655.4 $66,539.4 -4.47%Average Monthly Benefit per Person $126.83 $125.40 -1.13%Average Monthly Benefit per Household $257.73 $254.61 -1.21%
Table 2: State Agency Administrative Costs (in millions)
FY 2015 FY 2016 Percent ChangeTotal Costs $7,653.4 $7,835.0 2.37%Federal Share of Certification Costs $2,502.9 $2,509.5 0.27%Federal Share of Issuance Costs $145.0 $135.6 -6.50%Federal Share of Fraud Control Costs $161.4 $154.7 -4.19%Total Federal Share $3,777.6 $3,824.6 1.24%
Table 3: Fraud Control Activity
FY 2015 FY 2016 Percent Change723,111 963,965 33.31%
20,320 24,381 19.99%19,910 24,925 25.19%
2,913 3,882 33.26%5,075 5,205 2.56%
Investigations CompletedAdministrative Disqualification Hearings Waived Administrative Disqualification Hearings Completed Disqualification Consent AgreementsProsecutions CompletedTotal Disqualifications 46,514 55,930 20.24%
Table 4: Recipient Claims (in millions)
FY 2015 FY 2016 Percent ChangeFraud Claims Established $58.6 $73.4 25.28%Household Error Claims Established $397.2 $421.9 6.23%Agency Error Claims Established $191.3 $188.9 -1.28%Total Claims Established $647.1 $684.2 5.73%
Claims Collected via Recoupment $143.6 $155.3 8.18%Claims Collected via Treasury Offset Program $156.4 $166.0 6.14%Other Collection Methods and Refunds $66.5 $80.6 21.30%Total Claims Collected $366.5 $402.0 9.69%
Table 1: Participation and Issuance
• Totals may not add due to rounding.
• Some states establish all non-agency error claims as household error claims initially and then transfer the claim fromhousehold error to fraud after the prosecution or ADH. Therefore, the sum of the fraud associated with disqualifications is a better measure of the ultimate amount of fraud claims than the newly established amount.
2
Page 5
I.
State Participation and Issuance
3
Page 6
NOTABLE TRENDS
PARTICIPATION AND ISSUANCE
In Fiscal Year (FY) 2016 State agencies issued approximately $66.5 billion in Supplemental Nutrition Assistance Program (SNAP) benefits, a 4.5 percent decrease from $69.7 billion in FY 2015. These benefits were issued to a monthly average of 21.8 million households or 44.2 million people participating in the Program, a 3.38 percent decrease from 45.8 million participants the previous year. The average monthly benefit was $125.40 per person or $254.61 per household. The Food and Nutrition Act of 2008 requires that Electronic Benefit Transfer (EBT) cards be the sole method of benefit delivery. EBT systems issue and redeem benefits using cards, electronic funds transfer networks, and point-of-sale technology in authorized retail food stores. The Federal Government pays 100 percent of the benefits issued.
CASH-OUT
Cash-out projects are limited to certain pilot projects authorized in the Food and Nutrition Act that have either continued to operate since 1981 or were approved prior to August 1996. While technically not considered part of the EBT system for issuance, redemption, and reporting purposes, States with FNS-approved cash- out issuance systems (for wage sup- plementation, welfare reform, or other approved demonstration projects) may issue cash-out benefits electronically via
either direct deposit or debit cards, which can be used at automatic teller machines to draw the funds. In FY 2016, $126.6 million in cash-out benefits were issued to 82,323 households in 5 States.
DEMONSTRATION PROJECT
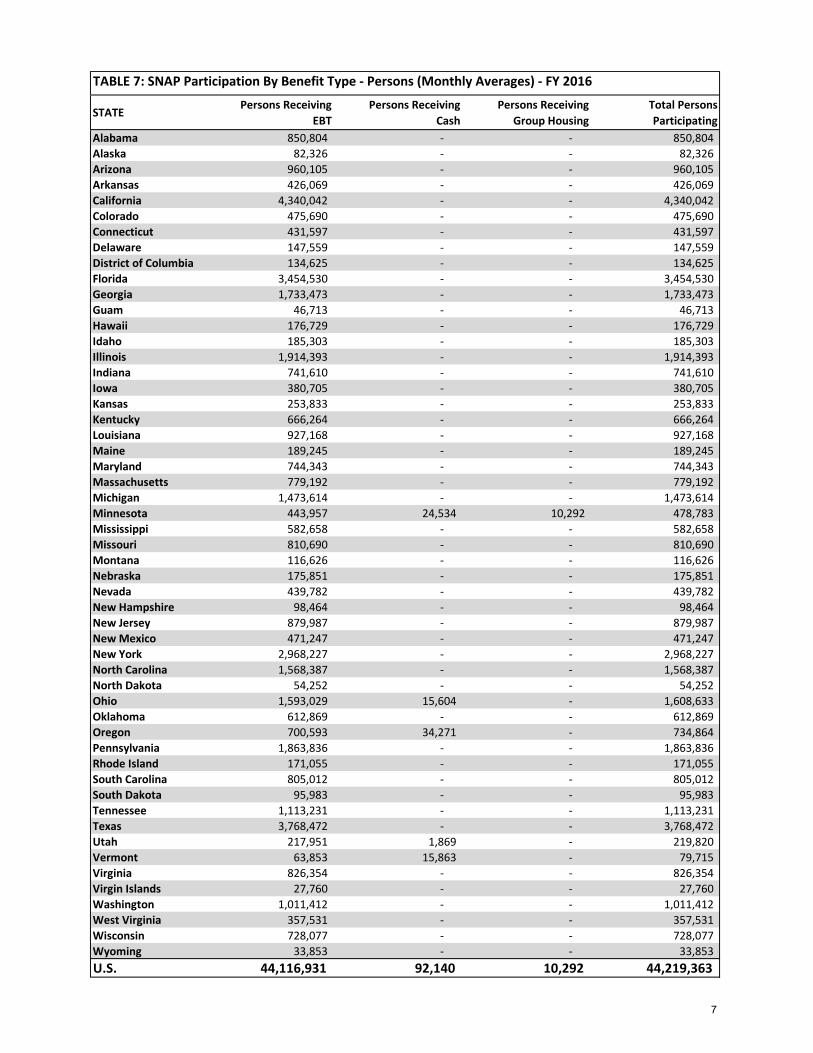
In FY 2016, Minnesota operated an approved Group Residential Housing project that provided $14.8 million in SNAP benefits to be used for food purchase by 10,292 residents.
4
Page 7
TABLE 5: SNAP Participation and Issuance - FY 2016
STATE Persons Participating
(Monthly Average) Households Participating
(Monthly Average) Total Issuance
Alabama 850,804 399,728 $1,254,835,320Alaska 82,326 34,648 $175,483,424Arizona 960,105 427,061 $1,402,230,493Arkansas 426,069 191,636 $577,775,082California 4,340,042 2,093,562 $7,237,700,086Colorado 475,690 225,334 $728,042,703Connecticut 431,597 244,927 $685,510,011Delaware 147,559 71,099 $220,683,314District of Columbia 134,625 75,819 $210,436,410Florida 3,454,530 1,870,739 $5,216,754,147Georgia 1,733,473 800,670 $2,663,017,763Guam 46,713 15,551 $106,333,972Hawaii 176,729 89,095 $484,225,008Idaho 185,303 79,531 $255,423,930Illinois 1,914,393 996,092 $3,040,976,772Indiana 741,610 328,688 $1,068,458,926Iowa 380,705 178,874 $507,597,206Kansas 253,833 114,392 $342,324,968Kentucky 666,264 313,476 $980,976,984Louisiana 927,168 422,090 $1,494,495,292Maine 189,245 98,549 $254,898,802Maryland 744,343 388,957 $1,079,151,904Massachusetts 779,192 450,364 $1,189,716,303Michigan 1,473,614 777,906 $2,167,714,845Minnesota 478,783 231,228 $602,563,639Mississippi 582,658 269,082 $814,420,697Missouri 810,690 378,373 $1,182,957,874Montana 116,626 54,612 $166,365,465Nebraska 175,851 78,482 $240,677,417Nevada 439,782 222,253 $629,519,652New Hampshire 98,464 48,037 $120,552,019New Jersey 879,987 440,091 $1,223,052,433New Mexico 471,247 216,877 $693,426,783New York 2,968,227 1,635,764 $4,922,406,430North Carolina 1,568,387 761,999 $2,248,946,897North Dakota 54,252 25,262 $78,700,888Ohio 1,608,633 793,923 $2,396,032,919Oklahoma 612,869 276,268 $885,643,482Oregon 734,864 419,778 $1,072,982,185Pennsylvania 1,863,836 950,739 $2,729,024,683Rhode Island 171,055 100,433 $271,959,596South Carolina 805,012 378,328 $1,222,104,228South Dakota 95,983 42,234 $144,590,242Tennessee 1,113,231 547,850 $1,672,282,240Texas 3,768,472 1,588,116 $5,308,544,560Utah 219,820 86,244 $301,869,697Vermont 79,715 42,976 $116,470,075Virginia 826,354 387,633 $1,169,412,644Virgin Islands 27,760 13,068 $56,766,573Washington 1,011,412 546,931 $1,452,893,518West Virginia 357,531 178,274 $499,059,458Wisconsin 728,077 359,933 $922,851,050Wyoming 33,853 14,367 $48,510,210U.S. 44,219,363 21,777,938 $66,539,351,219
• Totals may not add due to rounding.
5
Page 8
TABLE 6: SNAP Average Monthly Benefit - FY 2016
STATE Average Monthly Benefit
Per Person Average Monthly Benefit
Per Household Alabama $122.91 $261.60Alaska $177.63 $422.07Arizona $121.71 $273.62Arkansas $113.01 $251.25California $138.97 $288.09Colorado $127.54 $269.25Connecticut $132.36 $233.24Delaware $124.63 $258.66District of Columbia $130.26 $231.29Florida $125.84 $232.38Georgia $128.02 $277.17Guam $189.70 $569.82Hawaii $228.33 $452.91Idaho $114.87 $267.63Illinois $132.37 $254.41Indiana $120.06 $270.89Iowa $111.11 $236.48Kansas $112.39 $249.38Kentucky $122.70 $260.78Louisiana $134.32 $295.06Maine $112.24 $215.54Maryland $120.82 $231.21Massachusetts $127.24 $220.14Michigan $122.58 $232.22Minnesota $104.88 $217.16Mississippi $116.48 $252.22Missouri $121.60 $260.54Montana $118.87 $253.86Nebraska $114.05 $255.56Nevada $119.29 $236.04New Hampshire $102.03 $209.13New Jersey $115.82 $231.59New Mexico $122.62 $266.44New York $138.20 $250.77North Carolina $119.49 $245.95North Dakota $120.89 $259.62Ohio $124.12 $251.50Oklahoma $120.42 $267.15Oregon $121.68 $213.01Pennsylvania $122.02 $239.20Rhode Island $132.49 $225.66South Carolina $126.51 $269.19South Dakota $125.53 $285.30Tennessee $125.18 $254.37Texas $117.39 $278.56Utah $114.44 $291.68Vermont $121.76 $225.85Virginia $117.93 $251.40Virgin Islands $170.41 $361.99Washington $119.71 $221.37West Virginia $116.32 $233.28Wisconsin $105.63 $213.66Wyoming $119.41 $281.37U.S. $125.40 $254.61
6
Page 9
TABLE 7: SNAP Participation By Benefit Type - Persons (Monthly Averages) - FY 2016
STATEPersons Receiving
EBTPersons Receiving
CashPersons Receiving
Group HousingTotal Persons Participating
Alabama 850,804 - - 850,804 Alaska 82,326 - - 82,326 Arizona 960,105 - - 960,105 Arkansas 426,069 - - 426,069 California 4,340,042 - - 4,340,042 Colorado 475,690 - - 475,690 Connecticut 431,597 - - 431,597 Delaware 147,559 - - 147,559 District of Columbia 134,625 - - 134,625 Florida 3,454,530 - - 3,454,530 Georgia 1,733,473 - - 1,733,473 Guam 46,713 - - 46,713 Hawaii 176,729 - - 176,729 Idaho 185,303 - - 185,303 Illinois 1,914,393 - - 1,914,393 Indiana 741,610 - - 741,610 Iowa 380,705 - - 380,705 Kansas 253,833 - - 253,833 Kentucky 666,264 - - 666,264 Louisiana 927,168 - - 927,168 Maine 189,245 - - 189,245 Maryland 744,343 - - 744,343 Massachusetts 779,192 - - 779,192 Michigan 1,473,614 - - 1,473,614 Minnesota 443,957 24,534 10,292 478,783 Mississippi 582,658 - - 582,658 Missouri 810,690 - - 810,690 Montana 116,626 - - 116,626 Nebraska 175,851 - - 175,851 Nevada 439,782 - - 439,782 New Hampshire 98,464 - - 98,464 New Jersey 879,987 - - 879,987 New Mexico 471,247 - - 471,247 New York 2,968,227 - - 2,968,227 North Carolina 1,568,387 - - 1,568,387 North Dakota 54,252 - - 54,252 Ohio 1,593,029 15,604 - 1,608,633 Oklahoma 612,869 - - 612,869 Oregon 700,593 34,271 - 734,864 Pennsylvania 1,863,836 - - 1,863,836 Rhode Island 171,055 - - 171,055 South Carolina 805,012 - - 805,012 South Dakota 95,983 - - 95,983 Tennessee 1,113,231 - - 1,113,231 Texas 3,768,472 - - 3,768,472 Utah 217,951 1,869 - 219,820 Vermont 63,853 15,863 - 79,715 Virginia 826,354 - - 826,354 Virgin Islands 27,760 - - 27,760 Washington 1,011,412 - - 1,011,412 West Virginia 357,531 - - 357,531 Wisconsin 728,077 - - 728,077 Wyoming 33,853 - - 33,853 U.S. 44,116,931 92,140 10,292 44,219,363
7
Page 10
TABLE 8: SNAP Participation By Benefit Type - Households (Monthly Averages) - FY 2016
STATEHouseholds Receiving
EBTHouseholds Receiving
CashHouseholds Receiving
Group HousingTotal Households
ParticipatingAlabama 399,728 - - 399,728 Alaska 34,648 - - 34,648 Arizona 427,061 - - 427,061 Arkansas 191,636 - - 191,636 California 2,093,562 - - 2,093,562 Colorado 225,334 - - 225,334 Connecticut 244,927 - - 244,927 Delaware 71,099 - - 71,099 District of Columbia 75,819 - - 75,819 Florida 1,870,739 - - 1,870,739 Georgia 800,670 - - 800,670 Guam 15,551 - - 15,551 Hawaii 89,095 - - 89,095 Idaho 79,531 - - 79,531 Illinois 996,092 - - 996,092 Indiana 328,688 - - 328,688 Iowa 178,874 - - 178,874 Kansas 114,392 - - 114,392 Kentucky 313,476 - - 313,476 Louisiana 422,090 - - 422,090 Maine 98,549 - - 98,549 Maryland 388,957 - - 388,957 Massachusetts 450,364 - - 450,364 Michigan 777,906 - - 777,906 Minnesota 201,437 19,499 10,292 231,228 Mississippi 269,082 - - 269,082 Missouri 378,373 - - 378,373 Montana 54,612 - - 54,612 Nebraska 78,482 - - 78,482 Nevada 222,253 - - 222,253 New Hampshire 48,037 - - 48,037 New Jersey 440,091 - - 440,091 New Mexico 216,877 - - 216,877 New York 1,635,764 - - 1,635,764 North Carolina 761,999 - - 761,999 North Dakota 25,262 - - 25,262 Ohio 779,109 14,815 - 793,923 Oklahoma 276,268 - - 276,268 Oregon 388,134 31,644 - 419,778 Pennsylvania 950,739 - - 950,739 Rhode Island 100,433 - - 100,433 South Carolina 378,328 - - 378,328 South Dakota 42,234 - - 42,234 Tennessee 547,850 - - 547,850 Texas 1,588,116 - - 1,588,116 Utah 84,468 1,776 - 86,244 Vermont 28,386 14,590 - 42,976 Virginia 387,633 - - 387,633 Virgin Islands 13,068 - - 13,068 Washington 546,931 - - 546,931 West Virginia 178,274 - - 178,274 Wisconsin 359,933 - - 359,933 Wyoming 14,367 - - 14,367 U.S. 21,685,322 82,323 10,292 21,777,938
8
Page 11
TABLE 9: SNAP Issuance By Benefit Type - FY 2016
STATE Issuance by EBT Issuance by CashIssuance by
Group HousingTotal Issuance
Alabama $1,254,835,320 $0 $0 $1,254,835,320Alaska $175,483,424 $0 $0 $175,483,424Arizona $1,402,230,493 $0 $0 $1,402,230,493Arkansas $577,775,082 $0 $0 $577,775,082California $7,237,700,086 $0 $0 $7,237,700,086Colorado $728,042,703 $0 $0 $728,042,703Connecticut $685,510,011 $0 $0 $685,510,011Delaware $220,683,314 $0 $0 $220,683,314District of Columbia $210,436,410 $0 $0 $210,436,410Florida $5,216,754,147 $0 $0 $5,216,754,147Georgia $2,663,017,763 $0 $0 $2,663,017,763Guam $106,333,972 $0 $0 $106,333,972Hawaii $484,225,008 $0 $0 $484,225,008Idaho $255,423,930 $0 $0 $255,423,930Illinois $3,040,976,772 $0 $0 $3,040,976,772Indiana $1,068,458,926 $0 $0 $1,068,458,926Iowa $507,597,206 $0 $0 $507,597,206Kansas $342,324,968 $0 $0 $342,324,968Kentucky $980,976,984 $0 $0 $980,976,984Louisiana $1,494,495,292 $0 $0 $1,494,495,292Maine $254,898,802 $0 $0 $254,898,802Maryland $1,079,151,904 $0 $0 $1,079,151,904Massachusetts $1,189,716,303 $0 $0 $1,189,716,303Michigan $2,167,714,845 $0 $0 $2,167,714,845Minnesota $564,473,599 $23,271,524 $14,818,516 $602,563,639Mississippi $814,420,697 $0 $0 $814,420,697Missouri $1,182,957,874 $0 $0 $1,182,957,874Montana $166,365,465 $0 $0 $166,365,465Nebraska $240,677,417 $0 $0 $240,677,417Nevada $629,519,652 $0 $0 $629,519,652New Hampshire $120,552,019 $0 $0 $120,552,019New Jersey $1,223,052,433 $0 $0 $1,223,052,433New Mexico $693,426,783 $0 $0 $693,426,783New York $4,922,406,430 $0 $0 $4,922,406,430North Carolina $2,248,946,897 $0 $0 $2,248,946,897North Dakota $78,700,888 $0 $0 $78,700,888Ohio $2,375,295,803 $20,737,116 $0 $2,396,032,919Oklahoma $885,643,482 $0 $0 $885,643,482Oregon $1,020,594,686 $52,387,499 $0 $1,072,982,185Pennsylvania $2,729,024,683 $0 $0 $2,729,024,683Rhode Island $271,959,596 $0 $0 $271,959,596South Carolina $1,222,104,228 $0 $0 $1,222,104,228South Dakota $144,590,242 $0 $0 $144,590,242Tennessee $1,672,282,240 $0 $0 $1,672,282,240Texas $5,308,544,560 $0 $0 $5,308,544,560Utah $299,891,392 $1,978,305 $0 $301,869,697Vermont $88,239,326 $28,230,749 $0 $116,470,075Virginia $1,169,412,644 $0 $0 $1,169,412,644Virgin Islands $56,766,573 $0 $0 $56,766,573Washington $1,452,893,518 $0 $0 $1,452,893,518West Virginia $499,059,458 $0 $0 $499,059,458Wisconsin $922,851,050 $0 $0 $922,851,050Wyoming $48,510,210 $0 $0 $48,510,210U.S. $66,397,927,510 $126,605,193 $14,818,516 $66,539,351,219
9
Page 12
II.
Administrative Costs
10
Page 13
NOTABLE TRENDS
ADMINISTRATIVE COSTS
State agency administrative costs are affected by a number of factors including participation levels, the number and salary level of State staff, inflation, the location of State agency offices, type of issuance system, worker training costs, degree of automation, level of fraud control activity, etc. The Food and Nutrition Service (FNS) pays approximately 50 percent of State agency administrative costs to operate the program. Total State agency admini- strative costs prior to Federal cost sharing were $7.83 billion, a 2.4 percent increase from $7.65 billion in FY 2015. In FY 2016, the Federal government reimbursed $3.82 billion in State agency administrative costs, a 1.2 percent increase from FY 2015. The Federal share of administrative cost per case (i.e., per household) per month increased by 4.70 percent to $14.63 in FY2016.
Total Federal spending on State agency certification costs increased by less than 1 percent to $2.51 billion in FY 2016. The Federal share of the certification costs per case (i.e., per household) per month increased by 3.69 percent to $9.60 i n F Y 2 0 1 6 .
11
Page 14
TABLE 10: State Agency SNAP Administrative Costs - FY 2016
STATEState Share of
Administrative CostsFederal Share of
Administrative CostsTotal
Administrative CostsAlabama $45,150,993 $47,617,699 $92,768,692Alaska $9,901,570 $10,034,318 $19,935,888Arizona $77,730,088 $64,232,975 $141,963,063Arkansas $31,944,579 $32,083,641 $64,028,220California $898,887,886 $822,573,216 $1,721,461,102Colorado $55,444,282 $54,419,909 $109,864,191Connecticut $57,496,016 $55,316,718 $112,812,734Delaware $14,516,603 $16,027,961 $30,544,564District of Columbia $23,295,589 $20,128,196 $43,423,785Florida $86,306,772 $83,205,956 $169,512,728Georgia $82,465,281 $83,783,881 $166,249,162Guam $1,429,812 $1,523,792 $2,953,604Hawaii $22,658,178 $18,070,043 $40,728,221Idaho $10,049,048 $8,955,588 $19,004,636Illinois $108,226,786 $98,470,965 $206,697,751Indiana $69,773,480 $69,448,018 $139,221,498Iowa $21,696,408 $20,017,999 $41,714,407Kansas $24,002,076 $21,190,722 $45,192,798Kentucky $60,247,044 $56,005,282 $116,252,326Louisiana $66,820,785 $68,661,366 $135,482,151Maine $12,441,883 $11,560,936 $24,002,819Maryland $70,363,919 $70,091,447 $140,455,366Massachusetts $60,820,648 $58,188,374 $119,009,022Michigan $136,783,348 $132,203,194 $268,986,542Minnesota $65,026,696 $63,260,400 $128,287,096Mississippi $27,879,991 $27,763,747 $55,643,738Missouri $35,572,147 $37,841,537 $73,413,684Montana $10,900,414 $11,204,460 $22,104,874Nebraska $15,176,840 $15,031,106 $30,207,946Nevada $25,873,958 $24,224,402 $50,098,360New Hampshire $9,559,024 $8,721,199 $18,280,223New Jersey $166,894,665 $152,901,179 $319,795,844New Mexico $31,957,715 $29,731,732 $61,689,447New York $454,175,288 $392,058,943 $846,234,231North Carolina $103,374,727 $104,403,154 $207,777,881North Dakota $9,445,607 $9,484,024 $18,929,631Ohio $104,939,864 $100,087,762 $205,027,626Oklahoma $37,645,194 $34,054,168 $71,699,362Oregon $84,620,615 $80,660,886 $165,281,501Pennsylvania $159,740,345 $163,212,718 $322,953,063Rhode Island $10,503,388 $10,466,375 $20,969,763South Carolina $34,435,028 $33,060,036 $67,495,064South Dakota $6,956,795 $8,670,186 $15,626,981Tennessee $69,594,279 $67,351,748 $136,946,027Texas $176,735,734 $194,965,584 $371,701,318Utah $16,125,410 $14,826,756 $30,952,166Vermont $10,486,884 $9,769,515 $20,256,399Virginia $104,973,743 $106,505,368 $211,479,111Virgin Islands $5,281,939 $5,646,696 $10,928,635Washington $91,309,913 $92,794,812 $184,104,725West Virginia $18,089,205 $18,583,229 $36,672,434Wisconsin $68,536,626 $77,422,967 $145,959,593Wyoming $6,081,778 $6,094,975 $12,176,753U.S. $4,010,346,886 $3,824,611,860 $7,834,958,746
12
Page 15
TABLE 11: State Agency SNAP Administrative Costs Per Case - FY 2016
STATEHouseholds Participating
(Monthly Average)Total
Administrative CostsTotal Admin. Costs
Per Case Per MonthAlabama 399,728 $92,768,692 $19.34Alaska 34,648 $19,935,888 $47.95Arizona 427,061 $141,963,063 $27.70Arkansas 191,636 $64,028,220 $27.84California 2,093,562 $1,721,461,102 $68.52Colorado 225,334 $109,864,191 $40.63Connecticut 244,927 $112,812,734 $38.38Delaware 71,099 $30,544,564 $35.80District of Columbia 75,819 $43,423,785 $47.73Florida 1,870,739 $169,512,728 $7.55Georgia 800,670 $166,249,162 $17.30Guam 15,551 $2,953,604 $15.83Hawaii 89,095 $40,728,221 $38.09Idaho 79,531 $19,004,636 $19.91Illinois 996,092 $206,697,751 $17.29Indiana 328,688 $139,221,498 $35.30Iowa 178,874 $41,714,407 $19.43Kansas 114,392 $45,192,798 $32.92Kentucky 313,476 $116,252,326 $30.90Louisiana 422,090 $135,482,151 $26.75Maine 98,549 $24,002,819 $20.30Maryland 388,957 $140,455,366 $30.09Massachusetts 450,364 $119,009,022 $22.02Michigan 777,906 $268,986,542 $28.82Minnesota 231,228 $128,287,096 $46.23Mississippi 269,082 $55,643,738 $17.23Missouri 378,373 $73,413,684 $16.17Montana 54,612 $22,104,874 $33.73Nebraska 78,482 $30,207,946 $32.08Nevada 222,253 $50,098,360 $18.78New Hampshire 48,037 $18,280,223 $31.71New Jersey 440,091 $319,795,844 $60.55New Mexico 216,877 $61,689,447 $23.70New York 1,635,764 $846,234,231 $43.11North Carolina 761,999 $207,777,881 $22.72North Dakota 25,262 $18,929,631 $62.44Ohio 793,923 $205,027,626 $21.52Oklahoma 276,268 $71,699,362 $21.63Oregon 419,778 $165,281,501 $32.81Pennsylvania 950,739 $322,953,063 $28.31Rhode Island 100,433 $20,969,763 $17.40South Carolina 378,328 $67,495,064 $14.87South Dakota 42,234 $15,626,981 $30.83Tennessee 547,850 $136,946,027 $20.83Texas 1,588,116 $371,701,318 $19.50Utah 86,244 $30,952,166 $29.91Vermont 42,976 $20,256,399 $39.28Virginia 387,633 $211,479,111 $45.46Virgin Islands 13,068 $10,928,635 $69.69Washington 546,931 $184,104,725 $28.05West Virginia 178,274 $36,672,434 $17.14Wisconsin 359,933 $145,959,593 $33.79Wyoming 14,367 $12,176,753 $70.63U.S. 21,777,938 $7,834,958,746 $29.98
13
Page 16
TABLE 12: Federal Share of State Agency SNAP Administrative Costs Per Case - FY 2016
STATEHouseholds Participating
(Monthly Average)Federal Share of
Total CostsFederal Admin. Costs
Per Case Per MonthAlabama 399,728 $47,617,699 $9.93Alaska 34,648 $10,034,318 $24.13Arizona 427,061 $64,232,975 $12.53Arkansas 191,636 $32,083,641 $13.95California 2,093,562 $822,573,216 $32.74Colorado 225,334 $54,419,909 $20.13Connecticut 244,927 $55,316,718 $18.82Delaware 71,099 $16,027,961 $18.79District of Columbia 75,819 $20,128,196 $22.12Florida 1,870,739 $83,205,956 $3.71Georgia 800,670 $83,783,881 $8.72Guam 15,551 $1,523,792 $8.17Hawaii 89,095 $18,070,043 $16.90Idaho 79,531 $8,955,588 $9.38Illinois 996,092 $98,470,965 $8.24Indiana 328,688 $69,448,018 $17.61Iowa 178,874 $20,017,999 $9.33Kansas 114,392 $21,190,722 $15.44Kentucky 313,476 $56,005,282 $14.89Louisiana 422,090 $68,661,366 $13.56Maine 98,549 $11,560,936 $9.78Maryland 388,957 $70,091,447 $15.02Massachusetts 450,364 $58,188,374 $10.77Michigan 777,906 $132,203,194 $14.16Minnesota 231,228 $63,260,400 $22.80Mississippi 269,082 $27,763,747 $8.60Missouri 378,373 $37,841,537 $8.33Montana 54,612 $11,204,460 $17.10Nebraska 78,482 $15,031,106 $15.96Nevada 222,253 $24,224,402 $9.08New Hampshire 48,037 $8,721,199 $15.13New Jersey 440,091 $152,901,179 $28.95New Mexico 216,877 $29,731,732 $11.42New York 1,635,764 $392,058,943 $19.97North Carolina 761,999 $104,403,154 $11.42North Dakota 25,262 $9,484,024 $31.29Ohio 793,923 $100,087,762 $10.51Oklahoma 276,268 $34,054,168 $10.27Oregon 419,778 $80,660,886 $16.01Pennsylvania 950,739 $163,212,718 $14.31Rhode Island 100,433 $10,466,375 $8.68South Carolina 378,328 $33,060,036 $7.28South Dakota 42,234 $8,670,186 $17.11Tennessee 547,850 $67,351,748 $10.24Texas 1,588,116 $194,965,584 $10.23Utah 86,244 $14,826,756 $14.33Vermont 42,976 $9,769,515 $18.94Virginia 387,633 $106,505,368 $22.90Virgin Islands 13,068 $5,646,696 $36.01Washington 546,931 $92,794,812 $14.14West Virginia 178,274 $18,583,229 $8.69Wisconsin 359,933 $77,422,967 $17.93Wyoming 14,367 $6,094,975 $35.35U.S. 21,777,938 $3,824,611,860 $14.63
14
Page 17
TABLE 13: Federal Share of Selected State Agency SNAP Administrative Costs - FY 2016
STATEFederal Share of
Certification CostsFederal Share of
Issuance CostsFederal Share of
Fraud Control CostsAlabama $34,946,996 $1,510,395 $912,712Alaska $8,706,750 $135,324 $500,969Arizona $41,906,016 $1,763,399 $1,854,619Arkansas $26,872,990 $963,068 $1,180,237California $517,463,474 $38,886,749 $35,301,552Colorado $34,515,724 $1,161,014 $3,232,487Connecticut $23,033,357 $770,896 $3,033,868Delaware $8,122,689 $398,899 $1,121,766District of Columbia $10,816,553 $395,830 $979,454Florida $49,819,079 $6,140,017 $2,462,394Georgia $56,415,537 $2,558,791 $4,053,299Guam $653,293 $62,013 $241,819Hawaii $12,924,959 $325,244 $980,456Idaho $4,810,873 $1,605,742 $259,920Illinois $69,578,973 $5,230,327 $1,423,991Indiana $52,235,148 $1,908,522 $702,122Iowa $15,348,550 $1,067,701 $635,677Kansas $14,634,645 $515,520 $89,874Kentucky $43,012,742 $1,788,542 $1,408,397Louisiana $63,936,466 $1,416,394 $90,567Maine $5,627,362 $807,288 $902,423Maryland $59,554,791 $2,116,924 $843,145Massachusetts $45,458,414 $1,532,049 $1,719,911Michigan $103,022,174 $1,209,697 $6,241,046Minnesota $39,079,959 $4,284,575 $1,793,729Mississippi $21,146,763 $1,608,327 $573,347Missouri $28,120,719 $1,499,037 $484,479Montana $6,414,156 $684,056 $29,132Nebraska $9,743,158 $448,758 $299,620Nevada $16,604,464 $1,205,209 $1,412,262New Hampshire $1,206,843 $171,185 $294,326New Jersey $104,744,320 $3,380,516 $14,716,578New Mexico $21,768,146 $683,685 $114,093New York $218,110,134 $5,111,102 $32,143,542North Carolina $83,262,828 $2,266,279 $6,484,253North Dakota $5,334,206 $332,863 $0Ohio $42,307,633 $2,917,725 $1,106,568Oklahoma $28,160,938 $1,368,821 $1,114,843Oregon $68,386,484 $3,339,601 $193,244Pennsylvania $129,487,596 $9,022,042 $4,766,444Rhode Island $2,887,376 $230,659 $133,108South Carolina $18,391,547 $1,422,323 $1,945,980South Dakota $5,018,270 $368,996 $177,127Tennessee $56,016,998 $1,388,823 $1,589,201Texas $115,424,201 $6,522,863 $5,471,138Utah $10,371,417 $574,005 $1,219,216Vermont $3,574,163 $108,673 $314,282Virginia $73,686,086 $4,118,376 $3,793,226Virgin Islands $3,298,971 $636,288 $120,642Washington $51,333,240 $4,594,020 $1,464,842West Virginia $11,672,450 $919,705 $364,453Wisconsin $28,772,413 $2,076,312 $2,024,575Wyoming $1,794,603 $55,484 $342,646U.S. $2,509,537,637 $135,610,653 $154,659,601
15
Page 18
TABLE 14: Federal Share of Selected State Agency SNAP Administrative Costs - FY 2016
STATEFederal Share of
ADP Development CostsFederal Share of
ADP Operations CostsAlabama $2,221,760 $608,107Alaska $0 $0Arizona $1,733,596 $4,815,871Arkansas $67,772 $858,069California $152,293 $39,506,550Colorado $0 $6,572,363Connecticut $3,323,942 $3,626,916Delaware $3,263,088 $1,119,923District of Columbia $2,808,102 $710,409Florida $0 $3,917,848Georgia $0 $14,459,684Guam $0 $16,848Hawaii $0 $2,300,172Idaho $0 $1,208,861Illinois $134,677 $316,303Indiana $2,745,788 $3,882,591Iowa $1,323 $1,394,134Kansas $1,422,777 $1,434,330Kentucky $0 $6,045,111Louisiana $564,548 $0Maine $0 $2,053,804Maryland $0 $3,251,931Massachusetts $0 $331,819Michigan $0 $13,196,821Minnesota $0 $5,079,126Mississippi $0 $1,903,233Missouri $105,439 $4,000,000Montana $0 $575,191Nebraska $286,405 $2,984,954Nevada $23,442 $2,393,861New Hampshire $581,647 $1,860,164New Jersey $879,892 $9,821,060New Mexico $0 $5,738,610New York $450,051 $8,284,687North Carolina $1,744,443 $4,964,661North Dakota $2,179,511 $406,850Ohio $0 $12,867,262Oklahoma $15,322 $2,455,533Oregon $162,415 $3,190,751Pennsylvania $1,175,808 $9,529,845Rhode Island $626,864 $878,303South Carolina $0 $2,577,379South Dakota $0 $467,517Tennessee $0 $4,549,576Texas $0 $39,724,407Utah $0 $1,302,475Vermont $0 $332,216Virginia $4,421,430 $14,958,164Virgin Islands $0 $610,198Washington $0 $8,232,465West Virginia $0 $4,198,063Wisconsin $0 $9,585,517Wyoming $192,153 $540,342U.S. $31,284,488 $275,640,875
16
Page 19
TABLE 15: Federal Share of SNAP Certification Costs Per Case - FY 2016
STATEHouseholds Participating
(Monthly Average)Federal Share of
Certification CostsFederal Costs Per Case
Per Month for CertificationAlabama 399,728 $34,946,996 $7.29Alaska 34,648 $8,706,750 $20.94Arizona 427,061 $41,906,016 $8.18Arkansas 191,636 $26,872,990 $11.69California 2,093,562 $517,463,474 $20.60Colorado 225,334 $34,515,724 $12.76Connecticut 244,927 $23,033,357 $7.84Delaware 71,099 $8,122,689 $9.52District of Columbia 75,819 $10,816,553 $11.89Florida 1,870,739 $49,819,079 $2.22Georgia 800,670 $56,415,537 $5.87Guam 15,551 $653,293 $3.50Hawaii 89,095 $12,924,959 $12.09Idaho 79,531 $4,810,873 $5.04Illinois 996,092 $69,578,973 $5.82Indiana 328,688 $52,235,148 $13.24Iowa 178,874 $15,348,550 $7.15Kansas 114,392 $14,634,645 $10.66Kentucky 313,476 $43,012,742 $11.43Louisiana 422,090 $63,936,466 $12.62Maine 98,549 $5,627,362 $4.76Maryland 388,957 $59,554,791 $12.76Massachusetts 450,364 $45,458,414 $8.41Michigan 777,906 $103,022,174 $11.04Minnesota 231,228 $39,079,959 $14.08Mississippi 269,082 $21,146,763 $6.55Missouri 378,373 $28,120,719 $6.19Montana 54,612 $6,414,156 $9.79Nebraska 78,482 $9,743,158 $10.35Nevada 222,253 $16,604,464 $6.23New Hampshire 48,037 $1,206,843 $2.09New Jersey 440,091 $104,744,320 $19.83New Mexico 216,877 $21,768,146 $8.36New York 1,635,764 $218,110,134 $11.11North Carolina 761,999 $83,262,828 $9.11North Dakota 25,262 $5,334,206 $17.60Ohio 793,923 $42,307,633 $4.44Oklahoma 276,268 $28,160,938 $8.49Oregon 419,778 $68,386,484 $13.58Pennsylvania 950,739 $129,487,596 $11.35Rhode Island 100,433 $2,887,376 $2.40South Carolina 378,328 $18,391,547 $4.05South Dakota 42,234 $5,018,270 $9.90Tennessee 547,850 $56,016,998 $8.52Texas 1,588,116 $115,424,201 $6.06Utah 86,244 $10,371,417 $10.02Vermont 42,976 $3,574,163 $6.93Virginia 387,633 $73,686,086 $15.84Virgin Islands 13,068 $3,298,971 $21.04Washington 546,931 $51,333,240 $7.82West Virginia 178,274 $11,672,450 $5.46Wisconsin 359,933 $28,772,413 $6.66Wyoming 14,367 $1,794,603 $10.41U.S. 21,777,938 $2,509,537,637 $9.60
17
Page 20
III.
Fair Hearings
18
Page 21
NOTABLE TRENDS
FAIR HEARINGS
SNAP regulations provide recourse to households that are denied benefits or have their allotment reduced, suspended or cancelled as a result of an adverse decision by the State agency. This recourse is called the fair hearing process. The number of fair hearings conducted by States is reported annually on Form FNS- 366B, the Program Activity Statement.
In FY 2016, the number of fair hearings increased by 63.54 percent to 111,555. The State’s decision was upheld in 3 6. 8 4percent of fair hearings, compared to 53.7 percent in FY 2015.
19
Page 22
TABLE 16: SNAP Fair Hearings Upheld and Reversed - FY 2016
STATEState Decisions
UpheldState Decisions
ReversedPercentUpheld
Alabama 185 25 88.10%Alaska 35 2 94.59%Arizona 550 930 37.16%Arkansas 424 24 94.64%California 2,351 2,798 45.66%Colorado 205 5 97.62%Connecticut 355 62 85.13%Delaware 90 40 69.23%District of Columbia 26 16 61.90%Florida 319 106 75.06%Georgia 72 67 51.80%Guam 1 2 33.33%Hawaii 45 23 66.18%Idaho 115 0 100.00%Illinois 237 58 80.34%Indiana 1,539 609 71.65%Iowa 241 29 89.26%Kansas 88 9 90.72%Kentucky 117 64 64.64%Louisiana 485 6 98.78%Maine 11 1 91.67%Maryland 155 58 72.77%Massachusetts 2,241 1,066 67.77%Michigan 854 632 57.47%Minnesota 346 61 85.01%Mississippi 221 15 93.64%Missouri 475 121 79.70%Montana 31 4 88.57%Nebraska 607 90 87.09%Nevada 64 4 94.12%New Hampshire 30 6 83.33%New Jersey 160 47 77.29%New Mexico 95 17 84.82%New York 5,387 32,492 14.22%North Carolina 479 123 79.57%North Dakota 10 0 100.00%Ohio 5,314 3,550 59.95%Oklahoma 40 19 67.80%Oregon 86 9 90.53%Pennsylvania 13,723 26,288 34.30%Rhode Island 20 5 80.00%South Carolina 436 107 80.29%South Dakota 18 0 100.00%Tennessee 1,359 423 76.26%Texas 311 260 54.47%Utah 31 3 91.18%Vermont 14 1 93.33%Virginia 482 59 89.09%Virgin Islands 9 1 90.00%Washington 27 0 100.00%West Virginia 115 8 93.50%Wisconsin 459 111 80.53%Wyoming 9 0 100.00%U.S. 41,099 70,456 36.84%
20
Page 23
IV.
Fraud Investigations, Prosecutions, and
Administrative Disqualification
Hearings
21
Page 24
NOTABLE TRENDS
FRAUD CONTROL
In FY 2016, State agencies completed 963,965 fraud investigations, a 33.31 percent increase from 723,111 investigations in FY 2015.
Fraud investigations are broken into two categories: pre-certification investigations and post-certification investigations. Pre- certification investigations are cases referred for investigation and completed prior to certification. Investigators assist in front-end detection by acting on referrals in suspicious cases and probing more deeply into a client's circumstances. Positive pre-certification investigations prevent fraud at intake and before a dollar loss can occur. They may also result in administrative hearings or prosecutions that lead to disqualification but no claim will be established.
Post- certification investigations are investigations completed after certification. Positive post-certification investigations may result in an administrative disqualification hearing or prosecution, the disqualification of the individual who has committed an intentional program violation, and the establishment of a claim to recover the over-issuance or amount trafficked.
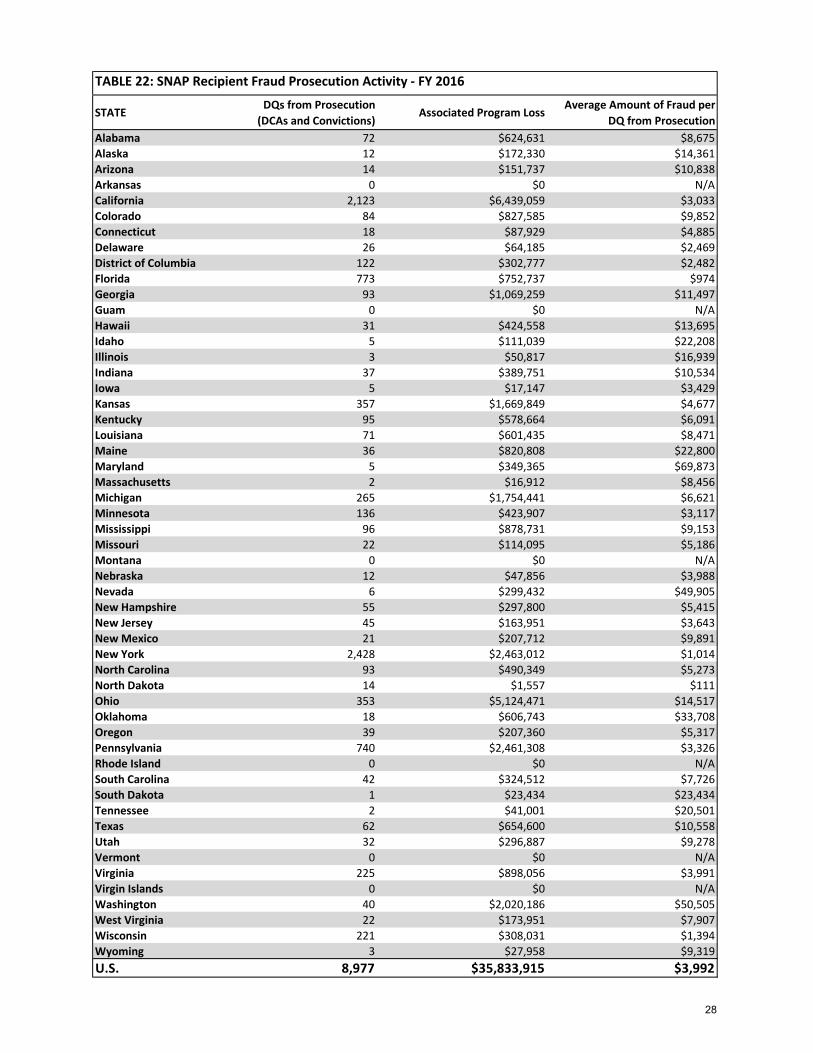
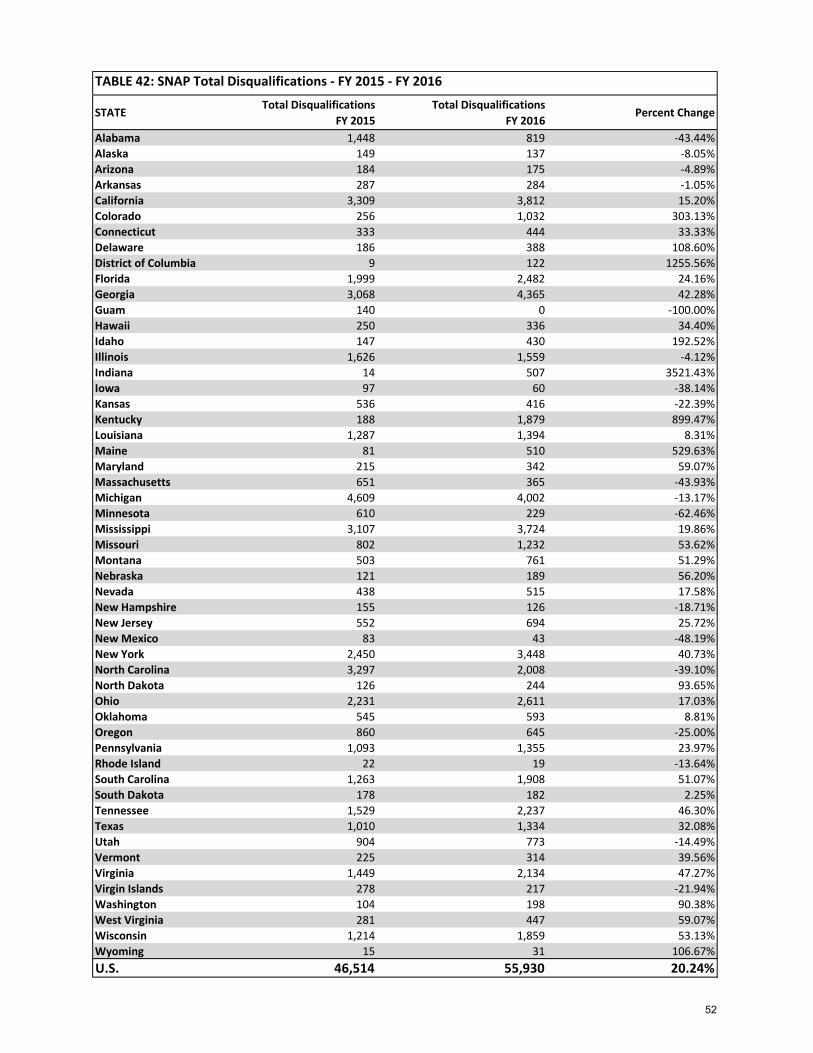
Between FY 2015 and FY 2016, prosecution activity increased 13.76% to 9,087 cases. Administrative disqualification hearing activity increased 22.56% to 49,306 cases. In FY 2016, 55,930 recipients were disqualified from SNAP for intentional program violations, a 20.24 percent increase from the FY 2015 level.
22
Page 25
TABLE 17: SNAP Recipient Fraud Investigations - FY 2016
STATENegative
Pre-CertificationInvestigations
PositivePre-Certification
Investigations
NegativePost-Certification
Investigations
PositivePost-Certification
Investigations
TotalInvestigations
CompletedAlabama 0 0 487 504 991Alaska 327 1,591 489 108 2,515Arizona 140 368 1,326 4,405 6,239Arkansas 520 301 01 01 821California 94,372 11,818 45,044 5,624 156,858Colorado 14 64 70 866 1,014Connecticut 615 880 2,186 553 4,234Delaware 356 3 16,554 292 17,205District of Columbia 9 8 950 126 1,093Florida 1,402 8,570 2,037 31,281 43,290Georgia 0 0 9,487 4,363 13,850Guam 0 0 79 188 267Hawaii 0 0 864 113 977Idaho 0 0 2,158 429 2,587Illinois 0 0 723 309 1,032Indiana 113 13 3,278 702 4,106Iowa 938 1,630 1,019 2,057 5,644Kansas 98 166 1,398 1,032 2,694Kentucky 62 99 99 408 668Louisiana 0 0 183 1,452 1,635Maine 0 0 244 265 509Maryland 1 2 91 200 294Massachusetts 0 0 4,224 3,218 7,442Michigan 11,906 19,344 3,796 5,670 40,716Minnesota 3,066 2,837 1,580 369 7,852Mississippi 0 0 130 3,311 3,441Missouri 0 0 3,399 1,974 5,373Montana 0 0 733 429 1,162Nebraska 1 0 765 201 967Nevada 188 1 6,374 918 7,481New Hampshire 149 230 722 135 1,236New Jersey 1,306 1,033 12,682 10,240 25,261New Mexico 0 0 13 27 40New York 99,296 296,989 41,944 12,747 450,976North Carolina 148 144 2,828 1,763 4,883North Dakota 13 43 95 199 350Ohio 970 119 17,003 2,605 20,697Oklahoma 0 0 717 692 1,409Oregon 0 0 3,212 468 3,680Pennsylvania 13,934 8,612 3,745 1,645 27,936Rhode Island 147 79 122 19 367South Carolina 0 0 3,641 1,795 5,436South Dakota 11 59 110 164 344Tennessee 0 0 4,471 2,951 7,422Texas 0 0 839 762 1,601Utah 118 29 1,655 487 2,289Vermont 26 29 130 353 538Virginia 240 453 12,805 2,474 15,972Virgin Islands 494 104 8 55 661Washington 138 145 534 196 1,013West Virginia 140 3 7,445 29,971 37,559Wisconsin 828 2,049 2,129 5,855 10,861Wyoming 0 0 423 54 477U.S. 232,086 357,815 227,040 147,024 963,965
1 At the time of publication, the State is reviewing the accuracy of this figure. It may be updated in future versions.
23
Page 26
TABLE 18: SNAP Recipient Fraud Investigation Program Dollars - FY 2016
STATEFraud Dollars Determined
by Pre-Certification InvestigationsFraud Dollars Determined
by Post-Certification InvestigationsAlabama $0 $1,992,532Alaska $488,322 $251,570Arizona $431,076 $3,263,147Arkansas $340 $01
California $3,462,674 $17,057,592Colorado $1,524 $9,996,090Connecticut $116,752 $1,121,162Delaware $5,104 $841,964District of Columbia $3,764 $310,415Florida $15,356,011 $28,758,885Georgia $0 $15,201,010Guam $0 $136,087Hawaii $0 $965,711Idaho $0 $809,804Illinois $0 $7,125,562Indiana $92,912 $3,381,081Iowa $3,489,159 $4,245,396Kansas $90,468 $2,105,508Kentucky $37,691 $2,345,346Louisiana $0 $4,148,979Maine $0 $341,943Maryland $111 $393,633Massachusetts $0 $4,461,314Michigan $4,584,745 $15,446,571Minnesota $858,578 $2,463,389Mississippi $0 $6,183,080Missouri $0 $2,506,941Montana $0 $1,296,770Nebraska $0 $425,000Nevada $194 $2,362,989New Hampshire $91,296 $518,301New Jersey $498,722 $8,648,728New Mexico $0 $345,334New York $340,762,788 $13,181,779North Carolina $44,147 $4,014,250North Dakota $12,762 $23,880Ohio $47,058 $5,111,992Oklahoma $0 $1,616,983Oregon $0 $426,240Pennsylvania $4,391,305 $4,035,087Rhode Island $15,800 $31,039South Carolina $0 $2,490,127South Dakota $16,641 $109,748Tennessee $0 $10,929,958Texas $0 $7,106,457Utah $27,397 $1,172,083Vermont $6,612 $420,140Virginia $80,905 $4,155,479Virgin Islands $69,070 $67,838Washington $01 $1,111,335West Virginia $1,492 $839,880Wisconsin $929,303 $10,161,266Wyoming $0 $243,208U.S. $376,014,723 $216,700,603
1 At the time of publication, the State is reviewing the accuracy of this figure. It may be updated in future versions.
24
Page 27
TABLE 19: SNAP Administrative Disqualification Hearings (ADHs) - FY 2016
STATE ADH Waivers ADH Convictions ADH AcquittalsTotal Disqualifications
from ADHsAlabama 231 516 30 747Alaska 96 29 4 125Arizona 6 155 38 161Arkansas 69 215 1 284California 1,309 380 61 1,689Colorado 486 462 24 948Connecticut 371 55 6 426Delaware 162 200 8 362District of Columbia 0 0 0 0Florida 1,244 465 99 1,709Georgia 2,135 2,137 21 4,272Guam 01 01 01 01
Hawaii 266 39 2 305Idaho 335 90 9 425Illinois 658 898 29 1,556Indiana 48 422 30 470Iowa 0 55 3 55Kansas 10 49 4 59Kentucky 118 1,666 736 1,784Louisiana 1,066 257 9 1,323Maine 323 151 36 474Maryland 156 181 7 337Massachusetts 48 315 80 363Michigan 2,443 1,294 325 3,737Minnesota 0 93 32 93Mississippi 422 3,206 51 3,628Missouri 738 472 68 1,210Montana 408 353 39 761Nebraska 156 21 4 177Nevada 485 24 3 509New Hampshire 62 9 1 71New Jersey 579 70 0 649New Mexico 15 7 1 22New York 276 744 0 1,020North Carolina 221 1,694 0 1,915North Dakota 186 44 3 230Ohio 1,842 416 109 2,258Oklahoma 457 118 8 575Oregon 604 2 1 606Pennsylvania 400 215 3 615Rhode Island 11 8 2 19South Carolina 958 908 90 1,866South Dakota 93 88 4 181Tennessee 1,176 1,059 44 2,235Texas 1,033 239 50 1,272Utah 101 640 137 741Vermont 298 16 0 314Virginia 1,265 644 70 1,909Virgin Islands 23 194 21 217Washington 103 55 8 158West Virginia 308 117 7 425Wisconsin 564 1,074 35 1,638Wyoming 17 11 0 28U.S. 24,381 22,572 2,353 46,953
1 At the time of publication, the State is reviewing the accuracy of this figure. It may be updated in future versions.
25
Page 28
TABLE 20: SNAP Administrative Disqualification Hearings (ADHs) - FY 2016
STATEDisqualifications from ADH(Waivers and Convictions)
Associated Program LossAverage Amount of Fraud per
Disqualification from ADHAlabama 747 $1,282,719 $1,717Alaska 125 $79,240 $634Arizona 161 $299,777 $1,862Arkansas 284 $01 $01
California 1,689 $1,476,021 $874Colorado 948 $2,604,570 $2,747Connecticut 426 $602,432 $1,414Delaware 362 $1,105,934 $3,055District of Columbia 0 $0 N/AFlorida 1,709 $5,864,464 $3,432Georgia 4,272 $8,409,357 $1,968Guam 01 $136,087 N/AHawaii 305 $1,154,300 $3,785Idaho 425 $281,250 $662Illinois 1,556 $7,293,726 $4,687Indiana 470 $437,843 $932Iowa 55 $139,230 $2,531Kansas 59 $30,264 $513Kentucky 1,784 $228,809 $128Louisiana 1,323 $2,869,898 $2,169Maine 474 $1,113,615 $2,349Maryland 337 $897,132 $2,662Massachusetts 363 $5,273,061 $14,526Michigan 3,737 $9,569,103 $2,561Minnesota 93 $65,111 $700Mississippi 3,628 $5,304,349 $1,462Missouri 1,210 $1,197,581 $990Montana 761 $1,507,872 $1,981Nebraska 177 $377,144 $2,131Nevada 509 $961,618 $1,889New Hampshire 71 $111,346 $1,568New Jersey 649 $1,669,035 $2,572New Mexico 22 $280,336 $12,743New York 1,020 $1,348,092 $1,322North Carolina 1,915 $3,674,418 $1,919North Dakota 230 $24,389 $106Ohio 2,258 $878,181 $389Oklahoma 575 $1,058,909 $1,842Oregon 606 $1,022,160 $1,687Pennsylvania 615 $1,212,061 $1,971Rhode Island 19 $27,434 $1,444South Carolina 1,866 $2,216,126 $1,188South Dakota 181 $269,074 $1,487Tennessee 2,235 $9,812,990 $4,391Texas 1,272 $8,955,220 $7,040Utah 741 $1,089,376 $1,470Vermont 314 $487,366 $1,552Virginia 1,909 $2,670,749 $1,399Virgin Islands 217 $67,838 $313Washington 158 $340,048 $2,152West Virginia 425 $1,135,755 $2,672Wisconsin 1,638 $1,633,831 $997Wyoming 28 $94,086 $3,360U.S. 46,953 $100,641,327 $2,143
1 At the time of publication, the State is reviewing the accuracy of this figure. It may be updated in future versions.
26
Page 29
TABLE 21: SNAP Recipient Fraud Prosecution Activity - FY 2016
STATEDisqualification
Consent AgreementsProsecutionConvictions
ProsecutionAcquittals
Total Disqualificationsfrom Prosecutions
Alabama 11 61 1 72Alaska 5 7 0 12Arizona 0 14 0 14Arkansas 0 0 0 0California 496 1,627 1 2,123Colorado 4 80 8 84Connecticut 0 18 1 18Delaware 26 0 0 26District of Columbia 118 4 0 122Florida 663 110 2 773Georgia 85 8 0 93Guam 0 0 0 0Hawaii 17 14 0 31Idaho 0 5 0 5Illinois 0 3 0 3Indiana 0 37 0 37Iowa 0 5 0 5Kansas 7 350 0 357Kentucky 1 94 0 95Louisiana 28 43 0 71Maine 0 36 0 36Maryland 0 5 0 5Massachusetts 0 2 0 2Michigan 96 169 0 265Minnesota 65 71 3 136Mississippi 36 60 8 96Missouri 1 21 6 22Montana 0 0 0 0Nebraska 0 12 0 12Nevada 0 6 6 6New Hampshire 0 55 0 55New Jersey 36 9 1 45New Mexico 0 21 1 21New York 1,439 989 18 2,428North Carolina 8 85 1 93North Dakota 6 8 0 14Ohio 154 199 3 353Oklahoma 6 12 2 18Oregon 6 33 0 39Pennsylvania 486 254 0 740Rhode Island 0 0 0 0South Carolina 7 35 14 42South Dakota 0 1 0 1Tennessee 0 2 0 2Texas 15 47 6 62Utah 0 32 0 32Vermont 0 0 0 0Virginia 0 225 28 225Virgin Islands 0 0 0 0Washington 5 35 0 40West Virginia 5 17 0 22Wisconsin 50 171 0 221Wyoming 0 3 0 3U.S. 3,882 5,095 110 8,977
27
Page 30
TABLE 22: SNAP Recipient Fraud Prosecution Activity - FY 2016
STATEDQs from Prosecution
(DCAs and Convictions)Associated Program Loss
Average Amount of Fraud perDQ from Prosecution
Alabama 72 $624,631 $8,675Alaska 12 $172,330 $14,361Arizona 14 $151,737 $10,838Arkansas 0 $0 N/ACalifornia 2,123 $6,439,059 $3,033Colorado 84 $827,585 $9,852Connecticut 18 $87,929 $4,885Delaware 26 $64,185 $2,469District of Columbia 122 $302,777 $2,482Florida 773 $752,737 $974Georgia 93 $1,069,259 $11,497Guam 0 $0 N/AHawaii 31 $424,558 $13,695Idaho 5 $111,039 $22,208Illinois 3 $50,817 $16,939Indiana 37 $389,751 $10,534Iowa 5 $17,147 $3,429Kansas 357 $1,669,849 $4,677Kentucky 95 $578,664 $6,091Louisiana 71 $601,435 $8,471Maine 36 $820,808 $22,800Maryland 5 $349,365 $69,873Massachusetts 2 $16,912 $8,456Michigan 265 $1,754,441 $6,621Minnesota 136 $423,907 $3,117Mississippi 96 $878,731 $9,153Missouri 22 $114,095 $5,186Montana 0 $0 N/ANebraska 12 $47,856 $3,988Nevada 6 $299,432 $49,905New Hampshire 55 $297,800 $5,415New Jersey 45 $163,951 $3,643New Mexico 21 $207,712 $9,891New York 2,428 $2,463,012 $1,014North Carolina 93 $490,349 $5,273North Dakota 14 $1,557 $111Ohio 353 $5,124,471 $14,517Oklahoma 18 $606,743 $33,708Oregon 39 $207,360 $5,317Pennsylvania 740 $2,461,308 $3,326Rhode Island 0 $0 N/ASouth Carolina 42 $324,512 $7,726South Dakota 1 $23,434 $23,434Tennessee 2 $41,001 $20,501Texas 62 $654,600 $10,558Utah 32 $296,887 $9,278Vermont 0 $0 N/AVirginia 225 $898,056 $3,991Virgin Islands 0 $0 N/AWashington 40 $2,020,186 $50,505West Virginia 22 $173,951 $7,907Wisconsin 221 $308,031 $1,394Wyoming 3 $27,958 $9,319U.S. 8,977 $35,833,915 $3,992
28
Page 31
TABLE 23: SNAP Disqualification Determinations - FY 2016
STATEDisqualifications from
ProsecutionDisqualifications
from ADHTotal Disqualifications
Alabama 72 747 819Alaska 12 125 137Arizona 14 161 175Arkansas 0 284 284California 2,123 1,689 3,812Colorado 84 948 1,032Connecticut 18 426 444Delaware 26 362 388District of Columbia 122 0 122Florida 773 1,709 2,482Georgia 93 4,272 4,365Guam 0 0 0Hawaii 31 305 336Idaho 5 425 430Illinois 3 1,556 1,559Indiana 37 470 507Iowa 5 55 60Kansas 357 59 416Kentucky 95 1,784 1,879Louisiana 71 1,323 1,394Maine 36 474 510Maryland 5 337 342Massachusetts 2 363 365Michigan 265 3,737 4,002Minnesota 136 93 229Mississippi 96 3,628 3,724Missouri 22 1,210 1,232Montana 0 761 761Nebraska 12 177 189Nevada 6 509 515New Hampshire 55 71 126New Jersey 45 649 694New Mexico 21 22 43New York 2,428 1,020 3,448North Carolina 93 1,915 2,008North Dakota 14 230 244Ohio 353 2,258 2,611Oklahoma 18 575 593Oregon 39 606 645Pennsylvania 740 615 1,355Rhode Island 0 19 19South Carolina 42 1,866 1,908South Dakota 1 181 182Tennessee 2 2,235 2,237Texas 62 1,272 1,334Utah 32 741 773Vermont 0 314 314Virginia 225 1,909 2,134Virgin Islands 0 217 217Washington 40 158 198West Virginia 22 425 447Wisconsin 221 1,638 1,859Wyoming 3 28 31U.S. 8,977 46,953 55,930
29
Page 32
V.
Recipient Claims
30
Page 33
NOTABLE TRENDS
RECIPIENT CLAIM COLLECTIONS
Recipient claims are established against households that receive more SNAP benefits than they are entitled to receive or households that have trafficked benefits (exchanged for cash). Claims fall into three categories: intentional program violation (eligibility fraud and trafficking), inadvertent household error, or agency error. State agencies are entitled to retain 35 percent of the amount they collect on fraud claims and certain inadvertent household error claims; and retain 20 percent of the amount they collect on the remaining inadvertent household error claims.
In FY 2016, State agencies established nearly $684.2 million in new claims against households and collected over $402 million. The average claim established was $774. Collections increased 9.69 percent from FY 2015. Collections via recoupment, whereby the State agency reduces a portion of the households benefit allotment to pay an outstanding claim, increased 8.2 percent to $155.3 million.
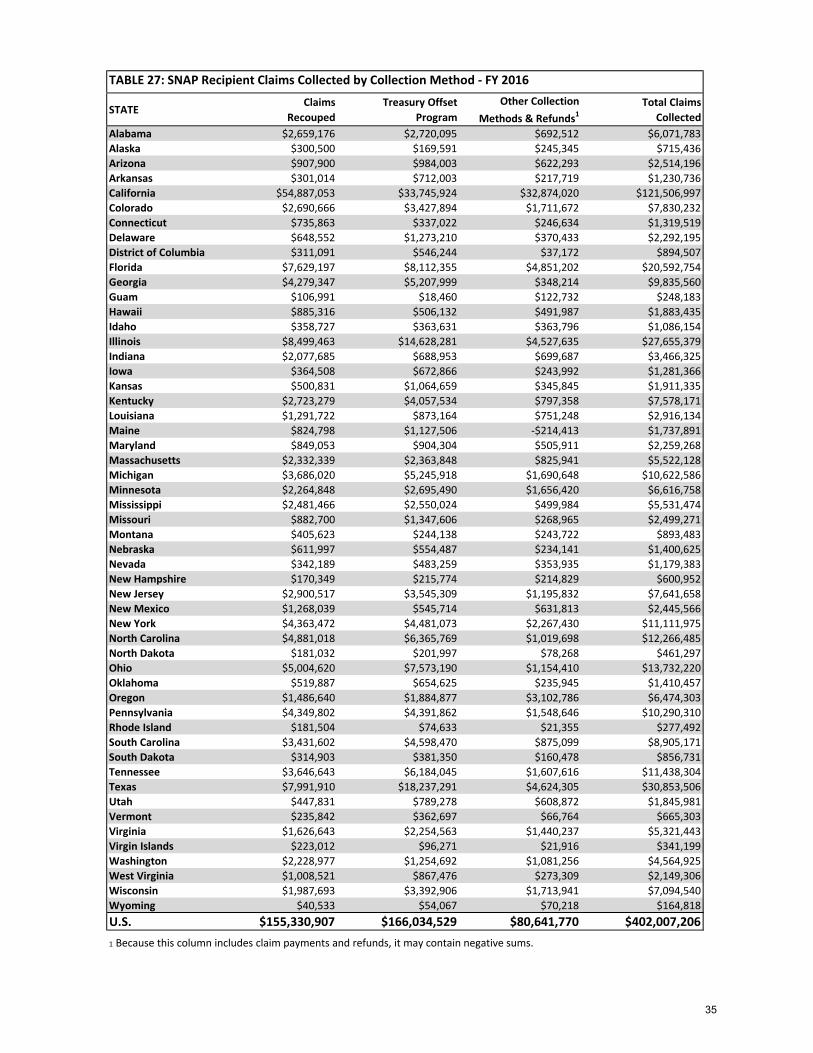
During FY 2016, the Federal Government, through the Treasury Offset Program (TOP), collected $166.0 million, or 41.3 percent of the total claims collected. As participating partners in this program, State agencies notify the household and then send the delinquent claims through FNS to the US Department of Treasury for possible collection.
This Federal program offsets amounts from any eligible Federal payment otherwise due a household and uses those funds to pay outstanding claims. The collections are made by Treasury on behalf of SNAP. In FY 2016, all State agencies participated in TOP.
31
Page 34
TABLE 24: Newly Established SNAP Recipient Claim Dollars - FY 2016
STATEFraud
Claims EstablishedHousehold Error
Claims EstablishedAgency Error
Claims EstablishedTotal ClaimsEstablished
Alabama $234,459 $6,491,795 $1,824,225 $8,550,479Alaska $207,269 $189,630 $465,765 $862,664Arizona $115,197 $2,165,771 $1,552,077 $3,833,045Arkansas $733,329 $1,067,262 $117,737 $1,918,328California $723,500 $126,239,595 $120,562,705 $247,525,800Colorado $1,102,849 $5,152,197 $2,865,348 $9,120,394Connecticut $364,627 $1,013,191 $1,167,969 $2,545,786Delaware $965,689 $2,332,875 $243,666 $3,542,230District of Columbia $0 $1,384,856 $58,637 $1,443,493Florida $0 $34,184,905 $2,902,416 $37,087,321Georgia $8,720,928 $2,749,339 $2,952,118 $14,422,386Guam $0 $143,047 $72,024 $215,071Hawaii $1,130,247 $1,739,345 $527,901 $3,397,493Idaho $307,555 $373,594 $333,711 $1,014,860Illinois $56,578 $46,279,503 $2,801,311 $49,137,392Indiana $1,359,985 $12,118,336 $4,463,624 $17,941,944Iowa $108,198 $2,397,534 $69,432 $2,575,164Kansas $101,764 $2,256,721 $289,226 $2,647,710Kentucky $1,071,093 $7,044,989 $3,750,238 $11,866,320Louisiana $2,027,567 $1,502,706 $318,572 $3,848,845Maine $1,010,173 $726,156 $1,798,384 $3,534,713Maryland $200,892 $2,471,269 $821,001 $3,493,163Massachusetts $3,489,644 $6,196,053 $635,354 $10,321,051Michigan $11,449,576 $5,404,166 $2,067,168 $18,920,911Minnesota $317,976 $5,647,944 $1,277,488 $7,243,408Mississippi $3,571,727 $6,135,765 $453,863 $10,161,356Missouri $199,208 $2,339,619 $476,199 $3,015,025Montana $1,041,953 $647,459 $544,282 $2,233,694Nebraska $0 $1,343,866 $681,256 $2,025,122Nevada $351,455 $2,205,638 $136,559 $2,693,652New Hampshire $424,109 $199,972 $100,549 $724,630New Jersey $381,401 $9,004,927 $913,076 $10,299,404New Mexico $124,715 $1,525,913 $2,205,706 $3,856,334New York $4,124,488 $7,273,240 $4,545,651 $15,943,380North Carolina $7,484,221 $6,810,259 $5,844,112 $20,138,593North Dakota $24,072 $379,896 $273,408 $677,376Ohio $4,826,471 $11,339,692 $3,478,153 $19,644,316Oklahoma $833,143 $838,002 $378,037 $2,049,183Oregon $1,634,121 $3,905,383 $96,759 $5,636,263Pennsylvania $0 $14,700,169 $1,320,837 $16,021,006Rhode Island $28,897 $378,784 $153,422 $561,103South Carolina $64,236 $12,348,656 $1,788,502 $14,201,394South Dakota $103,990 $788,435 $122,601 $1,015,025Tennessee $922,498 $10,824,943 $686,495 $12,433,936Texas $7,002,811 $27,503,421 $5,802,014 $40,308,245Utah $146,590 $2,708,840 $575,941 $3,431,371Vermont $462,195 $224,623 $100,905 $787,723Virginia $1,260,726 $4,097,964 $890,735 $6,249,425Virgin Islands $468,714 $61,831 $39,156 $569,701Washington $287,699 $6,207,753 $2,206,978 $8,702,430West Virginia $1,071,947 $1,817,194 $296,880 $3,186,021Wisconsin $761,972 $8,768,894 $739,655 $10,270,520Wyoming $1,304 $280,372 $70,017 $351,693U.S. $73,403,758 $421,934,288 $188,859,846 $684,197,891
• Some states establish all non-agency error claims as household error claims initially and then transfer the claim from household error to fraud after the prosecution or ADH. Therefore, the sum of the fraud associated with disqualifications is a better measure of the ultimate amount of fraud claims than the newly established amount.
32
Page 35
TABLE 25: Newly Established SNAP Recipient Claims - FY 2016
STATEFraud
Claims EstablishedHousehold Error
Claims EstablishedAgency Error
Claims EstablishedTotal ClaimsEstablished
Alabama 107 3,321 1,851 5,279Alaska 71 248 847 1,166Arizona 27 2,100 1,955 4,082Arkansas 320 443 197 960California 403 195,031 365,058 560,492Colorado 281 2,564 6,388 9,233Connecticut 268 800 2,996 4,064Delaware 307 1,468 129 1,904District of Columbia 0 674 39 713Florida 0 13,734 3,063 16,797Georgia 3,851 1,507 5,679 11,037Guam 0 214 73 287Hawaii 180 1,195 658 2,033Idaho 256 604 809 1,669Illinois 182 35,987 3,525 39,694Indiana 563 8,665 4,225 13,453Iowa 18 955 180 1,153Kansas 60 1,391 1,239 2,690Kentucky 860 9,433 8,414 18,707Louisiana 796 629 1,203 2,628Maine 467 773 2,222 3,462Maryland 83 2,428 1,499 4,010Massachusetts 1,184 7,042 663 8,889Michigan 4,189 3,788 1,356 9,333Minnesota 215 6,378 2,507 9,100Mississippi 2,070 3,720 664 6,454Missouri 81 1,202 422 1,705Montana 327 539 985 1,851Nebraska 0 1,081 1,480 2,561Nevada 92 1,199 128 1,419New Hampshire 107 172 83 362New Jersey 161 7,468 1,206 8,835New Mexico 17 1,932 2,151 4,100New York 1,652 6,736 5,894 14,282North Carolina 3,938 4,423 6,190 14,551North Dakota 19 437 681 1,137Ohio 1,753 7,557 4,061 13,371Oklahoma 371 662 442 1,475Oregon 310 2,102 67 2,479Pennsylvania 0 10,417 1,545 11,962Rhode Island 21 295 177 493South Carolina 113 6,051 2,144 8,308South Dakota 51 774 280 1,105Tennessee 224 4,955 646 5,825Texas 894 11,004 3,308 15,206Utah 67 1,376 578 2,021Vermont 283 255 119 657Virginia 1,068 3,079 1,213 5,360Virgin Islands 287 57 45 389Washington 92 6,986 5,559 12,637West Virginia 558 1,487 487 2,532Wisconsin 1,027 7,315 1,639 9,981Wyoming 3 230 175 408U.S. 30,274 394,883 459,144 884,301
33
Page 36
TABLE 26: SNAP Recipient Claims Collected by Type - FY 2016
STATEFraud
Claims CollectedHousehold ErrorClaims Collected
Agency ErrorClaims Collected
Total ClaimsCollected
Alabama $1,481,751 $3,005,665 $1,584,367 $6,071,783Alaska $209,446 $139,810 $366,180 $715,436Arizona $253,251 $1,319,208 $941,737 $2,514,196Arkansas $819,752 $294,053 $116,930 $1,230,736California $6,516,700 $64,230,854 $50,759,444 $121,506,997Colorado $1,708,633 $2,029,990 $4,091,609 $7,830,232Connecticut $328,329 $256,396 $734,794 $1,319,519Delaware $277,587 $1,875,907 $138,701 $2,292,195District of Columbia $31,395 $798,307 $64,805 $894,507Florida $3,457,923 $13,297,248 $3,837,584 $20,592,754Georgia $7,155,867 $852,400 $1,827,293 $9,835,560Guam $159,818 $16,034 $72,331 $248,183Hawaii $737,664 $830,800 $314,971 $1,883,435Idaho $465,683 $363,000 $257,470 $1,086,154Illinois $2,541,019 $23,051,791 $2,062,569 $27,655,379Indiana $492,646 $1,982,312 $991,367 $3,466,325Iowa $119,100 $1,082,085 $80,182 $1,281,366Kansas $1,059,604 $559,517 $292,214 $1,911,335Kentucky $3,345,734 $2,577,876 $1,654,561 $7,578,171Louisiana $1,962,678 $648,673 $304,783 $2,916,134Maine $377,848 $698,585 $661,458 $1,737,891Maryland $198,266 $1,480,909 $580,093 $2,259,268Massachusetts $1,304,248 $4,012,493 $205,388 $5,522,128Michigan $7,061,598 $2,133,758 $1,427,230 $10,622,586Minnesota $946,601 $4,471,437 $1,198,720 $6,616,758Mississippi $3,925,378 $1,112,088 $494,009 $5,531,474Missouri $1,245,631 $826,559 $427,081 $2,499,271Montana $276,892 $274,258 $342,333 $893,483Nebraska $163,610 $500,121 $736,895 $1,400,625Nevada $551,080 $568,752 $59,551 $1,179,383New Hampshire $336,911 $210,824 $53,217 $600,952New Jersey $1,189,377 $5,786,735 $665,546 $7,641,658New Mexico $188,297 $1,162,241 $1,095,028 $2,445,566New York $3,077,258 $4,756,904 $3,277,813 $11,111,975North Carolina $4,283,224 $4,829,147 $3,154,114 $12,266,485North Dakota $57,301 $255,780 $148,216 $461,297Ohio $3,981,612 $6,820,011 $2,930,597 $13,732,220Oklahoma $760,531 $408,874 $241,053 $1,410,457Oregon $2,516,969 $3,709,297 $248,038 $6,474,303Pennsylvania $2,122,265 $7,080,684 $1,087,361 $10,290,310Rhode Island $39,364 $127,337 $110,791 $277,492South Carolina $2,697,291 $4,651,717 $1,556,163 $8,905,171South Dakota $306,078 $444,687 $105,966 $856,731Tennessee $5,928,891 $4,949,024 $560,389 $11,438,304Texas $7,019,636 $17,861,046 $5,972,825 $30,853,506Utah $877,526 $471,023 $497,432 $1,845,981Vermont $341,245 $275,731 $48,327 $665,303Virginia $2,256,393 $2,299,128 $765,921 $5,321,443Virgin Islands $171,477 $109,910 $59,813 $341,199Washington $283,619 $2,923,985 $1,357,321 $4,564,925West Virginia $768,452 $1,027,331 $353,523 $2,149,306Wisconsin $1,223,115 $5,246,935 $624,490 $7,094,540Wyoming $29,495 $80,967 $54,356 $164,818U.S. $89,632,055 $210,780,203 $101,594,948 $402,007,206
34
Page 37
TABLE 27: SNAP Recipient Claims Collected by Collection Method - FY 2016
STATEClaims
RecoupedTreasury Offset
ProgramOther Collection
Methods & Refunds1Total Claims
CollectedAlabama $2,659,176 $2,720,095 $692,512 $6,071,783Alaska $300,500 $169,591 $245,345 $715,436Arizona $907,900 $984,003 $622,293 $2,514,196Arkansas $301,014 $712,003 $217,719 $1,230,736California $54,887,053 $33,745,924 $32,874,020 $121,506,997Colorado $2,690,666 $3,427,894 $1,711,672 $7,830,232Connecticut $735,863 $337,022 $246,634 $1,319,519Delaware $648,552 $1,273,210 $370,433 $2,292,195District of Columbia $311,091 $546,244 $37,172 $894,507Florida $7,629,197 $8,112,355 $4,851,202 $20,592,754Georgia $4,279,347 $5,207,999 $348,214 $9,835,560Guam $106,991 $18,460 $122,732 $248,183Hawaii $885,316 $506,132 $491,987 $1,883,435Idaho $358,727 $363,631 $363,796 $1,086,154Illinois $8,499,463 $14,628,281 $4,527,635 $27,655,379Indiana $2,077,685 $688,953 $699,687 $3,466,325Iowa $364,508 $672,866 $243,992 $1,281,366Kansas $500,831 $1,064,659 $345,845 $1,911,335Kentucky $2,723,279 $4,057,534 $797,358 $7,578,171Louisiana $1,291,722 $873,164 $751,248 $2,916,134Maine $824,798 $1,127,506 -$214,413 $1,737,891Maryland $849,053 $904,304 $505,911 $2,259,268Massachusetts $2,332,339 $2,363,848 $825,941 $5,522,128Michigan $3,686,020 $5,245,918 $1,690,648 $10,622,586Minnesota $2,264,848 $2,695,490 $1,656,420 $6,616,758Mississippi $2,481,466 $2,550,024 $499,984 $5,531,474Missouri $882,700 $1,347,606 $268,965 $2,499,271Montana $405,623 $244,138 $243,722 $893,483Nebraska $611,997 $554,487 $234,141 $1,400,625Nevada $342,189 $483,259 $353,935 $1,179,383New Hampshire $170,349 $215,774 $214,829 $600,952New Jersey $2,900,517 $3,545,309 $1,195,832 $7,641,658New Mexico $1,268,039 $545,714 $631,813 $2,445,566New York $4,363,472 $4,481,073 $2,267,430 $11,111,975North Carolina $4,881,018 $6,365,769 $1,019,698 $12,266,485North Dakota $181,032 $201,997 $78,268 $461,297Ohio $5,004,620 $7,573,190 $1,154,410 $13,732,220Oklahoma $519,887 $654,625 $235,945 $1,410,457Oregon $1,486,640 $1,884,877 $3,102,786 $6,474,303Pennsylvania $4,349,802 $4,391,862 $1,548,646 $10,290,310Rhode Island $181,504 $74,633 $21,355 $277,492South Carolina $3,431,602 $4,598,470 $875,099 $8,905,171South Dakota $314,903 $381,350 $160,478 $856,731Tennessee $3,646,643 $6,184,045 $1,607,616 $11,438,304Texas $7,991,910 $18,237,291 $4,624,305 $30,853,506Utah $447,831 $789,278 $608,872 $1,845,981Vermont $235,842 $362,697 $66,764 $665,303Virginia $1,626,643 $2,254,563 $1,440,237 $5,321,443Virgin Islands $223,012 $96,271 $21,916 $341,199Washington $2,228,977 $1,254,692 $1,081,256 $4,564,925West Virginia $1,008,521 $867,476 $273,309 $2,149,306Wisconsin $1,987,693 $3,392,906 $1,713,941 $7,094,540Wyoming $40,533 $54,067 $70,218 $164,818U.S. $155,330,907 $166,034,529 $80,641,770 $402,007,2061 Because this column includes claim payments and refunds, it may contain negative sums.
35
Page 38
VI.
Participation and Issuance Ranking
36
Page 39
TABLE 28: SNAP Participation and Issuance (Ranked by Persons) - FY 2016
Rank STATEPersons Participating
(Monthly Average)Households Participating
(Monthly Average)Total Issuance
1 California 4,340,042 2,093,562 $7,237,700,0862 Texas 3,768,472 1,588,116 $5,308,544,5603 Florida 3,454,530 1,870,739 $5,216,754,1474 New York 2,968,227 1,635,764 $4,922,406,4305 Illinois 1,914,393 996,092 $3,040,976,7726 Pennsylvania 1,863,836 950,739 $2,729,024,6837 Georgia 1,733,473 800,670 $2,663,017,7638 Ohio 1,608,633 793,923 $2,396,032,9199 North Carolina 1,568,387 761,999 $2,248,946,897
10 Michigan 1,473,614 777,906 $2,167,714,84511 Tennessee 1,113,231 547,850 $1,672,282,24012 Washington 1,011,412 546,931 $1,452,893,51813 Arizona 960,105 427,061 $1,402,230,49314 Louisiana 927,168 422,090 $1,494,495,29215 New Jersey 879,987 440,091 $1,223,052,43316 Alabama 850,804 399,728 $1,254,835,32017 Virginia 826,354 387,633 $1,169,412,64418 Missouri 810,690 378,373 $1,182,957,87419 South Carolina 805,012 378,328 $1,222,104,22820 Massachusetts 779,192 450,364 $1,189,716,30321 Maryland 744,343 388,957 $1,079,151,90422 Indiana 741,610 328,688 $1,068,458,92623 Oregon 734,864 419,778 $1,072,982,18524 Wisconsin 728,077 359,933 $922,851,05025 Kentucky 666,264 313,476 $980,976,98426 Oklahoma 612,869 276,268 $885,643,48227 Mississippi 582,658 269,082 $814,420,69728 Minnesota 478,783 231,228 $602,563,63929 Colorado 475,690 225,334 $728,042,70330 New Mexico 471,247 216,877 $693,426,78331 Nevada 439,782 222,253 $629,519,65232 Connecticut 431,597 244,927 $685,510,01133 Arkansas 426,069 191,636 $577,775,08234 Iowa 380,705 178,874 $507,597,20635 West Virginia 357,531 178,274 $499,059,45836 Kansas 253,833 114,392 $342,324,96837 Utah 219,820 86,244 $301,869,69738 Maine 189,245 98,549 $254,898,80239 Idaho 185,303 79,531 $255,423,93040 Hawaii 176,729 89,095 $484,225,00841 Nebraska 175,851 78,482 $240,677,41742 Rhode Island 171,055 100,433 $271,959,59643 Delaware 147,559 71,099 $220,683,31444 District of Columbia 134,625 75,819 $210,436,41045 Montana 116,626 54,612 $166,365,46546 New Hampshire 98,464 48,037 $120,552,01947 South Dakota 95,983 42,234 $144,590,24248 Alaska 82,326 34,648 $175,483,42449 Vermont 79,715 42,976 $116,470,07550 North Dakota 54,252 25,262 $78,700,88851 Guam 46,713 15,551 $106,333,97252 Wyoming 33,853 14,367 $48,510,21053 Virgin Islands 27,760 13,068 $56,766,573
U.S. 44,219,363 21,777,938 $66,539,351,219
37
Page 40
TABLE 29: SNAP Participation and Issuance (Ranked by Households) - FY 2016
Rank STATEPersons Participating
(Monthly Average)Households Participating
(Monthly Average)Total Issuance
1 California 4,340,042 2,093,562 $7,237,700,0862 Florida 3,454,530 1,870,739 $5,216,754,1473 New York 2,968,227 1,635,764 $4,922,406,4304 Texas 3,768,472 1,588,116 $5,308,544,5605 Illinois 1,914,393 996,092 $3,040,976,7726 Pennsylvania 1,863,836 950,739 $2,729,024,6837 Georgia 1,733,473 800,670 $2,663,017,7638 Ohio 1,608,633 793,923 $2,396,032,9199 Michigan 1,473,614 777,906 $2,167,714,845
10 North Carolina 1,568,387 761,999 $2,248,946,89711 Tennessee 1,113,231 547,850 $1,672,282,24012 Washington 1,011,412 546,931 $1,452,893,51813 Massachusetts 779,192 450,364 $1,189,716,30314 New Jersey 879,987 440,091 $1,223,052,43315 Arizona 960,105 427,061 $1,402,230,49316 Louisiana 927,168 422,090 $1,494,495,29217 Oregon 734,864 419,778 $1,072,982,18518 Alabama 850,804 399,728 $1,254,835,32019 Maryland 744,343 388,957 $1,079,151,90420 Virginia 826,354 387,633 $1,169,412,64421 Missouri 810,690 378,373 $1,182,957,87422 South Carolina 805,012 378,328 $1,222,104,22823 Wisconsin 728,077 359,933 $922,851,05024 Indiana 741,610 328,688 $1,068,458,92625 Kentucky 666,264 313,476 $980,976,98426 Oklahoma 612,869 276,268 $885,643,48227 Mississippi 582,658 269,082 $814,420,69728 Connecticut 431,597 244,927 $685,510,01129 Minnesota 478,783 231,228 $602,563,63930 Colorado 475,690 225,334 $728,042,70331 Nevada 439,782 222,253 $629,519,65232 New Mexico 471,247 216,877 $693,426,78333 Arkansas 426,069 191,636 $577,775,08234 Iowa 380,705 178,874 $507,597,20635 West Virginia 357,531 178,274 $499,059,45836 Kansas 253,833 114,392 $342,324,96837 Rhode Island 171,055 100,433 $271,959,59638 Maine 189,245 98,549 $254,898,80239 Hawaii 176,729 89,095 $484,225,00840 Utah 219,820 86,244 $301,869,69741 Idaho 185,303 79,531 $255,423,93042 Nebraska 175,851 78,482 $240,677,41743 District of Columbia 134,625 75,819 $210,436,41044 Delaware 147,559 71,099 $220,683,31445 Montana 116,626 54,612 $166,365,46546 New Hampshire 98,464 48,037 $120,552,01947 Vermont 79,715 42,976 $116,470,07548 South Dakota 95,983 42,234 $144,590,24249 Alaska 82,326 34,648 $175,483,42450 North Dakota 54,252 25,262 $78,700,88851 Guam 46,713 15,551 $106,333,97252 Wyoming 33,853 14,367 $48,510,21053 Virgin Islands 27,760 13,068 $56,766,573
U.S. 44,219,363 21,777,938 $66,539,351,219
38
Page 41
TABLE 30: SNAP Participation and Issuance (Ranked by Issuance) - FY 2016
Rank STATEPersons Participating
(Monthly Average)Households Participating
(Monthly Average)Total Issuance
1 California 4,340,042 2,093,562 $7,237,700,0862 Texas 3,768,472 1,588,116 $5,308,544,5603 Florida 3,454,530 1,870,739 $5,216,754,1474 New York 2,968,227 1,635,764 $4,922,406,4305 Illinois 1,914,393 996,092 $3,040,976,7726 Pennsylvania 1,863,836 950,739 $2,729,024,6837 Georgia 1,733,473 800,670 $2,663,017,7638 Ohio 1,608,633 793,923 $2,396,032,9199 North Carolina 1,568,387 761,999 $2,248,946,897
10 Michigan 1,473,614 777,906 $2,167,714,84511 Tennessee 1,113,231 547,850 $1,672,282,24012 Louisiana 927,168 422,090 $1,494,495,29213 Washington 1,011,412 546,931 $1,452,893,51814 Arizona 960,105 427,061 $1,402,230,49315 Alabama 850,804 399,728 $1,254,835,32016 New Jersey 879,987 440,091 $1,223,052,43317 South Carolina 805,012 378,328 $1,222,104,22818 Massachusetts 779,192 450,364 $1,189,716,30319 Missouri 810,690 378,373 $1,182,957,87420 Virginia 826,354 387,633 $1,169,412,64421 Maryland 744,343 388,957 $1,079,151,90422 Oregon 734,864 419,778 $1,072,982,18523 Indiana 741,610 328,688 $1,068,458,92624 Kentucky 666,264 313,476 $980,976,98425 Wisconsin 728,077 359,933 $922,851,05026 Oklahoma 612,869 276,268 $885,643,48227 Mississippi 582,658 269,082 $814,420,69728 Colorado 475,690 225,334 $728,042,70329 New Mexico 471,247 216,877 $693,426,78330 Connecticut 431,597 244,927 $685,510,01131 Nevada 439,782 222,253 $629,519,65232 Minnesota 478,783 231,228 $602,563,63933 Arkansas 426,069 191,636 $577,775,08234 Iowa 380,705 178,874 $507,597,20635 West Virginia 357,531 178,274 $499,059,45836 Hawaii 176,729 89,095 $484,225,00837 Kansas 253,833 114,392 $342,324,96838 Utah 219,820 86,244 $301,869,69739 Rhode Island 171,055 100,433 $271,959,59640 Idaho 185,303 79,531 $255,423,93041 Maine 189,245 98,549 $254,898,80242 Nebraska 175,851 78,482 $240,677,41743 Delaware 147,559 71,099 $220,683,31444 District of Columbia 134,625 75,819 $210,436,41045 Alaska 82,326 34,648 $175,483,42446 Montana 116,626 54,612 $166,365,46547 South Dakota 95,983 42,234 $144,590,24248 New Hampshire 98,464 48,037 $120,552,01949 Vermont 79,715 42,976 $116,470,07550 Guam 46,713 15,551 $106,333,97251 North Dakota 54,252 25,262 $78,700,88852 Virgin Islands 27,760 13,068 $56,766,57353 Wyoming 33,853 14,367 $48,510,210
U.S. 44,219,363 21,777,938 $66,539,351,219
39
Page 42
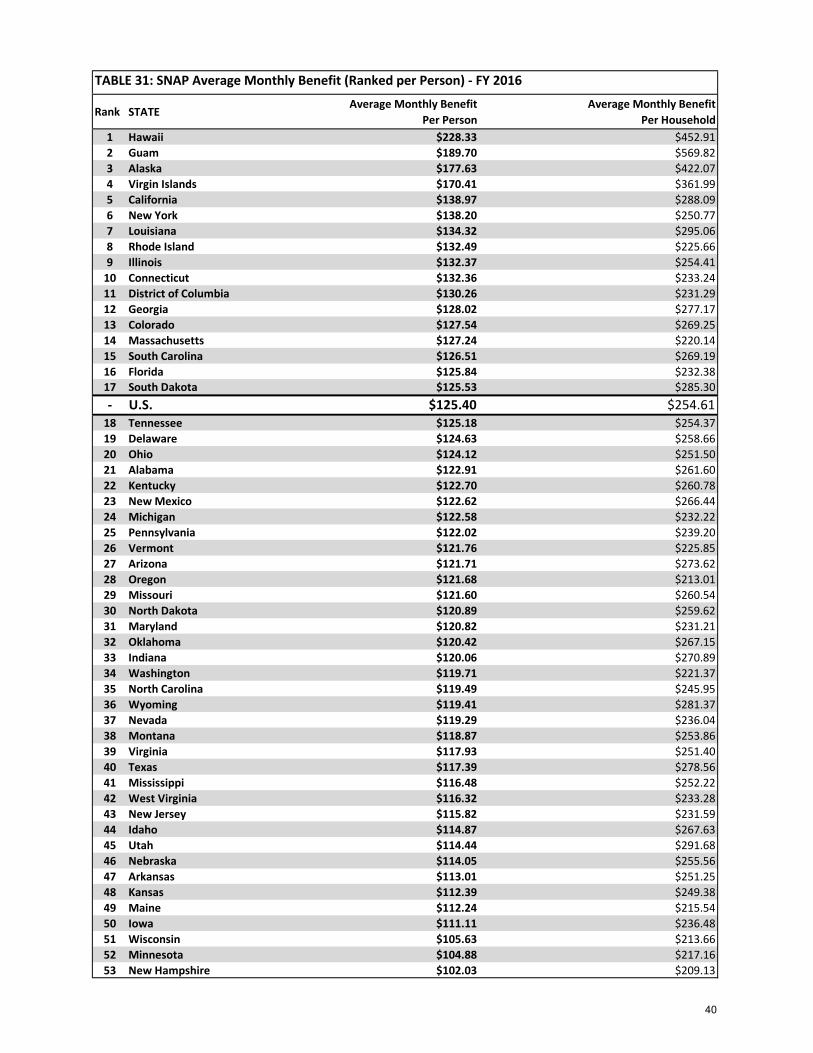
TABLE 31: SNAP Average Monthly Benefit (Ranked per Person) - FY 2016
Rank STATEAverage Monthly Benefit
Per PersonAverage Monthly Benefit
Per Household1 Hawaii $228.33 $452.912 Guam $189.70 $569.823 Alaska $177.63 $422.074 Virgin Islands $170.41 $361.995 California $138.97 $288.096 New York $138.20 $250.777 Louisiana $134.32 $295.068 Rhode Island $132.49 $225.669 Illinois $132.37 $254.41
10 Connecticut $132.36 $233.2411 District of Columbia $130.26 $231.2912 Georgia $128.02 $277.1713 Colorado $127.54 $269.2514 Massachusetts $127.24 $220.1415 South Carolina $126.51 $269.1916 Florida $125.84 $232.3817 South Dakota $125.53 $285.30- U.S. $125.40 $254.61
18 Tennessee $125.18 $254.3719 Delaware $124.63 $258.6620 Ohio $124.12 $251.5021 Alabama $122.91 $261.6022 Kentucky $122.70 $260.7823 New Mexico $122.62 $266.4424 Michigan $122.58 $232.2225 Pennsylvania $122.02 $239.2026 Vermont $121.76 $225.8527 Arizona $121.71 $273.6228 Oregon $121.68 $213.0129 Missouri $121.60 $260.5430 North Dakota $120.89 $259.6231 Maryland $120.82 $231.2132 Oklahoma $120.42 $267.1533 Indiana $120.06 $270.8934 Washington $119.71 $221.3735 North Carolina $119.49 $245.9536 Wyoming $119.41 $281.3737 Nevada $119.29 $236.0438 Montana $118.87 $253.8639 Virginia $117.93 $251.4040 Texas $117.39 $278.5641 Mississippi $116.48 $252.2242 West Virginia $116.32 $233.2843 New Jersey $115.82 $231.5944 Idaho $114.87 $267.6345 Utah $114.44 $291.6846 Nebraska $114.05 $255.5647 Arkansas $113.01 $251.2548 Kansas $112.39 $249.3849 Maine $112.24 $215.5450 Iowa $111.11 $236.4851 Wisconsin $105.63 $213.6652 Minnesota $104.88 $217.1653 New Hampshire $102.03 $209.13
40
Page 43
TABLE 32: SNAP Average Monthly Benefit (Ranked per Household) - FY 2016
Rank STATEAverage Monthly Benefit
Per PersonAverage Monthly Benefit
Per Household1 Guam $189.70 $569.822 Hawaii $228.33 $452.913 Alaska $177.63 $422.074 Virgin Islands $170.41 $361.995 Louisiana $134.32 $295.066 Utah $114.44 $291.687 California $138.97 $288.098 South Dakota $125.53 $285.309 Wyoming $119.41 $281.37
10 Texas $117.39 $278.5611 Georgia $128.02 $277.1712 Arizona $121.71 $273.6213 Indiana $120.06 $270.8914 Colorado $127.54 $269.2515 South Carolina $126.51 $269.1916 Idaho $114.87 $267.6317 Oklahoma $120.42 $267.1518 New Mexico $122.62 $266.4419 Alabama $122.91 $261.6020 Kentucky $122.70 $260.7821 Missouri $121.60 $260.5422 North Dakota $120.89 $259.6223 Delaware $124.63 $258.6624 Nebraska $114.05 $255.56- U.S. $125.40 $254.61
25 Illinois $132.37 $254.4126 Tennessee $125.18 $254.3727 Montana $118.87 $253.8628 Mississippi $116.48 $252.2229 Ohio $124.12 $251.5030 Virginia $117.93 $251.4031 Arkansas $113.01 $251.2532 New York $138.20 $250.7733 Kansas $112.39 $249.3834 North Carolina $119.49 $245.9535 Pennsylvania $122.02 $239.2036 Iowa $111.11 $236.4837 Nevada $119.29 $236.0438 West Virginia $116.32 $233.2839 Connecticut $132.36 $233.2440 Florida $125.84 $232.3841 Michigan $122.58 $232.2242 New Jersey $115.82 $231.5943 District of Columbia $130.26 $231.2944 Maryland $120.82 $231.2145 Vermont $121.76 $225.8546 Rhode Island $132.49 $225.6647 Washington $119.71 $221.3748 Massachusetts $127.24 $220.1449 Minnesota $104.88 $217.1650 Maine $112.24 $215.5451 Wisconsin $105.63 $213.6652 Oregon $121.68 $213.0153 New Hampshire $102.03 $209.13
41
Page 44
VII.
Multi-Year Comparisons
42
Page 45
TABLE 33: SNAP Persons Participating (Monthly Average) - FY 2014 - FY 2016
STATEPersons Participating
FY 2014Persons Participating
FY 2015Persons Participating
FY 2016Percent Change
FY 2015 - FY 2016Alabama 902,073 889,380 850,804 -4.34%Alaska 87,486 81,121 82,326 1.49%Arizona 1,044,310 999,401 960,105 -3.93%Arkansas 491,965 468,904 426,069 -9.14%California 4,349,634 4,417,772 4,340,042 -1.76%Colorado 505,169 495,134 475,690 -3.93%Connecticut 438,559 442,161 431,597 -2.39%Delaware 150,232 149,981 147,559 -1.61%District of Columbia 142,707 141,845 134,625 -5.09%Florida 3,526,311 3,656,169 3,454,530 -5.52%Georgia 1,815,833 1,800,531 1,733,473 -3.72%Guam 47,289 47,166 46,713 -0.96%Hawaii 194,264 188,895 176,729 -6.44%Idaho 211,781 196,872 185,303 -5.88%Illinois 2,015,303 2,042,306 1,914,393 -6.26%Indiana 892,699 831,740 741,610 -10.84%Iowa 408,070 391,224 380,705 -2.69%Kansas 293,456 273,974 253,833 -7.35%Kentucky 828,076 768,882 666,264 -13.35%Louisiana 877,340 859,738 927,168 7.84%Maine 230,536 202,579 189,245 -6.58%Maryland 787,597 781,035 744,343 -4.70%Massachusetts 863,412 785,778 779,192 -0.84%Michigan 1,679,421 1,571,344 1,473,614 -6.22%Minnesota 533,743 496,023 478,783 -3.48%Mississippi 656,871 636,322 582,658 -8.43%Missouri 858,416 844,597 810,690 -4.01%Montana 124,906 119,082 116,626 -2.06%Nebraska 173,530 174,092 175,851 1.01%Nevada 383,622 420,413 439,782 4.61%New Hampshire 111,701 106,296 98,464 -7.37%New Jersey 883,434 905,728 879,987 -2.84%New Mexico 430,622 453,146 471,247 3.99%New York 3,122,879 3,039,108 2,968,227 -2.33%North Carolina 1,575,676 1,646,202 1,568,387 -4.73%North Dakota 53,753 53,148 54,252 2.08%Ohio 1,752,135 1,676,263 1,608,633 -4.03%Oklahoma 608,492 598,257 612,869 2.44%Oregon 802,190 779,749 734,864 -5.76%Pennsylvania 1,796,154 1,826,667 1,863,836 2.03%Rhode Island 178,518 175,025 171,055 -2.27%South Carolina 834,511 804,572 805,012 0.05%South Dakota 100,938 98,553 95,983 -2.61%Tennessee 1,312,505 1,229,391 1,113,231 -9.45%Texas 3,852,675 3,724,688 3,768,472 1.18%Utah 229,911 225,603 219,820 -2.56%Vermont 93,000 84,994 79,715 -6.21%Virginia 918,902 860,375 826,354 -3.95%Virgin Islands 27,824 27,461 27,760 1.09%Washington 1,095,551 1,070,933 1,011,412 -5.56%West Virginia 362,501 367,908 357,531 -2.82%Wisconsin 841,533 805,540 728,077 -9.62%Wyoming 35,871 32,606 33,853 3.83%U.S. 46,535,888 45,766,672 44,219,363 -3.38%
43
Page 46
TABLE 34: SNAP Households Participating (Monthly Average) - FY 2014 - FY 2016
STATEHouseholds
ParticipatingFY 2014
Households Participating
FY 2015
Households Participating
FY 2016
Percent ChangeFY 2015 - FY 2016
Alabama 419,552 417,943 399,728 -4.36%Alaska 36,997 34,187 34,648 1.35%Arizona 449,640 439,330 427,061 -2.79%Arkansas 221,446 214,056 191,636 -10.47%California 2,019,272 2,096,960 2,093,562 -0.16%Colorado 234,098 233,113 225,334 -3.34%Connecticut 242,982 248,204 244,927 -1.32%Delaware 71,408 71,821 71,099 -1.00%District of Columbia 80,360 80,007 75,819 -5.23%Florida 1,920,697 2,009,594 1,870,739 -6.91%Georgia 838,034 839,207 800,670 -4.59%Guam 15,480 15,556 15,551 -0.03%Hawaii 98,830 95,545 89,095 -6.75%Idaho 90,161 83,869 79,531 -5.17%Illinois 1,021,150 1,060,589 996,092 -6.08%Indiana 404,575 379,929 328,688 -13.49%Iowa 193,372 184,850 178,874 -3.23%Kansas 132,825 121,991 114,392 -6.23%Kentucky 399,207 368,596 313,476 -14.95%Louisiana 396,428 389,519 422,090 8.36%Maine 122,690 105,075 98,549 -6.21%Maryland 403,781 404,708 388,957 -3.89%Massachusetts 489,039 449,468 450,364 0.20%Michigan 872,538 824,971 777,906 -5.71%Minnesota 260,437 240,410 231,228 -3.82%Mississippi 302,202 296,094 269,082 -9.12%Missouri 403,913 398,662 378,373 -5.09%Montana 59,097 56,112 54,612 -2.67%Nebraska 76,919 77,755 78,482 0.94%Nevada 188,739 209,787 222,253 5.94%New Hampshire 53,559 51,478 48,037 -6.68%New Jersey 439,695 453,338 440,091 -2.92%New Mexico 194,963 205,540 216,877 5.52%New York 1,698,559 1,665,683 1,635,764 -1.80%North Carolina 761,105 803,495 761,999 -5.16%North Dakota 25,011 24,771 25,262 1.98%Ohio 851,972 818,704 793,923 -3.03%Oklahoma 279,606 271,065 276,268 1.92%Oregon 448,855 442,090 419,778 -5.05%Pennsylvania 889,725 918,761 950,739 3.48%Rhode Island 101,002 100,949 100,433 -0.51%South Carolina 395,209 379,992 378,328 -0.44%South Dakota 44,039 43,176 42,234 -2.18%Tennessee 650,251 611,805 547,850 -10.45%Texas 1,607,669 1,558,597 1,588,116 1.89%Utah 90,570 88,160 86,244 -2.17%Vermont 48,575 44,950 42,976 -4.39%Virginia 443,607 404,348 387,633 -4.13%Virgin Islands 12,478 12,610 13,068 3.64%Washington 585,105 572,261 546,931 -4.43%West Virginia 176,029 181,961 178,274 -2.03%Wisconsin 420,833 406,754 359,933 -11.51%Wyoming 15,249 13,868 14,367 3.60%U.S. 22,699,534 22,522,261 21,777,938 -3.30%
44
Page 47
TABLE 35: SNAP Issuance - FY 2014 - FY 2016
STATEIssuanceFY 2014
IssuanceFY 2015
IssuanceFY 2016
Percent ChangeFY 2015 - FY 2016
Alabama $1,318,133,562 $1,341,906,577 $1,254,835,320 -6.49%Alaska $174,241,813 $168,054,411 $175,483,424 4.42%Arizona $1,476,761,898 $1,459,584,642 $1,402,230,493 -3.93%Arkansas $663,719,268 $648,769,562 $577,775,082 -10.94%California $7,411,483,685 $7,528,039,778 $7,237,700,086 -3.86%Colorado $765,737,085 $771,959,823 $728,042,703 -5.69%Connecticut $697,435,672 $715,334,947 $685,510,011 -4.17%Delaware $220,352,805 $228,935,464 $220,683,314 -3.60%District of Columbia $222,604,041 $224,104,447 $210,436,410 -6.10%Florida $5,472,834,001 $5,688,711,691 $5,216,754,147 -8.30%Georgia $2,827,853,876 $2,803,606,880 $2,663,017,763 -5.01%Guam $108,433,869 $109,108,592 $106,333,972 -2.54%Hawaii $525,397,960 $505,466,329 $484,225,008 -4.20%Idaho $295,662,973 $273,758,132 $255,423,930 -6.70%Illinois $3,202,509,863 $3,303,102,831 $3,040,976,772 -7.94%Indiana $1,311,468,403 $1,244,188,231 $1,068,458,926 -14.12%Iowa $532,085,213 $516,608,025 $507,597,206 -1.74%Kansas $395,209,994 $374,432,741 $342,324,968 -8.58%Kentucky $1,170,989,948 $1,112,381,122 $980,976,984 -11.81%Louisiana $1,288,316,273 $1,298,445,656 $1,494,495,292 15.10%Maine $321,550,513 $282,015,650 $254,898,802 -9.62%Maryland $1,133,135,874 $1,149,657,589 $1,079,151,904 -6.13%Massachusetts $1,272,977,488 $1,202,312,621 $1,189,716,303 -1.05%Michigan $2,576,165,148 $2,369,233,695 $2,167,714,845 -8.51%Minnesota $670,202,668 $627,557,916 $602,563,639 -3.98%Mississippi $912,985,504 $916,551,543 $814,420,697 -11.14%Missouri $1,236,444,630 $1,258,535,557 $1,182,957,874 -6.01%Montana $176,169,543 $171,413,823 $166,365,465 -2.95%Nebraska $238,904,358 $242,092,503 $240,677,417 -0.58%Nevada $536,711,313 $605,592,527 $629,519,652 3.95%New Hampshire $140,718,624 $132,497,777 $120,552,019 -9.02%New Jersey $1,290,688,313 $1,291,435,885 $1,223,052,433 -5.30%New Mexico $630,130,306 $685,206,629 $693,426,783 1.20%New York $5,200,758,093 $5,046,486,639 $4,922,406,430 -2.46%North Carolina $2,383,571,501 $2,395,550,386 $2,248,946,897 -6.12%North Dakota $75,765,024 $77,912,538 $78,700,888 1.01%Ohio $2,582,757,967 $2,528,834,777 $2,396,032,919 -5.25%Oklahoma $865,049,765 $864,950,565 $885,643,482 2.39%Oregon $1,161,871,005 $1,152,976,715 $1,072,982,185 -6.94%Pennsylvania $2,573,657,445 $2,699,655,059 $2,729,024,683 1.09%Rhode Island $279,843,287 $282,777,163 $271,959,596 -3.83%South Carolina $1,235,696,260 $1,208,604,782 $1,222,104,228 1.12%South Dakota $148,938,276 $148,866,948 $144,590,242 -2.87%Tennessee $1,951,918,832 $1,884,708,816 $1,672,282,240 -11.27%Texas $5,330,650,619 $5,265,414,124 $5,308,544,560 0.82%Utah $316,671,764 $313,810,557 $301,869,697 -3.81%Vermont $130,324,476 $124,409,407 $116,470,075 -6.38%Virginia $1,303,281,631 $1,230,788,073 $1,169,412,644 -4.99%Virgin Islands $55,099,458 $56,465,978 $56,766,573 0.53%Washington $1,547,545,882 $1,527,741,099 $1,452,893,518 -4.90%West Virginia $476,134,200 $497,268,953 $499,059,458 0.36%Wisconsin $1,112,980,884 $1,051,153,941 $922,851,050 -12.21%Wyoming $49,272,569 $46,448,470 $48,510,210 4.44%U.S. $69,999,805,422 $69,655,428,586 $66,539,351,219 -4.47%
45
Page 48
TABLE 36: Federal Share of State Agency SNAP Administrative Costs - FY 2015 - FY 2016
STATEFederal Share of Costs - FY 2015
Federal Share of Costs - FY 2016
PercentChange
Alabama $44,441,833 $47,617,699 7.15%Alaska $10,534,912 $10,034,318 -4.75%Arizona $62,930,733 $64,232,975 2.07%Arkansas $35,070,739 $32,083,641 -8.52%California $861,888,092 $822,573,216 -4.56%Colorado $50,678,950 $54,419,909 7.38%Connecticut $49,995,111 $55,316,718 10.64%Delaware $15,298,965 $16,027,961 4.77%District of Columbia $18,482,310 $20,128,196 8.91%Florida $80,997,415 $83,205,956 2.73%Georgia $98,443,383 $83,783,881 -14.89%Guam $1,568,029 $1,523,792 -2.82%Hawaii $19,003,103 $18,070,043 -4.91%Idaho $8,428,958 $8,955,588 6.25%Illinois $97,435,988 $98,470,965 1.06%Indiana $65,797,553 $69,448,018 5.55%Iowa $20,176,910 $20,017,999 -0.79%Kansas $18,680,024 $21,190,722 13.44%Kentucky $47,696,002 $56,005,282 17.42%Louisiana $58,310,092 $68,661,366 17.75%Maine $10,066,536 $11,560,936 14.85%Maryland $69,738,932 $70,091,447 0.51%Massachusetts $59,094,513 $58,188,374 -1.53%Michigan $143,174,657 $132,203,194 -7.66%Minnesota $62,382,769 $63,260,400 1.41%Mississippi $21,053,199 $27,763,747 31.87%Missouri $33,387,008 $37,841,537 13.34%Montana $11,425,319 $11,204,460 -1.93%Nebraska $14,358,108 $15,031,106 4.69%Nevada $23,747,022 $24,224,402 2.01%New Hampshire $7,772,128 $8,721,199 12.21%New Jersey $146,558,599 $152,901,179 4.33%New Mexico $30,212,428 $29,731,732 -1.59%New York $369,757,073 $392,058,943 6.03%North Carolina $92,158,332 $104,403,154 13.29%North Dakota $8,135,184 $9,484,024 16.58%Ohio $104,903,192 $100,087,762 -4.59%Oklahoma $38,719,349 $34,054,168 -12.05%Oregon $76,337,854 $80,660,886 5.66%Pennsylvania $160,788,718 $163,212,718 1.51%Rhode Island $10,781,805 $10,466,375 -2.93%South Carolina $33,182,765 $33,060,036 -0.37%South Dakota $8,403,119 $8,670,186 3.18%Tennessee $72,765,232 $67,351,748 -7.44%Texas $190,609,525 $194,965,584 2.29%Utah $14,951,211 $14,826,756 -0.83%Vermont $11,284,251 $9,769,515 -13.42%Virginia $99,482,594 $106,505,368 7.06%Virgin Islands $5,536,828 $5,646,696 1.98%Washington $92,863,204 $92,794,812 -0.07%West Virginia $15,707,645 $18,583,229 18.31%Wisconsin $65,643,596 $77,422,967 17.94%Wyoming $6,771,354 $6,094,975 -9.99%U.S. $3,777,613,151 $3,824,611,860 1.24%
46
Page 49
TABLE 37: Federal Share of State Agency SNAP Admin. Costs per Case - FY 2015 - FY 2016
STATEFederal Share of Costs perCase per Month - FY 2015
Federal Share of Costs perCase per Month - FY 2016
PercentChange
Alabama $8.86 $9.93 12.03%Alaska $25.68 $24.13 -6.02%Arizona $11.94 $12.53 5.00%Arkansas $13.65 $13.95 2.19%California $34.25 $32.74 -4.41%Colorado $18.12 $20.13 11.09%Connecticut $16.79 $18.82 12.12%Delaware $17.75 $18.79 5.83%District of Columbia $19.25 $22.12 14.92%Florida $3.36 $3.71 10.35%Georgia $9.78 $8.72 -10.79%Guam $8.40 $8.17 -2.79%Hawaii $16.57 $16.90 1.97%Idaho $8.38 $9.38 12.04%Illinois $7.66 $8.24 7.61%Indiana $14.43 $17.61 22.00%Iowa $9.10 $9.33 2.53%Kansas $12.76 $15.44 20.98%Kentucky $10.78 $14.89 38.07%Louisiana $12.47 $13.56 8.67%Maine $7.98 $9.78 22.45%Maryland $14.36 $15.02 4.58%Massachusetts $10.96 $10.77 -1.73%Michigan $14.46 $14.16 -2.08%Minnesota $21.62 $22.80 5.43%Mississippi $5.93 $8.60 45.11%Missouri $6.98 $8.33 19.42%Montana $16.97 $17.10 0.76%Nebraska $15.39 $15.96 3.72%Nevada $9.43 $9.08 -3.71%New Hampshire $12.58 $15.13 20.25%New Jersey $26.94 $28.95 7.47%New Mexico $12.25 $11.42 -6.74%New York $18.50 $19.97 7.97%North Carolina $9.56 $11.42 19.46%North Dakota $27.37 $31.29 14.31%Ohio $10.68 $10.51 -1.61%Oklahoma $11.90 $10.27 -13.71%Oregon $14.39 $16.01 11.28%Pennsylvania $14.58 $14.31 -1.91%Rhode Island $8.90 $8.68 -2.43%South Carolina $7.28 $7.28 0.07%South Dakota $16.22 $17.11 5.48%Tennessee $9.91 $10.24 3.37%Texas $10.19 $10.23 0.38%Utah $14.13 $14.33 1.37%Vermont $20.92 $18.94 -9.45%Virginia $20.50 $22.90 11.68%Virgin Islands $36.59 $36.01 -1.59%Washington $13.52 $14.14 4.55%West Virginia $7.19 $8.69 20.75%Wisconsin $13.45 $17.93 33.29%Wyoming $40.69 $35.35 -13.12%U.S. $13.98 $14.63 4.70%
47
Page 50
TABLE 38: Federal Share of SNAP Certification Costs - FY 2015 - FY 2016
STATEFederal Share of
Certification Costs - FY 2015Federal Share of
Certification Costs - FY 2016PercentChange
Alabama $32,905,681 $34,946,996 6.20%Alaska $8,626,562 $8,706,750 0.93%Arizona $41,429,986 $41,906,016 1.15%Arkansas $29,132,935 $26,872,990 -7.76%California $541,076,514 $517,463,474 -4.36%Colorado $32,000,338 $34,515,724 7.86%Connecticut $21,977,335 $23,033,357 4.81%Delaware $10,931,372 $8,122,689 -25.69%District of Columbia $9,633,312 $10,816,553 12.28%Florida $53,047,583 $49,819,079 -6.09%Georgia $68,188,339 $56,415,537 -17.27%Guam $752,384 $653,293 -13.17%Hawaii $13,805,953 $12,924,959 -6.38%Idaho $4,550,994 $4,810,873 5.71%Illinois $60,985,304 $69,578,973 14.09%Indiana $52,085,918 $52,235,148 0.29%Iowa $15,677,431 $15,348,550 -2.10%Kansas $13,139,060 $14,634,645 11.38%Kentucky $38,492,890 $43,012,742 11.74%Louisiana $52,755,602 $63,936,466 21.19%Maine $5,533,295 $5,627,362 1.70%Maryland $59,119,235 $59,554,791 0.74%Massachusetts $48,247,394 $45,458,414 -5.78%Michigan $112,282,059 $103,022,174 -8.25%Minnesota $39,555,114 $39,079,959 -1.20%Mississippi $16,903,237 $21,146,763 25.10%Missouri $25,676,146 $28,120,719 9.52%Montana $6,319,443 $6,414,156 1.50%Nebraska $10,101,207 $9,743,158 -3.54%Nevada $16,437,638 $16,604,464 1.01%New Hampshire $1,157,107 $1,206,843 4.30%New Jersey $91,659,636 $104,744,320 14.28%New Mexico $22,526,170 $21,768,146 -3.37%New York $226,191,255 $218,110,134 -3.57%North Carolina $73,920,850 $83,262,828 12.64%North Dakota $5,263,859 $5,334,206 1.34%Ohio $40,439,102 $42,307,633 4.62%Oklahoma $32,458,807 $28,160,938 -13.24%Oregon $62,370,557 $68,386,484 9.65%Pennsylvania $127,175,062 $129,487,596 1.82%Rhode Island $2,941,789 $2,887,376 -1.85%South Carolina $16,208,873 $18,391,547 13.47%South Dakota $4,734,112 $5,018,270 6.00%Tennessee $63,211,424 $56,016,998 -11.38%Texas $114,282,741 $115,424,201 1.00%Utah $10,660,981 $10,371,417 -2.72%Vermont $1,624,846 $3,574,163 119.97%Virginia $72,886,990 $73,686,086 1.10%Virgin Islands $3,670,090 $3,298,971 -10.11%Washington $49,842,749 $51,333,240 2.99%West Virginia $10,325,479 $11,672,450 13.05%Wisconsin $25,842,552 $28,772,413 11.34%Wyoming $2,110,603 $1,794,603 -14.97%U.S. $2,502,875,895 $2,509,537,637 0.27%
48
Page 51
TABLE 39: Federal Share of SNAP Certification Costs per Case - FY 2015 - FY 2016
STATEFederal Share of Cert. Costs
per Case per Month - FY 2015Federal Share of Cert. Costs
per Case per Month - FY 2016PercentChange
Alabama $6.56 $7.29 11.04%Alaska $21.03 $20.94 -0.41%Arizona $7.86 $8.18 4.05%Arkansas $11.34 $11.69 3.03%California $21.50 $20.60 -4.21%Colorado $11.44 $12.76 11.58%Connecticut $7.38 $7.84 6.21%Delaware $12.68 $9.52 -24.94%District of Columbia $10.03 $11.89 18.48%Florida $2.20 $2.22 0.88%Georgia $6.77 $5.87 -13.28%Guam $4.03 $3.50 -13.14%Hawaii $12.04 $12.09 0.40%Idaho $4.52 $5.04 11.48%Illinois $4.79 $5.82 21.48%Indiana $11.42 $13.24 15.92%Iowa $7.07 $7.15 1.17%Kansas $8.98 $10.66 18.78%Kentucky $8.70 $11.43 31.39%Louisiana $11.29 $12.62 11.84%Maine $4.39 $4.76 8.44%Maryland $12.17 $12.76 4.82%Massachusetts $8.95 $8.41 -5.97%Michigan $11.34 $11.04 -2.70%Minnesota $13.71 $14.08 2.72%Mississippi $4.76 $6.55 37.66%Missouri $5.37 $6.19 15.39%Montana $9.39 $9.79 4.29%Nebraska $10.83 $10.35 -4.44%Nevada $6.53 $6.23 -4.65%New Hampshire $1.87 $2.09 11.77%New Jersey $16.85 $19.83 17.71%New Mexico $9.13 $8.36 -8.42%New York $11.32 $11.11 -1.81%North Carolina $7.67 $9.11 18.77%North Dakota $17.71 $17.60 -0.63%Ohio $4.12 $4.44 7.89%Oklahoma $9.98 $8.49 -14.87%Oregon $11.76 $13.58 15.47%Pennsylvania $11.54 $11.35 -1.61%Rhode Island $2.43 $2.40 -1.35%South Carolina $3.55 $4.05 13.96%South Dakota $9.14 $9.90 8.37%Tennessee $8.61 $8.52 -1.04%Texas $6.11 $6.06 -0.88%Utah $10.08 $10.02 -0.55%Vermont $3.01 $6.93 130.07%Virginia $15.02 $15.84 5.46%Virgin Islands $24.25 $21.04 -13.27%Washington $7.26 $7.82 7.76%West Virginia $4.73 $5.46 15.38%Wisconsin $5.29 $6.66 25.82%Wyoming $12.68 $10.41 -17.93%U.S. $9.26 $9.60 3.69%
49
Page 52
TABLE 40: SNAP Completed Fair Hearings - FY 2015 - FY 2016
STATE Total Fair Hearings
FY 2015Total Fair Hearings
FY 2016PercentChange
Alabama 137 210 53.28%Alaska 46 37 -19.57%Arizona 1,115 1,480 32.74%Arkansas 288 448 55.56%California 3,510 5,149 46.70%Colorado 208 210 0.96%Connecticut 336 417 24.11%Delaware 124 130 4.84%District of Columbia 59 42 -28.81%Florida 454 425 -6.39%Georgia 73 139 90.41%Guam 23 3 -86.96%Hawaii 32 68 112.50%Idaho 66 115 74.24%Illinois 100 295 195.00%Indiana 1,195 2,148 79.75%Iowa 262 270 3.05%Kansas 390 97 -75.13%Kentucky 67 181 170.15%Louisiana 433 491 13.39%Maine 77 12 -84.42%Maryland 132 213 61.36%Massachusetts 2,526 3,307 30.92%Michigan 3,382 1,486 -56.06%Minnesota 905 407 -55.03%Mississippi 227 236 3.96%Missouri 261 596 128.35%Montana 22 35 59.09%Nebraska 445 697 56.63%Nevada 163 68 -58.28%New Hampshire 22 36 63.64%New Jersey 144 207 43.75%New Mexico 86 112 30.23%New York 7,874 37,879 381.06%North Carolina 483 602 24.64%North Dakota 6 10 66.67%Ohio 9,168 8,864 -3.32%Oklahoma 50 59 18.00%Oregon 123 95 -22.76%Pennsylvania 25,762 40,011 55.31%Rhode Island 17 25 47.06%South Carolina 744 543 -27.02%South Dakota 13 18 38.46%Tennessee 4,147 1,782 -57.03%Texas 1,022 571 -44.13%Utah 44 34 -22.73%Vermont 19 15 -21.05%Virginia 592 541 -8.61%Virgin Islands 12 10 -16.67%Washington 194 27 -86.08%West Virginia 79 123 55.70%Wisconsin 550 570 3.64%Wyoming 4 9 125.00%U.S. 68,213 111,555 63.54%
50
Page 53
TABLE 41: SNAP Recipient Fraud Investigations - FY 2015 - FY 2016
STATETotal Investigations Completed FY 2015
Total InvestigationsCompleted FY 2016
PercentChange
Alabama 1,401 991 -29.26%Alaska 2,526 2,515 -0.44%Arizona 7,848 6,239 -20.50%Arkansas 10,393 821 -92.10%California 159,237 156,858 -1.49%Colorado 2,115 1,014 -52.06%Connecticut 2,842 4,234 48.98%Delaware 4,958 17,205 247.01%District of Columbia 358 1,093 205.31%Florida 41,745 43,290 3.70%Georgia 8,994 13,850 53.99%Guam 240 267 11.25%Hawaii 1,063 977 -8.09%Idaho 2,070 2,587 24.98%Illinois 3,806 1,032 -72.88%Indiana 3,831 4,106 7.18%Iowa 4,496 5,644 25.53%Kansas 2,631 2,694 2.39%Kentucky 479 668 39.46%Louisiana 1,519 1,635 7.64%Maine 241 509 111.20%Maryland 573 294 -48.69%Massachusetts 11,080 7,442 -32.83%Michigan 39,638 40,716 2.72%Minnesota 7,429 7,852 5.69%Mississippi 2,896 3,441 18.82%Missouri 503 5,373 968.19%Montana 637 1,162 82.42%Nebraska 458 967 111.14%Nevada 6,173 7,481 21.19%New Hampshire 1,286 1,236 -3.89%New Jersey 18,760 25,261 34.65%New Mexico 69 40 -42.03%New York 257,589 450,976 75.08%North Carolina 10,660 4,883 -54.19%North Dakota 134 350 161.19%Ohio 21,465 20,697 -3.58%Oklahoma 601 1,409 134.44%Oregon 2,203 3,680 67.04%Pennsylvania 21,795 27,936 28.18%Rhode Island 751 367 -51.13%South Carolina 7,524 5,436 -27.75%South Dakota 305 344 12.79%Tennessee 7,891 7,422 -5.94%Texas 1,502 1,601 6.59%Utah 2,215 2,289 3.34%Vermont 497 538 8.25%Virginia 13,194 15,972 21.06%Virgin Islands 911 661 -27.44%Washington 10,006 1,013 -89.88%West Virginia 3,044 37,559 1133.87%Wisconsin 8,234 10,861 31.90%Wyoming 295 477 61.69%U.S. 723,111 963,965 33.31%
51
Page 54
TABLE 42: SNAP Total Disqualifications - FY 2015 - FY 2016
STATETotal Disqualifications
FY 2015Total Disqualifications
FY 2016Percent Change
Alabama 1,448 819 -43.44%Alaska 149 137 -8.05%Arizona 184 175 -4.89%Arkansas 287 284 -1.05%California 3,309 3,812 15.20%Colorado 256 1,032 303.13%Connecticut 333 444 33.33%Delaware 186 388 108.60%District of Columbia 9 122 1255.56%Florida 1,999 2,482 24.16%Georgia 3,068 4,365 42.28%Guam 140 0 -100.00%Hawaii 250 336 34.40%Idaho 147 430 192.52%Illinois 1,626 1,559 -4.12%Indiana 14 507 3521.43%Iowa 97 60 -38.14%Kansas 536 416 -22.39%Kentucky 188 1,879 899.47%Louisiana 1,287 1,394 8.31%Maine 81 510 529.63%Maryland 215 342 59.07%Massachusetts 651 365 -43.93%Michigan 4,609 4,002 -13.17%Minnesota 610 229 -62.46%Mississippi 3,107 3,724 19.86%Missouri 802 1,232 53.62%Montana 503 761 51.29%Nebraska 121 189 56.20%Nevada 438 515 17.58%New Hampshire 155 126 -18.71%New Jersey 552 694 25.72%New Mexico 83 43 -48.19%New York 2,450 3,448 40.73%North Carolina 3,297 2,008 -39.10%North Dakota 126 244 93.65%Ohio 2,231 2,611 17.03%Oklahoma 545 593 8.81%Oregon 860 645 -25.00%Pennsylvania 1,093 1,355 23.97%Rhode Island 22 19 -13.64%South Carolina 1,263 1,908 51.07%South Dakota 178 182 2.25%Tennessee 1,529 2,237 46.30%Texas 1,010 1,334 32.08%Utah 904 773 -14.49%Vermont 225 314 39.56%Virginia 1,449 2,134 47.27%Virgin Islands 278 217 -21.94%Washington 104 198 90.38%West Virginia 281 447 59.07%Wisconsin 1,214 1,859 53.13%Wyoming 15 31 106.67%U.S. 46,514 55,930 20.24%
52
Page 55
TABLE 43: Newly Established SNAP Recipient Claim Dollars - FY 2015 - FY 2016
STATETotal Claims Established
FY 2015Total Claims Established
FY 2016PercentChange
Alabama $9,375,542 $8,550,479 -8.80%Alaska $1,013,207 $862,664 -14.86%Arizona $3,492,350 $3,833,045 9.76%Arkansas $2,191,039 $1,918,328 -12.45%California $230,712,538 $247,525,800 7.29%Colorado $12,110,771 $9,120,394 -24.69%Connecticut $2,280,491 $2,545,786 11.63%Delaware $3,465,795 $3,542,230 2.21%District of Columbia $1,251,323 $1,443,493 15.36%Florida $33,157,034 $37,087,321 11.85%Georgia $13,831,131 $14,422,386 4.27%Guam $289,766 $215,071 -25.78%Hawaii $3,157,878 $3,397,493 7.59%Idaho $1,524,318 $1,014,860 -33.42%Illinois $42,708,018 $49,137,392 15.05%Indiana $11,769,110 $17,941,944 52.45%Iowa $1,702,744 $2,575,164 51.24%Kansas $3,877,923 $2,647,710 -31.72%Kentucky $9,424,440 $11,866,320 25.91%Louisiana $3,607,357 $3,848,845 6.69%Maine $3,148,079 $3,534,713 12.28%Maryland $3,572,028 $3,493,163 -2.21%Massachusetts $9,210,150 $10,321,051 12.06%Michigan $20,486,093 $18,920,911 -7.64%Minnesota $9,120,104 $7,243,408 -20.58%Mississippi $6,739,123 $10,161,356 50.78%Missouri $2,587,933 $3,015,025 16.50%Montana $1,643,348 $2,233,694 35.92%Nebraska $1,575,428 $2,025,122 28.54%Nevada $2,283,031 $2,693,652 17.99%New Hampshire $833,392 $724,630 -13.05%New Jersey $9,595,280 $10,299,404 7.34%New Mexico $3,373,767 $3,856,334 14.30%New York $15,629,749 $15,943,380 2.01%North Carolina $20,221,103 $20,138,593 -0.41%North Dakota $421,155 $677,376 60.84%Ohio $20,892,391 $19,644,316 -5.97%Oklahoma $2,012,841 $2,049,183 1.81%Oregon $8,542,222 $5,636,263 -34.02%Pennsylvania $14,253,927 $16,021,006 12.40%Rhode Island $513,482 $561,103 9.27%South Carolina $14,359,034 $14,201,394 -1.10%South Dakota $1,152,864 $1,015,025 -11.96%Tennessee $15,656,396 $12,433,936 -20.58%Texas $37,476,585 $40,308,245 7.56%Utah $2,496,724 $3,431,371 37.43%Vermont $725,332 $787,723 8.60%Virginia $6,871,787 $6,249,425 -9.06%Virgin Islands $435,492 $569,701 30.82%Washington $6,355,616 $8,702,430 36.93%West Virginia $2,650,910 $3,186,021 20.19%Wisconsin $11,078,003 $10,270,520 -7.29%Wyoming $239,174 $351,693 47.04%U.S. $647,095,316 $684,197,891 5.73%
53
Page 56
TABLE 44: SNAP Recipient Claims Collected - FY 2015 - FY 2016
STATETotal Claims Collected
FY 2015Total Claims Collected
FY 2016PercentChange
Alabama $5,040,270 $6,071,783 20.47%Alaska $666,754 $715,436 7.30%Arizona $2,365,657 $2,514,196 6.28%Arkansas $1,313,207 $1,230,736 -6.28%California $91,954,742 $121,506,997 32.14%Colorado $8,867,667 $7,830,232 -11.70%Connecticut $1,081,799 $1,319,519 21.97%Delaware $2,266,654 $2,292,195 1.13%District of Columbia $721,368 $894,507 24.00%Florida $18,648,505 $20,592,754 10.43%Georgia $10,543,394 $9,835,560 -6.71%Guam $179,467 $248,183 38.29%Hawaii $1,689,770 $1,883,435 11.46%Idaho $997,451 $1,086,154 8.89%Illinois $25,343,535 $27,655,379 9.12%Indiana $3,135,801 $3,466,325 10.54%Iowa $1,246,325 $1,281,366 2.81%Kansas $1,970,205 $1,911,335 -2.99%Kentucky $7,058,074 $7,578,171 7.37%Louisiana $2,579,162 $2,916,134 13.07%Maine $1,363,083 $1,737,891 27.50%Maryland $2,135,323 $2,259,268 5.80%Massachusetts $4,332,625 $5,522,128 27.45%Michigan $11,039,091 $10,622,586 -3.77%Minnesota $6,375,606 $6,616,758 3.78%Mississippi $4,327,688 $5,531,474 27.82%Missouri $2,725,686 $2,499,271 -8.31%Montana $931,741 $893,483 -4.11%Nebraska $1,272,864 $1,400,625 10.04%Nevada $1,104,867 $1,179,383 6.74%New Hampshire $735,511 $600,952 -18.29%New Jersey $8,133,164 $7,641,658 -6.04%New Mexico $1,836,041 $2,445,566 33.20%New York $10,254,636 $11,111,975 8.36%North Carolina $10,930,914 $12,266,485 12.22%North Dakota $376,092 $461,297 22.66%Ohio $13,261,537 $13,732,220 3.55%Oklahoma $1,429,807 $1,410,457 -1.35%Oregon $5,501,735 $6,474,303 17.68%Pennsylvania $11,031,889 $10,290,310 -6.72%Rhode Island $262,136 $277,492 5.86%South Carolina $8,067,306 $8,905,171 10.39%South Dakota $709,153 $856,731 20.81%Tennessee $11,048,594 $11,438,304 3.53%Texas $38,222,463 $30,853,506 -19.28%Utah $2,016,319 $1,845,981 -8.45%Vermont $766,056 $665,303 -13.15%Virginia $5,354,187 $5,321,443 -0.61%Virgin Islands $306,809 $341,199 11.21%Washington $3,902,159 $4,564,925 16.98%West Virginia $2,315,575 $2,149,306 -7.18%Wisconsin $6,584,975 $7,094,540 7.74%Wyoming $173,899 $164,818 -5.22%U.S. $366,499,338 $402,007,206 9.69%
54
Page 57
TABLE 45: SNAP Total Participation and Issuance - FY 2010 - 2016FY 2010 FY 2011 FY 2012 FY 2013 FY 2014 FY 2015 FY 2016
Persons Participating (monthly average, in millions) 40.3 44.7 46.6 47.6 46.5 45.8 44.2Households Participating (monthly average, in millions) 18.6 21.1 22.3 23.1 22.7 22.5 21.8Total Issuance (in millions) $64,704 $71,811 $74,619 $76,066 $70,000 $69,655 $66,539Average Monthly Benefit per Person $133.79 $133.85 $133.41 $133.07 $125.35 $126.83 $125.40Average Monthly Benefit per Household $289.61 $284.00 $278.48 $274.98 $256.98 $257.73 $254.61
TABLE 46: SNAP Recipient Fraud Investigations - FY 2010 - 2016FY 2010 FY 2011 FY 2012 FY 2013 FY 2014 FY 2015 FY 2016
Investigations Completed 784,430 797,828 729,742 709,112 641,005 723,111 963,965Fraud Dollars Determined by Investigations (in millions) $260.4 $261.6 $367.1 $392.5 $364.0 $431.6 $592.7
TABLE 47: SNAP Recipient Disqualification Activity - FY 2010 - 2016FY 2010 FY 2011 FY 2012 FY 2013 FY 2014 FY 2015 FY 201613,869 14,372 13,350 16,188 17,052 19,910 24,92518,132 19,305 18,112 19,670 21,987 20,320 24,381
$48.7 $48.6 $54.4 $68.9 $70.4 $75.3 $100.6
Administrative Disqualification Hearings (ADHs) CompletedADHs WaivedProgram Loss Associated with ADH Convictions & Waivers (millions) Persons Disqualified by ADH Conviction or ADH Waiver 30,815 32,395 30,359 34,514 36,943 38,689 46,953
6,084 5,839 5,432 5,407 4,979 5,075 5,2057,955 8,468 6,849 4,143 3,513 2,913 3,882$34.4 $35.9 $39.5 $32.0 $24.6 $25.0 $35.8
Prosecutions CompletedDisqualification Consent Agreements (DCAs)Program Loss Assoc'd with Prosecution Convictions & DCAs (millions) Persons Disqualified by Prosecution Conviction or DCA 13,668 13,974 12,078 9,237 8,259 7,825 8,977
44,483 46,369 42,437 43,751 45,202 46,514 55,930Total DisqualificationsProgram Loss Associated with Disqualifications (millions) $83.1 $84.6 $93.9 $100.8 $95.0 $100.2 $136.5
55
Page 58
TABLE 48: SNAP Newly Established Recipient Claims - FY 2010 - 2016FY 2010 FY 2011 FY 2012 FY 2013 FY 2014 FY 2015 FY 2016
Fraud Claims Established (in millions) $38.3 $40.5 $49.3 $57.9 $59.5 $58.6 $73.4Household Error Claims Established (in millions) $275.9 $320.7 $330.0 $351.5 $381.0 $397.2 $421.9Agency Error Claims Established (in millions) $145.5 $159.7 $154.8 $144.1 $134.5 $191.3 $188.9Total Claims Established (in millions) $459.7 $520.9 $534.1 $553.4 $575.0 $647.1 $684.2Average New Fraud Claim Amount $2,109 $2,310 $2,487 $2,660 $2,706 $2,488 $2,425Average New Household Error Claim Amount $704 $741 $757 $833 $1,011 $1,042 $1,069Average New Agency Error Claim Amount $341 $337 $335 $364 $403 $399 $411Average New Claim Amount (all types) $549 $564 $582 $659 $784 $732 $774
TABLE 49: SNAP Collected Recipient Claims (in millions) - FY 2010 - 2016FY 2010 FY 2011 FY 2012 FY 2013 FY 2014 FY 2015 FY 2016
Fraud Claims Collected $67.2 $72.0 $74.0 $75.2 $77.7 $86.0 $89.6Household Error Claims Collected $143.7 $156.7 $168.8 $175.7 $178.8 $194.4 $210.8Agency Error Claims Collected $76.4 $85.0 $85.4 $87.8 $83.5 $86.1 $101.6Total Claims Collected $287.3 $313.7 $328.1 $338.7 $340.0 $366.5 $402.0State Share of Collected Claims $52.3 $56.6 $59.7 $61.5 $62.9 $69.0 $73.5Federal Share of Collected Claims $235.0 $257.2 $268.5 $277.2 $277.0 $297.5 $328.5Recouped Claims $149.9 $153.8 $153.4 $158.5 $145.6 $143.6 $155.3Treasury Offset Program $86.7 $104.6 $104.6 $122.5 $136.4 $156.4 $166.0Other Collection Methods and Refunds $50.7 $55.3 $70.1 $57.7 $57.9 $66.5 $80.6
• Totals may not add due to rounding. • Some states establish all non-agency error claims as household error claims initially and then transfer the claim from household error to fraud after the prosecution or ADH. Therefore, the sum of the fraud associated with disqualifications is a better measure of the ultimate amount of fraud claims than the newly established amount.
56
Page 59
END NOTES
STATE PARTICIPATION AND ISSUANCE
States report participation data on the FNS-388 reports and issuance data on the FNS-46. Average monthly participation and household participation in this report may not add for the national total due to rounding. The total participation data in this report is the average monthly participation from all States for the fiscal year (12-month average).
ADMINISTRATIVE COSTS
Administrative Cost data cited in this section is derived from the SF-425;
FAIR HEARINGS
Fair Hearings data cited in this section is derived from the FNS-366B.
FRAUD INVESTIGATIONS, PROSECUTIONS, AND ADMINISTRATIVE DISQUALIFICATION HEARINGS
Fraud Investigations, Prosecutions, and Administrative Disqualification Hearings data cited in this section is derived from the FNS-366B.
RECIPIENT CLAIMS
Claims data cited in this section is derived from the FNS-209; Federal debt collection data is derived from the FNS Federal Debt Collection Biweekly Collection Report. All recoupment amounts are included in collections data.
Data on new claims established is included in Tables 24 and 25. When referring to data in these tables it should be noted that some States show no or low fraud claims newly established because they establish such claims as inadvertent household error and subsequently transfer the claim to fraud after the court or hearing officer’s determination. Therefore we recommend that the data in Tables 20 and 22(amount of program loss associated with disqualifications from prosecutions and administrative disqualification hearings) be used as a better measure of the amount of fraud claims ultimately established.
57
Page 60
END NOTES
Data included in Table 27 (Recipient Claims Collected - by Method) includes total claims collected through various means including Federal Debt.
Calculations for other means of collection employed by State agencies include all State methods except for recoupment and Federal collections from the Treasury Offset Program minus all refunds and negative adjustments.
Calculations for Federal Debt Collection amounts include Treasury Offset Program collections but not voluntary payments and offset fees paid by the client. Some offsets are subject to refunds.
RANKINGS OF PARTICIPATION AND ISSUANCE
Please refer to the explanations above for the sources of various data cited in this section. Note that totals for persons and households may not add due to rounding.
COMPARISON TO PRIOR YEARS
Please refer to the explanations above for the sources of various data cited in this section.
58