1 AES Supplemental Study of Dissolved Nutrients and Particulate Organic Matter: 10/06/08 Supplemental study of dissolved nutrients and particulate organic matter in the waters near the proposed mussel farm in North Totten Inlet, Washington State, USA Kenneth M. Brooks, Aquatic Environmental Sciences, 644 Old Eaglemount Road, Port Townsend, WA 98368. Phone and Fax 9360) 732-4464. Email: [email protected]Abstract. Mussels and oysters are efficient filter feeds that prefer living phytoplankton but will also consume detritus when the former is in low supply. Many mussel and oyster producing areas of the world rely on external sources of phytoplankton brought into bays, sounds and estuaries from larger waterbodies on flood tides. Bivalve carrying capacity is frequently defined in terms of the biomass of cultured organisms that can optimally be maintained without depleting particular organic matter to the point where the cultures are adversely affected. This approach assumes that cultured stocks are sentinels of the health of the larger ecosystem. Water samples were collected on ebb and flood tides near the mouth of Totten Inlet to assess existing demands for phytoplankton and POM as an aid to determining the inlet’s bivalve carrying capacity. The resulting data indicated that Totten Inlet was a net consumer of dissolved nutrients (NH 4 + , NO 2 , NO 3 and PO 4 ). Chlorophyll concentrations were higher on ebb tides than on flood tides suggesting that the inlet was a net producer of phytoplankton, but the differences were not statistically significant. The waters of Totten Inlet contained higher concentrations of total volatile solids than any other bivalve producing area for which data was available. A comparison of mussel growth rates with chlorophyll a and TVS concentrations suggests that detrital forms of organic carbon are important for sustaining bivalve growth during winter when primary production is light limited in the Pacific Northwest. It is suggested that a waterbody is below its bivalve carrying capacity as long as it is not a significant net consumer of chlorophyll a and/or detritus measured on flood and ebb tides. The nutrient, chlorophyll a and TVS data are used to run several carrying capacity models, which suggest that when the new mussel farm is at full production, Totten Inlet will be at about 10% of its filter feeding carrying capacity. The results of these studies are used to propose a technologically accessible, inexpensive and efficient pat for long-term monitoring of simple waterbodies where intensive bivalve culture is undertaken. 1.0 Background. Benthic effects associated with suspended bivalve culture are generally localized to an area within a few tens of meters of the long-lines or rafts. Brooks (2006) reviewed this issue and Brooks (2005b) described localized effects at the Deepwater Point and Gallagher Cove mussel farms in Totten Inlet. Bivalves, particularly oysters and mussels, are efficient filter feeders that on an individual basis are capable of clearing seston from one to four liters of water per hour (Bayne, 1976). Newell (1988) concluded that oysters cleared the entire volume of Chesapeake Bay every 3.3 days in 1870. By 1988, over-harvesting, pollution and disease had reduced oyster populations to the point where it took 325 days to clear the water. In 1988, the unfiltered phytoplankton biomass increased water turbidity to a point where the biomass of submerged aquatic vegetation was reduced. These effects resonated throughout the estuary’s food webs with significant adverse effects. The importance of bivalves for stabilizing estuaries is well recognized (Herman and Scholten, 1990) and numerous authors (Haamer, 1996; Newell, In-Review; Rice, In-Review) have hypothesized that healthy bivalve populations can control eutrophication, which is becoming an increasing problem in coastal environments associated with residential development and agriculture.
Transcript
1 AES Supplemental Study of Dissolved Nutrients and Particulate Organic Matter: 10/06/08
Supplemental study of dissolved nutrients and particulate organic matter in the waters near the proposed mussel farm in North Totten Inlet, Washington State, USA
Kenneth M. Brooks, Aquatic Environmental Sciences, 644 Old Eaglemount Road, Port Townsend, WA 98368. Phone and Fax 9360) 732-4464. Email: [email protected] Abstract. Mussels and oysters are efficient filter feeds that prefer living phytoplankton but will also consume detritus when the former is in low supply. Many mussel and oyster producing areas of the world rely on external sources of phytoplankton brought into bays, sounds and estuaries from larger waterbodies on flood tides. Bivalve carrying capacity is frequently defined in terms of the biomass of cultured organisms that can optimally be maintained without depleting particular organic matter to the point where the cultures are adversely affected. This approach assumes that cultured stocks are sentinels of the health of the larger ecosystem. Water samples were collected on ebb and flood tides near the mouth of Totten Inlet to assess existing demands for phytoplankton and POM as an aid to determining the inlet’s bivalve carrying capacity. The resulting data indicated that Totten Inlet was a net consumer of dissolved nutrients (NH4
+, NO2, NO3 and PO4). Chlorophyll concentrations were higher on ebb tides than on flood tides suggesting that the inlet was a net producer of phytoplankton, but the differences were not statistically significant. The waters of Totten Inlet contained higher concentrations of total volatile solids than any other bivalve producing area for which data was available. A comparison of mussel growth rates with chlorophyll a and TVS concentrations suggests that detrital forms of organic carbon are important for sustaining bivalve growth during winter when primary production is light limited in the Pacific Northwest. It is suggested that a waterbody is below its bivalve carrying capacity as long as it is not a significant net consumer of chlorophyll a and/or detritus measured on flood and ebb tides. The nutrient, chlorophyll a and TVS data are used to run several carrying capacity models, which suggest that when the new mussel farm is at full production, Totten Inlet will be at about 10% of its filter feeding carrying capacity. The results of these studies are used to propose a technologically accessible, inexpensive and efficient pat for long-term monitoring of simple waterbodies where intensive bivalve culture is undertaken. 1.0 Background. Benthic effects associated with suspended bivalve culture are generally localized to an area within a few tens of meters of the long-lines or rafts. Brooks (2006) reviewed this issue and Brooks (2005b) described localized effects at the Deepwater Point and Gallagher Cove mussel farms in Totten Inlet. Bivalves, particularly oysters and mussels, are efficient filter feeders that on an individual basis are capable of clearing seston from one to four liters of water per hour (Bayne, 1976). Newell (1988) concluded that oysters cleared the entire volume of Chesapeake Bay every 3.3 days in 1870. By 1988, over-harvesting, pollution and disease had reduced oyster populations to the point where it took 325 days to clear the water. In 1988, the unfiltered phytoplankton biomass increased water turbidity to a point where the biomass of submerged aquatic vegetation was reduced. These effects resonated throughout the estuary’s food webs with significant adverse effects. The importance of bivalves for stabilizing estuaries is well recognized (Herman and Scholten, 1990) and numerous authors (Haamer, 1996; Newell, In-Review; Rice, In-Review) have hypothesized that healthy bivalve populations can control eutrophication, which is becoming an increasing problem in coastal environments associated with residential development and agriculture.
2 AES Supplemental Study of Dissolved Nutrients and Particulate Organic Matter: 10/06/08
Brooks (2006) reviewed available models and used them together with historical water quality data from Totten Inlet to estimate that when the proposed mussel farm in North Totten Inlet was at full production, the estuary would be at 10 percent of its carrying capacity. As used here, carrying capacity is defined as the biomass of cultured bivalves that can be produced in a water-body without adversely affecting growth and/or survival of the cultured animals. It assumes that if the cultured populations are maintained at optimum density, then other resources dependent on particulate organic matter will not be adversely affected. In other words, it assumes that the cultured population is a sentinel that represents all filter feeding communities in the estuary. The results of water column monitoring at the site of the proposed North Totten mussel farm in 2002 suggested that Totten Inlet was a net consumer of nutrients brought into the estuary on flood tides and a net exporter of phytoplankton on ebb tides. In July 2002, triplicate water samples were collected on flood and ebb stages of a single tide to more rigorously address this question. Chlorophyll a concentrations on the ebb tide (8.05 µg/L) were marginally significantly higher (t = 3.07; p = 0.055) than on the flood tide (6.33 µg/L). If Totten Inlet is not a significant net consumer of phytoplankton in South Puget Sound then it can be argued that any water column effects are localized within the estuary and that bivalve culture there is not depleting phytoplankton resources important to filter feeders outside its mouth. In addition, if minimum chlorophyll α concentrations in the inlet are at or above minimum values observed in Puget Sound where bivalves are not cultured, then it can be argued that bivalve culture in Totten Inlet is not significantly adversely affecting other filter feeding resources. Perhaps more importantly, comparing nutrient and particulate organic carbon (POM = phytoplankton and suspended detritus) on flood and ebb tides may provide an inexpensive and technologically assessable method for monitoring the carrying capacity of bivalve culture areas in many parts of the world. It can be argued that an estuary is not necessarily near its carrying capacity if concentrations of chlorophyll a and POM on ebb tides are not significantly lower than concentrations on the flood tide. The converse is not necessarily true and several arguments can be made to demonstrate that an estuary that is a net consumer of (POM) is not necessarily at or near its carrying capacity. Thus net consumption of POM is a necessary condition for exceeding carrying capacity, but it is not a sufficient condition. From a management point of view, this is a screening test. If the test is failed, then additional information should be required to estimate and monitor the inlet’s carrying capacity. To test the hypotheses that Totten Inlet is a net consumer of nutrients and a net producer of phytoplankton in South Puget Sound, water samples were collected from August through December of 2005 three hours before and after slack tides. This report describes the results of these additional water quality assessments and discusses their implications for estimating the estuary’s bivalve carrying capacity. This report is not intended as a stand alone document, but as a supplement to Brooks (2006) and Gardiner et al. (2007). 2.0. Materials and methods. Four water samples were collected each month at the proposed North Totten Inlet mussel farm site between March 22, 2002 and June 2, 2003 and at the existing Deepwater Point mussel farm during the spring and summer of 2002. An additional six samples (three each on ebb and flood tides) were collected on July 10, 2002 at North Totten and at the Deepwater Point reference location. Temperature, salinity, dissolved oxygen, Chla, TSS, TVS, proportion TVS, PO4, SiO4, NO3, NO2, NH4, and turbidity were measured. All 2002 and 2003
3 AES Supplemental Study of Dissolved Nutrients and Particulate Organic Matter: 10/06/08
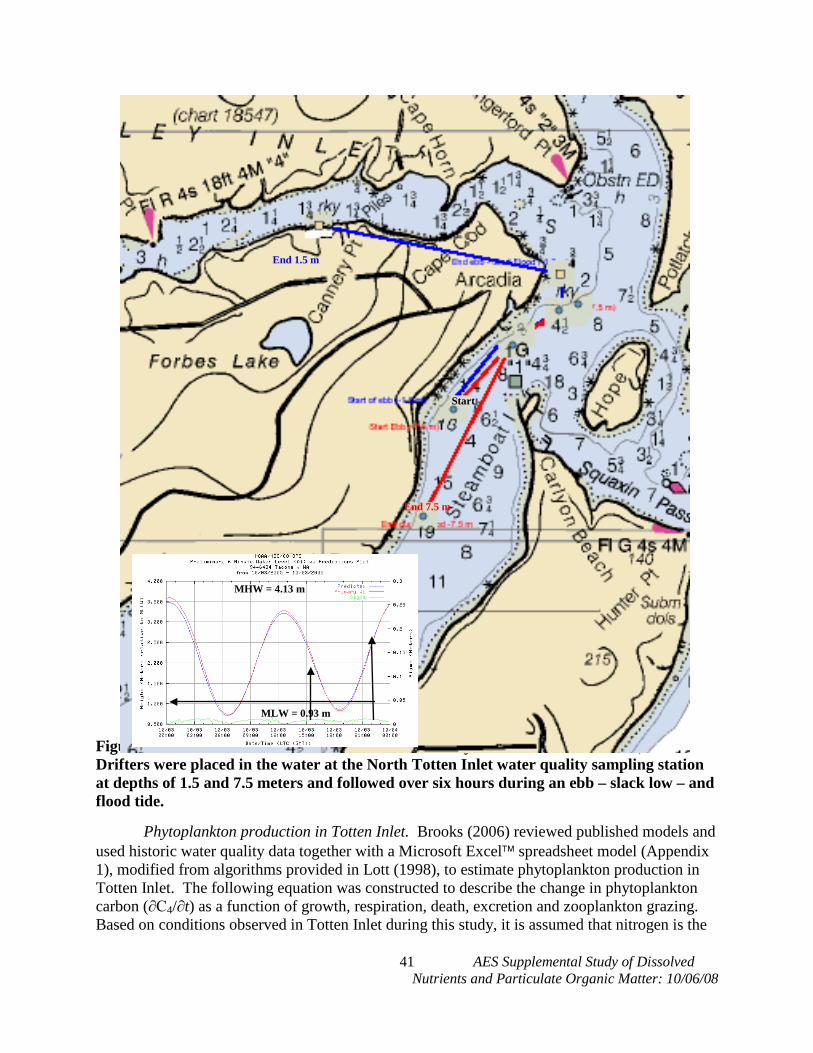
samples were collected at a depth of 1.5 m. In 2005, triplicate water samples were collected at a fixed station located inside the mouth of Totten Inlet at depths of 1.5, 7.5 and 15 m every two weeks between August 24 and December 12. Samples were collected three hours before and three hours after the same slack tide to assess consumption or suspended organic matter by existing filter feeding resources in the inlet. In addition, salinity and temperature were measured at 1.0 m intervals between depths of 0.5 and 14.5 m at the North Totten Station and at a station located in Squaxin Passage to assess the presence and degree of stratification. These sample stations are described in Figure 1. Sample dates and numbers of samples are listed in Table 1.
Figure 1. Location of the North Totten mussel farm and water sampling stations examined at two week intervals between August 24 and December 12, 2005.
2.1. Sample collection. Water samples were collected using a Kemmerer water bottle with Teflon seals near the canister buoy placed in the center of the proposed mussel farm. The North Totten and Squaxin sample stations were located using GPS. The contents of the Kemmerer water bottle were emptied into precleaned and pre-labeled one-liter HDPE bottles, which were stored on ice in a cooler until returned to AES for processing the same day.
2.2. Temperature and salinity were measured in-situ using a YSI 33M SCT meter in
accordance with APHA 2520 B. The meter was calibrated at 30 PSU (7.5 grams of sea salt dissolved in 250 ml of distilled water) prior to each series of measurements.
North Totten
Mouth of North Totten
Squaxin
4 AES Supplemental Study of Dissolved Nutrients and Particulate Organic Matter: 10/06/08
Table 1. Sampling dates on which water samples were collected in Totten Inlet for analysis of chlorophyll, phaeopigments, TVS, TSS, salinity and temperature. The number of samples collected and analyzed is provided in each cell. The stage of the tide (ebb or flood) is provided together with the tidal exchange (feet) during sampling. Negative exchanges are ebb tides and positive exchanges are flood tides. Date Location Depth(s) (m) & tide exchange (ft) Pigment TSS/TVS Sal. & Temp. March 22, 2002 NT mussel farm 1.5, 5.0, 8.0, 10.0 (ebb, – 11.6’) 4 4 4 April 27, 2002 NT mussel farm 1.5 (flood +16.3’) 4 4 4 May 27, 2002 NT mussel farm 1.5 (flood , +18.7’) 4 4 4 July 10, 2002 NT mussel farm 1.5 (ebb, -16.3’ & flood, +18.2’) 6 6 6 July 22, 2002 NT mussel farm 1.5 (flood, +17.0’) 4 4 4 August 27, 2002 NT mussel farm 1.5 (flood, +10.6’) 4 4 4 October 9, 2002 NT mussel farm 1.5 (ebb, -9.9’) 4 4 4 December 3, 2002 NT mussel farm 1.5 (flood, +8.1’) 4 4 4 January 23, 2003 NT mussel farm 1.5 (not recorded, tide exchange was -11.9’ & +7.0’) 4 4 March 5, 2003 NT mussel farm 1.5 (not recorded, tide exchange was -8.8 & +7.1’) 4 4 April 10, 2003 NT mussel farm 1.5 (not recorded, tide exchange was -12.6’ & +12.6’) 4 4 June 2, 2003 NT mussel farm 1.5 (not recorded, tide exchange was -14.4 & +16.6’) 4 4 August 24, 2005 North Totten & Squaxin 1.5, 7.5 & 15.0 (ebb -8.2’ & flood, +10.9’) 18 18 57 August 24, 2005 Little Skookum 1.5 @ +9.5’ MLLW 3 3 3 September 2, 2005 North Totten & Squaxin 1.5, 7.5 & 15.0 (ebb, -11.9’ and flood, +13.2’) 18 18 57 September 19, 2005 North Totten & Squaxin 1.5, 7.5 & 15.0 (ebb, -12.5’ and flood, +13.6’) 18 18 57 October 3, 2005 North Totten & Squaxin 1.5, 7.5 & 15.0 (ebb, -9.5’ and flood, +10.8’) 18 18 57 October 17, 2005 North Totten & Squaxin 1.5, 7.5 & 15.0 (ebb, -10.3’ and flood, +11.8’) 18 18 57 November 22, 2005 North Totten & Squaxin 1.5, 7.5 & 15.0 (ebb, -12.8’ and flood, +14.1’) 18 18 57 December 12, 2005 North Totten & Squaxin 1.5, 7.5 & 15.0 (ebb, -5.2 and flood<7.2) 18 18 57
2.2. Dissolved oxygen was measured in-situ during 2002 in accordance with APHA 4500-O G using a YSI Model 57 dissolved oxygen meter with a 15.2 m cabled probe. The probe was calibrated in water-saturated air immediately prior to each set of measurements.
2.3. Turbidity was measured during 2002 in accordance with APHA Method 2130 B using a LaMotte Model 2008 Turbidity meter. The nephelometer was calibrated prior to each analysis.
2.4. Nutrients. A 50 ml subsample was filtered on surfactant free 0.2 µM SFCA syringe filters using a 60 cc syringe and 45 ml placed in new pre-labeled 60 ml HDPE sample bottles. The samples were immediately frozen (-30 oC) and shipped to the University of Washington Oceanographic Laboratory the next day using an overnight delivery service. The holding time for ammonia-N is 7 days, the holding time for nitrite, nitrate, silicate and phosphate is 28 days in the frozen state. Analyses were accomplished in accordance with Parsons et al. (1984) using an autoanalyzer. 2.5. Chlorophyll a. Bulk samples were inverted 25 times and 250 ml filtered in the laboratory on 0.45 µm, 2.4 cm diameter, GF/A microfiber filters. The filter was removed from the apparatus using tweezers, folded over to enclose the retained material, placed in 15 ml Sarstedt plastic centrifuge tubes that had been rinsed three times in distilled water, and immediately frozen. Frozen samples, with a holding time of 30 days, were sent via overnight express shipment to the University of Washington for analysis.
5 AES Supplemental Study of Dissolved Nutrients and Particulate Organic Matter: 10/06/08
2.6. Total Suspended Solids. Forty-five micron GFA filters and aluminum boats were pre-combusted at 550 oC for 30 minutes and tared prior to use. TSS was determined by filtering 350 ml of the bulk water sample through a 45 µm glass fiber filter in accordance with APHA 2540 D. Retained residue was washed with three successive 10 ml aliquots of distilled water to remove salt. The filter and residue were dried at 103 + 2 oC for one hour or until no further weight loss (maximum of 4%) was recorded in subsequent weighings. The residue and filter were weighed after cooling in a desiccator to room temperature. 2.7. Total Volatile Solids. TVS was determined after completing the TSS analysis in accordance with APHA 208G. The dried glass filter and residue were combusted in a muffle furnace at 550 + 50 oC for 15 minutes. They were then cooled in the muffle furnace to < 100 oC and transferred to a desiccator for further cooling to room temperature and weighed to the nearest 0.1 mg. The difference between the dried and combusted weights was calculated as a percent of the dry residue weight to determine TVS. 3.0. Results and discussion. Detailed results for all analyses are provided in Appendix 1. Summary statistics for the entire period are provided in Table 2. Dissolved oxygen was generally high (9.6 to 14.5 mg/L) in the mouth of the inlet and will not be discussed further. Table 2. Summary statistics describing physicochemical variables measured in surface waters (1.5 m, 7.5 and 15.0 m depths) at all North Totten Inlet sites during flood and ebb tides between March 22, 2002 and December 12, 2005. Nitrogen, phosphorus and silicon concentrations are for the N, P and Si content in each of the listed compounds.
Descriptive Statistics (Totten Water Quality Data)Variable
3.1. Temperature. Stratification can hold phytoplankton above the compensation depth
in the euphotic zone enhancing the potential for blooms and depletion of nutrients in surface water. Temperature and salinity data collected in 2005 at 1.5, 7.5 and 15.0 m depths at the mouth of Totten Inlet on ebb and flood tides are summarized in Table 3. Differences in temperature over the depth of the water column were small averaging 0.4 oC. The highest difference (∆T = 1.5 oC) occurred in August on an ebb tide. Other differences were < 1 oC and
6 AES Supplemental Study of Dissolved Nutrients and Particulate Organic Matter: 10/06/08
analysis of variance with depth and tide as factors did not reveal any significant differences. Temperatures, measured in 1.0 m depth intervals, are summarized in Figure 3. Differences in temperature were generally restricted to the upper three or four meters of the water column and they were greatest in August 2005. The degree of thermal stratification declined as the water cooled in the fall. Table 3. Summary of temperature and salinity data collected at 1.0 m depth intervals inside the mouth of Totten Inlet between August 24 and December 12, 2005.
Breakdown Table of Descriptive Statistics Mouth of North Totten Water Quality Data)N=203 (No missing data in dep. var. list)
7 AES Supplemental Study of Dissolved Nutrients and Particulate Organic Matter: 10/06/08
Figure 2. Summary of temperature as a function of water depth and month during 2005 at the mouth of North Totten Inlet water column sampling station described in Figure 2.
8 AES Supplemental Study of Dissolved Nutrients and Particulate Organic Matter: 10/06/08
3.2. Salinity was generally stable with a mean and 95% confidence interval of 29.1 + 0.1 and a range of 24.5 to 30.8 practical salinity units (PSU). Salinity is displayed in Figure 3 as a function of water depth in meters. In general the differences as a function of depth on any particular date were < 0.5 PSU. The greatest difference in salinity (∆S = 0.6 PSU) occurred in November 2005.
Figure 3. Summary of salinity (PSU) as a function of water depth (m) and month during 2005 at the mouth of North Totten Inlet water column sampling station described in Figure 2. 3.3. Total Suspended Solids. Total suspended solids as a function of sample date are summarized in Figure 4. In 2002 TSS gradually increased from March 22 until July 10 when it peaked at 44.3 mg/L and then declined to ca. 24 mg/L in the fall of 2002. Total suspended solids were two to three times higher on all sample days between December 2002 and September 2005. They declined during the fall and winter of 2005 but remained nearly twice as high (41.7 to 48.2 mg/L) as was observed in the fall of 2002 (24.2 mg/L). The high sample variability in 2002 and 2003 is unexplained, but may reflect the frequently observed patchy distribution of phytoplankton in the inlet during that year. The samples were taken 5 to 10 minutes apart. At an average current speed of 19.2 cm/sec (Brooks, 2005a), the samples were collected (on average) about 86.4 m apart in the water. These data suggest that there may be significant interannual differences in TSS with high winter values in 2003 and 2005, but lower values in the winter of 2001-2. No cause and effect relationships were pursued in this study. Total suspended solids (TSS), TVS and the proportion of TSS that were volatile (TVS PROP) are summarized in Table 4. Analysis of variance did not reveal significant differences between any of the three variables as a function of tide (Table 5). The null hypothesis that TSS concentrations were equal at all depths was also not rejected (F = 1.19; p = 0.31).
9 AES Supplemental Study of Dissolved Nutrients and Particulate Organic Matter: 10/06/08
Table 4. Summary statistics describing concentrations of total suspended solids (TSS), total volatile solids (TVS) and the proportion of suspended solids that were volatile (TVS (PROP) at the mouth of North Totten Inlet during 2005.
Breakdown Table of Descriptive Statistics (Totten Water Quality Data)N=34 (No missing data in dep. var. list)
Table 5. Results of a one-way analysis of variance assessing the null hypothesis that TSS, TVS and TVS (PROP) were equal on flood and ebb tides in North Totten Inlet mouth samples between August 24 and December 12, 2005.
Analysis of Variance (Totten Water Quality Data)Marked effects are significant at p < .05000
10 AES Supplemental Study of Dissolved Nutrients and Particulate Organic Matter: 10/06/08
Figure 4. Total suspended solids in water during ebb and flood tides at depths of 1.5, 7.5 and 15.0 m at the mouth of North Totten site between March 2002 and December 2005. 3.4. Total Volatile Solids. Concentrations of volatile solids (TVS) at the two sites in North Totten Inlet are summarized in Figure 5. The overall mean TVS concentration reported in Table 2 was 13.5 + 1.0 mg/L with a range of 1.6 to 38.0 mg/L. Analysis of variance with depth, tide and their interaction as factors indicated that TVS differences as a function of depth were significant with p = 0.049 (Table 6). Post hoc testing using Tukey’s Honest Significant Difference test indicated that TVS on the flood tide at 15 m depth (18.02 mg/L) was significantly higher (p = 0.047) than on the flood tide at 7.5 m depth (12.2 mg/L). These relationships are described in Figure 6. No other significant differences in TVS concentrations were observed as a function of either tide or depth. Significant differences were observed as a function of date (F = 4.26, p = < 0.00) and post hoc testing revealed that the concentration of TVS on October 3, 2005 was significantly less (9.39 mg/L) than the concentrations observed in August (17.0 mg/L), September 2 (16.4 mg/L) or December 12 (17.2 mg/L), 2005. No other significant differences as a function of date were observed indicating that the amount of particulate organic matter (POM) in Totten Inlet on flood and ebb tides between August and December 2005 was relatively constant. However, the consistently lower TVS and TSS on ebb tides when compared with flood tides described in Figure 6 suggests that a higher power (more samples) in these tests would reveal Totten Inlet to be a net consumer of suspended organic and inorganic particulates. The sustained growth of mussels in winter months when reduced concentrations of chlorophyll a have been recorded suggests that mussels are consuming a portion of the TVS. However, the exceptionally high sediment TVS recorded throughout most of the inlet by Brooks (2005a) suggests that Totten Inlet is both a physically and biologically depositional environment.
11 AES Supplemental Study of Dissolved Nutrients and Particulate Organic Matter: 10/06/08
Figure 5. Total Volatile Solids in water at all North Totten sites and at the Deepwater Point reference location during 2002 and 2003. Table 6. Results of a one-way analysis of variance assessing differences in TVS as a function of water depth (-1.5, -7.5 and -15 m) and tide (ebb or flood) at the mouth of North Totten Inlet water quality sampling site in 2005.
Univariate Tests of Significance for TVS (mg/L) (Totten Water Quality Data)Sigma-restricted parameterizationEffective hypothesis decomposition
Figure 6. Total volatile solids (left) and total suspended solids (right) in ebb and flood tide waters near the mouth of Totten Inlet at three depths (1.5, 7.5 and 15.0 m) on seven dates between August 24 and December 12, 2005. Differences in the proportion suspended solids (TSS) that were volatile (TVS or POM) are described in Figure 7. The recorded values of 0.27 + 0.02 were nearly twice the 0.15 + 0.02 proportion reported by Brooks (2001) for eleven reference station canister assessments in British Columbia. Analysis of variance indicated that not all of the Totten Inlet means were equal as a function of depth and/or tide (F = 2.78; p = 0.020). However, post hoc testing found that only the flood tide mean value at 15 m depth was significantly higher (0.34) than the mean value on the flood tide at 1.5 m depth (0.22). These relationships are described graphically in Figure 8.
12 AES Supplemental Study of Dissolved Nutrients and Particulate Organic Matter: 10/06/08
Figure 7. Proportion TVS in suspended material collected at all North Totten Inlet sample sites between March 2002 and December 2005.
Figure 8. Mean + 95% confidence intervals describing the proportion TVS on ebb and flood tides at the mouth of North Totten Inlet site as a function of depth.
13 AES Supplemental Study of Dissolved Nutrients and Particulate Organic Matter: 10/06/08
3.5. Chlorophyll a. During the period of observation, the overall mean chlorophyll a concentration at the North Totten Inlet site was 6.97 + 0.68 µg/L with a range of 0.16 to 16.18 µg/L (Figure 9). Mean values < 1.0 µg/L were restricted to the winter months (early December to the beginning of April. Peak mean concentrations were observed in May and October of 2002 and during August to October of 2005. Interannual differences are apparent in that the chlorophyll concentration on August 27, 2002 was 2.02 µg/L whereas it was 12.33 µg/L on August 24, 2005.
Figure 9. Chlorophyll a concentrations collected at all North Totten Inlet stations combined for all depths (1.5, 7.5 and 15.0 m) and tidal stages (ebb and flood) during the period March 22, 2002 to December 12, 2005. The specific purpose of the 2005 studies was to determine if Totten Inlet was a net consumer or producer of chlorophyll a and other forms of POM in comparison with the rest of South Puget Sound. A t-test comparing flood and ebb tide concentrations of chlorophyll a and phaeopigments was conducted to achieve an overall assessment in this respect. The mean chlorophyll a concentration on ebb tides was 8.30 µg/L and it was slightly less on flood tides at 8.23 µg/L suggesting that Totten Inlet was a net producer of phytoplankton during the period of observation. However, the differences were not significant (t = 0.10; p = 0.92). Degraded chlorophyll a (phaeopigments) were slightly higher on the flood tide (1.55 µg/L) in comparison with the ebb tides (1.47 µg/L) but these results were also not significant (t = -0.73; p = 0.47).
14 AES Supplemental Study of Dissolved Nutrients and Particulate Organic Matter: 10/06/08
Concentrations of total plant pigments (chlorophyll a and phaeopigments) are summarized by tidal stage in Figure 9 for samples collected between August 24 and December 12, 2005. Chlorophyll a differences as a function date and date x tide. Significant differences as a function of date are obvious in Figure 8 and were confirmed by the analysis summarized in Table 7. Post hoc testing with Tukey’s Honest Significance Difference test found no significant differences in chlorophyll a concentrations as a function of tide on the same date. The high temporal variation observed in Figure 10 and the lack of significance in plant pigments on flood and ebb tides on the same date emphasizes the importance of collecting these data either side of the same tide. Table 7. Results of an analysis of variance assessing differences in chlorophyll a concentrations as a function of date, sample depth and tidal stage at all North Totten Inlet sample station.
Multivariate Tests of Significance (Totten Water Quality Data)Sigma-restricted parameterizationEffective hypothesis decomposition
15 AES Supplemental Study of Dissolved Nutrients and Particulate Organic Matter: 10/06/08
Figure 10. Summary of chlorophyll a and phaeopigments evaluated during ebb and flood tides at three depths (1.5, 7.5 and 15.0 m) inside the mouth of Totten Inlet between August 24 and December 12, 2005. Phytoplankton pigment concentration differences as a function of depth. Significant differences were not found as a function of water depth. However, as seen in Figure 11, mean chlorophyll a concentrations in surface water (1.5 m depth) were lower than in water collected at 7.5 and 15.0 m depths.
Figure 11. Summary of chlorophyll a and phaeopigment concentrations as a function of depth on both ebb and flood tides inside the mouth of Totten Inlet between August 24 and December 12, 2005. 3.6. Nutrients. In marine environments, nitrogen is most frequently the limiting nutrient. However, diatoms may also deplete silicate as one factor affecting the species composition of phytoplankton communities and in the presence of high nitrogen concentrations, phosphorus may become limiting. Therefore the following analysis focuses on dissolved inorganic nitrogen but also presents the results for phosphate and silicate. In all cases, the values are for the N, P or Si content of the compounds and do not include the oxygen or hydrogen content. Mean database concentrations are reported in Table 2. Dissolved inorganic nitrogen (DIN). Nitrite (NO2), nitrate (NO3), and ammonium (NH4) were measured in water samples during the entire period. Mean DIN values in both mg N/L and micromoles N are provided in Figure 12 for combined depths and tides. They varied seasonally between 1.28 µM in May 2002 and 33.8 µM in January 2003. Phytoplankton production is light limited in the Pacific Northwest from November to the beginning of March. A possible second DIN peak following a spring phytoplankton bloom was observed in July 2002. However, there was a break in sampling between June 2003 and August 24, 2005 during which similar July peaks could have occurred but were not recorded. Note that the micromole and mg N/L plots are
16 AES Supplemental Study of Dissolved Nutrients and Particulate Organic Matter: 10/06/08
displaced slightly on the abscissa to minimize overlap in the graph. It should be noted that at no time were the DIN concentrations < 1.0 µM where the nutrient becomes limiting. The species of nitrogen compounds are displayed separately in Figure 13. Most of the nitrogen was in the form of nitrate or ammonium with negligible amounts of nitrite. Figure 7a describes the relationship between the three evaluated forms of nitrogen in this study. Note that NH4 and NO2, which are initial byproducts of microbial catabolism of organic matter peaked two weeks to a month earlier in each season than nitrate. It should also be noted that nitrate concentrations were less than ammonium concentrations during periods of low DIN suggesting that the nitrate was depleted and that metabolic waste NH4 in the biologically active inlet was sustaining primary production during periods of high phytoplankton production.
Figure 12. Dissolved inorganic nitrogen (micromoles N and mg N/L) collected at all Totten Inlet sample stations at depths of 1.5, 7.5 and 15.0 m on both flood and ebb tides from March 2002 until December 2005. The significance of differences associated with date, water depth and tidal flows were assessed in the DIN database by analysis of variance. Obvious differences as a function of date are apparent in Figure 13 and they are confirmed in Table 8. Depth was not a significant factor, but there were significant differences on flood and ebb tides. These differences were explored using Tukey’s Honest Significant Difference test. The mean DIN on ebb tides (0.176 mg N/L) was significantly (p = 0.001) lower than the 0.185 mg N/L observed on flood tides indicating that over the period from August 24, 2005 until December 12, 2005, Totten Inlet was a net
17 AES Supplemental Study of Dissolved Nutrients and Particulate Organic Matter: 10/06/08
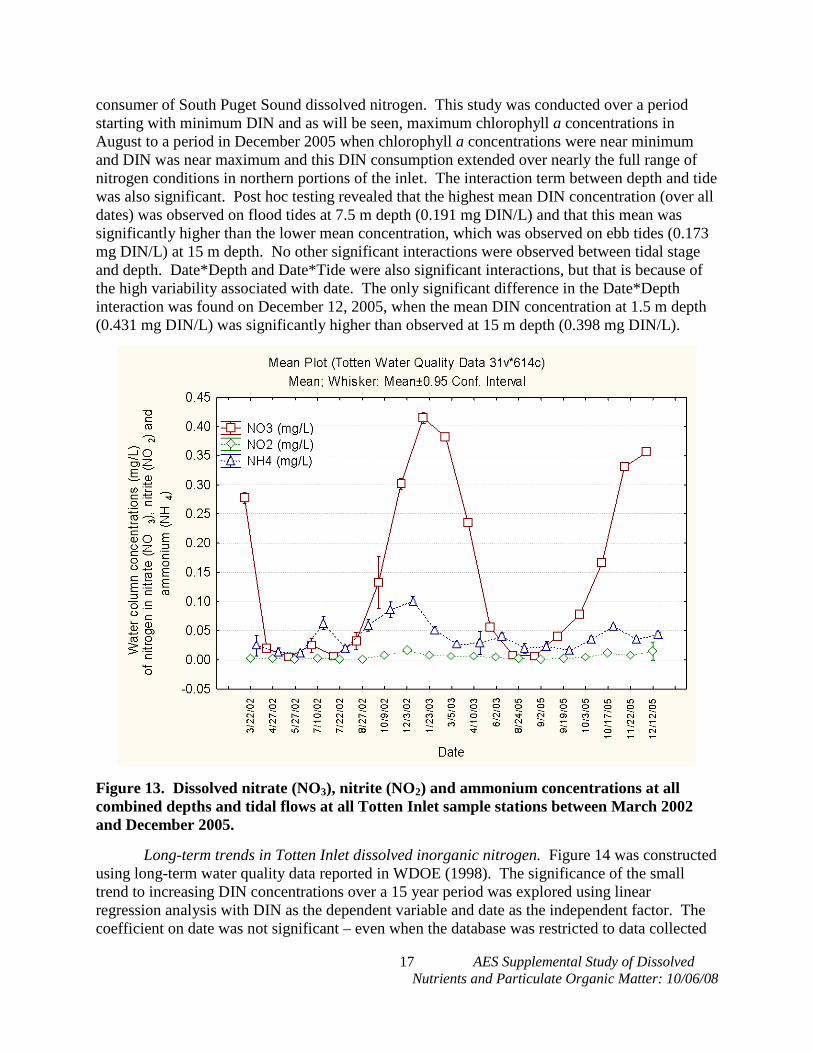
consumer of South Puget Sound dissolved nitrogen. This study was conducted over a period starting with minimum DIN and as will be seen, maximum chlorophyll a concentrations in August to a period in December 2005 when chlorophyll a concentrations were near minimum and DIN was near maximum and this DIN consumption extended over nearly the full range of nitrogen conditions in northern portions of the inlet. The interaction term between depth and tide was also significant. Post hoc testing revealed that the highest mean DIN concentration (over all dates) was observed on flood tides at 7.5 m depth (0.191 mg DIN/L) and that this mean was significantly higher than the lower mean concentration, which was observed on ebb tides (0.173 mg DIN/L) at 15 m depth. No other significant interactions were observed between tidal stage and depth. Date*Depth and Date*Tide were also significant interactions, but that is because of the high variability associated with date. The only significant difference in the Date*Depth interaction was found on December 12, 2005, when the mean DIN concentration at 1.5 m depth (0.431 mg DIN/L) was significantly higher than observed at 15 m depth (0.398 mg DIN/L).
Figure 13. Dissolved nitrate (NO3), nitrite (NO2) and ammonium concentrations at all combined depths and tidal flows at all Totten Inlet sample stations between March 2002 and December 2005. Long-term trends in Totten Inlet dissolved inorganic nitrogen. Figure 14 was constructed using long-term water quality data reported in WDOE (1998). The significance of the small trend to increasing DIN concentrations over a 15 year period was explored using linear regression analysis with DIN as the dependent variable and date as the independent factor. The coefficient on date was not significant – even when the database was restricted to data collected
18 AES Supplemental Study of Dissolved Nutrients and Particulate Organic Matter: 10/06/08
in the winter months (October through March) when DIN concentrations were at or near their peak. Therefore, there is no evidence of a significant increase in DIN between the years 1980 and 1995. Inconsistencies in the data reporting format between WDOE (1998) and WDOE (2002) made inclusion of the later data problematic. Table 8. Results of an analysis of variance assessing the hypothesis that concentrations of dissolved inorganic nitrogen were equal at three depths on flood and ebb tides inside the mouth of Totten Inlet between August 24 and December 12, 2005.
Univariate Tests of Significance for DIN (mg/L) (Totten Water Quality Data)Sigma-restricted parameterizationEffective hypothesis decomposition
Figure 14. Long-term (1980 – 1995) concentrations of dissolved inorganic nitrogen in Totten Inlet reported in WDOE (1998) Dissolved inorganic phosphorus in Totten Inlet waters. Mean dissolved phosphorus concentrations varied between 0.02 and 0.09 mg P/L over the course of the study (Figure 15). The 95% confidence whiskers provided in the chart suggest little variation in the data as does the data in Table 2. The significance of differences in P as a function of depth, tide and date was explored using analysis of variance (Table 9). The obvious differences as a function of date are
19 AES Supplemental Study of Dissolved Nutrients and Particulate Organic Matter: 10/06/08
confirmed (P < 0.000). The significance of tide was further explored with post hoc testing which showed that mean phosphorus concentrations on flood tides (0.068 mg P/L) were significantly higher (p = 0.042) than mean concentrations on ebb tides (0.066 mg P/L). This analysis indicates that Totten Inlet is significantly a consumer of both nitrogen and phosphorus in South Puget Sound. However, the difference in mean concentrations of phosphorus on flood and ebb tides was small. Table 9. Summary results of an analysis of variance assessing the significance of differences in mean dissolved phosphorus concentrations in water collected at the mouth of North Totten Inlet site as a function of date (August 24, 2005 through December 12, 2005), tidal flow (ebb or flood tides), and water depth (1.5, 7.5 and 15.0 m).
Univariate Tests of Significance for PO4 (mg/L) (Totten Water Quality Data)Sigma-restricted parameterizationEffective hypothesis decomposition
20 AES Supplemental Study of Dissolved Nutrients and Particulate Organic Matter: 10/06/08
Figure 15. Dissolved phosphorus concentrations at all combined depths and tidal flows in at all North Totten Inlet sample stations between March 2002 and December 2005. Redfield ratio. Plants tissues generally have 16 times as much nitrogen as phosphorus (the Redfield ratio in moles of each element) and this ratio is often considered in assessing nutrient balance and in understanding the effects of large inputs of particularly nitrogen in marine systems. Figure 16 describes the Redfield ratio observed on all sample dates in North Totten Inlet. The ratio was <16 on all sample dates. It was highest in winter and lowest during spring and summer when phytoplankton is not light limited at this latitude. Figure 14 suggests that there is excess phosphorus available in South Puget Sound at nearly all times of the year. The molecular weight of phosphorus is 31 and the lowest mean value reported for North Totten Inlet (23.93 µg/L) is equivalent to 0.77 µM P.
21 AES Supplemental Study of Dissolved Nutrients and Particulate Organic Matter: 10/06/08
Figure 16. Redfield ratio as a function of date in samples collected at all North Totten Inlet sites.
Dissolved silicon in North Totten Inlet water. The tests of diatoms, a preferred food of bivalves, are composed of silicon dioxide. Diatom production can be inhibited in favor of dinoflagellates when silicate is depleted. Mean concentrations of Si at all depths and tidal flows are described in Figure 17. The lowest mean value recorded was 0.06 mg Si/L, which is equivalent to 2.1 µM Si and it does not appear that silicon concentrations were low enough on August 27, 2002 to inhibit diatom production. However, large reductions in silicon during spring and fall phytoplankton blooms suggested that diatoms formed a significant part of primary production. The null hypothesis that mean silicone concentrations were equal as a function of tide and depth was not rejected. Significant differences were observed only as a function of date.
22 AES Supplemental Study of Dissolved Nutrients and Particulate Organic Matter: 10/06/08
Figure 17. Mean concentrations of dissolved silicon at all combined depths and tidal flows in water collected at all Totten Inlet sites, between March 2002 and December 2005. 4.0. Discussion. The results presented herein suggest that on July 10, 2002 and during the period August 24 to December 12, 2005, Totten Inlet was significantly a net consumer of nitrogen; a minor, but significant consumer of phosphorus; and a minor and not statistically significant exporter of phytoplankton in South Puget Sound. The following discussion compares these results with other areas of the world where shellfish are intensively cultured to further consider Totten Inlet’s ability to support additional biomass of mussels proposed for culture. Stratification in North Totten Inlet. Small differences in temperature or salinity as a function of depth were observed during the summer fall and early winter of 2005. The lack of significant stratification is supported by the spatial homogeneity of nutrient, chlorophyll a, TVS and TSS concentrations in the water column. The question of stratification is important because if North Totten Inlet is subject to persistent stratification, it could significantly reduce overall phytoplankton production by creating nuisance blooms depleting nutrients in surface waters. The high extinction coefficient associated with dense surface phytoplankton populations could result in light limiting phytoplankton and benthic diatoms. WDOE (1998) classified Totten Inlet as an episodically stratified inlet, but Albertson et al. (unpublished) asserted that Totten Inlet and much of South Puget Sound is persistently stratified. No data substantiating that statement was presented in their report. Figures 10, 11 and 12 in Brooks (2006) were constructed using data in
23 AES Supplemental Study of Dissolved Nutrients and Particulate Organic Matter: 10/06/08
WDOE (1998) to describe potential stabilizing clines in salinity and temperature within the inlet. However, the 15 years of data was aggregated by month and the significant variance displayed could be misleading because of interannual differences. To further address this issue, two new variables ∆T (T10 m depth – T0.5 m depth) and ∆S (S10 m depth – S0.5 m depth) were created. Positive values of ∆T represent destabilizing conditions (i.e. the surface water is colder and denser than the deeper water) and negative values (higher temperatures on the surface) represent a stabilizing force. Positive values of ∆S (higher salinity at depth) are stabilizing and negative values are destabilizing. The data was then grouped by the quarter in which it was collected (QI = late winter early spring; Q2 = late spring – early summer; etc.). The results are summarized in Table 10 and in Figures 18 and 19. Overall ∆S had a positive (stabilizing) mean value of +0.264 PSU and ∆T was also stabilizing (-0.324 oC). The highest frequencies of ∆S observations occurred between zero and + 0.5 o/oo indicating that both stabilizing and destabilizing conditions were small and occurred during all quarters of the year. Small salinity gradients are not unexpected in Totten Inlet because freshwater inputs are typically low as described by Brooks (2006) and because stratified water entering the inlet from other areas of South Puget Sound that receive larger inputs of fresh water, like Budd Inlet, are well mixed as they cross the shallow sill at the entrance to Totten Inlet on flood tides. It is of course possible for shallow haloclines to occur in winter months during periods of high rainfall, neap tides and minimal wind. These would be expected to occur near the head of Totten Inlet where there appears to be reduced tidal mixing – not at the North Totten site. During the 15 year record, there were 24 instances where stabilizing ∆S values were greater than 0.5 PSU. During the same period there were 9 instances in which destabilizing ∆S values were < -0.5 PSU. Table 10. Summary temperature and salinity statistics including instantaneous differences (∆S and ∆T) in values determined at 10 m and 0.5 m depths. Raw data from WDOE (1998) for Windy Point, Totten Inlet.
Breakdown Table of Descriptive Statistics (Historical Totten Water Quality Data)Smallest N for any variable: 102
Quarter TEMPMeans
Confidence+95.000%
TEMPN
SALINITYMeans
Confidence+95.000%
SALINITYN
Delta SalinityMeans
Confidence+95.000%
DeltaSalinity
N
Delta TMeans
Confidence+95.000%
Delta TN
1 7.505 8.074 22 26.888 27.646 22 0.751 1.106 11 0.082 0.407 112 12.535 13.105 62 27.545 27.842 64 0.147 0.496 32 -0.439 -0.171 313 16.103 16.410 75 28.703 28.846 75 0.120 0.276 37 -0.576 -0.177 374 12.213 12.767 47 28.620 28.982 48 0.420 0.843 24 0.043 0.171 23All Grps 13.223 13.658 206 28.138 28.314 209 0.264 0.421 104 -0.324 -0.150 102 Figure 19 describes the frequency of ∆T values. Highest frequencies were associated with small temperature differences between 0 and +1 oC. Stabilizing clines occurred most frequently during the warmer months of the year (2nd, 3rd and 4th quarters). More stabilizing temperature differences occurred only in the 2nd and 3rd quarters (April to September) on an infrequent basis. Stabilizing ∆T values < -1.0 oC were recorded in 19 of the 102 cases (18.6%) and destabilizing ∆T values were reported in only 3 cases over the 15 year record. Stratification occurs when the stabilizing forces associated with thermo- and pycnoclines overcome mixing forces associated with mechanical disturbances created primarily by wind and tides. The stabilizing ∆T and ∆S values reported in WDOE 1998 are much lower than values recorded for other portions of Puget Sound. Under any circumstances, these data support the conclusion reached by WDOE (1998) that Totten Inlet (at Windy Point) is episodically stratified. There is no evidence in any of this data that Totten Inlet is persistently stratified.
24 AES Supplemental Study of Dissolved Nutrients and Particulate Organic Matter: 10/06/08
Figure 18. Histogram describing the frequency of ∆S values reported in WDOE (1998) for Windy Point, Totten Inlet between 1980 and 1995. The data are grouped by quarter.
Figure 19. Histogram describing the frequency of ∆T values reported in WDOE (1998) for Windy Point, Totten Inlet between 1980 and 1995. The data are grouped by quarter. Food for cultured mussels in Totten Inlet. Figure 20, copied from Brooks (2005c) shows that mussels at the Deepwater Point farm in Totten Inlet grew steadily throughout the year – even in the winter when phytoplankton was light limited. Living phytoplankton greater than ~3 µm particle size is the preferred food for mussels, oysters and clams. During periods of abundant living phytoplankton, the detrital component of filtered organic matter is mostly rejected as pseudofeces. However, Bayne (1976) described the importance of recent detritus
His togram (His torical Totten Water Quality Data 20v*643c)
Salinity differences (parts per thousand)Salinity at 10 m depth - salinity a 1.0 m depth
Num
ber o
f obs
erva
tions
-3.0
-2.5
-2.0
-1.5
-1.0
-0.5 0.0
0.5
1.0
1.5
2.0
2.5
3.0
3.5
0
2
4
6
8
10
12
14
16
18
Quarter: 1Quarter: 2Quarter: 3Quarter: 4
Destabilizing Stabilizing
His togram (His torical Totten Water Quality Data 20v*643c)
Difference in water tem perature(10 m tem perature - 1 m tem perature)
Num
ber o
f obs
erva
tions
-4 -3 -2 -1 0 1 2 3 4 5 60
2
4
6
8
10
12
14
16
18
20
22
24
Quarter: 1Quarter: 2Quarter: 3Quarter: 4
Stabilizing Destabilizing
25 AES Supplemental Study of Dissolved Nutrients and Particulate Organic Matter: 10/06/08
(POM or TVS) as a food source for mussels when phytoplankton is scarce. The carbon content of phytoplankton is generally equal to 50x its chlorophyll a content. Figure 21 was constructed by multiplying the chlorophyll a concentrations observed in this study by 50 to represent the concentration of carbon associated with living phytoplankton on each sample date. The non-living detrital component of TVS was estimated in North Totten Inlet by subtracting the concentration of phytoplankton carbon from TVS concentrations. As will be seen in following sections of this report, phytoplankton production in Totten Inlet is as high, or higher, than has been recorded for other shellfish growing areas of the world. The reason that phytoplankton appears to be a minor resource in Figure 21 is that organic detritus in Totten Inlet is exceptionally high and provides shellfish with plentiful supply of food when preferred phytoplankton is light limited in winter months. A comparison of Figures 19 and 20 supports the importance of detritus as a food supply for filter feeders during winter months and explains the steady growth of mussels during periods when phytoplankton production is light limited.
Figure 20. Growth of mussels (Mytilus edulis galloprovincialis) at the Deepwater Point mussel farm in Totten Inlet during the 2002 production cycle. Valve lengths (mm) and live weight (grams) are provided.
03/28/2002
07/10/2002
11/22/20
26 AES Supplemental Study of Dissolved Nutrients and Particulate Organic Matter: 10/06/08
0
5
10
15
20
25
30
January March April May June July August September October November December
Figure 21. Concentrations of carbon in phytoplankton and detrital particulate organic matter (mg/L) observed by month in water samples collected at all North Totten Inlet sites during 2002, 2003 and 2005. Table 11, summarizes TSS, TVS, percent TVS and chlorophyll a concentrations reported in the literature for productive mussel growing waters from around the world. The annual mean TSS (+ 95% confidence interval) concentration measured at the North Totten Inlet site was 51.8 + 3.3 mg TSS/L; ranking it second highest in these reports. The concentration of organic particulates (TVS) in water at the North Totten Inlet site was higher than reported for any other culture area in the world for which data was available. The high particulate organic matter in Totten Inlet’s water is consistent with the exceptionally high sediment concentrations of TVS reported by Brooks (2005a) throughout the inlet. It should be noted in comparing Figures 20 and 21 that M. e. galloprovincialis is seeded in winter at small sizes. The small initial biomass has reduced need for food. The cultured biomass increases during the spring as increased light levels promote phytoplankton production. Phytoplankton production remains relatively high in Totten Inlet until late in the year. This characteristic is emphasized in Figure 22, which compares chlorophyll a concentrations observed in North Totten Inlet with WDOE (2002) data for Willapa Bay on the Pacific Coast, which is one of the most important Pacific oyster (Crassostrea gigas) producing areas in North America and data for Penn Cove, an area of intense mussel production in Saratoga Passage, Washington State. Note that chlorophyll a concentrations increase earlier in Penn Cove when compared with Totten Inlet and that peak summer concentrations are higher in the former. However, chlorophyll a concentrations have been higher from September through November in Totten Inlet when compared with either Willapa Bay or Penn Cove. Mussel production records from Totten Inlet suggest that the high chlorophyll a concentrations late in the year are an advantage because those are the months during which the cultured biomass and its needs for food are highest. It should also be noted that Page and Hubbard (1987) recorded “exceptional growth” of Mytilus galloprovincialis in chlorophyll a concentrations of 0.5 to 3.0 µg/L. The lowest concentration reported for Totten Inlet was 0.6 µg/L in January 2003 and this value exceeds the minimum of 0.5 µg/L reported in association with high growth reported by Page and Hubbard (1987).
27 AES Supplemental Study of Dissolved Nutrients and Particulate Organic Matter: 10/06/08
Table 11. Total Suspended Solids (TSS), Total Volatile Solids (TVS), percent TVS, and Chlorophyll a (Chla) reported in the literature for mussel growing areas of Asia, Europe, North America and Africa and Totten Inlet. Location Date TSS (mg/L) TVS (mg/L) % TVS Chla (µg/L) Source Whitsand, England March 1984 6.77 2.40 35.8 Bayne et al. (1987) Lynher, England March 1984 33.06 4.63 15.4 Whitsand, England June 1985 9.09 1.37 15.1 Lynher, England June 1985 21.19 2.75 12.7 Whitsand, England July 1985 10.26 1.80 16.6 Lynher, England July 1985 110.91 9.80 9.2 Sylt Not given 3.0 Dame and Prins (1997) North Inlet Not given 7.0 Carlingford Lough Not given 3.2 Marennes-Oleron Not given 4 – 22 South San Francisco Bay Not given 2.6 Narragansett Bay Not given 3.0 Oosterschelde Not given 7.5 Western Wadden Sea Not given 8.0 Delaware Bay Not given 9.9 Chesapeake Bay Not given 6.9 Ria de Arosa Not given 4 to 12 Figueiras et al. (2002) Benguela Bay Not given 8.0 Pitcher and Calder (1998) Ria Formosa Not given 1.4 Falcao et al. (2000) Sungo Bay Annual 2.4 to 3.5 1 to >50% 2 to 10 Duarte et al. (2003) West Coast of Norway Annual 1 to 3 Strohmeier et al. (2005) New Zealand (Pelorus Sound) 1984-85 0.1– 1.4 0.13 to 2.1 Gibbs et al. (1992) North Totten Inlet 2002 51.8 + 3.3 13.5 + 1.0 28.6 + 2.4 7.0 (0.2 to 16.2) This report Inner Totten Inlet 2002 ~1 to 35 Gardiner et al. (2007)
Figure 22. Comparison of chlorophyll a concentrations recorded in all North Totten Inlet sites during this study with historical records for two other highly productive shellfish culturing areas in Washington State. Data for Willapa Bay and Penn Cove were are from WDOE (2002).
28 AES Supplemental Study of Dissolved Nutrients and Particulate Organic Matter: 10/06/08
Turbidity. Consistent with the observation that Totten Inlet is a non-significant net exporter of chlorophyll a, mean turbidity on ebb tides (2.024 NTUs) in 2002 was significantly higher (t = 2.055; p = 0.048) than on the flood tides (1.629 NTUs). On July 10, 2002, triplicate samples were collected three hours before slack tide at the North Totten Inlet site and three hours after the same slack tide. Again, mean turbidity (PIM plus POM) on the ebb tide (3.08 NTUs) was significantly higher (p = 0.0007) than on the flood tide (1.91 NTUs). In July 2002, volatile compounds represented 37.3% of TSS on the ebb tide and 25.2% on the flood tide. This suggests that at least on that day, Totten Inlet was exporting all forms of POM rather than importing it. For the entire North Totten water quality database in 2002 and 2003, turbidity was significantly positively correlated with Chla concentrations and it was significantly higher on ebb tides (N = 15; mean = 2.02 NTU) than on flood tides (N = 19; mean = 1.63 NTU). Appendix C to WDOE (2002) provides correlations between the light extinction coefficient (k) and concentrations of chlorophyll a. Between 1998 and 2000 some marine areas in Washington State, like Admiralty Inlet (ADM 001 and ADM 003), had moderately high correlation coefficients (R2 = 0.45 and 0.73 respectively) suggesting that a significant portion of the observed turbidity was associated with living phytoplankton. This was also true for Budd Inlet in South Puget Sound where the correlation coefficient for BUD 2 was 0.43 and it was 0.37 for BUD 5. However, in Totten Inlet, the correlation coefficients were much lower (TOT001 = 0.01 and TOT002 = 0.02) suggesting that much of the turbidity was associated with factors other than concentrations of living phytoplankton. The data provided herein suggests particulate organic matter (TVS) and not particulate inorganic matter (TSS – TVS = PIM) was responsible for much of the turbidity. Furthermore, the high detritus to phytoplankton ratios described in Figure 20 suggest that the other factor affecting turbidity in the inlet was suspended non-living particulate organic matter (detrital POM). Nutrients and phytoplankton production in Totten Inlet. Brooks (2006) and Gardiner et al. (2007) discussed nutrient cycling in association with intensive bivalve culture and the reader is referred to those reports for a more detailed discussion. The results of this study indicate that between August and December 2005, Totten Inlet was a significant net consumer of South Puget Sound nutrients and an exporter of non-significant amounts of excess phytoplankton. The following comments focus on achieving an understanding of how nutrients were affecting phytoplankton production in North Totten Inlet. Dissolved inorganic nitrogen (DIN). Primary production in marine waters becomes nitrogen limited at about one µM DIN (WDOE, 2002), which is equivalent to 0.014 mg DIN/L. The model discussed by Brooks (2006) predicted that in Totten Inlet, the phytoplankton population appeared to be increasing whenever the concentration of DIN was > 0.0158 mg/L (1.13 µM). Mean DIN and chlorophyll a concentrations observed in North Totten Inlet are summarized in Figure 23. Note that all of the mean values are >1.13 µM N and it does not appear that DIN was significantly limiting primary production at any time of the year in North Totten. The results for silicon and phosphorus suggest that neither of those nutrients were limiting.
29 AES Supplemental Study of Dissolved Nutrients and Particulate Organic Matter: 10/06/08
Figure 23. Comparison of concentrations of chlorophyll a and dissolved inorganic nitrogen in water collected at all North Totten Inlet sites between March 2002 and December 2005. The sill and narrow mouth of Totten Inlet function to mix incoming water on flood tides refreshing surface water nutrient concentrations, breaking down any stratification, and diluting phytoplankton concentrations. However, these effects may not extend into the southern (inner) areas of the inlet. Drifter studies and bathymetry reported in Brooks (2005a) suggest that the inner and outer portions of Totten Inlet may not behave as a single waterbody. Water in North Totten Inlet appears to be exchanged regularly with water in South Puget Sound across the shallow sill whereas drifters placed just south of Little Skookum Inlet were retained in central portions of Totten Inlet during tidal exchanges to Mean Low Water (MLW). Replicate surface water samples were collected at 1.5 m depth within an hour of each other adjacent to Little Skookum Inlet in the inner area of Totten Inlet and in North Totten Inlet near its mouth on August 24, 2005. Table 12 presents the results of t-tests with separate variance estimates applied to the physicochemical endpoints evaluated on that date at the two locations. The inner portions of the inlet were significantly warmer (18.2 versus 16.9 oC) and had significantly lower concentrations of all nutrients except phosphate, which was nearly equal between the two sites. Surface waters at Little Skookum held only 0.16 µM DIN and this nutrient was limiting further phytoplankton production on that date, whereas the N concentration was low, but 7.25 times higher and not limiting (1.16 µM DIN) in North Totten Inlet surface water. Concentrations of chlorophyll a were higher in the inner inlet, but the differences were not significant. These
30 AES Supplemental Study of Dissolved Nutrients and Particulate Organic Matter: 10/06/08
results suggest reduced mixing between the inner and outer areas of Totten Inlet resulting in longer water residence times in the inner inlet when compared with North Totten Inlet. Table 12. Results of t-tests assessing differences in physicochemical properties of surface water collected at 1.5 m depth in North Totten Inland and adjacent to Little Skookum Inlet in the inner portions of Totten Inlet.
T-tests; Grouping: Site (Totten Water Quality Data)Group 1: Totten Mouth
Factors affecting phytoplankton production in North Totten Inlet. The nutrient data collected during these studies suggests that phytoplankton production in North Totten Inlet is not nutrient limited at any time of the year. However, correlations between nutrient and chlorophyll a concentrations are readily apparent in Figure 23. These relationships were explored using correlation and factor analyses. As seen in previous sections of this report, nutrient concentrations are not well correlated with water depth. However, chlorophyll a concentrations were strongly and positively correlated with temperature and all of the nutrient endpoints are significantly negatively correlated with temperature. In this case, temperature is believed to be a surrogate for solar insolation, which is controlling phytoplankton production, which in turn is affecting nutrient concentrations. These relationships are further explored in Figure 24, which is based on a Varimax normalized principal factors extraction of the data.
Table 11. Matrix of Pearson correlation coefficients describing the covariance of chlorophyll a with physicochemical variables measured between 2002 and 2005 at all North Totten Inlet sites.
Correlations (Totten Water Quality Data)Marked correlations are significant at p < .05000
31 AES Supplemental Study of Dissolved Nutrients and Particulate Organic Matter: 10/06/08
Figure 24. Varimax normalized principal factors analysis of physicochemical and organic variables in the Totten Inlet database. Brooks (2005a) reported the results of canister studies conducted in North Totten Inlet and at the Deepwater Point reference location during 2002 and 2003. Figure 25 describes TVS deposition rates at these two Totten Inlet locations. Brooks (2001a) reported TVS deposition rates at four reference locations in British Columbia, Canada. Finfish aquaculture facilities are sited in areas where there is reduced potential for phytoplankton blooms due to fish health concerns. These areas, which have low primary productivity, had a mean TVS deposition rate of 5.42 + 0.99 g TVS/m2-d from June through October 2000. These values are similar to those observed at the North Totten site during the winter of 2002 – 03. However, the mean of the remainder of the deposition rates recorded at the Deepwater Point reference location were 13.5 times higher and they were 5.8 times higher at the North Totten Inlet reference location in July 2002. These data are consistent with the high sediment TVS and free sediment sulfide concentrations recorded by Brooks (2005a) in Totten Inlet, suggesting that it is a highly productive waterbody with excessively enriched sediments.
32 AES Supplemental Study of Dissolved Nutrients and Particulate Organic Matter: 10/06/08
Figure 25. Deposition rates of volatile solids (g/m2-day) determined using canisters at the Deepwater Point and North Totten Inlet reference locations as a function of sample date. Diagenesis of nitrogen in Totten Inlet sediments. Data summarized in Figure 12 indicated that during summer periods when DIN was depressed, ammonium (NH4) concentrations were higher than nitrate or nitrite concentrations in North Totten Inlet water. The sources of this ammonium are likely tied to the high TVS deposition rates described in Figure 24. Baudinet et al. (1990) described the flux of nutrients at sediment-water interfaces and the response of infaunal communities in the Gulf of Fos, France. They cited Cerco’s (1989) observation that ammonium release was 70% higher from anaerobic sediments when compared with aerobic conditions and that ammonium was cycled at a rate 100 times faster from sediments to the overlying water column than was nitrate (NO3). Ammonium releases were temporally correlated with mussel biodeposits and peaked in the spring in Carteau Cove when they were 1.4 to 2.3% higher in sediments under the mussel cultures than at the reference location. Stenton-Dozey et al. (1999) observed that ammonium (NH4
+) was the principal form of nitrogen released from sediments under M. e. galloprovincialis raft cultures in Saldanha Bay, South Africa. The mean observed rate was 1,400 µM NH4
+ /m2-hr. Other forms of DIN (nitrate and nitrite)
generation were 2 to 3 orders of magnitude lower than ammonium releases. Other estimates of ammonium release from sediments have been shown to vary between 1,000 and 10,000 µM NH4/m2-hr (Dame et al., 1989, 1991, 1992; Asmus and Asmus, 1991) with higher rates in summer when compared with winter (Dame et al. 1992) Newell (In-review) and Libes (1992) reviewed nitrogen cycling in estuaries associated with intensive bivalve culture and suggested that when surficial sediments are maintained in an
Deposition rate of TVS at British Columbia reference locations (Brooks 2001)
33 AES Supplemental Study of Dissolved Nutrients and Particulate Organic Matter: 10/06/08
aerobic condition (positive redox), nitrification of NH4+ by colonies of Nitrosomonas and
Nitrobacter (NH4+ → NO2
- → NO3-) occurs. If surficial sediments do not have positive redox
potential, the NH4+ diffuses back into the water. Some of the NO3
- diffuses into the water and some diffuses downward in the sediments.. When the downward diffusing nitrate reaches anaerobic conditions created by heterotrophic bacteria, such as Desulfovibrio spp and Clostridium spp., that respire organic matter by stripping oxygen from nitrate, nitrite and sulfate (SO4), the nitrate can be converted to elemental nitrogen through the process of denitrification (NO3
- → NO2- → N2). Elemental nitrogen is not biologically available and it eventually diffuses
upward through the sediments and water column and is lost to the atmosphere. However, in organically rich environments containing sufficient numbers of primary producers, some symbiotic heterotrophs can fix the nitrogen, converting it back to nitrate which can further stimulate phytoplankton growth. Ideal environments for nitrification → denitrification and loss of N2 from enriched sediments to the atmosphere include aerobic surficial sediments that are devoid of primary producers (macroalgae, benthic diatoms, etc.) and that are underlain by anaerobic sediments at shallow depths. It should be emphasized that when surficial sediments are anaerobic, the first step in this process (nitrification) cannot occur and the ammonium simply diffuses back into the water where it is available to primary producers. However, Newell (In-review) noted that, “Nonetheless, the total amount of nutrients regenerated directly by bivalve excretion and the microbial degradation of their biodeposits cannot be any greater than if the phytoplankton was being degraded solely by pelagic organisms. Consequently, maximum phytoplankton standing stock supported by the nutrients regenerated through bivalve populations cannot exceed the level that can be sustained by ambient conditions.” To demonstrate this process, Newell et al. (2002) inoculated sediments with palletized phytoplankton cells to mimic oyster feces and pseudofeces. Under aerobic conditions (positive redox), coupled nitrification – denitrification resulted in removal of about 20% of the total added nitrogen as N2. Consistent with the discussion above, the authors noted that ideal conditions for the coupled nitrification – denitrification of nitrogen from estuaries occurs at depths where light penetration is insufficient to support benthic flora and where the reduction-oxidation potential discontinuity is sufficiently shallow to create short diffusion distances between the necessary oxidizing and reducing processes. Mussel rafts may provide an ideal environment for this extractive process because they shade the benthos reducing the growth of benthic diatoms and because biodeposits from the cultured mussels and their symbiotic communities can create negative redox potentials at shallow depths (a few mm to a few cm), providing a pathway for extracting nitrogen from eutrophic systems. The interface between aerobic and anaerobic conditions in sediments is referred to as the oxidation-reduction potential discontinuity (RPD). This transition zone generally occurs over a short vertical distance in sediments. It is visually observable because oxidized sediments have high chroma whereas anaerobic sediments have low chroma and are darkened or blackened by the presence of iron sulfides resulting from the ionic binding of sulfur (S=) released from sulfate by anaerobic bacteria (Desulfovibrio spp.) with iron (Fe2+), which is abundant in coastal sediments (Brooks, 2001). Figure 26 summarizes the depth of the RPD under the center of the Deepwater Point mussel rafts; at distances to 165 m from the raft’s perimeter; and at the Deepwater Point reference location. The depth of the RPD gradually increased from 3 mm under the rafts to 10.0 cm at 75 m downcurrent. It remained at between 3 and 6 cm from 75 m to the
34 AES Supplemental Study of Dissolved Nutrients and Particulate Organic Matter: 10/06/08
reference location. Specific RPD depths for maximum rates of nitrification → denitrification of ammonium to N2 were not found in the literature.
Figure 26. Depth (cm) of the oxidation-reduction potential discontinuity (RPD) in sediments under and north of the Deepwater Point mussel farm (data from Brooks, 2005b). Surficial sediments were aerobic everywhere at this site and the shallow depth of the RPD near the farm suggests that this process may have been facilitated by the additional biodeposits associated with the cultured mussels. Video surveys reported by Brooks (2005a) noted that high concentrations of TSS during summer (when the system as a whole is not light limited) appeared to have reduced benthic diatom production at depths >5 to 6 meters in the area of the Deepwater Point mussel farm. However, much of Totten Inlet is shallower than this and the benthos was covered with dense mats of benthic diatoms. The shallow RPD near the farm and the lack of dense colonies of primary producers create conditions that appear conducive to the denitrification of nitrate and loss of N2 from this enriched environment. Brooks (2003) measured dissolved nutrients at heights of 2.0, 20.0 and 50.0 cm above the sediment water interface as a function of distance from the perimeter of the Deepwater Point mussel farm in July 2002. The results are summarized in Figure 27. Total nitrogen (NO3 + NO4 + NH4) was significantly higher at 2 and 20 cm above the sediments under the center of the rafts than it was at any other station. Significant differences were not observed at any height above the sediments on the perimeter of the mussel rafts or at 30 m distance downcurrent. This preliminary study was conducted to determine the sensitivity of the instrument and its ability to detect differences at the specified depths. Concurrent current meter measurements were not made and it is not possible to determine the absolute flux of inorganic nitrogen from the sediments. However, Figure 27 indicates that the DIN concentration 2.0 cm above the sediments under the rafts (0.103 mg DIN/L) was about twice that observed 2.0 cm above the reference sediments (0.055 mg DIN/L). The concentration 20 cm above the sediments under the farm (0.084 mg DIN/L) was 1.75 times higher than observed at the reference station (0.048 mg
35 AES Supplemental Study of Dissolved Nutrients and Particulate Organic Matter: 10/06/08
DIN/L). Both results were significantly higher (N = 3, p < 0.000 in both cases using Duncan’s test following ANOVA). Ammonium (NH4
+) comprised most of the DIN under the farm (93% at 2.0 cm height and 91% at 20 cm height) and at the reference location (88% at 2.0 cm and 87% at 20 cm). Elemental nitrogen (N2) was not measured and so there is no basis for estimating the proportion of the sediment nitrogen content released to the atmosphere. Ammonium concentrations were significantly lower at all heights on the perimeter of the farm and at 30 m distance in comparison with the reference location. This may indicate denitrification was inhibited by the very shallow depth of the RPD under the rafts, but that it was enhanced at intermediate depths on the perimeter (RPD = 0.5 cm) and at 30 m (RPD = 2 cm). However, that is speculation. These data demonstrate that biologically available nitrogen was being released by all of the sediments evaluated in this study, including reference sediments. Sediments under the mussel rafts were releasing nearly twice as much ammonium as was being released at the reference location. However, the increased ammonium was quickly diluted and was not detectable 50 cm above the sediments or outside the raft’s footprint.
Figure 27. Total dissolved nitrogen concentrations in seawater collected at three heights above the sediment-water interface at the Deepwater Point mussel farm on July 10, 2002. Affects of mussel harvests on Totten Inlet’s nitrogen budget. Mussels and oysters extract nitrogen from marine ecosystems by consuming phytoplankton and detritus and incorporating a portion of the N in their tissues and shells. This is sometimes referred to as Top Down control. The removal of nitrogen from the ecosystem can be evaluated using the proximate analyses produced by Lutz (1980) that is cited in Haamer (1996). One-thousand grams of living mussels contain 400 grams of meat, 300 g of shell and 300 g of pallial water. Four-hundred grams of wet meat contain 8 g N; 0.6 g P, 24 g C and 324.8 g water (18.8% dry weight). Three-hundred grams of shell contain 20 g protein, 10 g carbon, 3.4 g of N and 0.14 g P. Assuming an annual harvest
36 AES Supplemental Study of Dissolved Nutrients and Particulate Organic Matter: 10/06/08
of 514,670 kg, the new farm would remove 5,867 kg of N from Totten Inlet and South Puget Sound each year, which is 0.0017 percent of the point and non-point nitrogen loading in Budd Inlet, which is adjacent to Totten Inlet. The point being that the proposed farm will crop phytoplankton during periods of high primary production. Much of the nitrogen will be sedimented in feces and pseudofeces that will be decomposed and recycled into the water by detritivores and bacteria. The delayed release of primarily ammonia appears to sustain primary production during the summer and fall in Totten Inlet. This reduces the high variability in nitrogen and chlorophyll a recorded in WDOE (2002) for Washington State waters where bivalves are not cultured. The net effect appears to be prolonged moderate production of phytoplankton in Totten Inlet, which benefits all of the inlet’s filter feeding organisms. However, mussel cultures of the magnitude proposed are not sufficient to significantly reduce the nitrogen budget in developed estuaries such as are found in South Puget Sound. Shellfish culture would have to be significantly expanded in Totten Inlet and other areas of South Puget Sound to control the ongoing eutrophication associated with development of the uplands. Carrying Capacity and the need to accurately determine water residence time in Totten Inlet. Brooks (2006) applied historic Totten Inlet data to existing models by Dame and Prins (1997) and others to conclude that Totten Inlet was at about 10% of its bivalve carrying capacity. Many, if not most, productive shellfish producing areas rely on seston imported from larger bodies of water. High concentrations of phytoplankton entering these estuaries on flood tides are grazed by living resources reducing phytoplankton concentrations on ebb tides. In these instances, one common way of estimating the bivalve carrying capacity is to compare the water residence time in the estuary with the bivalve clearance time. Estuaries are considered to be within their carrying capacity when the bivalve clearance time is long in comparison with the water residence time. Brooks (2006) estimated Totten Inlet’s bivalve clearance time at 20.2 days and the water residence or flushing time to renew 90 percent of the inlet’s water at 11.1 days. Subsequent to that, a report by Albertson et al. (unpublished) estimated resident time at 4.0 days for Totten Inlet using the South Puget Sound Area Synthesis Model (SPASM) model. Using environmental data specific to Totten Inlet, Brooks (2006) estimated that it takes (on average) 3.09 days for the inlet’s phytoplankton biomass to replace itself through photosynthesis. Given this Primary Production Time, the longer residence time of 11.1 days would be more conducive to the export of phytoplankton from the inlet than would the shorter residence time of 4.0 days determined using SPASM. However, Albertson et al. (unpublished) did not define residence time by stating the proportion of the inlet’s water that was required to be replaced and they did not consider reflux. Therefore it is not possible to compare the two results. In especially productive estuaries, carrying capacity can also be judged by comparing the bivalve clearance time with the phytoplankton turnover time (the time it takes the phytoplankton biomass to replace itself through photosynthesis). Understanding the residence time of an estuary becomes increasingly important to determining a waterbodies carrying capacity when its living resources depend primarily on imported phytoplankton. In the case of Totten Inlet, the data presented herein suggests that the inlet is producing as much POM as is being consumed and it may be a minor net exporter of phytoplankton (i.e. the phytoplankton turn-over time is short in comparison with the bivalve clearance time and the water residence time at the existing bivalve biomass). Therefore, an accurate determination of the inlet’s flushing time is not particularly important to estimating its carrying capacity at this time. If the biomass of cultured shellfish were to be increased significantly, then chlorophyll a concentrations in ebb tide water
37 AES Supplemental Study of Dissolved Nutrients and Particulate Organic Matter: 10/06/08
would decrease and eventually Totten Inlet would become a significant net consumer of phytoplankton and detrital forms POM. If and when that happens, water residence time will become increasingly important to determining the inlet’s carrying capacity. However, the evidence presented herein suggests that Totten Inlet had not approached that stage in 2005. Determining flushing times. Brooks (2006) defined a simple tidal prism model that uses data that is typically available. However, the model does require an estimated of the amount of water discharged on ebb tides that is refluxed back into the estuary on the next flood tide. However, Figure 28 suggests that at least for Totten Inlet, reflux does not greatly influence an estuary’s flushing time until the amount of refluxed water exceeds ca. 70 to 80 percent of the tidal prism. Let: VT = the waterbody volume at Mean Higher High Water (MHHW) in ft3; Vt = the volume of “old” water remaining in the estuary at time (t); Vp = Tidal prism volume ((MHHW + MHW)/2 – MLW) in ft3; R = proportion of water leaving the estuary on a tidal cycle that is “refluxed” back; (1-R) = proportion of new water entering the estuary on each flood tide Flushing time is the number of days to achieve 90% renewal of water in the estuary. C = the number of days per complete tidal cycle (θ = 2π) in the estuary. With this notation, the proportion of new water entering the estuary on a flood tide is Vp(1-R)/VT equation (1) The proportion of “old” water remaining in the estuary after one tidal cycle is V1/VT = 1-VP(1 – R)/VT equation (2) The number of tidal cycles in a day is 1/C and the proportion of “old” water remaining in the estuary at the end of t days is: Vt/VT = [1-VP(1 – R)/VT]t/C equation (3) Solving this equation for t gives a tidal prism model that includes consideration of refluxed water but does not include freshwater inputs – or assumes that these inputs are a small fraction of the tidal fluxes. This last assumption is appropriate for Totten Inlet because significant freshwater lenses have not been recorded in this estuary. t = days to achieve (Vt/VT) water renewal = C*ln(Vt/VT)/ln[1 – Vp(1 – R)/VT] equation (4) Using Totten Inlet as an example with the following input parameters (EDAW, 1998): C = 0.52 days/tidal cycle Vt/VT = proportion allowable “old” water in the estuary = 0.10 or 10% VMLLW = 122.8 x 10⁶ m3 in Totten Inlet VMHW = 212.4 x 10⁶ m3 in Totten Inlet Vp = 90.2 x 10⁶ m3
An Excel™ spreadsheet was constructed to allow each of these parameters to be varied in making flushing time predictions for Totten Inlet (Appendix 1). The results for a variety of R
38 AES Supplemental Study of Dissolved Nutrients and Particulate Organic Matter: 10/06/08
values are provided in Figure 28. This tidal prism model is considered an appropriate tool for use in estimating bivalve carrying capacity when applied to relatively simple basins or to sub-basins within more complex systems. It should be emphasized that it is not a substitute for more complex numerically driven models and is intended for use in areas where more sophisticated models have not been developed.
Flushing Time (Days)
0
10
20
30
40
50
60
0.1 0.2 0.3 0.4 0.5 0.6 0.7 0.8 0.9 0.95
Proportion of "old" water refluxed back into the estuary on each tidal cycle
Flus
hing
tim
e (d
ays)
to a
chie
ve
90%
rene
wal
Figure 28. Predicted flushing time (days) to achieve 90% water renewal in Totten Inlet as a function of the amount of water refluxed on each tide. Drifter studies in 2005. While Totten Inlet appears to be a simple body of water, differences in physicochemical endpoints measured by the Pacific Shellfish Institute (PSI, unpublished) at Deepwater Point in inner Totten Inlet and results from North Totten Inlet presented herein, suggest significant differences between the inner and outer portions of the inlet. This issue is not central to understanding either the carrying capacity or the assimilative capacity of the environment at the proposed North Totten mussel farm, and the question was not rigorously pursued during these studies. However, several drifter studies were conducted during the 2005 water sampling studies. Drifters were placed at depths of 1.5 and 7.5 meters at the North Totten Inlet water sampling station on August 24, 2005 approximately two hours prior to high slack tide and tracked for six hours. The drifters both entered North Totten Inlet, moved in a counter-clockwise circle and then exited the inlet (Figure 29). The deep water (7.5 m) moved north toward Hammersley Inlet whereas the shallow water moved east into Squaxin Passage. This same pattern was observed on October 3, 2005 (Figure 31). However, note that the shallow drifter did not return into Totten Inlet on the flood tide but continued north and entered Hammersley Inlet. These similar patterns suggest that the reflux rates of deep water are higher than the rates for shallow water. However, the shallowness of the sill surrounding the entrance of Totten Inlet and the consistent concentrations of all biological and physicochemical endpoints measured in this study suggests that water from all depths is well mixed as it enters and leaves Totten Inlet and that these disparate paths have little effect on productivity within Totten. Figure 30, describing the tracks of drifters placed at the Deepwater Point reference station in Inner Totten Inlet is of particular interest. The tidal exchange on September 19, 2005 was to 0.5 m MLLW, which was less than MLW (0.93 m above MLLW). Therefore, this exchange was greater than the 18.6 year average. The 1.5 and 7.5 m drifters moved north into North Totten
39 AES Supplemental Study of Dissolved Nutrients and Particulate Organic Matter: 10/06/08
Inlet during the ebb tide. The deeper drifter moved rather quickly back into Inner Totten Inlet during the beginning of the flood tide, whereas the 1.5 m drifter remained in North Totten Inlet. These few drifter studies support the hypothesis that the flushing characteristics of Inner and North Totten Inlet’s are different. The water residence time in the Inner Inlet may be long, whereas North Totten Inlet’s water appears to be replace over much shorter periods of time. The longer residence time in the Inner Inlet results in high chlorophyll a concentrations that deplete nutrients whereas the shorter residence time and subsequent mixing as water moves across the inlet’s sill results in moderately high chlorophyll a concentrations and DIN concentrations that were not reduced to levels where they limit phytoplankton production. Future studies assessing the flushing time of Totten Inlet should further consider the hypothesis that flushing or water residence times are very different for inner portions of the inlet (south of Little Skookum Inlet) in comparison with North Tottten Inlet (north of Little Skookum Inlet).
Start
MHW = 4.13 m
MLW = 0.93 m
End 7.5 m
End 1.5 m
40 AES Supplemental Study of Dissolved Nutrients and Particulate Organic Matter: 10/06/08
Figure 29. Results of a North Totten Inlet drifter study conducted on August 24, 2005. Drifters were placed in the water at the North Totten water quality sampling station at depths of 1.5 m and 7.5 m and followed for three hours on either side of a flood tide.
Figure 30. Results of an Inner Totten Inlet drifter study conducted on September 19, 2005. Drifters were placed in the water at the Deepwater Point reference station at depths of 1.5 and 7.5 meters and followed over six hours.
Start Ebb (-1.5 m) (-7.5 m)
Slack
MHW = 4.13 m
MLW = 0.93 m
End 7.5 m End 1.5 m
41 AES Supplemental Study of Dissolved Nutrients and Particulate Organic Matter: 10/06/08
Figure 31. Results of a North Totten Inlet drifter study conducted on October 3, 2005. Drifters were placed in the water at the North Totten Inlet water quality sampling station at depths of 1.5 and 7.5 meters and followed over six hours during an ebb – slack low – and flood tide. Phytoplankton production in Totten Inlet. Brooks (2006) reviewed published models and used historic water quality data together with a Microsoft Excel spreadsheet model (Appendix 1), modified from algorithms provided in Lott (1998), to estimate phytoplankton production in Totten Inlet. The following equation was constructed to describe the change in phytoplankton carbon (∂C4/∂t) as a function of growth, respiration, death, excretion and zooplankton grazing. Based on conditions observed in Totten Inlet during this study, it is assumed that nitrogen is the
MHW = 4.13 m
MLW = 0.93 m
Start
End 1.5 m
End 7.5 m
42 AES Supplemental Study of Dissolved Nutrients and Particulate Organic Matter: 10/06/08
nutrient limiting phytoplankton production. It is also assumed that the phytoplankton density is constant in the upper 15 m of the water column. Cell growth death excretion zooplankton grazing ∂C4/∂t = C4*(Gp – 0.12*1.045(T – 20 – 0.12*1.045(T - 20) – 0.2 – 0.45*Gp – 0.182*1.045(T – 20)) eq. (5) Where Gp = [2.0*1.068(T – 20)]*[(I/Is)*exp(1 – I/Is)]*[(C1 + C2)/(0.025 + C1 + C2)] (d/div.) eq. (6)
C1 = Ammonium (from Totten Inlet Database) C2 = Nitrate (from Totten Inlet Database with nitrite added) C4 = Phytoplankton Carbon (50 * Chlorophyll α from Totten Inlet database) Rate constants used in this analysis are those developed by LOTT (1998) I/Is = Monthly solar insolation/maximum solar insolation in South Puget Sound. A spreadsheet model was developed based on these algorithms to predict the increase in phytoplankton biomass as a proportion of the standing biomass. Values of the required input variables determined from this study for North Totten Inlet are provided in Table 12 and model outputs are summarized in Table 13. Excluding the month of May, when a very high phytoplankton biomass was observed together with very low DIN concentrations resulting in a negative rate of carbon increase (phytoplankton were dying and/or being grazed faster than they were being produced), the mean annual phytoplankton turnover time for North Totten Inlet was 3.7 days. During the growing season, March through November, the value was 2.5 days. Including the negative values for May would result in a very low turnover time and its exclusion is considered conservative with respect to understanding the inlet’s carrying capacity. However, the negative May value is important because Totten Inlet is a highly productive shellfish growing area and these results suggest that bivalves and were cropping excess phytoplankton and helping (together with reduced DIN concentrations) to prevent what might have developed into a nuisance bloom (>20 µg Chla/L (WDOE 2002)). The increased ammonium concentrations observed following the spring bloom in 2002 (Figure 13) suggests that much of the organic carbon removed from the phytoplankton community was sedimented with subsequent nutrient regeneration. However, these hypotheses are only two of several that could be invoked. Table 12. Summary statistics describing mean temperatures, chlorophyll a concentrations, TVS, Proportion TVS and Dissolved Inorganic Nitrogen in North Totten Inlet on surveyed dates between August 2002 and December 2005.
Breakdown Table of Descriptive Statistics (Totten Water Quality Data)Smallest N for any variable: 164Month Temp
43 AES Supplemental Study of Dissolved Nutrients and Particulate Organic Matter: 10/06/08
Table 13. Proportional increase in phytoplankton carbon (∂C/∂t), number of days per cell division and phytoplankton biomass replacement time (Turnover Time in days) as a function of solar insolation (I/Is) expressed as a proportion of the maximum insolation, water temperature (oC) and dissolved inorganic nitrogen (DIN).
Month dC/dt I/Is Temp (C ) DIN (mg/L) days/division Turnover Time (days) January 0.0162 0.3 7.2 0.474 2.0 14.0 February 0.0170 0.4 7.4 0.391 1.7 3.4 March 0.0196 0.5 7.6 0.360 1.5 2.4 April 0.0327 0.6 10.9 0.153 1.2 1.7 May -0.0226 0.65 14.5 0.018 1.9 -17.8 June 0.0928 0.7 15 0.100 0.9 1.2 July 0.1399 0.7 15.9 0.067 1.0 1.7 August 0.1224 0.6 16.8 0.042 1.1 3.3 September 0.0848 0.5 16.1 0.046 1.2 5.3 October 0.1170 0.4 14.1 0.181 1.2 2.7 November 0.0540 0.35 10.9 0.373 1.4 3.3 December 0.0099 0.3 9.1 0.415 1.8 4.5
Estimating Totten Inlet’s carrying capacity. The chlorophyll a, TVS and nutrient data collected in this study also allows for a more accurate assessment of the inlet’s carrying capacity. Herman (1993 cited in Dame and Prins, 1997) developed the algorithm given below for defining changes in the biomass of phytoplankton as a function of photosynthesis and losses associated with bivalve grazing, cell senescence and grazing by other fauna. For the purposes of this analysis, the model was modified to include detrital inputs from South Puget Sound. dP/dt = P(μ – m) –P(Clff)(Bff) – Pl/RT + Pe/RT eq. (7) Where: P = phytoplankton biomass (g/m3); μ = growth rate of phytoplankton (day-1); m = death rate of phytoplankton from causes other than bivalve grazing (day-1); CLff = biomass-
specific clearance rate of bivalve suspension feeders (m3-g=1-d-1); Bff = biomass of bivalve suspension feeders (g-m-3);
RT = water mass residence time; Pf = particulate organic carbon concentration in flood tide water (P/m3). Pe = particulate organic carbon concentration in ebb tide water (P/m3) Assuming that dP/dt = 0 (i.e. a steady state system), then the bivalve carrying capacity equals: Bff (g dry wt-m-3) = [(μ - m)/Clff ] + [(Pf – Pe)/(P x Clff x RT) eq. (8) Appropriate Totten Inlet values for these parameters have previously been developed in this report and in Appendix (1) of Brooks (1996). Two values for carrying capacity were developed. The first (1) assumes no contribution of detritus to the suspension feeding food supply and that a mean annual export of 2.0 µg Chla is required to sustain other filter feeders (8.27 – 2.0 µg chla/L) x 50 µg phytoplankton dry weight biomass/µg chla = 0.314 mg dry weight of phytoplankton/L can be cropped by grazers in the inlet without adverse effects. The second scenario assumes a detrital value equal to the TVS measured in flood tide water entering Totten Inlet and that 75% of those exceptionally high concentrations can be filtered without adversely affecting biological resources in the inlet. The food value of the detritus was assumed
44 AES Supplemental Study of Dissolved Nutrients and Particulate Organic Matter: 10/06/08
to be 0.30 times that of an equivalent weight of living phytoplankton. TVS on the flood tide averaged 14.26 mg/L – 0.00823 mg Chla/L = 14.25 mg/L and the relative allowable consumption is therefore (14.25 x 0.75 x 0.30 = 3.21 mg/L or g/m3). Predicted bivalve carrying capacity in these two scenarios is summarized in Table (14). Bff (1) = [(0.261)/0.094] + [(0.414 – 0.207)/(0.372x0.094x11)] = 10.04 g DBW/m3 Bff (2) = [(0.261)/0.094] + [(1.358 – 0.407)/(0.366x0.0418x11) = 14.16 g DBW/m3
P = 50 x chl α = 0.372 g dry weight-m-3 (μ –m) = 0.261 (average annual rate). Clff = 0.094 m3-day-1-g-1 RT = 11 days Pe (1) = 0.207 g dry weight/m3 Pf(1) = 0.414 g dry weight/m3 (includes internal production of chlorophyll a) Pe (2) = 1.069 g dry weight/m3 Pf (2) = 4.275 g dry weight/m3 Table 13. Predicted bivalve carry capacity in Totten Inlet based on (1) mean annual phytoplankton production with no detrital inputs and (2) mean annual phytoplankton production with a detrital input based on the concentrations of TVS observed in this study multiplied by a 0.30 factor to account for the reduced nutritional value of the detritus. An estuary volume of 212,300,000 m3 was used in the calculation.
Calculated bivalve biomass specific carrying capacity (g DBW/m3)
Predicted bivalve carrying capacity (kg DBW)
Proposed biomass (kg DBW)
Percent of carrying capacity
(1) Phytoplankton only 3.59 765,155 253,0001 33.1 (2) Phytoplankton component 3.59 765,155 (2) Detrital component 11.10 2,364,904 (2) Total when considering phytoplankton and detritus as food 14.41
3,070,946
253,0001
8.1
1This is the estimated total Totten Inlet bivalve biomass that would be cultured when the North Totten farm is at full production (Edaw, 1998). The estimates described in Table 13 demonstrate the importance of detrital POM in estimating the carrying capacity of North Totten Inlet. Recall that the basis of calculating phytoplankton mortality (m) included grazing by all living resources in the estuary. Therefore, even if those resources were not capable of including detritus in their food intake, Totten Inlet is predicted to only be at 33.1% of its carrying capacity and it would still export 2.0 µg Chla in ebb tide waters. 5.0. Monitoring of the carrying capacity of shellfish growing areas. The measurement of nutrients, TSS, TVS and chlorophyll a concentrations at appropriate depths on flood and ebb tides provides a technologically accessible, efficient and inexpensive method for assessing the carrying capacity of Totten Inlet and similar estuaries throughout the world. A monitoring program such as the following should be considered for long-term monitoring of shellfish producing areas. I. Baseline and low cultured biomass monitoring. Analyze the following water and shellfish samples at 1.5 m depth; at one-half the depth occupied by the cultured bivalves; and at a depth
45 AES Supplemental Study of Dissolved Nutrients and Particulate Organic Matter: 10/06/08
representing the bottom of the culture. Water samples should be collected at the farm and a local reference location every other month for year. Total Suspended Solids Total Volatile Solids (TVS) Chlorophyll a and phaeopigments (Chla) Temperature (T) Salinity (S) Dissolved Oxygen (DO)
Valve length of samples of 25 shellfish collected from the top and bottom of the culture at both ends (with respect to the current direction) and in the middle of the culture. The total weight of each 25 shellfish sample should also be recorded. This is good production data as well as providing baseline data for future evaluation of the inlet’s carrying capacity.
II. Monitoring during expansion of the biomass of cultured shellfish. As long as TVS and Chla are not significantly (α = 0.05) less on the ebb tide in comparison with the flood tide, the estuary is not near its carrying capacity. If TVS and Chla are being significantly consumed within the estuary, then the following additional actions should be taken. Continue monitoring the endpoints described in (I). Estimate the flushing time of the estuary using the attached tidal prism model or a more
sophisticated model if available. This will involve determining reference tidal heights such as mean lower low water (MLLW), mean low water (MLW), mean high water (MHW) and mean higher high water (MHHW). It will also require determining the area covered by the estuary and an estimate of refluxing.
Using the valve length data (and wet tissue weight data if available), determine if there
are spatial effects on the growth of the cultured organisms as a function of depth or location (either end or in the middle of the culture(s)). In harmonically driven tidal systems, animals in the middle of the cultures will sometimes (but not always) demonstrate reduced growth in comparison with animals located on either end of the culture.
Inventory (estimate) the biomass of bivalves being cultured in the estuary using available
production statistics and estimate the bivalve clearance time using available literature and the volume of water within the depths inhabited by the culture.
Using the physicochemical data collected in (I), determine rates of phytoplankton
production as a function of season, estimate the number of days for a cell to divide as a function of month and determine the phytoplankton turnover time in days.
The data developed will allow estimates of the local carrying capacity using the method
of Incze et al. (1981) and for the estuary as a whole using the model of Herman (1993). Both of these models can be accomplished using the attached Microsoft Excel model (Appendix 1).
46 AES Supplemental Study of Dissolved Nutrients and Particulate Organic Matter: 10/06/08
The information collected in this proposed monitoring program will allow comparisons with other productive estuaries as described by Dame and Prins (1997) to qualitatively assess their estuaries carrying capacity.
This approach is appropriate only for relatively simple estuaries or sub-basins within
larger estuaries. The data are relatively easy to collect and the technologies required for the analyses are generally inexpensive and well known. Risk assessments procedures must be sensitive to local conditions and capabilities. Therefore, the foregoing is intended only as a guide. However, it should enable managers everywhere in the world to monitor shellfish producing areas to avoid significant exceedances of carrying capacities. 6.0. Summary. Chlorophyll a concentrations in North Totten Inlet were near the high end of the ranges observed at other mussel producing areas around the world. Particulate organic matter, measured as TVS, was higher in Totten Inlet than reported for any other mussel growing area in the world. It is hypothesized that the high concentrations of detrital POM (TVS – phytoplankton) sustain mussel growth, even as the cultures reach high biomass during December when phytoplankton production is light limited and the harvest begins. The results and analysis presented herein suggest that Totten Inlet is a significant net consumer of nitrogen and phosphorus brought into the estuary on flood tides from other parts of South Puget Sound. Chlorophyll a concentrations were higher on ebb compared with flood tides, but the differences were not statistically significant. Dame and Prins (1997) have hypothesized that when the bivalve and other filter feeders’ clearance time is long in comparison with the phytoplankton turn-over time, an estuary is unlikely to be near its carrying capacity. Brooks (2006) estimated Totten Inlet’s bivalve clearance time at 20.2 days and that the phytoplankton turn-over time was 3.09 days on an annual basis. In the current analysis the turn-over time for North Totten was estimated at 3.7 days. The increase was largely due to excluding the month of May because of the large negative dC/dt value associated with loss of a previous bloom and subsequent reduced DIN. However, there is no evidence phytoplankton production in North Totten Inlet was nutrient limited at any time. All of these data and the analysis presented in Brooks (2006) suggest that when the proposed North Totten mussel farm reaches full production, the inlet will be at about 10% of its carrying capacity. As long as Totten Inlet is not a significant net consumer of phytoplankton and detrital POM, its estimated flushing time is not particularly important to this risk characterization. If and when the inlet’s living resources increase to a biomass where they depend significantly on imported phytoplankton to supplement internal primary production, then a more refined understanding of water residence time, such as presented in Brooks (2006) will become increasingly important. The tidal prism flushing model presented herein includes reflux (water that leaves the estuary on an ebb tide and re-enters the estuary on the following flood tide). For Totten Inlet, the model was normalized to the flushing time determined by others for adjacent Budd Inlet (maximum of 12 days) by varying the reflux parameter. The model was then applied to Totten Inlet (with the normalized reflux value of 78%) to estimate a flushing time of 11 days for 90% water renewal. If (or when) Totten Inlet significantly relies on imported phytoplankton and POM to supply the food needs of its living resources, then an accepted way of assessing carrying capacity would be to compare the bivalve clearance time with the flushing time described above. When the mass of cultured bivalves in the inlet increases to a point where the bivalve clearance time is shorter than the 11 day flushing time, then the estuary will be at or approaching its carrying capacity (i.e. phytoplankton is being consumed within the estuary
47 AES Supplemental Study of Dissolved Nutrients and Particulate Organic Matter: 10/06/08
significantly faster than it is produced and/or imported. Because of their high density, raft cultured mussels would be among the first filter feeders to be adversely affected by an exceedance of carrying capacity. The growth of the community of cultured mussels (number, wet weight, valve length, etc.) should be established during the first production cycle and monitored periodically afterward. When the clearance rate of the existing biomass of cultured shellfish and other filter feeding resources is less than the inlet’s flushing time and chlorophyll a concentrations in ebb tide water are less than perhaps 0.5 µg Chla/L, then the inlet’s carrying capacity can be further assessed by comparing the growth of cultured bivalves with baseline growth rates. Measuring growth rates of the first cohort of mussels raised at the proposed North Totten Inlet mussel farm will provide an appropriate baseline assuming (based on the analysis provided herein) that the inlet is currently well below its carrying capacity. Questions regarding stratification in Totten Inlet were reassessed through a more rigorous examination of data reported by WDOE (1998) for Windy Point and the periodic measurement of salinity and temperature at one meter depth increments between August and December 2005. The results suggest little potential for salinity differences to have a significant stabilizing effect on the inlet’s water column. That is, in part, due to low freshwater inputs to the inlet (see Brooks, 2006 for a summary) and in part because flood tides spill over a shallow sill at the mouth of the estuary mixing reduced salinity surface waters originating in adjacent inlets having higher freshwater inputs (Budd Inlet) with deeper higher salinity water. Data provided in WDOE (1998) indicates that thermal gradients have been more important in promoting stratification in Totten than salinity has. However, the historical record reveals only small thermal gradients between 1 and 10 m depths (∆T < 1.0 oC) during much of the year. In the fifteen year historical database, there were only 19 of 215 cases in which ∆T was > 1.0 oC and these all occurred in the second and third quarters of the year (April to September). WDOE (1998) concluded that Totten Inlet was episodically stratified and not persistently stratified and this assessment supports that conclusion. Brooks (2006) estimated that phytoplankton in Totten Inlet became nutrient limited when DIN was < 0.0158 mg/L, which is slightly higher than the one micromole value (0.014 mg/L) generally recognized as nutrient limiting. Concentrations of DIN were not reduced to that level in any North Totten water sample examined between August 2002 and December 2005. It was hypothesized that surface water nutrients are continually refreshed by turbulent mixing of deep, nutrient rich, water with surface water during tidal exchanges across the inlet’s shallow sill. Ammonium released from the inlet’s organically enriched sediments appears to have been important to sustaining primary production during summer and fall. The data reported herein supports the conclusions reached by EDAW (1998), Brooks (2006) and Gardiner et al. (2007) that Totten Inlet is a highly productive estuary that will be at about 10% of its bivalve carrying capacity when the proposed mussel farm reaches its design production of 514,670 kg live weight of Mytilus edulis galloprovincialis/year. References Albertson, S.L., J. Newton, R. Reynolds and C. Ebbesmeyer. (unpublished). Investigation of the
Mean Flow in a Complex Multi-Connected Estuary: South Puget Sound. Available through Jan Newton, Washington State Department of Ecology.
Asmus, R.M. and H. Asmus. 1991. Mussel beds: limiting or promoting phytoplankton? J. Exp.
Mar. Biol. Ecol. Vol. 148:215-232.
48 AES Supplemental Study of Dissolved Nutrients and Particulate Organic Matter: 10/06/08
Baudinet, D., E. Alliot, B. Berland, C. Grenz, M. Plante-Cuny, R. Plante and C. Salen-Picard.
1990. Incidence of mussel culture on biogeochemical fluxes at the sediment-water interface. Hydrobiologia. Vol. 207:187:196.
Bayne, B.L. 1976. Marine mussels: their ecology and physiology. Cambridge University Press,
NY. Brooks, K.M. 2000. Literature review describing the environmental effects associated with the
intensive culture of mussels (Mytilus edulis galloprovincialis). Technical report prepared for Taylor Resources, Southeast 1340 Lynch Road, Shelton, WA 98584. 129 pp.
Brooks, K.M. 2001. An evaluation of the relationship between salmon farm biomass, organic
inputs to sediments, physicochemical changes associated with those inputs and the infaunal response – with emphasis on total sediment sulfides, total volatile solids, and oxidation-reduction potential as surrogate endpoints for biological monitoring. Technical report prepared for The Technical Advisory Group, British Columbia Ministry of Environment, 2080-A Labieux Road, Nanaimo, British Columbia, Canada V9T 6J9. 242 pages.
Brooks, K.M. 2003. Measurement of nutrients in bottom water under and adjacent to the
Deepwater Point mussel farm in Totten Inlet, Washington. Prepared for the Pacific Shellfish Institute, 120 State Avenue NE #142, Olympia, Washington as part of Department of Commerce Award No. NA16RG1591. 9 pp.
Brooks, K.M. 2005a. Baseline information describing sediment physicochemistry of Totten Inlet
and the macrobenthos of the proposed North Totten Inlet mussel farm. Aquatic Environmental Sciences, 644 Old Eaglemount Road, Port Townsend, WA 98368. 64 pp.
Brooks, K.M. 2005b. Benthic response at the Deepwater Point mussel farm in Totten Inlet, Puget
Sound, Washington State, U.S.A. Aquatic Environmental Sciences, 644 Old Eaglemount Road, Port Townsend, WA 98368. 41 pp.
Brooks, K.M. 2005c. The epibenthic community observed in association with the intensive raft
culture of Mytilus edulis galloprovincialis in Totten Inlet, Washington. Funded by the U.S. Department of Commerce Award No. NA16RG1591. Submitted to Pacific Shellfish Institute, 120 State Avenue NE #142, Olympia, WA 98501.
Crawford, C.M., C.K.A. Macleod and I.M. Mitchell. 2003. Effects of shellfish farming on the
benthic environment. Aquaculture 224:117-140. Dame, R.F., J.D. Spurrier and T.G. Wolaver. 1989. Carbon, nitrogen and phosphorus processing
by an oyster reef. Marine Ecology Progress Series. 54:249-256. Dame, R.F., N. Dankers, T.C. Prins, H. Jongsma and A.C. Smaal. 1991. The influence of mussel
beds on nutrients in the western Wadden Sea and eastern Scheldt estuaries. Estuaries. 14:130-138.
49 AES Supplemental Study of Dissolved Nutrients and Particulate Organic Matter: 10/06/08
Dame, R.F., J.D. Spurrier and R.G. Zingmark. 1992. In situ metabolism of an oyster reef. J. Exp. Mar. Ecol. 164:147-159.
Dame, R.F. and T. Prins. 1997. Bivalve carrying capacity in coastal ecosystems. Aquatic
Ecology. Vol. 31, pp. 409-421. Duarte, P., R. Meneses, A.J.S. Hawkins, M. Zhu, J. Fang and J. Grant. 2003. Mathematical
modeling to asses the carrying capacity for multi-species culture within coastal waters. Ecological Modelling 168:109-143.
EDAW. 1998. Visual Impact and Ecological Concerns Assessment for the Totten Inlet Mussel
Rafts Project. Report prepared by EDAW, Inc. in association with Evans-Hamilton, Inc. and Richard Dame, Ph.D. for Taylor Resources, Inc., S.E. 130 Lynch Road, Shelton, Washington 98584. 43 pp., plus appendices.
Falcao, M., P. Duarte, D. Mathias, S. Joaquim, T. Fontes and R. Meneses. 2000. Relatorio final
do projecto Gestao do cultivo de bivalves na Ria Formosa com recurso a madelacao matematica. Instituto para a Conservacao de Natureza. 107 pp. (Cited in Duarte et al. (2003).
Figueiras, F.G., U. Labarta and M.J. Fernandez-Reiriz. 2002. Coastal upwelling, primary
production and mussel growth in the Rias Baixas of Galicia. Hydrobiologia 484:121-131. Gardiner, W.W., B.C. Gregg and J.Q. Word. 2007. An assessment of a Proposed Mussel Raft
Impacts to Surrounding Waters and Associated Biota of Totten Inlet. MEC – Weston Solutions, Inc., 152 Sunset View Lane, Sequim, WA 98382. 76 pp.
Gibbs, M.M., S.E. Pickmere, P.H. Woods, G.W. Payne, M.r. James, R.W. Hickman and J.
Illingworth. 1992. Nutrient and chlorophyll a variability at six station\ns associated with mussel farming in Pelorus Sound, 1984-85. New Zealand Journal of Marine and Freshwater Research 20:197-211.
Grant, J., J.Stenton-Dozey, P. Monteiro, G. Pitcher and K. Heasman. 1998. Shellfish Culture in
the Benguela System: A carbon budget of Saldanha Bay for Raft Culture of Mytilus galloprovincialis. J. Shellfish Research. Vol. 17(1):41-49.
Haamer, j. 1996. Improving water quality in a eutrophied fjord system with mussel farming.
Ambio 25:356-362. Herman, P.M.J. and H. Scholten. 1990. Can suspension-feeders stabilize estuarine ecosystems?
In: Barnes, M., and Gibson (eds.), Trophic Relationships in the Marine Environment (pp. 104-116). Aberdeen University Press, Aberdeen, Scotland.
Herman, P.M.J. 1993. A set of models to investigate the role of benthic suspension feeders in
estuarine ecosystems. In Bivalve filter feeders in estuarine and coastal ecosystem processes. NATO ASI Series. Series G: Ecological sciences edn. Vol. 33. R. Dame (Ed.) pp. 421-454.
50 AES Supplemental Study of Dissolved Nutrients and Particulate Organic Matter: 10/06/08
Libes, S.M. 1992. Introduction to marine biogeochemistry. John wiley and Sons, Incl. New York. 734 pp.
Newell, R.I.E., J. C. Cornwell and M.S. Owens. 2002. Influence of simulated bivalve
biodeposition and microphytobenthos on sediment nitrogen dynamics: A laboratory study. Limnol. Oceanogr., 47(5): 1367-1379.
Newell, R.I.E. (In-Review) Environmental change in the coastal environment: the influence of
bivalve suspension-feeders on phytoplankton and inorganic nutrient cycling. Bull. Fish. Res. Agen. 23 pp.
Newton, J.A., S.L. Albertson, K. Van Voorhis, C. Maloy, and E. Siegel. 2002. Washington State Marine Water Quality, 1998 through 2000. Washington State Department of Ecology Publication No. 0203-056. 125 pp. plus appendices.
Page, H.M. and D.M. Hubbard. 1987. Temporal and spatial patterns of growth in mussels
Mytilus edulis on an offshore platform: relationships to water temperature and food availability. J. Exp. Mar. Biol. Ecol. 111:159-179.
Pitcher, G.C. and D. Calder. 1998. Shellfish mariculture in the Benguela System: phytoplankton
and the availability of food for commercial mussel farms in Saldanha Bay, South Africa. J. Shellfish Res. 17:15-25.
Rice, M.A. 2004 (In-review). Environmental Impacts of Shellfish Aquaculture: Filter Feeding
to Control Eutrophication. Department of Fisheries, Animal & Veterinary Science, University of Rhode Island. 11 pp.
Stenton-Dozey, J., T. Probyn and A. Busby. 1999. Impact of mussel raft-culture (Mytilus
galloprovincialis) on macrofauna and in situ benthic oxygen uptake and nutrient fluxes in Saldanha Bay, Souh Aftrica. Paper presented at the ICES symposium on Environmental Effects of Mariculture. Saint Andrews, Canada, September 1999. 33 pp.
Strohmeier, T., J. Aure, A. Duinker, T. Castberg, A. Svardal and O. Strand. 2005. Flow
reduction, seston depletion, meat content and distribution of diarrhetic shellfish toxins in a long-line blue mussel (Mytilus edulis) farm. J. Shellfish Res. Vol. 24(1):15-23.
WDOE. 1998. Washington State Marine Water Quality in 1996 and 1997. Washington State
Department of Ecology Publication No. 98-339. 98 pp., plus appendices. WDOE 2002. Washington State Marine Water Quality, 1998 through 2000. Washington State
Department of Ecology report 02-03-056. 111 pp. plus appendices. Available at http:///www.ecy.wa.gov/biblio/0203056.html.