Supplementary appendix This appendix formed part of the original submission and has been peer reviewed. We post it as supplied by the authors. Supplement to: Wood AM, Kaptoge S, Butterworth AS, et al. Risk thresholds for alcohol consumption: combined analysis of individual-participant data for 599 912 current drinkers in 83 prospective studies. Lancet 2018; 391: 1513–23.
Transcript
Supplementary appendixThis appendix formed part of the original submission and has been peer reviewed. We post it as supplied by the authors.
Supplement to: Wood AM, Kaptoge S, Butterworth AS, et al. Risk thresholds for alcohol consumption: combined analysis of individual-participant data for 599 912 current drinkers in 83 prospective studies. Lancet 2018; 391: 1513–23.
1
Annex 1: Harmonisation of drinking amount across the contributing studies
Emerging Risk Factors Collaboration
Data on alcohol were harmonised at the ERFC coordinating centre in consensus with the individual study collaborators.
Studies used a variety of questionnaire-based approaches (eg, self-administered vs interview-led questionnaires; food
frequency questionnaires vs dietary recall surveys) to provide information on alcohol consumption, which included semi-
quantitative information (eg, amount in a given period, frequency of drinks in a given period, categories for amount or
frequency) of different types of alcoholic drinks (ie, beer, wine, cider, spirits/liquor, alcopops, long drink, fortified wine,
liqueur, sake, shochu, tharra, aperitif/digestif) (eTable 1). The available information was harmonised into variables
denoting (in order of precedence): amount, status, duration, stop age, start age, years stopped, usage frequency. When
information was provided as semi-quantitative categories of intake, alcohol amount was assigned based on the mid-points
of bounded categories or the lower bound of an open-ended highest category. Alcohol status was categorised as “never”,
“never/ex”, “ex”, “ex/current” and “current” drinkers. The alcohol status categories “never/ex” and “ex/current” included
studies that did not definitively distinguish between never and ex drinkers, or between ex and current drinkers,
respectively. Subsequently, drinking amount was set to missing for participants with “ex/current” drinking status as it
was not possible to distinguish current drinking amount. Information on alcohol amount was converted to a UK standard
scale of grams/week (1 unit=8 grams of ethanol). Alcohol status and amount were cross-referenced with each other to
resolve ambiguous data and update missing information.
EPIC-CVD
Intake of alcoholic drinks at baseline was calculated from validated country-specific dietary questionnaires aimed to
capture specificity of local dietary habits. The number of standard glasses of alcoholic drinks (beer, cider, wine, sweet
liquor, distilled spirits or fortified wines) consumed per day/week during the 12 months prior to recruitment were reported
by participants. In each country, intake was calculated based on the estimated ethanol content and usual glass volume for
each type of alcoholic beverage1. To this purpose, information from highly standardized 24-hr dietary recalls from a
subset of the cohort was used. Information on lifetime alcohol intake were collected with lifestyle questionnaires
administered at baseline. Information on lifetime alcohol consumption was assessed as number of glasses of different
drinks consumed at 20, 30, 40 and 50 years of age consumed per week, and then computed as a weighted usual and
expressed as grams per week. Information on alcohol amount was then converted to a standard scale of grams/week (1
unit=8 grams of alcohol).
2
UK Biobank
Intake of alcoholic drinks at baseline was obtained from a touchscreen questionnaire which was used to extract
information on status, intake frequency (per month) and beverage type (ie, red wine, white wine/champagne, beer, spirits,
fortified wine). See https://biobank.ctsu.ox.ac.uk/crystal/docs/TouchscreenQuestionsMainFinal.pdf. Information on total
alcohol amount was then calculated and converted to a standard scale of grams/week (1 unit=8 grams of alcohol).
1Bergmann MM, Rehm J, Klipstein-Grobusch K, Boeing H, Schütze M, Drogan De , et al. The association of pattern of
lifetime alcohol use and cause of death in the European prospective investigation into cancer and nutrition (EPIC) study.
Int J Epidemiol. 2013;42(6): 1772–1790.
3
Annex 2 ERFC Study Acronyms
ARIC, Atherosclerosis Risk in Communities Study
AFTCAPS, Air Force/Texas Coronary Atherosclerosis Prevention Study
ATENA, cohort of Progetto CUORE
ATTICA, ATTICA study
AUSDIAB, Australian Diabetes, Obesity and Lifestyle Study
eTable 2: Summary of individual-level baseline characteristics, mortality and major cardiovascular outcomes by baseline alcohol consumption categories.
13
*All-cause mortality events derived only from the 13,670 participants in the random sub-cohort of EPIC-CVD, rather than from
the much larger number of participants in the full prospective EPIC study
eTable 3: Summary of events for 83 studies, restricted to current drinkers.
eTable 4. Comparison of baseline characteristics of individuals used in main analysis versus individuals with repeat measures of alcohol consumption or measures of lifetime
alcohol consumption from the contributing data sources.
SD = standard deviation, BMI = body-mass index, HDL-C = high density lipoprotein cholesterol.
ERFC EPIC-CVD
UK Biobank
All participants Participants with repeat
measures of alcohol
consumption
All participants Participants with
measured lifetime alcohol
consumption
All participants Participants with repeat
measures of alcohol
consumption
Number of studies/centres 81 studies 35 studies 22 centres 17 centres 1 study 1 study
SD = standard deviation, BMI = body mass index, HDL-C = high density lipoprotein cholesterol.
* Type of alcohol predominantly consumed was determined from the maximum baseline consumption
grams/week for each alcohol type.
21
eFigure 1: Flow diagram of study selection process in current analysis
22
eFigure 2: Box plots of baseline alcohol consumption amongst 599,912 current drinkers from 83 studies by decade of first baseline survey.
23
eFigure 3a: Cross-sectional associations between baseline alcohol consumption and continuous
baseline characteristics.
Response means are adjusted to age 50 year and plotted at deciles of baseline alcohol consumption. Red squares and solid lines represent
associatons for females; blue squares and dashed lines represent associatons for males. The r values represent the age and sex adjusted partial
correlation coefficient between continuous baseline characteristics and alcohol consumption in males and females combined. The Y-axis is
labelled at the mean and +/- two standard deviations of the baseline characteristic of interest. BMI: Body-mass index, SBP: systolic blood
pressure, HDL-C: high density lipoprotein cholesterol. Vertical lines represent 95% CIs.
24
eFigure 3b: Cross-sectional associations between baseline consumption and categorical baseline characteristics.
Response means are adjusted to age 50 years. Red squares represent associatons for females; blue
squares represent associatons for males. Vertical lines represent 95% CIs.
25
eFigure 4: Shape of association of baseline alcohol consumption with all-cause mortality and all
cardiovascular disease amongst current drinkers.
Adjusted for age, smoking and history of diabetes, and stratified by sex and EPIC centre. Studies with
fewer than five events of any outcome were excluded from the analysis of that outcome. The sizes of
the boxes are proportional to the inverse of the variance of the log-transformed hazard ratios. The
reference category is the lowest alcohol consumption category (baseline consumption >0 and
≤25g/week). HRs are plotted against the mean baseline alcohol consumption in each category. Vertical
lines represent 95% CIs. The best-fitting fractional polynomial Cox models on the log scale were: all-cause
mortality, non-linear (ie, powers 0·5 and 1); and cardiovascular disease, non-linear (ie, powers 0 and 0).
26
eFigure 5. Shape of association of usual alcohol consumption with all-cause mortality for females and
males.
Adjusted for age, smoking and history of diabetes, and stratified by sex and EPIC centre. The reference
category is the lowest alcohol consumption category (baseline consumption >0 and ≤25g/week). HRs
are plotted against the mean usual alcohol consumption in each category. The sizes of the boxes are
proportional to the inverse of the variance of the log-transformed hazard ratios. Vertical lines represent
95% CIs.
27
eFigure 6. Shape of association of usual alcohol consumption with all-cause mortality by age-specific groups.
Adjusted for age, smoking and history of diabetes, and stratified by sex and EPIC centre. Baseline alcohol consumption categories amongst current drinkers were >0-≤50
grams/week, >50-≤100 grams/week, >100-≤150 grams/week, >150-≤250 grams/week, >250-≤350 grams/week and >350 grams/week. The reference category is the lowest
baseline alcohol consumption category (>0 and ≤50g/week). HRs are plotted against the mean usual alcohol consumption in each category.The sizes of the boxes are
proportional to the inverse of the variance of the log-transformed hazard ratios. Vertical lines represent 95% CIs.
28
eFigure 7. Shapes of associations of usual alcohol consumption with fatal and non-fatal major
cardiovascular causes.
Adjusted for age, smoking and history of diabetes, and stratified by sex and EPIC centre. Alcohol
consumption categories amongst current drinkers were >0-≤50 grams/week, >50-≤100 grams/week, >100-
≤150 grams/week, >150-≤250 grams/week, >250-≤350 grams/week and >350 grams/week. The reference
category is the lowest baseline alcohol consumption category (>0 and ≤50g/week). HRs are plotted against
the mean usual alcohol consumption in each category. Studies with fewer than five events of any outcome
were excluded from the analysis of that outcome. The sizes of the boxes are proportional to the inverse of
the variance of the log-transformed hazard ratios. Vertical lines represent 95% CIs.
29
eFigure 8. Shapes of associations of usual alcohol consumption with type of stroke.
Adjusted for age, smoking and history of diabetes, and stratified by sex and EPIC centre. Baseline alcohol
consumption categories amongst current drinkers were >0-≤50 grams/week, >50-≤100 grams/week, >100-
≤150 grams/week, >150-≤250 grams/week, >250-≤350 grams/week and >350 grams/week. The reference
category is the lowest baseline alcohol consumption category (>0 and ≤50g/week). HRs are plotted against
the mean usual alcohol consumption in each category. Studies with fewer than five events of any outcome
were excluded from the analysis of that outcome. The sizes of the boxes are proportional to the inverse of
the variance of the log-transformed hazard ratios. Vertical lines represent 95% CIs.
30
eFigure 9a: Hazard ratios per 100 grams/week higher usual alcohol consumption for subtypes of
cardiovascular outcomes amongst current drinkers, additionally adjusted for body-mass index.
eFigure 9b. Shape of association of usual alcohol consumption with all-cause mortality and all cardiovascular disease amongst current drinkers, additionally adjusted for body-mass
index.
Adjusted for BMI, age, smoking and history of diabetes, and stratified by sex and EPIC centre. Alcohol consumption
categories amongst current drinkers were >0-≤50 grams/week, >50-≤100 grams/week, >100-≤150 grams/week, >150-
≤250 grams/week, >250-≤350 grams/week and >350 grams/week. The reference category is the lowest baseline
alcohol consumption category (>0 and ≤50g/week). HRs are plotted against the mean usual alcohol consumption in
each category. Studies with fewer than five events of any outcome were excluded from the analysis of that outcome.
The sizes of the boxes are proportional to the inverse of the variance of the log-transformed hazard ratios. Vertical
lines represent 95% CIs.
31
eFigure 10: Shape of association between baseline alcohol consumption, including ex- and non-drinkers, with all cardiovascular disease and all-cause mortality.
Adjusted for age, smoking and history of diabetes, and stratified by sex and EPIC centre. Alcohol consumption categories amongst current drinkers were >0-≤50 grams/week,
>50-≤100 grams/week, >100-≤150 grams/week, >150-≤250 grams/week, >250-≤350 grams/week and >350 grams/week. The reference category is the lowest baseline
alcohol consumption category (>0 and ≤50g/week). Studies with fewer than five events of any outcome were excluded from the analysis of that outcome. The sizes of the
boxes are proportional to the inverse of the variance of the log-transformed hazard ratios. Vertical lines represent 95% CIs. Individuals for whom we were unable to
distinguish as ex- or never- drinkers were excluded from the analysis.
32
eFigure 11: Hazard ratios per 100 grams/week higher baseline alcohol consumption for subtypes of cardiovascular outcomes amongst current drinkers with
recorded baseline alcohol consumption (left) compared against all current drinkers using multiple imputation (right).
Missing alcohol consumption (log transformed) for known current drinkers was imputed using standard multiple imputation methods separately within each study, using
known predictors for age, gender, smoking status, history of diabetes, indicators for all CVD disease categories listed in table above and their corresponding Nelson-Aalen
estimators, weighted appropriately for the sampling fraction in EPIC-CVD (see White, I. R., Royston, P. and Wood, A. M. (2011), Multiple imputation using chained
equations: Issues and guidance for practice. Statist. Med., 30: 377–399. doi:10.1002/sim.4067). Twenty imputed datasets were created for each study. The analysis was then
performed separately by study, pooling imputation-specific estimates using Rubin’s rules. This was followed by a random-effects meta-analysis.
33
eFigure 12: Shapes of associations of baseline alcohol consumption with stroke and coronary
outcomes amongst alcohol drinkers
Adjusted for age, smoking and history of diabetes, and stratified by sex and EPIC centre. The reference
category is the lowest baseline alcohol consumption category (>0 and ≤25g/week). HRs are plotted
against the mean baseline alcohol consumption in each category. Studies with fewer than five events of
any outcome were excluded from the analysis of that outcome. The sizes of the boxes are proportional
to the inverse of the variance of the log-transformed hazard ratios. Vertical lines represent 95% CIs.
The best-fitting fractional polynomial Cox models on the log scale were: all stroke, linear (ie, powers
linear (ie, powers 1); heart failure, linear (ie, powers 1); and deaths from other types of cardiovascular
disease, linear (ie, powers 1).
34
eFigure 13: Best fitting second degree fractional polynomial for the modelled shape of association
between baseline alcohol consumption with all-cause mortality.
To estimate the alcohol consumption level at which mortality risk was lowest, we conducted nonlinear
modelling by fitting a Cox regression model stratified by cohort, sex and trial arm (where applicable), to
determine a best fitting second degree fractional polynomial model (FP2) for baseline alcohol
consumption.
35
eFigure 14: Hazard ratios per 100 grams/week higher usual alcohol consumption for subtypes
of cardiovascular outcomes amongst current drinkers from a fixed-effect meta-analysis.
Adjusted for age, smoking and history of diabetes.
Studies of the same design (ie, prospective, case-cohort and nested case-control studies) were analysed
together in a single model, stratified by cohort, sex and EPIC centre. Results from each study design
were then combined in a fixed-effect meta-analysis. Studies with fewer than five events of any outcome
were excluded from the analysis of that outcome.
36
eFigure 15: Hazard ratios per 100 grams/week higher usual alcohol consumption for subtypes
of cardiovascular outcomes amongst current drinkers, from fixed-effect analysis with
inclusion of studies with fewer than 5 outcomes of a particular type.
Adjusted for age, smoking and history of diabetes.
Studies of the same design (ie, prospective, case-cohort and nested case-control studies) were analysed
together in a single model, stratified by cohort, sex and EPIC centre. Results from each study design
were then combined in a fixed-effect meta-analysis. This analysis included all studies.
37
eFigure 16: Shapes of associations of usual alcohol consumption with stroke and coronary outcomes
amongst current alcohol drinkers restricted to studies recording both fatal and non-fatal endpoints.
Analysis restricted to studies recording fatal and non-fatal cardiovascular diseases. Adjusted for age,
smoking and history of diabetes, and stratified by sex and EPIC centre. Alcohol consumption
categories amongst current drinkers were >0-≤50 grams/week, >50-≤100 grams/week, >100-≤150
grams/week, >150-≤250 grams/week, >250-≤350 grams/week and >350 grams/week. The reference
category is the lowest baseline alcohol consumption category (>0 and ≤50g/week). HRs are plotted
against the mean usual alcohol consumption in each category. Studies with fewer than five events of
any outcome were excluded from the analysis of that outcome. The sizes of the boxes are proportional
to the inverse of the variance of the log-transformed hazard ratios. Vertical lines represent 95% CIs.
38
eFigure 17: Shapes of associations of baseline alcohol consumption with all-cause mortality by (a) consumption frequency, (b) consumption type* and (c) binge drinking
status.
Adjusted for age, smoking and history of diabetes, and stratified by sex and EPIC centre.
*Analysis was performed separately for each alcohol consumption type (351,342 wine drinkers; 227,469 beer drinkers; 171,770 spirits drinkers). Individuals drinking more
than one type of alcohol were included in each separate analysis.
39
eFigure 18. Hazard ratios per 100 grams/week higher baseline alcohol consumption for major
cardiovascular outcomes amongst current drinkers and by alcohol type.
Analyses were restricted to 430,433 individuals with known alcohol type (351,342 wine drinkers; 227,469 beer drinkers;
Adjusted for age, smoking and history of diabetes, and stratified by sex and EPIC centre. Indicator variables for
consumption-type were also included in the models.
Studies with fewer than five events of any outcome were excluded from the analysis of that outcome.
P-value1 for difference in hazard ratios for beer versus wine and spirits versus wine. Comparisons were restricted to
beer and wine drinkers and spirits and wine drinkers respectively.
P-value2 for difference in hazard ratios for beer versus spirits. Comparison was restricted to beer and spirits drinkers.
40
eFigure 19a-e: Hazard ratios per 100 gram/week increase in usual alcohol consumption for major vascular outcomes
amongst current drinkers by study/cohort-level characteristics.
41
42
Adjusted for age, smoking and history of diabetes, and stratified by sex and EPIC centre. Studies with fewer than five
events of any outcome were excluded from the analysis of that outcome. The sizes of the boxes are proportional to the
inverse of the variance of the log-transformed hazard ratios.
Geographical region “other” included studies in Australia and New Zealand. Studies from Japan were exlcuded. The
studies included in this analysis recruited participants over different calendar periods (ERFC: 1964-2008; EPIC-CVD:
1990-2002; UK Biobank: 2005-2014)
43
eFigure 20a-e: Hazard ratios per 100 gram/week higher usual alcohol consumption for major cardiovascular outcomes amongst current drinkers by individual-level characteristics.
44
45
HRs were adjusted for age, smoking and history of diabetes and stratified by EPIC centre. BMI = body
mass index; bottom third <24.10 kg/m2, middle third 24.10-27.18 kg/m2, top third >27.18kg/m2. SBP =
systolic blood pressure; bottom third <123 mmHg, middle third 123-141mmHg, top third>141mmHg.
HDL-c bottom third <1.10 mmol/l, middle third 1.19-1.51mmol/l and top third >1.51 mmol/l. Self-
reported general health[0-1] bottom half <0.67, top half>=0.67.
46
eFigure 21. Funnel plots and assessment of small-study effects for study-specfic hazard ratios per 100 gram/week increase in usual alcohol consumption for major
vascular outcomes amongst current drinkers.
47
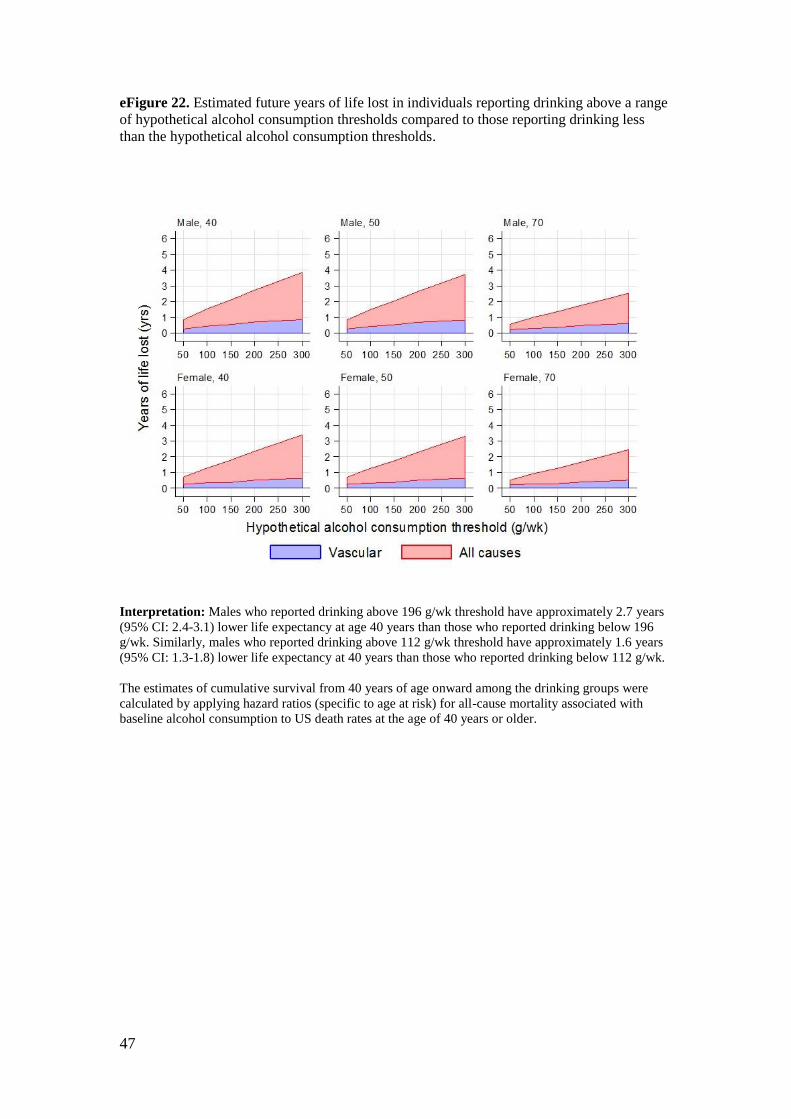
eFigure 22. Estimated future years of life lost in individuals reporting drinking above a range
of hypothetical alcohol consumption thresholds compared to those reporting drinking less
than the hypothetical alcohol consumption thresholds.
Interpretation: Males who reported drinking above 196 g/wk threshold have approximately 2.7 years
(95% CI: 2.4-3.1) lower life expectancy at age 40 years than those who reported drinking below 196
g/wk. Similarly, males who reported drinking above 112 g/wk threshold have approximately 1.6 years
(95% CI: 1.3-1.8) lower life expectancy at 40 years than those who reported drinking below 112 g/wk.
The estimates of cumulative survival from 40 years of age onward among the drinking groups were
calculated by applying hazard ratios (specific to age at risk) for all-cause mortality associated with
baseline alcohol consumption to US death rates at the age of 40 years or older.