Supplementary appendix This appendix formed part of the original submission and has been peer reviewed. We post it as supplied by the authors. Supplement to: Olmos D, Brewer D, Clark J,et al. Prognostic value of blood mRNA expression signatures in castration-resistant prostate cancer: a prospective, two-stage study. Lancet Oncol 2012; published online Oct 9. http://dx.doi.org/10.1016/S1470- 2045(12)70372-8.
Transcript
Supplementary appendixThis appendix formed part of the original submission and has been peer reviewed. We post it as supplied by the authors.
Supplement to: Olmos D, Brewer D, Clark J,et al. Prognostic value of blood mRNA expression signatures in castration-resistant prostate cancer: a prospective, two-stage study. Lancet Oncol 2012; published online Oct 9. http://dx.doi.org/10.1016/S1470-2045(12)70372-8.
SUPPLEMENTARY METHODS. Data analysis and statistical considerations Differential expression analysis was applied to the dataset using various groupings. Linear models were determined for each probeset and an estimate for the overall variance calculated by an empirical Bayes approach1. The linear models also included variables to take into account the variance caused by plate, centre and patient cohort. A moderated t-statistic was computed for each transcript cluster with the resulting p values adjusted for multiple testing using Benjamini and Hochberg’s method to control the false discovery rate2. Those transcript clusters with an adjusted p < 0.05 were considered significantly differentially expressed between the groups considered. Latent process decomposition (LPD) was used to classify our samples into groups as has been described in detail previously3. It is an unsupervised Bayesian approach that assigns a probability that each sample belongs to a particular group. There are two steps to this method, the first is to find the optimal number of processes (or groups) in the structure of the data and the second is to assign probabilities for each sample that it belongs to each of the approaches. Both a maximum likelihood and maximum a posteriori (MAP) model using variational LPD are used in the process selection step. The top 500 expression profiles of probesets with greatest variability across the data was scaled to a standard normal distribution and used as input. A sample was said to belong to a particular group if its probability of belonging was greater than 0.5. Hierarchical clustering (HC) analyses carried out by a method similar to that described previously 4. Briefly, HC analyses were used on all tumour samples using the complete gene- level dataset of 17 881 probesets, using an agglomerative HC method (package hclust in the R statistical programming language) using a dissimilarity metric defined by Pearson’s correlation (1 − Pearson’s correlation) and the average agglomerative method that combines clusters where the mean distance between the elements of each cluster are smallest. Principal component analysis was performed with data from each probeset scaled to have unit variance. Gene- enrichment analysis was used to test whether sets of genes defining published prognostic signatures were differentially expressed between different LPD groups and whether LPD genes were expressed in other sets. The approach used is that described in the ‘Limma’5 and is based on the proposals of Mootha et al41. Microarray tissue expression data was obtained from http://biogps.gnf.org. Lists of genes expressed differentially between the LPD defined groups were uploaded into the Ingenuity pathway analysis application (Ingenuity, Mountain View, CA, USA). A score was computed for each network according to the fit of the original set of significant genes. This score reflects the negative logarithm of the p-value, which indicates the likelihood of the focus genes in a network being found together as a result of random chance. The random forest machine learning algorithm was used to develop a 10 probeset signature that would be suitable to be used as a test for LPD group 1 membership6. This algorithm is an ensemble classifier that grows many classification trees. Each tree is built using a bootstrap of the samples, and at each divide a random subset of variables are selected as candidates. Each tree has a “vote”, and the classification with the most votes is assigned to the test sample. Firstly, a dataset with all features in was used to determine the 10 probesets that contribute the most to a classifier. In more detail: a ranked list of most important features was produced for each of a 100 bootstrap sample sets, the 10 probesets with the smallest mean rank across sample sets were selected. Then the dataset was reduced to the gene expression profiles of these 10 probesets and the final classifier produced. Performance was determined by 10-fold cross-validation. The number of input variables tried at each split was set to 6, the number of trees set to 500, and the minimum size of the terminal nodes were set to 1. The associations of LPD expression patterns groups with baseline clinical characteristics were analyzed using Chi-square test or Fisher's exact test, Spearman correlation rank test, or Mann-Whitney U test for categorical, ordinal or continuous variables, respectively. Survival analyses were performed on data from CRPC patients using time of blood drawn to death (events) or last follow up (censored event). Univariable and multivariable analyses were carried out by proportional hazard (Cox) regression analysis. Median overall survival (OS) and the 95% confidence intervals (CIs) for each LPD group were determined with the Kaplan–Meier method and OS curves were compared using the log-rank test. Model selection will be performed on multivariable Cox regression models using Akaike information criteria (AIC) based bi-directional selection to drop non-contributing factors. Date cut-off for this analysis was 31/09/2010. Unless otherwise specified all analyses were performed using R software or SPSS version 16.0 (SPSS Inc., Illinois, USA).
Supplementary Methods References 1. Sartor MA, Tomlinson CR, Wesselkamper SC, Sivaganesan S, Leikauf GD, Medvedovic M. Intensity-based hierarchical Bayes method improves testing for differentially expressed genes in microarray experiments. BMC bioinformatics. 2006;7(1):538. 2. Benjamini Y, Hochberg Y. Controlling the false discovery rate: a practical and powerful approach to multiple testing. Journal of the Royal Statistical Society Series B (Methodological). 1995;57(1):289-300. 3. Rogers S, Girolami M, Campbell C, Breitling R. The latent process decomposition of cDNA microarray data sets. IEEE/ACM Transactions on Computational Biology and Bioinformatics. 2005:143-56. 4. Lee YF, John M, Falconer A, Edwards S, Clark J, Flohr P, et al. A gene expression signature associated with metastatic outcome in human leiomyosarcomas. Cancer Res. 2004 Oct;64(20):7201-4. 5. Smyth GK. Linear models and empirical Bayes methods for assessing differential expression in microarray experiments. Statistical applications in genetics and molecular biology. 2004;3(1):1027. 6. Breiman L. Random forests. Machine learning. 2001;45(1):5-32.
SUPPLEMENTARY TABLES
Supplementary table 1. TaqMan probes for selected LPD1 signature or upregulated genes
Gene symbol TaqMan probe ID
TERF2IP Hs00430292_m1
RIOK3 Hs01590882_m1
GABARAPL2 Hs00371854_m1
STOM Hs00925242_m1
CRISP2 Hs00162960_m1
SLC4A1 Hs00175592_m1
SNCA Hs01103383_m1
TFDP1 Hs00955491_gH
IFI27 Hs00271467_m1
RHAG Hs00165623_m1
MMP8 Hs00233972_m1
GYPA Hs00266777_m1
HMBS Hs00609296_g1
TMCC2 Hs01099575_m1
HBB Hs00747223_g1
18s rRNA Hs03003631_g1
Supplementary table 2. Primers used in the detection of TMPRSS2/ERG transcripts in blood
TMPRSS2/ERG transcripts by PCR
Initial 35 cycle PCR primers
ERG exon 5 primer GTAGTTCATCCCAACGGTGTCTG
TMPRSS2 exon 1 primer CAGGAGGCGGAGGCGGA
35 cycle nested PCR primers
ERG exon 5 primer CCCAACGGTGTCTGGGCTG
TMPRSS2 exon 1 primer GGAGCGCCGCCTGGAG
Supplementary Table 3. Significantly and differentially expressed genes between CRPC and AS patients. http://www.icr.ac.uk/array/array.html Supplementary Table 4. Significantly and differentially expressed genes in LPD1 vs LPD2/3/4 http://www.icr.ac.uk/array/array.html Supplementary Table 5. Significantly and differentially expressed genes in LPD2 vs LPD1/3/4 http://www.icr.ac.uk/array/array.html Supplementary Table 6. Significantly and differentially expressed genes in LPD3 vs LPD1/2/4 http://www.icr.ac.uk/array/array.html Supplementary Table 7. Significantly and differentially expressed genes in LPD4 vs LPD1-3 http://www.icr.ac.uk/array/array.html
� � �CRPC AS T/ERG RTPCR Positive T/ERG RTPCR Negative
��
�
�
�
� �
� �
�
�
�
� �
�
�
�
� �
�
�
���
�
� �
�
�
�
�
�
�
�
�
�
�
�
� �
�
�
�
� �
�
�
�
�
�
�
�
��
�
�
�
�
�
� �� ��
�
�
�
�
�
�
�
1.5 2.0 2.5 3.0 3.5 4.0
KLK3 (PSA)
log2 expression signal
LPD
pro
cess
12
34
A
B
C
S1 (Supplementary Figure 1). Prostate cancer associated genes expression and TMPRSS2/ERG by RT-PCR across the different LPD groups. A. ERG expression array data, B. AR expression array data, C. PSA expression array data.
PC1
PC
2
−100
−50
0
50
100
150
�
�
�
�
�
�
�
�
�
�
�
�
�
�
�
�
�
� �
�
�
�
�
�
�
�
�
� �
�
��
�
�
�
�
�
�
�
�
�
�
�
�
�
�
�
��
�
�
�
�
�
�
�
�
�
−200 −100 0 100 200
Group� one� two� three� four
CRPC.Survillnce� CRPC
Surveillance
0.00
0.01
0.02
0.03
0.04
Cluster Dendrogram
hclust (*, "average")d
Hei
ght
Group B Group C Group A
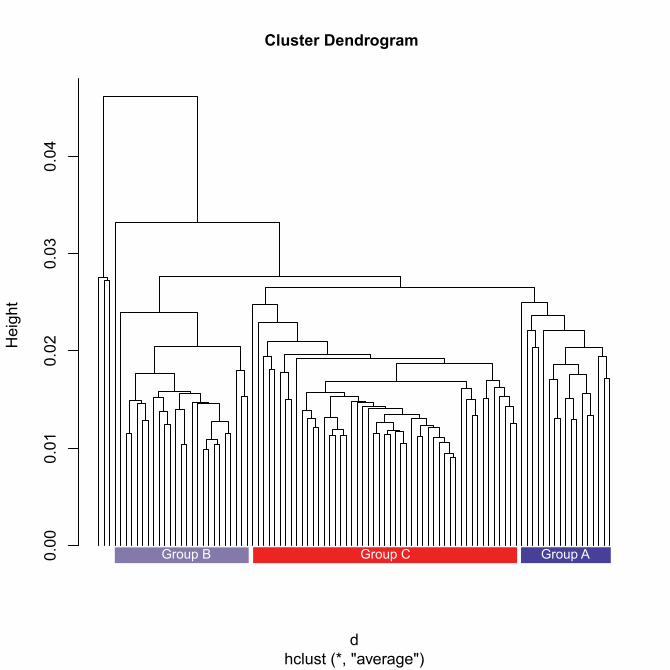
S2 (Supplementary Figure 2). A. Principal component analysis (PCA) of the data. B. Hierarchical clustering of the expression data.
0 200 400 600 800 1000
0.0
0.2
0.4
0.6
0.8
1.0
Log rank test p − value = 0.00192Days
Pro
porti
on s
urvi
ved
LPD GroupABC
S3 (Supplementary Figure 3). Kaplan-Meier overall survival (OS) curves according to HC group A (red line), HC group B (green line) or HC group C (blue line) membership in CRPC patients. Log-rank test p-value = 0.00192.
TMCC2−Hs01099575_m1
HMBS−Hs00609296_g1
GYPA−Hs00266777_m1
MMP8−Hs00233972_m1
RHAG−Hs00165623_m1
IFI27−Hs00271467_m1
TFDP1−Hs00955491_gH
TERF2IP−Hs00430292_m1
RIOK3−Hs01590882_m1
GABARAPL2−Hs00371854_m1
STOM−Hs00925242_m1
SLC4A1−Hs00175592_m1
SNCA−Hs01103383_m1
CRISP2−Hs00162960_m1
HBB−Hs00747223_g1
LPD group
1234
S4 (Supplementary Figure 4). Heatmap of the Top 5 LPD1 upregulated genes and the 9 signature genes (annotated on the right) evaluated with TaqMan probes in the 94 patient samples. The dendrogram on the top ilustrates the arrangement of patients clusters using Euclidean distance as the distance metric. The vertical dendrogram on the left illustrates the strength of genes clusters within the signature.
Only genes found to be differential expressed (LPD1 vs rest) in our dataset
Principal component 1 (34.03% variance)
Prin
cipa
l com
pone
nt 2
(11.
51%
var
ianc
e)
−60
−40
−20
0
20
��
�
�
�
���
�
�
� �
�
�
�
�
�
�
�
��
�
�
�
�
� �
�
�
�
�
�
��
�
�
�
�
�
�
�
�
�
�
�
�
�
�
�
�
�
��
��
�
�
�
−80 −60 −40 −20 0 20 40
GroupLPD1
� LPD2� LPD3� LPD4
Control
CRPC
Surveillance
S5 (Supplementary Figure 5). Using probesets found to be significantly and differentially expressed between LPD1 and LPD2-4 we performed PCA on a dataset which included normal controls. The first principal component accounting for 34% of variance separated LPD1 from LPD2, LPD3 and LPD4 and the controls without cancer. The second principal component accounting for 12% of variance separated the prostate cancer (PrCa) samples from the controls without cancer. This suggests that blood expression may indicate both PrCa and aggressive PrCa.