12
Supplementary Figure 1: Examples for the structures obtained (interactive, additive and major effects) by fitting ANOVA model.
| Date post: | 14-May-2018 |
| Category: |
Documents |
| Upload: | trinhthuan |
| View: | 220 times |
| Download: | 0 times |

Supplementary Figure 1: Examples for the structures obtained (interactive, additive and
major effects) by fitting ANOVA model.
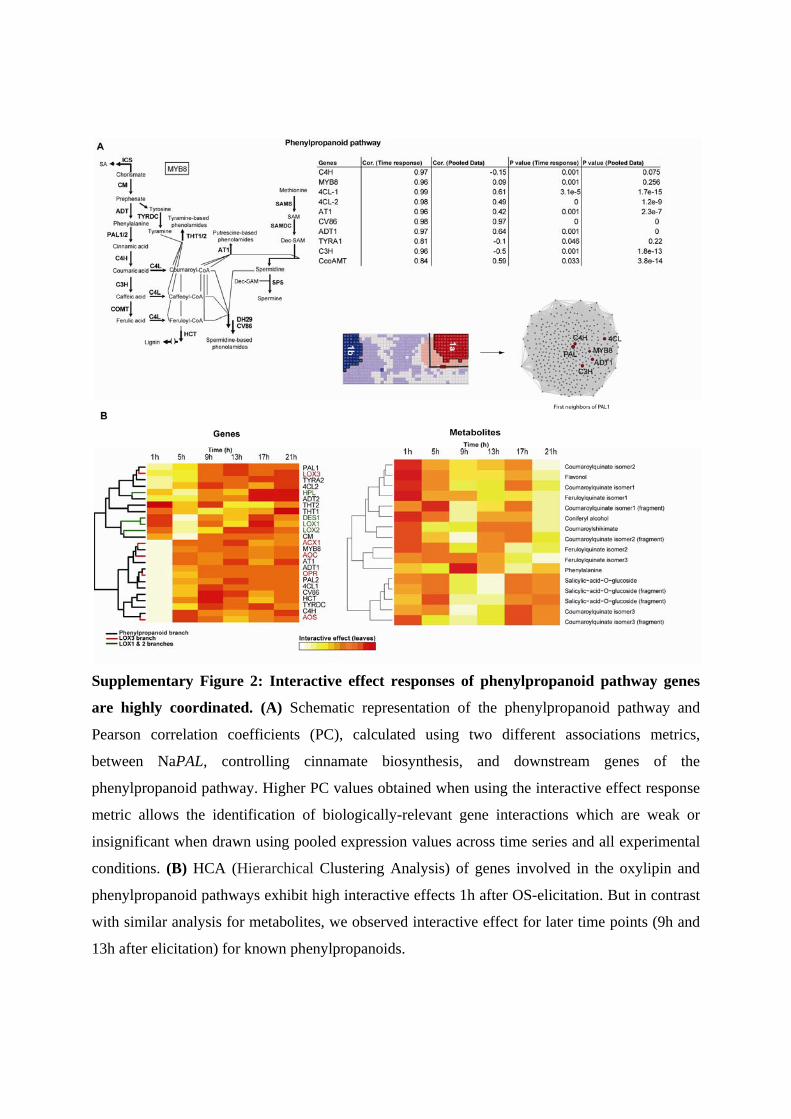
Supplementary Figure 2: Interactive effect responses of phenylpropanoid pathway genes
are highly coordinated. (A) Schematic representation of the phenylpropanoid pathway and
Pearson correlation coefficients (PC), calculated using two different associations metrics,
between NaPAL, controlling cinnamate biosynthesis, and downstream genes of the
phenylpropanoid pathway. Higher PC values obtained when using the interactive effect response
metric allows the identification of biologically-relevant gene interactions which are weak or
insignificant when drawn using pooled expression values across time series and all experimental
conditions. (B) HCA (Hierarchical Clustering Analysis) of genes involved in the oxylipin and
phenylpropanoid pathways exhibit high interactive effects 1h after OS-elicitation. But in contrast
with similar analysis for metabolites, we observed interactive effect for later time points (9h and
13h after elicitation) for known phenylpropanoids.
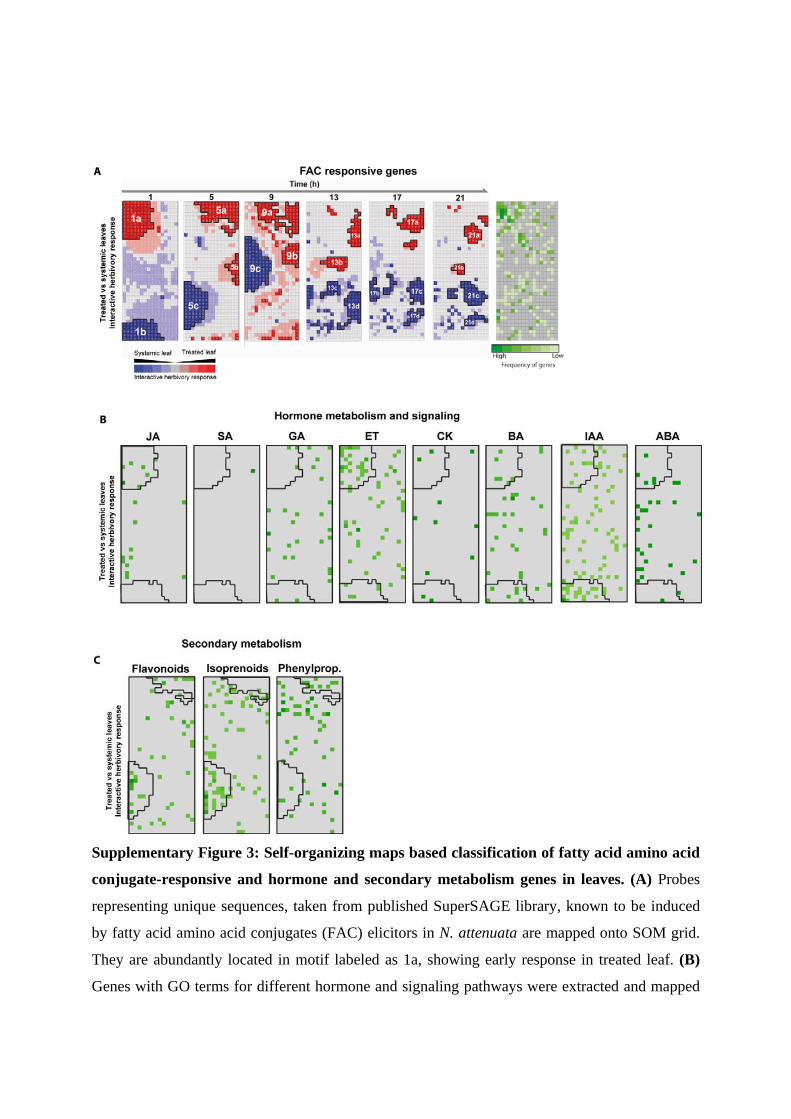
Supplementary Figure 3: Self-organizing maps based classification of fatty acid amino acid
conjugate-responsive and hormone and secondary metabolism genes in leaves. (A) Probes
representing unique sequences, taken from published SuperSAGE library, known to be induced
by fatty acid amino acid conjugates (FAC) elicitors in N. attenuata are mapped onto SOM grid.
They are abundantly located in motif labeled as 1a, showing early response in treated leaf. (B)
Genes with GO terms for different hormone and signaling pathways were extracted and mapped

onto SOM grid. While genes of the JA (jasmonic acid) and ET (ethylene) signaling pathways
were found overrepresented in the motif labeled as 1a and showing early responses in the treated
leaf, those of the auxin pathway were more abundantly located in the motif labeled as 1b with
major activation in the untreated systemic leaf. (C) Similarly, genes with GO terms involved in
the flavonoid, isoprenoid, and phenylpropanoid pathways were mapped onto the SOM grid and
found overrepresented in motifs labeled as 5a and 5c, indicating the importance of OS-specific
metabolic responses activated 5h after elicitation.

Supplementary Figure 4: Enriched GO terms for few important motifs extracted from
SOM analysis unravels large OS-specific gene expression responses in treated leaves and
systemic tissues (leaves and roots).
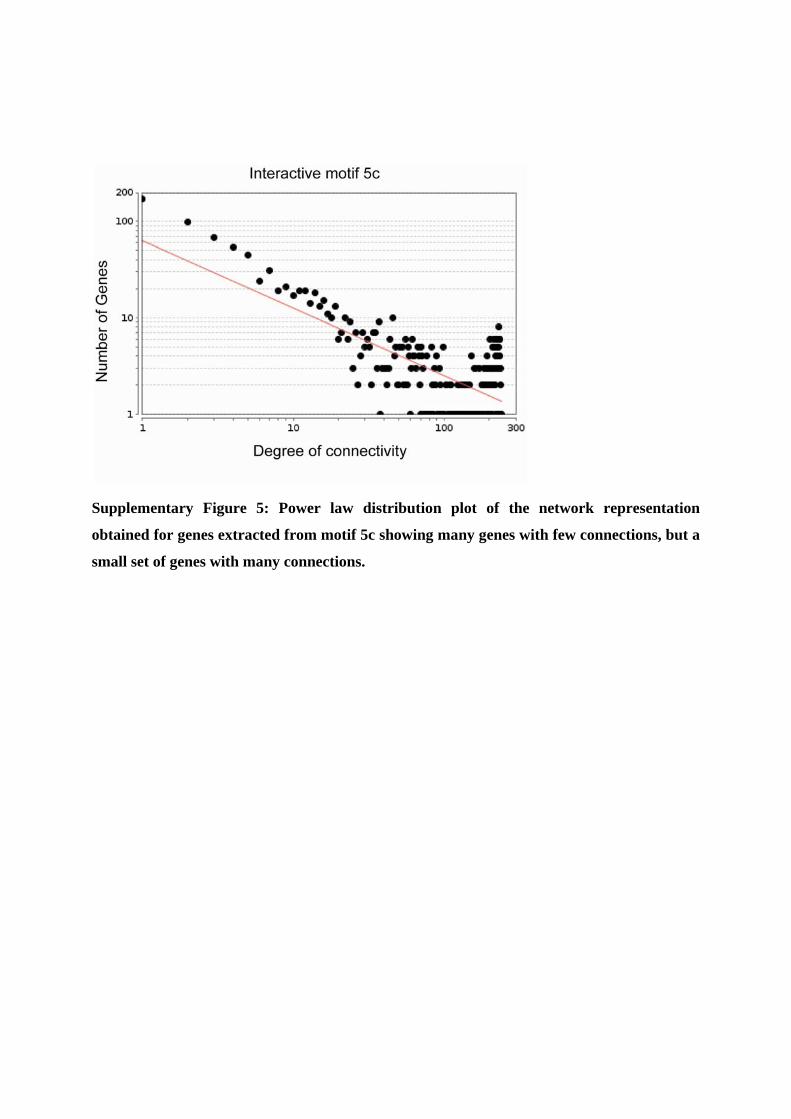
Supplementary Figure 5: Power law distribution plot of the network representation
obtained for genes extracted from motif 5c showing many genes with few connections, but a
small set of genes with many connections.

Supplementary Figure 6: Gene-gene Pearson Correlation (PC) for 6 genes from the non-
mevalonate pathway using 5 different metrics: The time response metric-based PC
calculations for all gene pairs are recovered with a threshold of 0.75 but not in the case of pooled
data or with expression data obtained from just one tissue type.
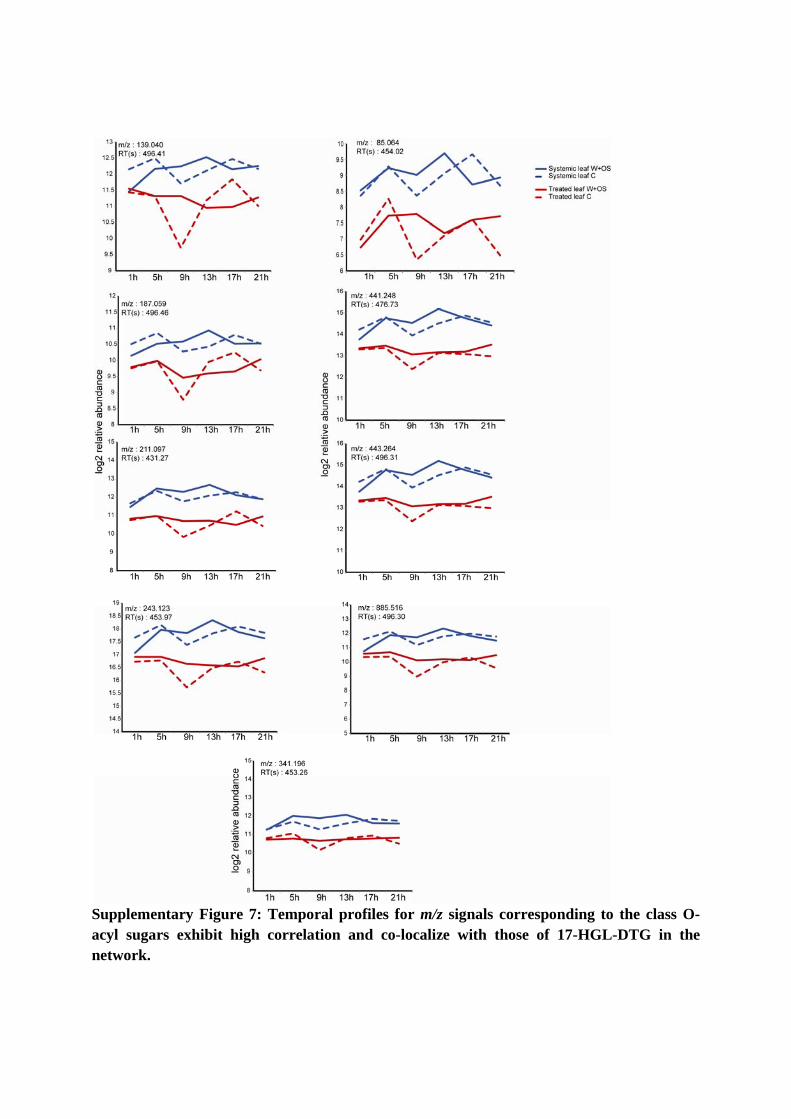
Supplementary Figure 7: Temporal profiles for m/z signals corresponding to the class O-acyl sugars exhibit high correlation and co-localize with those of 17-HGL-DTG in the network.
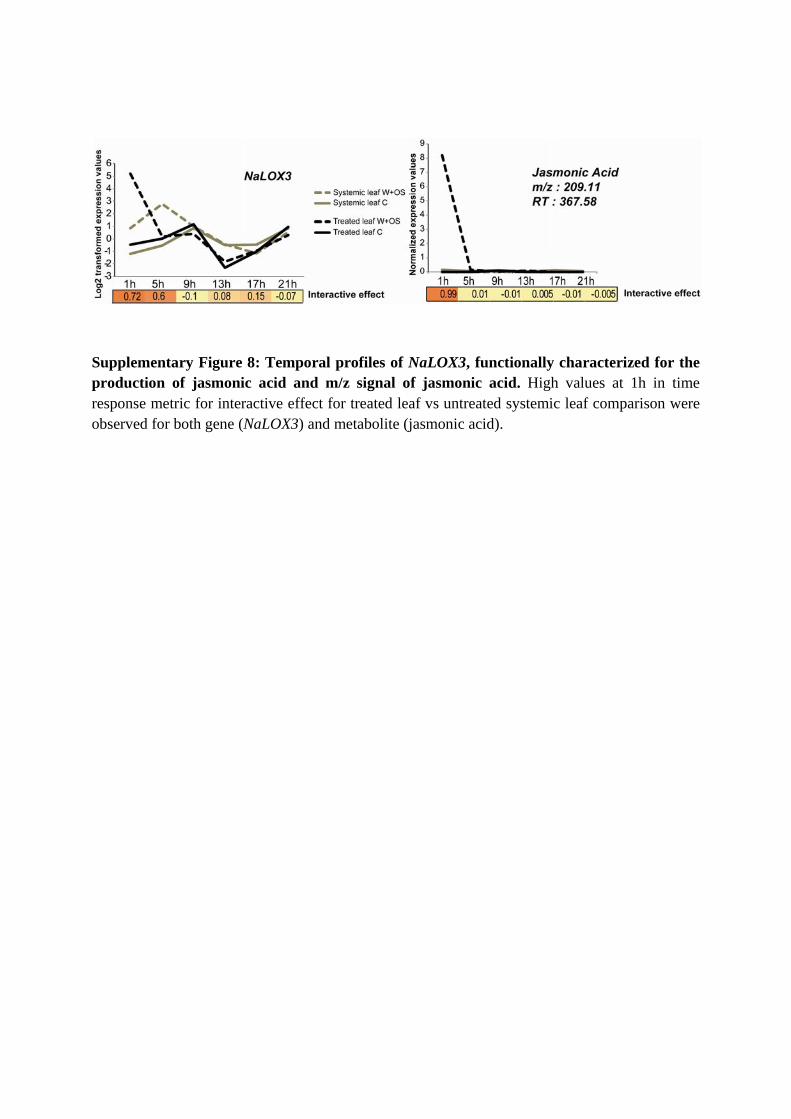
Supplementary Figure 8: Temporal profiles of NaLOX3, functionally characterized for the production of jasmonic acid and m/z signal of jasmonic acid. High values at 1h in time response metric for interactive effect for treated leaf vs untreated systemic leaf comparison were observed for both gene (NaLOX3) and metabolite (jasmonic acid).

Supplementary Method
Metabolite identification
Targeted structure elucidation analyses on metabolites presented in this study have previously been published (Gaquerel et al., 2010; Heiling et al., 2010; Weinhold et al., 2011). Briefly, each 17-HGL-DTG was purified, analyzed by MS2 high resolution HPLC-ESI/TOF-MS and its structure identified by NMR (Heiling et al., 2010). Fragmentation patterns of O-acyl sugars characterized in N. attenuata exhibit typical losses of acetylated and non-acetylated fructose, previously observed for O-acyl sugars described in other Solanaceae. Short fatty acid chains involved in N. attenuata O-acyl sugars were identified, after trans-methylation, by GC-MS and comparison with authentic compounds (Weinhold et al., 2011). However, the position of these acyl moieties could not be inferred from the MS2 analyses conducted on O-acyl sugars (Weinhold et al., 2011). Herbivory-inducible phenolic derivatives produced by N. attenuata have been identified by tandem MS analysis in a previous study (Okonkesung et al., 2012).
During the analysis of xcms-processed metabolomic matrices, m/z signals corresponding to molecular fragments of 17-HGL-DTG, O-acyl sugars and phenolic derivatives were annotated based on elemental formula predictions and analysis of tandem MS high resolution fragmentation patterns obtained by Gaquerel et al (2010). MS detection was carried out with a maXis ESIqTOF mass spectrometer operated in electrospray positive mode. Typical instrument settings were as follows: capillary voltage 4500 V, dry gas temperature 200 °C, dry gas flow of 8 L/min, capillary exit 117V and funnel RF 300Vpp.
Below are examples of tandem MS records obtained for one 17-HGL-DTG and one O-acyl sugars reported in this study, others are available in the Supplemental material of Gaquerel et al. (2010).
Nicotianoside I, [M+Na]+ (+MS2 m/z 885.4090, C41H66O19Na+, 18.4 min, 49 eV): 885.4098 (35.3 %, C41H66O19Na+, calc. 885.4090), 841.4192 (13.7 %, C40H66O17Na+, calc. 841.4192), 739.3487 (8.6 %, C35H56O15Na+, calc. 739.3511), 559.2874 (6.3 %, C29H44O9Na+, calc. 559.2877), 491.2973 (22.3 %, C26H44O7Na+, calc. 491.2979), 475.3023 (21.9 %, C26H44O6Na+, calc. 475.3031), 473.2868 (23.5 %, C26H42O6Na+, calc. 473.2873), 435.1103 (100 %, C15H24O13Na+, calc. 435.1109), 433.0949 (37.6 %, C15H22O13Na+, calc. 433.0952), 289.0530 (8.5 %, C9H14O9Na+, calc. 289.0530), 271.2424 (4.1 %, C20H31
+, calc. 271.2420).
Massbank best hit: - Authentic standard: purified from N. attenuata leaves and analyzed by NMR.
O-acyl sugar 1, [M+Na]+ (+MS2 m/z 603.2608, C26H44O14Na+, 19.08 min, 46 eV): 603.2608 (C26H44O14Na+, calc. 603.2623), 442.2119 (23.1 %, 13C1C19H34O9Na+, calc. 442.2128), 441.2083
(100 %, C20H34O9Na+, calc. 441.2095), 353.1558 (10.5 %, C16H26O7Na+, calc. 353.1571), 339.1399 (10.1 %, C15H24O7Na+, calc. 339.1414), 325.1252 (12.1 %, C14H22O7Na+, calc. 325.1257), 185.0419 (10.2 %, C6H10O5Na+, calc. 185.0420), 127.0389 (9.6 %, C6H7O3
+, calc. 127.0389).
Massbank best hit: - Authentic standard: -
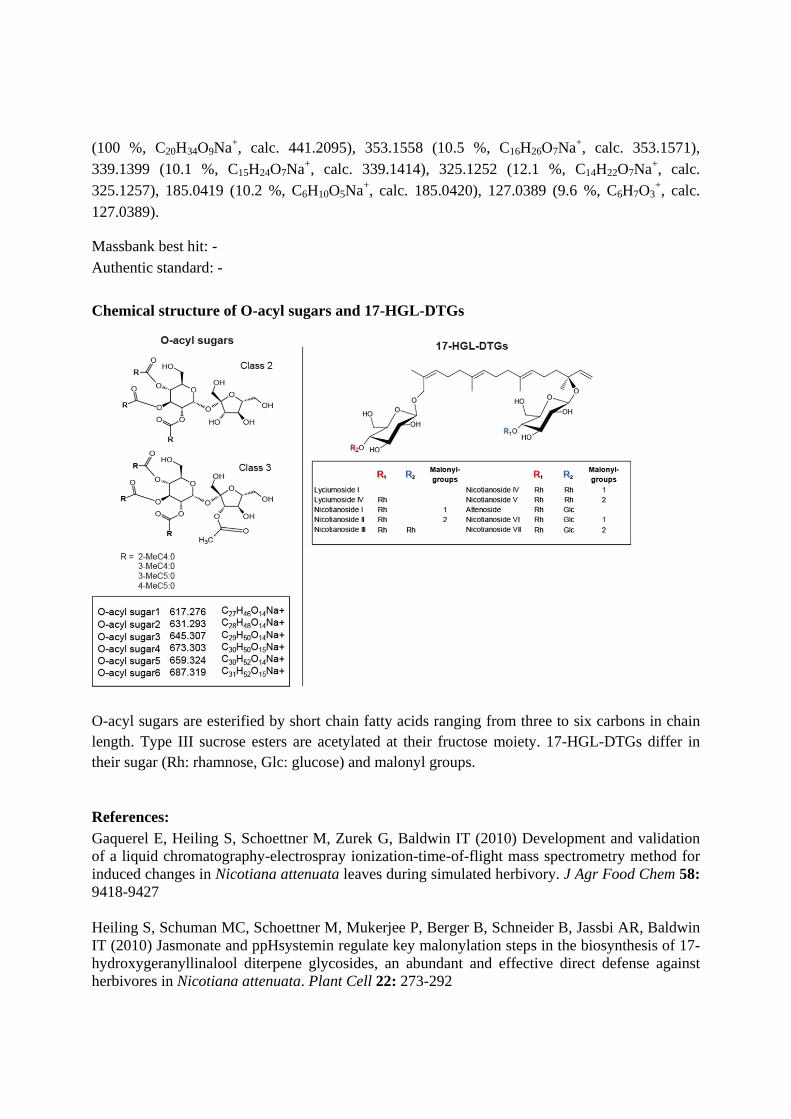
Chemical structure of O-acyl sugars and 17-HGL-DTGs
O-acyl sugars are esterified by short chain fatty acids ranging from three to six carbons in chain length. Type III sucrose esters are acetylated at their fructose moiety. 17-HGL-DTGs differ in their sugar (Rh: rhamnose, Glc: glucose) and malonyl groups.
References: Gaquerel E, Heiling S, Schoettner M, Zurek G, Baldwin IT (2010) Development and validation of a liquid chromatography-electrospray ionization-time-of-flight mass spectrometry method for induced changes in Nicotiana attenuata leaves during simulated herbivory. J Agr Food Chem 58: 9418-9427 Heiling S, Schuman MC, Schoettner M, Mukerjee P, Berger B, Schneider B, Jassbi AR, Baldwin IT (2010) Jasmonate and ppHsystemin regulate key malonylation steps in the biosynthesis of 17-hydroxygeranyllinalool diterpene glycosides, an abundant and effective direct defense against herbivores in Nicotiana attenuata. Plant Cell 22: 273-292

Onkokesung N, Gaquerel E, Kotkar H, Kaur H, Baldwin IT, Galis I (2012) MYB8 Controls Inducible Phenolamide Levels by Activating Three Novel Hydroxycinnamoyl-Coenzyme A:Polyamine Transferases in Nicotiana attenuata. Plant Physiol 158: 389-407 Weinhold A, Baldwin IT (2011) Trichome-derived O-acyl sugars are a first meal for caterpillars that tags them for predation. P Natl Acad Sci USA 108: 7855-7859


