Page 1
Supplementary Figures
Supplementary Figure 1. CV under standard conditions (pH 2.6, 0.1 M KNO3 in deionized water solution, 10
mV/s scan rate) of a nanoITO electrode after being immersed in a solution of 5 mM [Cp*Ir(pyalc)OH] for 12 hours,
showing that before activation with NaIO4 the pre-catalyst compound does not have the ability to bind to surfaces.
Experiments repeated with higher concentrations of [Cp*Ir(pyalc)OH] (up to 20 mM) and longer times (up to 48
hours) gave the same result. The catalyic wave at -0.3 V vs NHE corresponds to reduction of the substrate.
Supplementary Figure 2. CV in standard conditions of a nanoITO electrode that has been immersed in a 10 mM
solution of the free pyalc ligand (2-(2’pyridyl)-2-propanol) for 12 hours.
Page 2
Supplementary Figure 3. Control experiment using an 11 μm thick film of nanoITO on FTO/glass sample that had
been soaked in a solution of the precatalyst [Cp*Ir(pyalc)OH] in deionized water (10 mM). 25 μL of 0.25 M NaIO4
in deionized water was used as an oxidant, and the red arrow corresponds to injection. We found no evidence that
the precatalyst heterogenizes, prior to formation of the active species.
Supplementary Figure 4. Control experiment of a nanoITO on FTO/glass slide without catalyst for over one hour
to show no catalytic activity from the substrate. The Clark electrode consumes oxygen, causing the baseline to slope
downwards over long periods of time.
Page 3
Supplementary Figure 5. Cross-sectional SEM image of the catalyst-loaded nanoITO working electrode (top),
along with an SEM-EDX spectrum (bottom) showing presence of C, N, O, and Ir, in addition to In, Sn, Si, and O
from the conductive oxides (ITO and FTO) on glass. Al, Cu, and Zn peaks arise from the sample holder. Inset is a
higher resolution SEM image of the area scanned (scale bar: 100 nm), with only nanoITO particles of varied sizes
visible, all having been coated with the Ir-based molecular WOC. No I or Na was detected.
Page 4
Supplementary Figure 6. TEM image of the catalyst-coated nanoITO.
Supplementary Figure 7. HRTEM images of a bare nanoITO particle (left) compared to a nanoITO particle with
het-WOC on the surface (right). In the image on the right, the catalyst is being slowly burned by the concentrated
electron beam.
Page 5
Supplementary Figure 8. TEM-EDX spectrum zoomed in with Ir peaks identified using red arrows (other peaks
due to pyalc ligand, nanoITO substrate, SiO coated Cu TEM grid, and Al TEM sample holder).
Supplementary Figure 9. Diffuse reflectance UV-Vis data taken on samples soaked in homogeneous catalyst
solutions for 1 hour with (a) different concentrations of added NaIO3, and (b) different pH conditions, adjusted using
nitric acid.
Page 6
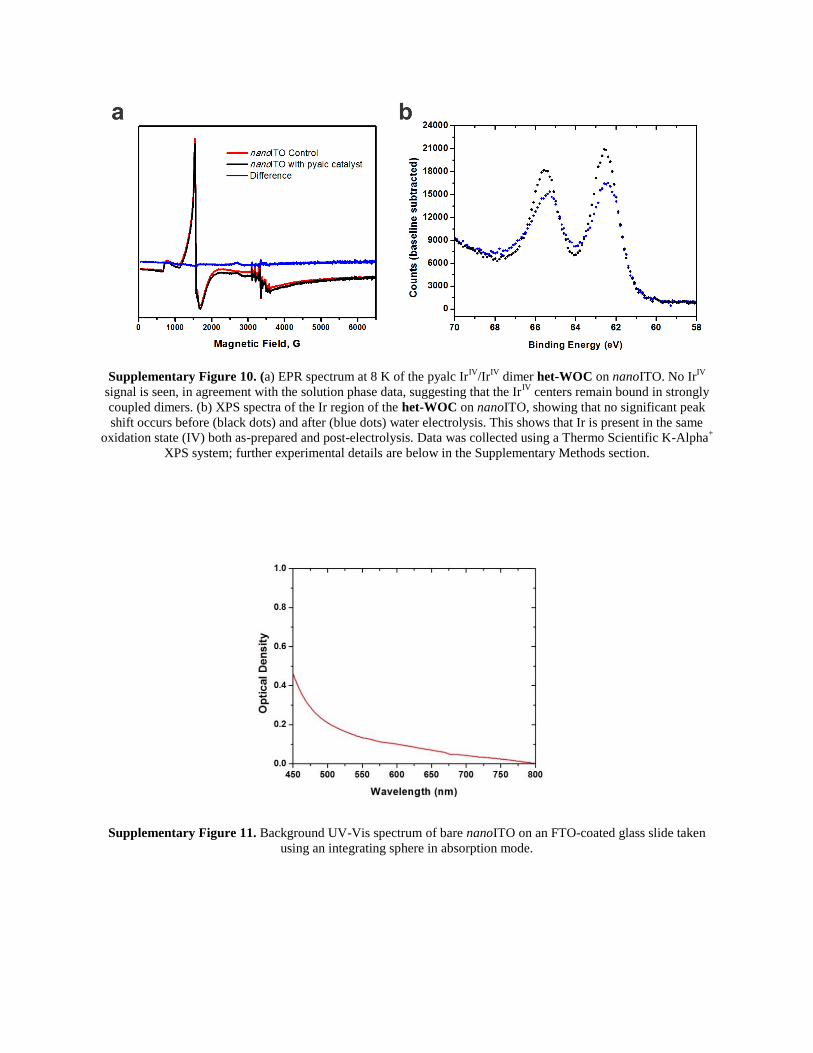
Supplementary Figure 10. (a) EPR spectrum at 8 K of the pyalc IrIV
/IrIV
dimer het-WOC on nanoITO. No IrIV
signal is seen, in agreement with the solution phase data, suggesting that the IrIV
centers remain bound in strongly
coupled dimers. (b) XPS spectra of the Ir region of the het-WOC on nanoITO, showing that no significant peak
shift occurs before (black dots) and after (blue dots) water electrolysis. This shows that Ir is present in the same
oxidation state (IV) both as-prepared and post-electrolysis. Data was collected using a Thermo Scientific K-Alpha+
XPS system; further experimental details are below in the Supplementary Methods section.
Supplementary Figure 11. Background UV-Vis spectrum of bare nanoITO on an FTO-coated glass slide taken
using an integrating sphere in absorption mode.
Page 7
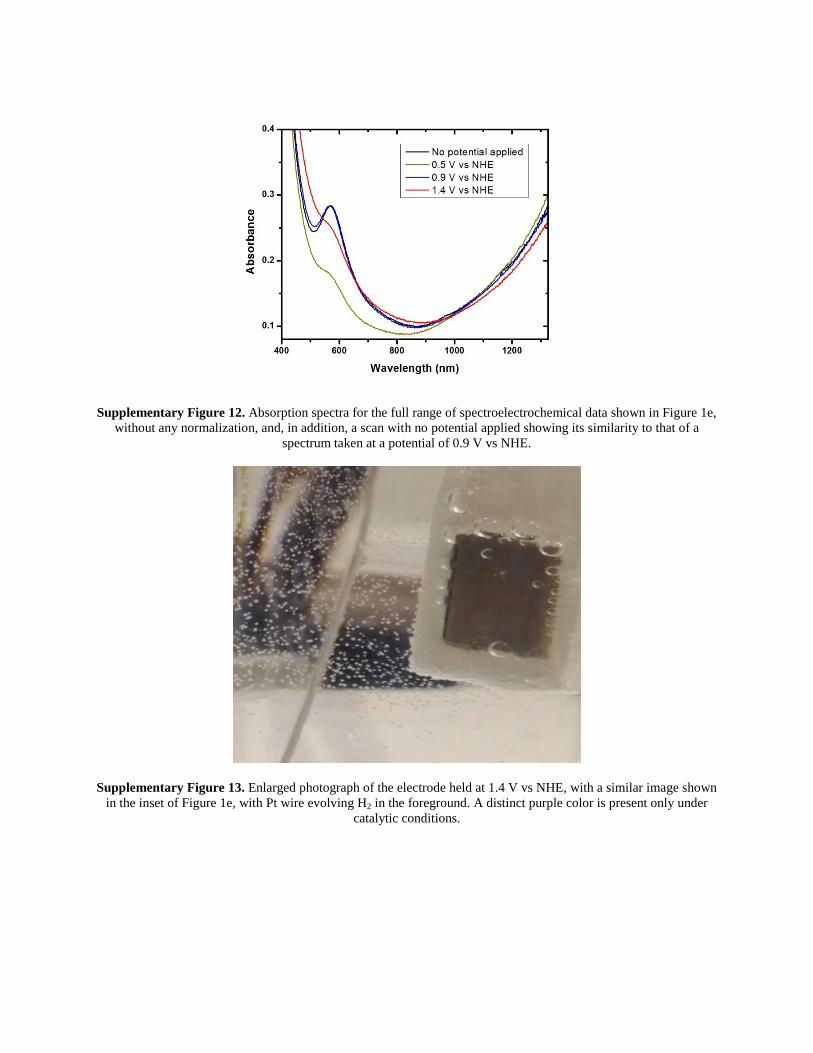
Supplementary Figure 12. Absorption spectra for the full range of spectroelectrochemical data shown in Figure 1e,
without any normalization, and, in addition, a scan with no potential applied showing its similarity to that of a
spectrum taken at a potential of 0.9 V vs NHE.
Supplementary Figure 13. Enlarged photograph of the electrode held at 1.4 V vs NHE, with a similar image shown
in the inset of Figure 1e, with Pt wire evolving H2 in the foreground. A distinct purple color is present only under
catalytic conditions.
Page 8
Supplementary Figure 14. Left image: TiO2 electrodes without (left) and with (right) molecular iridium WOC
bound to the surface. Right image: WO3 electrodes without (left) and with (right) molecular iridium WOC bound to
the surface.
Supplementary Figure 15. Increased turnover of heterogenized catalyst using a chemical oxidant, achieved by
decreasing nanoITO film thickness in the sample used thereby decreasing amount of Ir WOC relative to NaIO4
oxidant (500 μL of 0.1 M NaIO4 in deionized water, red arrow corresponds to injection). This sample contained ~1.6
nmol of iridium. This sample was prepared using a conductive epoxy and copper wire similarly to electrochemical
samples, so that catalyst loading could be confirmed by taking a CV and integrating the IrIII
/IrIV
peak which detected
1.55 nmol of electroactive Ir.
Page 9
Supplementary Figure 16. To show that the surface-bound Ir WOC behaves electrochemically as a surface
monolayer, the IrIII
/IrIV
redox wave was investigated at different scan rates. Varied scan rate CVs for the
heterogeneous Ir WOC on nanoITO. Traces correspond to scan rates as follows: yellow: 20 mV/s, pink: 50 mV/s,
light blue: 100 mV/s, blue: 200 mV/s, green: 300 mV/s, red: 400 mV/s, black: 500 mV/s. Standard electrolyte
conditions at pH 2.6 were used. . Integrals of the forward and reverse waves increased approximately linearly with
scan rate.
Supplementary Figure 17. Tafel plots taken in H2O (red) and 99.9% D2O (black) showing a KIE of approximately
1 below the onset of mass-transport associated limitations at η > 0.25 V.
Page 10
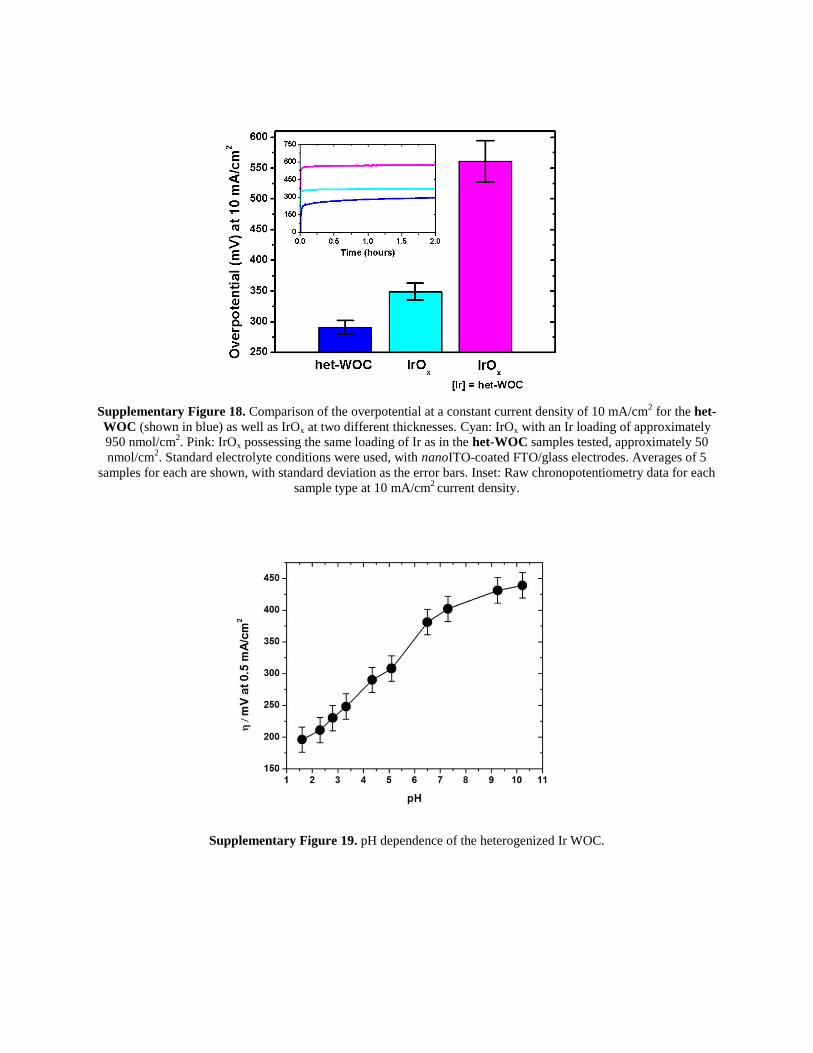
Supplementary Figure 18. Comparison of the overpotential at a constant current density of 10 mA/cm
2 for the het-
WOC (shown in blue) as well as IrOx at two different thicknesses. Cyan: IrOx with an Ir loading of approximately
950 nmol/cm2. Pink: IrOx possessing the same loading of Ir as in the het-WOC samples tested, approximately 50
nmol/cm2. Standard electrolyte conditions were used, with nanoITO-coated FTO/glass electrodes. Averages of 5
samples for each are shown, with standard deviation as the error bars. Inset: Raw chronopotentiometry data for each
sample type at 10 mA/cm2 current density.
Supplementary Figure 19. pH dependence of the heterogenized Ir WOC.
Page 11
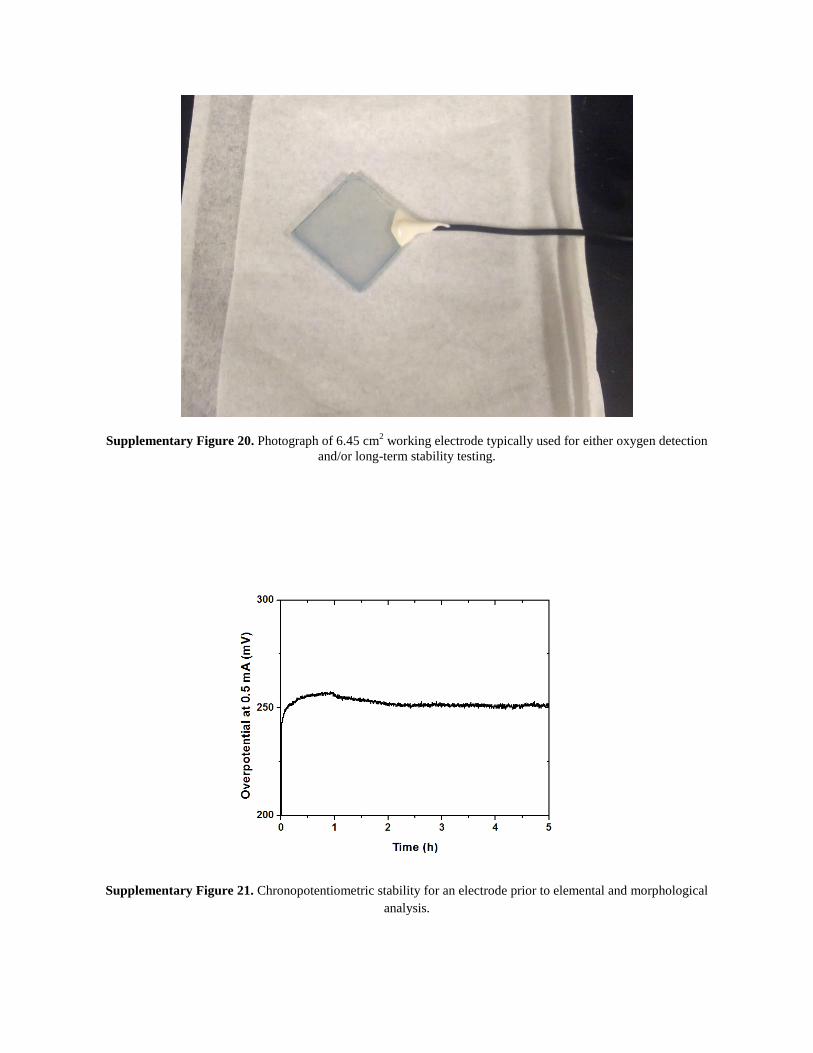
Supplementary Figure 20. Photograph of 6.45 cm2 working electrode typically used for either oxygen detection
and/or long-term stability testing.
Supplementary Figure 21. Chronopotentiometric stability for an electrode prior to elemental and morphological
analysis.
Page 12
Supplementary Figure 22. Chronoamperometric stability at 2 V vs NHE of the catalyst on nanoITO on FTO/glass
(red) vs a bare nanoITO control (blue) with catalyst loading approximately 2 nmol/cm2, demonstrating that this
catalyst can withstand high potentials for large-scale water splitting. Noise in the red trace is due to bubble
formation and release, data were taken while rapidly stirring the electrolyte solution. Electrolyte conditions: 0.1 M
KNO3 at pH 2.5.
Supplementary Figure 23. Detected oxygen by phase fluorometry (red) and predicted maximum oxygen output
from the electrode (black) calculated from current passed through the electrode. Lag time in detection is due to
trapped oxygen bubbles that eventually escape to the headspace while stirring the electrolyte solution.
Page 13
Supplementary Figure 24. Photograph of two-chamber oxygen detection set-up. Headspace volume noted in the
experimental details above.
Page 14
Supplementary Figure 25. HAADF (a) and STEM-EDX (b-e) maps taken using a post-electrolysis sample showing
that Ir has not formed nanoparticles and still conformally coats the nanoITO particles. Color scheme follows Figure
7 in the manuscript. C is also shown (teal) in contrast to Supplementary Figure 26. However, sensitivity for C is
poor in EDX because of both a low signal to noise ratio due to to adventitious carbon and the low atomic weight of
C. XPS is therefore used to more accurately quantify carbon content, and the C XPS spectrum of an equivalent
sample is shown in Figure 8 of the main text.
Page 15
Supplementary Figure 26. Additional HAADF (a) and STEM-EDX (b-e) maps of a sample heated to 500 °C
showing no nanoparticle formation. C is shown in teal and is significantly less than shown in an unheated sample,
such as in Supplementary Figure 25. C XPS of an equivalent sample is shown in Supplementary Figure 27 (red
trace).
Supplementary Figure 27. XPS from an electrode heated to 500 °C (red) compared to one with catalyst as-
deposited (blue, spectra from Figure 8 in the manuscript). Loss of C (left) aside from a small amount of adventitious
C is clear, as well as loss of N (right). This corresponds to the loss of the pyalc ligand at 500 °C by oxidative
removal in air.
Page 16
Supplementary Figure 28. A zoomed out STEM-EDX map of the nanoparticles formed by heating an electrode
coated with Ir WOC to 700 °C is shown (left). All elements (Ir, Sn, In, using the same color scheme as in the main
text) are detected, showing obvious iridium oxide nanoparticles formed in the nanoITO matrix. For comparison, the
STEM-EDX maps shown in Figure 7 of an unheated sample are overlaid in a similar manner and displayed on the
right.
Supplementary Figure 29. XPS survey scan of the Ir WOC on nanoITO electrode, multiplexed high resolution
scans are shown in Figure 8 of the main text. C, N, O, Ir, In, and Sn are the only elements detected.
Page 17
Supplementary Figure 30. Tunability of the catalyst’s properties by changing ligands is optically evident.
Left: bare TiO2 powder, middle: TiO2 powder with pyalc-bearing molecular Ir WOC bound to its surface, right:
TiO2 powder with bpy-bearing molecular Ir WOC bound to its surface.
Supplementary Figure 31. CVs of nanoITO electrodes with Ir WOCs bearing two different bidentate chelating
ligands. The bpy-bound Ir WOC possesses no similar features to the pyalc-bound one, and at no point during the CV
did it turn blue. It also shows a new feature at 1.1 V vs NHE, reproducible in successive CVs.
Page 18
Supplementary Figure 32. Comparison of oxygen evolution activity for pyalc- and bpy-coordinated heterogeneous
Ir WOCs using NaIO4 as an oxidant under identical conditions (25 μL of 0.25 M NaIO4 in deionized water, red
arrows corresponds to injection). Inset shows the bpy-coordinated catalyst trace zoomed in, to show that oxygen is
indeed detected, however, at a much lower rate. The same preparation procedures were used for both samples after
formation of their respective homogeneous catalyst prior to heterogenization.
Supplementary Figure 33. Photograph of 1 cm2 nanoITO on FTO-coated glass in a solution of the blue-colored
WOC, [IrIV
(pyalc)(H2O)2(µ-O)]22+
during heterogenization.
Page 19
Supplementary Figure 34. Photograph of the type of electrode used for gathering Tafel plots and other
electrochemical data.
Supplementary Figure 35. Left: chopped light I-V scan to show no significant optical response from the catalyst on
nanoITO, 50 mW/cm2, 400 nm LP filtered Xe lamp, 10 mV/s scan rate. Right: Photograph of the experimental set-
up.
Page 20
Supplementary Tables
Peak Position (eV) Supplementary Refs.
IrIV
4f 7/2: 62.00, 5/2: 64.98 1-3
N 1s 399.76 4
C 1s (C-C) 284.93 4
C 1s (C-N-C) 286.60 4 and 5
C 1s (C-O) 288.56 4 and 6
Supplementary Table 1. Peak fit parameters for Figure 8, measurements taken with an Al anode (1486.6 eV),
35.75 eV pass energy, and Au as a calibration standard.
Page 21
Supplementary Methods
Preparation of Working Electrodes. Working electrodes for electrochemical
characterization were constructed by spin-coating at 1000 rpm on 2.2 mm thick glass slides
coated with 500 nm of fluorine-doped tin oxide 30 seconds. NanoITO was added to a mortar and
pestle and ground for 10 minutes with glacial acetic acid, ethanol was then added to make a 5 M
acetic acid/ethanol mixture, which was then sonicated for 10 minutes. A spin rate of 1000 rpm
was used and amount of nanoITO in the 5 M acetic acid/ethanol mixture was varied between 5
wt% and 30 wt%, which resulted in films between approximately 300 nm and 7 μm. Greater
thicknesses were achieved by successive spin coating of additional layers beyond the first,
heating the particles on a hot plate to 200 °C for 10 minutes between coatings. For example, an
18 μm thick film was produced by spin coating three successive layers of 6 μm thick films using
a 27 wt% nanoITO in 5 M acetic acid/ethanol solution. No boundaries between spin coated
layers were observed in SEM for the thicker films. Heterogenization of the catalyst then follows
the procedure described in the methods section of the manuscript, with a 30 minute wait time
between mixing the precatalyst and NaIO4 and immersion of the electrodes to ensure that no
intermediate is being bound during its formation. Likely due to the oxidative stability of the
pyalc ligand, we found no significant changes to the catalyst species or its electrochemistry when
oxidizing the [Cp*Ir(pyalc)OH] precatalyst using NaIO4 equivalents between 20 and 100.
TiO2 slides were prepared by doctor blading a paste containing ~21 nm TiO2 nanoparticles (P25,
Sigma Aldrich) prepared according to published methods7 on an FTO-coated glass slide, then
heating in an oven to 450 °C in air for two hours. Heterogenization of [Ir(pyalc)(H2O)2(µ-O)]22+
on TiO2 required only immersion of the substrate into the solution. A WO3 paste for doctor
blading onto an FTO-coated glass slide was made similarly to the nanoITO spin-coating paste,
with 30 wt% WO3 nanoparticles (<100 nm, Sigma Aldrich) in a 5 M acetic acid/ethanol mixture.
After doctor blading onto an FTO-coated glass slide, the nanoparticles were heated in an oven to
550 °C in air for one hour. For attachment on WO3, the pH of the homogeneous catalyst in
solution was decreased to ~1.5 using a 1 M HNO3 solution prior to immersion. The samples were
allowed to sit for 12 hours (overnight) to ensure complete binding, then they were removed and
washed thoroughly with deionized water.
Effect of solution pH and iodate concentration on surface binding experiments. These were
performed on catalyst deposited on 3.5 μm thick spin-coated P25 TiO2 on glass cover slips
because of the higher stability of TiO2 at varied pH conditions when compared with ITO, which
allowed for more accurate characterization. For each experiment, slides of spin-coated TiO2 were
immersed in catalyst solutions, removed after 1 hour, washed thoroughly with deionized water,
and measured using an integrating sphere. These results were all reproduced in triplicate for
accuracy. The trends present in the amount of catalyst bound to the surface, as measured by the
catalyst’s absorption of visible light, are then used to compare the effect of solution conditions
on rate of surface binding between samples.
It is important to note that all samples contain a small amount of iodate anion and degradation
products from Cp* due to its oxidative removal from the precatalyst using NaIO4 (which decays
to NaIO3) for initial formation of the active catalyst, however the concentration is significantly
smaller than the amounts of added iodate in Supplementary Figure 9. The native pH of the
solution upon oxidation of precatalysts with NaIO4 is slightly acidic (4-5), at which point there is
Page 22
a 0.5 ratio of aqua and hydroxo bound Ir centers.8 The data in Supplementary Figure 9 shows
that increasing the amount of aqua bound Ir by lowering the homogeneous catalyst solution pH
greatly increases the rate of catalyst adhesion to the surface; while increasing the solution pH,
which deprotonates the aqua ligands thereby forming hydroxo-bound Ir centers, causes surface-
binding to be inhibited.
Electron Paramagnetic Resonance (EPR). EPR spectroscopy was performed on a Bruker
ELEXSYS E500 EPR spectrometer equipped with a SHQ resonator and an Oxford ESR-900
helium-flow cryostat. A microwave frequency of 9.4 GHz with 10 G modulation amplitude was
used, at a microwave power of 1 mW. The temperature in the cryostat was held constant between
7.5 K and 8 K using liquid helium. NanoITO used as a substrate for the surface-bound catalyst
due to its high surface area which allowed for a sufficient overall amount of catalyst,
significantly greater than the detection limit of the instrument, to be loaded into capillary tubes
for analysis. The catalyst-bound nanoparticles were made into a thick slurry with water and
packed into 3 10 μL capillary tubes, which were then sealed with a clay sealing compound
(corresponding to some of the background features in the spectra) and loaded into an EPR tube.
Acetone was added to the EPR tube to surround the capillaries and provide thermal conductivity
with the cryostat, and the tube was degassed using dry N2 to remove atmospheric oxygen.
We can compare this to the EPR spectrum of the hom-WOC8 to see that in both cases the Ir
IV
dimer species is not EPR-active. If a monomeric IrIV
species were present on the surface, we
would expect it to be EPR-active and have a spectrum similar to what was observed in Brewster
et al.9 Due to the lack of Ir –related features in the EPR spectra and no discernable signal
difference spectrum shown above, we can therefore postulate that the IrIV
compound that we
previously demonstrated to be a dimer in solution remains in dimer form in its resting IrIV
state
when bound to the surface of metal oxides. To control for any interactions with the conductive
nanoITO the experiments were reproduced on P25 TiO2, which is a much better insulator, and no
EPR-active IrIV
was found. Powers up to 20 mW were also tested, and no EPR-active IrIV
was
found.
Water Oxidation using NaIO4. Control experiments included nanoITO on FTO-coated glass
samples without any catalyst added, and that were soaked in the precatalyst solution. No catalytic
activity was found in any of the control experiments, as shown in Supplementary Figures 3 and 4.
In Figure 3a, a sample was used that was loaded with approximately 49.1 nmol of iridium.
Decreasing the amount of catalyst on the surface by decreasing nanoITO thickness, we were able
to achieve higher turnover numbers and turnover frequencies as seen in Supplementary Figure 15
due to both a larger ratio of oxidant to catalyst and a higher percentage of the catalyst easily
accessible to the solution without having to diffuse oxidant through the mesoporous nanoITO
film.
Determination of catalyst loading on electrodes. A brief description of this procedure is
included in the methods section of the manuscript. Specifically, when preparing heterogeneous
catalyst samples of Ir WOC bearing pyalc ligands, the absorption of the homogeneous catalyst
solution at 580 nm was monitored after introduction of a substrate, with a control lacking
nanoITO as a baseline. Fresh glassware must be used for each measurement due to the catalyst’s
ability to bind to numerous metal oxides, including SiO2. For electrochemical measurements
Page 23
mentioned in the text, electroactive iridium was used to gauge catalytic activity instead since it
could be determined with higher accuracy using CV peak integration of the IrIII
/IrIV
redox
feature. Using both of these measurements, the ratio of electroactive Ir to Ir present on the
surface detected by loss in absorption of the homogeneous catalyst solution during preparation
was typically >90% (± 5%). When not in a gas-tight cell performing phase fluorometric oxygen
detection, turnover numbers (TON) were estimated by the current passed through the electrode in
constant-current chronopotentiometry experiments, assuming a four-electron process for water
oxidation:
(1)
Where I is the current passed through the electrode in amperes, t is the time over which the
current was passed in seconds, F is the Faraday constant (96485 C/mol), and NIr is the amount of
electroactive iridium measured by the aforementioned CV peak integration in moles.
Electrochemical measurements were performed using a Princeton Applied Research Versastat 4-
400 in a standard three electrode configuration, CVs were taken with a 5 second equilibration
time at their starting potential prior to data collection.
Oxygen detection and faradaic yield. Headspace oxygen detection was performed using a
TauTheta MFPF-100kHz phase fluorometric oxygen detection system with a FOSPOR-R probe
(Ocean Optics). The experiment was performed in a custom-built two chamber gas-tight
electrochemical cell (Suppementary Figure 23). A sample made for long-term electrolysis was
constructed using conductive epoxy to secure a wire to bare FTO on a 6.45 cm2 geometric
surface area FTO-coated glass slide covered with a nanoITO film <300 nm thick. The
conductive epoxy was then coated with white marine epoxy, an example of this electrode design
is shown in Supplementary Figure 20. The two-chamber cell was fitted with an Ag/AgCl
reference electrode in the working electrode chamber and a Pt electrode in the counter electrode
chamber an filled with pH 2.6, 0.1 M KNO3 in deionized water. The FOSPOR-R probe was
inserted into a rubber septum that was secured on one of the apertures in the working electrode
chamber of the electrochemical cell, and all connections lacking an O-ring were wrapped tightly
with Parafilm and electrical tape. Both chambers were degassed under vigorous stirring with
high purity N2 for over 2 hours using needles inserted into rubber septa bubbling through the
electrolyte solution, while monitoring oxygen content to ensure that O2 in the system was
minimal. The needles were then removed and the purge was stopped, and O2 levels were
monitored for 30 minutes with no increase in O2 concentration to ensure a stable, oxygen-free
atmosphere had been achieved.
A constant overpotential of 520 mV was applied for two hours and the results are shown in
Supplementary Figure 23. Bubble formation on the working and counter electrodes was
immediately visible upon applying the potential. Vigorous stirring was necessary in order to
prevent bubble accumulation on the surface of the working electrode. This did cause some
oxygen bubbles to become trapped near the glass frit or the O-ring holding the working electrode
chamber together, causing a lag time between O2 bubble generation and detection in the
headspace. The volume of gas in the headspace of the working electrode chamber was measured
to be 38 mL. CVs were taken both before and after electrolysis with little change, showing
minimal loss of catalyst over the course of the experiment. By integration of the IrIII
/IrIV
redox
Page 24
wave, total electroactive iridium was determined to be ~0.66 nmol. This corresponds to
approximately 7.9 (± 0.6) turnovers of O2 per second per iridium atom, and a turnover number of
56,800 calculated by dividing the total number of moles of oxygen detected by the time an
electric potential was applied to the electrode, then dividing that number by the number of moles
of electroactive iridium atoms present. Faradaic yield was calculated to be 98.7%. No significant
current or oxygen generation was found at the same potential from a similar nanoITO on FTO-
coated glass electrode without the pyalc Ir WOC on the surface as a control.
Additional stability data. We found that the stability of the electrodes was highly reproducible
given the correct conditions, including either a buffered solution at low potentials, or an
unbuffered solution using a thin nanoITO film and the electrolyte stirred vigorously to prevent
the buildup of a pH gradient that leads to nanoITO etching. During TEM and SEM analysis, we
examined electrodes both before and after long-term electrolysis to show that there is no change
to sample morphology or nanoparticle formation. Supplementary Figure 21 shows one of these
electrodes that underwent hours of catalytic water oxidation at approximately 250 mV
overpotential with little to no observed decline in activity.
We also tested the stability of our catalyst on the surface at higher applied potentials. At applied
potentials as high as 2 V vs. NHE (approx. 2.15 V vs RHE), we see no catalyst degradation and
high current densities limited primarily by mass transport due to rapid bubble formation
(Supplementary Figure 22).
Tafel plots, pH dependence, and KIE. Tafel plots shown in Figure 5 were gathered using a Pt
mesh counter and Ag/AgCl reference electrode while the solution was stirred, with standard
electrolyte conditions except where noted in the manuscript. 25 mV steps with a 5 second rest
time between steps were used, beginning at 0.750 V vs Ag/AgCl and ending at 1.400 V vs
Ag/AgCl. No detectable current above the level of noise intrinsic to the experiment was found at
applied potentials below the thermodynamic potential for water oxidation. While electrodes
reached a stable current density in less than 1 minute at each step, experiments used up to 5
minutes of chronoamperometry per step to ensure that electrodes were adquately stabilized at
each point. Freshly prepared electrodes and electrolyte solutions were always used for Tafel plots.
Electrodes prepared for this and other electrochemical measurements such as CVs, pH
dependence, and thickness dependence used a geometric active area of 1 cm2. A wire was
attached to the FTO substrate using conductive epoxy, and the entire electrode aside from the
active area was encased in non-conductive marine epoxy to ensure no contribution to current
from catalyst bound to FTO or glass. A photograph of this type of electrode is shown in
Supplementary Figure 34.
Data for pH dependence (Supplementary Figure 19) were taken using 7 μm thick nanoITO films
on FTO-coated glass with 0.1 M KNO3 as the electrolyte. The data both were taken using
chronopotentiometry and extrapolated from Tafel plots taken at different pHs for accuracy and
determination of error. At low and high pHs, H+ and OH
- behave as buffers causing a smaller
rate of change for overpotential versus pH than at neutral pHs. This effect was seen in previous
studies with BL, and is due to the low buffering capacity of KNO3 at these pHs. The pH
Page 25
dependence can be changed by addition of a compound with higher buffering capacity at these
pHs, as shown in Figure 5.
A preliminary measurement of H2O/D2O kinetic isotope effect (KIE) was taken under standard
electrolyte conditions and is shown in Supplmentary Figure 17, with the pH and pD of the
solution made equivalent according to previously published methods.10
We found a KIE of
approximately 1 at low applied overpotentials, similar to IrO2 in photodriven schemes.
Light on/off control experiments and other electrochemical controls. Due to the low
overpotential of this catalyst and its strong absorption at 580 nm, it is reasonable to have the
suspicion that some of the energy required to split water may come from ambient light or some
other external energy source. We demonstrate that this is not the case by performing experiments
both in light-on and light-off conditions (Supplementary Figure 35). To more rigorously examine
this, we performed experiments with a Xe lamp and 400 nm longpass filter. The results of an IV-
curve under chopped illumination are shown, taking using a two-chamber photoelectrochemical
cell (all electrochemical conditions otherwise standard).
Additional controls. Additional controls include CVs of nanoITO electrodes soaked for up to 48
hours in non-activated [Cp*Ir(pyalc)OH] precatalyst solutions or in a solution of free pyalc
ligand, removed from those solutions and washed, then placed into an electrochemical cell.
Controls were also performed with electrodes soaked in NaIO3 or NaIO4 without catalyst for 48
hours, and electrodes heated to 500° C and 700° C prior to catalyst deposition; no significant
difference was found aside from an increase in electrode resistance due to the lower conductivity
of nanoITO in the heated electrodes. Further control experiments were performed by combining
the [Cp*Ir(pyalc)OH] with NaIO3 in deionized water at the same concentrations as the hom-
WOC (the major difference being the presence of the Cp* ligand that would be removed if
NaIO4 was used instead) and immersing a nanoITO on FTO-coated glass electrode in to the
solution for 48 hours. We observed no deposition of catalyst in this case as well, demonstrating
that Cp* removal is required to open the coordination sites needed for surface binding. In all
cases, CVs of the electrodes after having been removed from the [Cp*Ir(pyalc)OH]-containing
solution and washed with deionized water looked identical to bare nanoITO electrodes.
SEM/TEM additional experimental details. Both silicon monoxide and holey carbon grids
were used in this study. Using an SiO grid allowed us to monitor carbon content with moderate
accuracy due to noise from adventitious carbon; much more accurate analysis of carbon present
was done by XPS. TEM images as well as STEM-EDX maps were taken on different samples
using the same conditions for all samples, both before and after electrolysis, and after heating to
500 °C and 700 °C.
Additional XPS details. Supplementary Figure 29 shows a survey scan of the electrode.
Multiplexed scans from the same electrode are shown in Figure 8 of the main text. XPS analysis
showed an Ir 4f doublet at 62.00 and 62.98 eV, values that have been seen previously with
iridium oxide materials that possess Ir in the IV oxidation state.1 Our results are also fully
consistent with Ir being in the IV oxidation state when compared to other molecular IrIV
compounds,3 and are similar to what we saw previously with the catalyst in a homogeneous
environment.8 As a further comparison, the Ir 4f doublet for this catalyst is shifted to a
Page 26
considerably higher binding energy than previously reported IrIII
compounds.2 The N 1s signal at
399.76 eV is consistent with literature for pyridyl N coordinated to a metal,5 as well as the C 1s
(C-N-C)5,6
and C 1s (C-O)6 peaks. The C 1s (C-C) peak is inclusive of adventitious carbon;
4
however, its intensity is higher than we would expect if that were the sole source of C in that
peak suggesting contribution from the pyalc ligand.
XPS of pyalc ligand loss from an electrode heated to 500 °C. Upon heating to 500 °C in air,
the N 1s, C 1s (C-O), and C 1s (C-N-C) signals disappear, while a much smaller amount of
adventitious carbon at 284.93 eV remains (Supplementary Figure 27). This provides evidence
that the pyalc ligand is removed upon heating an electrode with Ir WOC heterogenized on the
surface to this temperature.
XPS Data shown in Supplementary Figure 10. Data was collected using a commercial Thermo
Scientific K-Alpha+ XPS system with a dual-beam flood ion source illuminating the sample for
charge compensation during analysis. An Al Kα x-ray monochromator (hν = 1486.6 eV) with a
400 μm spot size was used. The spectra were referenced using adventitious carbon (284.8 eV).
Ligand Tunability: Preliminary data with [Ir(bpy)(H2O)2(μ-O)]2n+
. The precatalyst
[Cp*Ir(bpy)OH]BF4 and the catalyst formed by oxidation of that compound, previously proposed
to be [Ir(bpy)(H2O)2(µ-O)]2n+
, was synthesized according to our prior published methods using
20 equivalents of NaIO4.8 A dependence on NaIO4 equivalents added was observed in our
experiments for catalysts bearing a bpy ligand. Such a dependence has been recently explored in
homogeneous systems using bpy-based catalysts by Lewandowska-Andralojc et al,11
and we
plan to explore this further in the future in our heterogeneous systems. Heterogenization onto
nanoITO, electrode construction, and all other parameters not outlined here were the same as the
experiments performed with the pyalc ligated catalyst.
The most striking difference is the obvious disparity in color between the surface-bound Ir WOC
bearing a pyalc or bpy ligand. To show this color change based on the ligand, we deposited the
two catalysts on white, opaque P25 TiO2 (Supplementary Figure 30). One hypothesis as to the
cause of this difference in color for the molecular heterogeneous catalysts is that the anionic N-O
pyalc ligand may stabilize the blue IrIV
state, while it may not be stabilized with a neutral N-N
ligand such as bpy.
Looking at the CVs (Supplementary Figure 31), the bpy-bound Ir WOC does not have a well-
defined IrIII
/IrIV
redox wave as well, but does possess a feature at 1.1 V vs NHE that is not
correlated with a change in color of the electrode. Our further studies will explore these
electrochemical differences further; however, it is possible that a less stable IrV state due to the
pyalc ligand could account for the higher activity toward water oxidation that the pyalc-bound Ir
WOC possesses in both homogeneous and heterogeneous catalytic environments.
Page 27
Supplementary References
1. Rubel, M. et al. Characterization of IrO2-SnO2 Thin-Layers by Electron and Ion
Spectroscopies. Vacuum 45, 423-427 (1994).
2. Wang, C., Wang, J. L. & Lin, W. B. Elucidating Molecular Iridium Water Oxidation Catalysts
Using Metal-Organic Frameworks: A Comprehensive Structural, Catalytic, Spectroscopic, and
Kinetic Study. J. Am. Chem. Soc. 134, 19895-19908 (2012).
3. Kim, Y. I. & Hatfield, W. E. Electrical, Magnetic and Spectroscopic Properties of
Tetrathiafulvalene Charge-Transfer Compounds with Iron, Ruthenium, Rhodium and Iridium
Halides. Inorg. Chim. Acta 188, 15-24 (1991).
4. Barr, T. L. & Seal, S. Nature of the use of adventitious carbon as a binding energy standard. J.
Vac. Sci. Technol., A 13, 1239-1246 (1995).
5. Xue, G., Dai, Q., Jiang, S. Chemical Reactions of Imidazole with Metallic Silver Studied by
the Use of SERS and XPS Techniques. J. Am. Chem. Soc. 110, 2393-2395 (1988).
6. Weldon, M. K., Uvdal, P., Friend, C. M. & Serafin, J. G. Decoupling of vibrational modes as a
structural tool: Coverage-induced reorientation of methoxide on Mo(110). J. Chem. Phys. 103,
5075-5084 (1995).
7. Ito, S. et al. Fabrication of Screen-Printing Pastes From TiO2 Powders for Dye-Sensitized
Solar Cells. Prog. Photovolt: Res. Appl. 15, 603-612 (2007).
8. Hintermair, U. et al. Precursor Transformation during Molecular Oxidation Catalysis with
Organometallic Iridium Complexes. J. Am. Chem. Soc. 135, 10837-10851 (2013).
9. Brewster, T. P. et al. An Iridium(IV) Species, [Cp*Ir(NHC)Cl]+, Related to a Water-Oxidation
Catalyst. Organometallics 30, 965-973 (2011).
10. Glasoe, P. K. & Long, F. A. Use of Glass Electrodes to Measure Acidities in Deuterium
Oxide. J. Phys. Chem. 64, 188-190 (1960).
11. Lewandowska-Andralojc, A. et al. Efficient water oxidation with organometallic iridium
complexes as precatalysts. Phys. Chem. Chem. Phys. 16, 11976-11987 (2014).