1 Supplementary Figures Supplementary Figure S1 | The Japanese morning glory. (a-l) The wild-type line Tokyo-kokei standard (TKS). (a) The individual used for whole genome sequencing. (b) Flower from the front. (c) Flower from the back. (d) Flower from the side. (e) Flower bud one day before flower opening. (f) Stamens (five on the left) and carpel
Transcript
1
Supplementary Figures
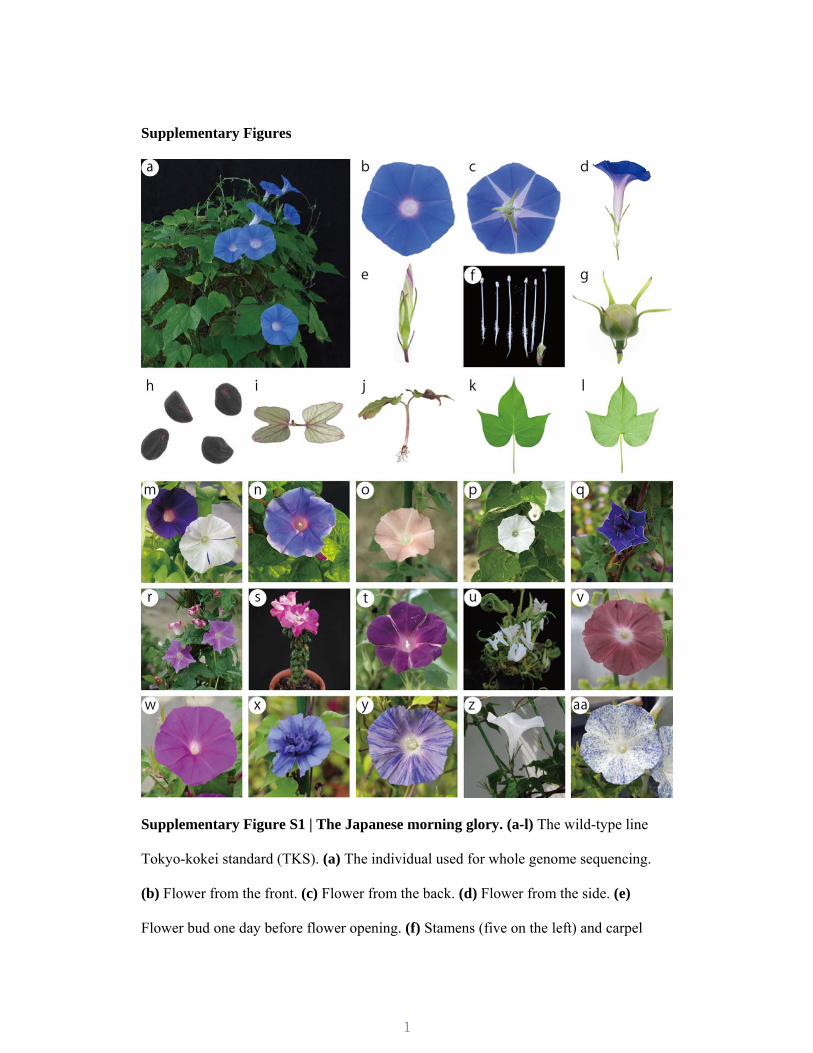
Supplementary Figure S1 | The Japanese morning glory. (a-l) The wild-type line
Tokyo-kokei standard (TKS). (a) The individual used for whole genome sequencing.
(b) Flower from the front. (c) Flower from the back. (d) Flower from the side. (e)
Flower bud one day before flower opening. (f) Stamens (five on the left) and carpel
2
(farthest right). (g) Seed pod. (h) Seeds. (i) Seedling from above. (j) Side view of a
seedling. (k) Leaf from the front. (l) Leaf from the back. (m) The Q1072 line carrying
the recessive a3-f mutation that is the Tpn1 insertion into the DFR-B gene for flower
pigmentation. The mutant produces white flowers with pigmented spots or sectors
(right) and sometimes produces fully pigmented flowers (left). The pigmentation
patterns are caused by Tpn1-inducing somatic mutations and indicate that transposases
TnpA and TnpD of Tpn1 family elements are active. (n-s) Brassinosteroid-deficient
producing double flowers. (y) Q531 (dk-2) with pale- and dull-colored flowers. (z)
AK33 (c1), producing white flowers with red stems. (aa) AK30 (sp) showing speckled
flowers. All I. nil lines are from the National BioResource Project
(http://www.shigen.nig.ac.jp/asagao/).
3
Supplementary Figure S2. A representative histogram of flow cytometric analysis
for genome size estimation. Young leaves from the Tokyo-kokei standard of I. nil and
the standard species were separately chopped using a razor blade for 1 min in an
extraction buffer. Lotus japonicus Gifu and Solanum lycopersicum cv Micro-Tom were
chosen as standard species15,16. The extraction buffer was PBS (pH 7.2) with 0.1 % (v/v)
Triton X-100 and 400 μg/ml of RNase A (QIAGEN). After 15 min of incubation, the
extracts were filtered using a 20-μm CellTrics disposable filter (Partec). Extracts from
the three species were mixed at an appropriate ratio, and the mixtures were stained with
20 μl of propidium iodide solution (ICyt) per 1 ml of each mixture. All procedures
above were done on ice. The three mixtures prepared from independent leaves of the
species were analyzed by a flow cytometer, CyFlow SL, equipped with a 532-nm laser
and FloMax software (Partec). The estimated genome size of I. nil is shown with a
standard error (n=3).
4
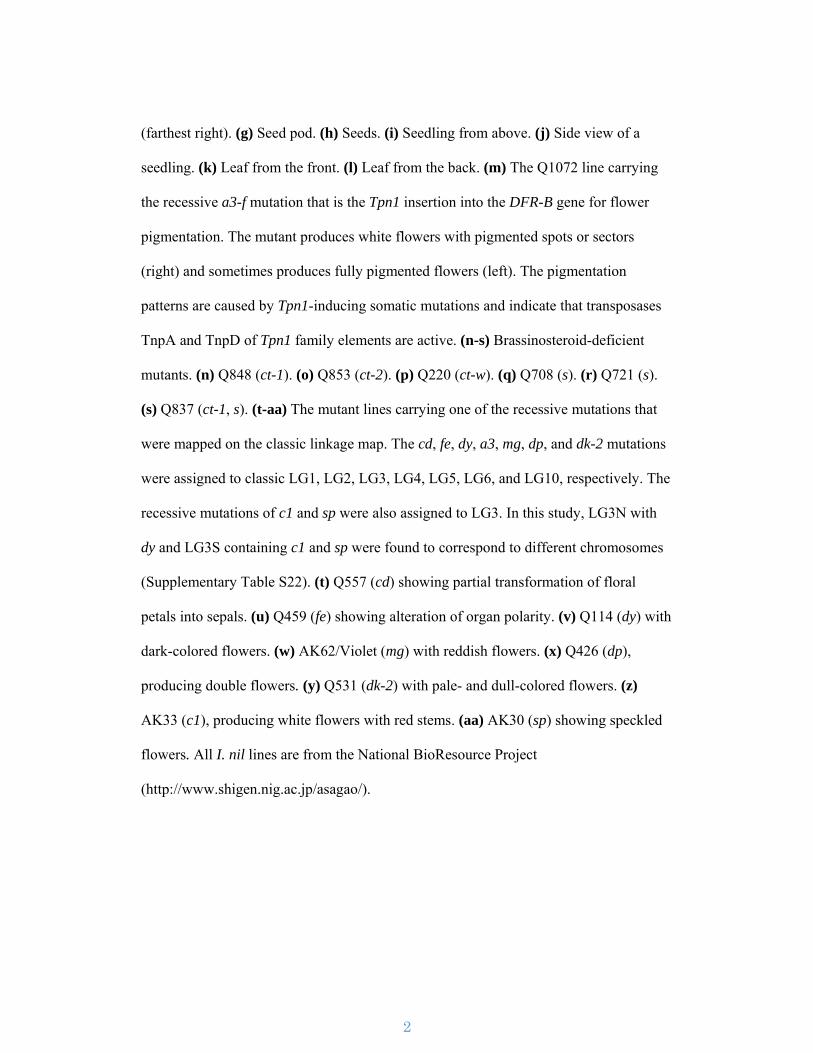
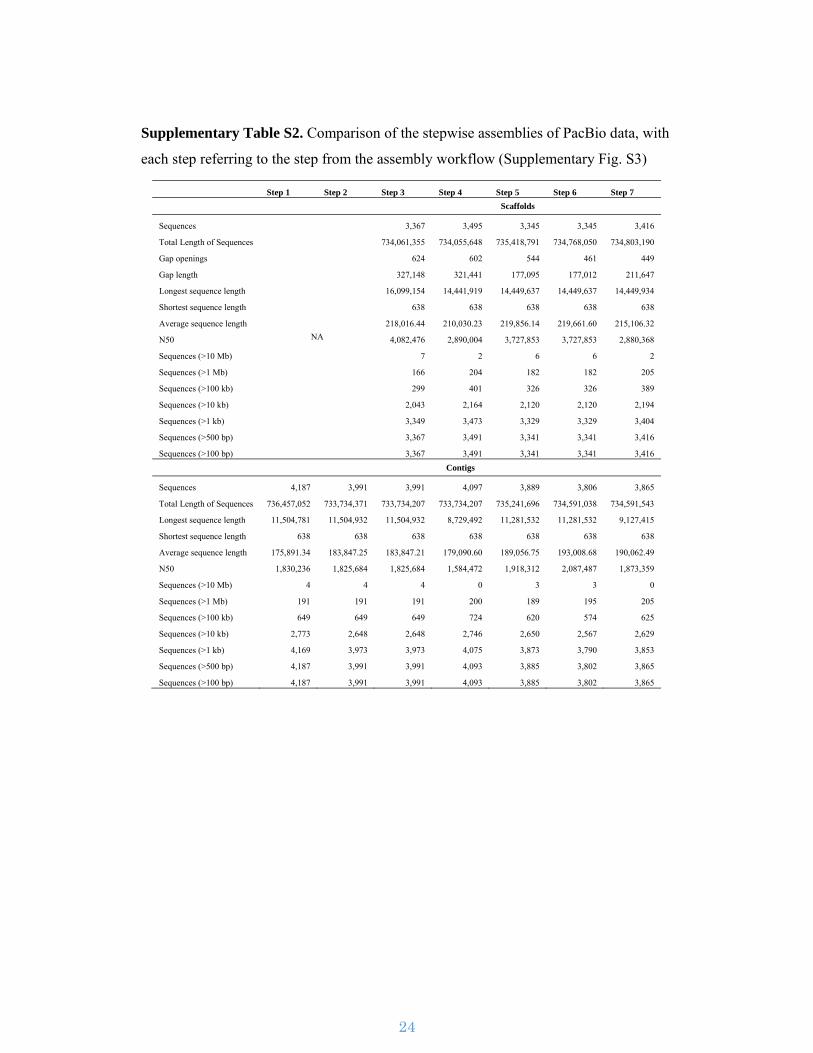
Supplementary Figure S3. Assembly work-flow. The assembly pipeline used for
assembling the I. nil genome utilizing PacBio and Illumina sequence reads.
5
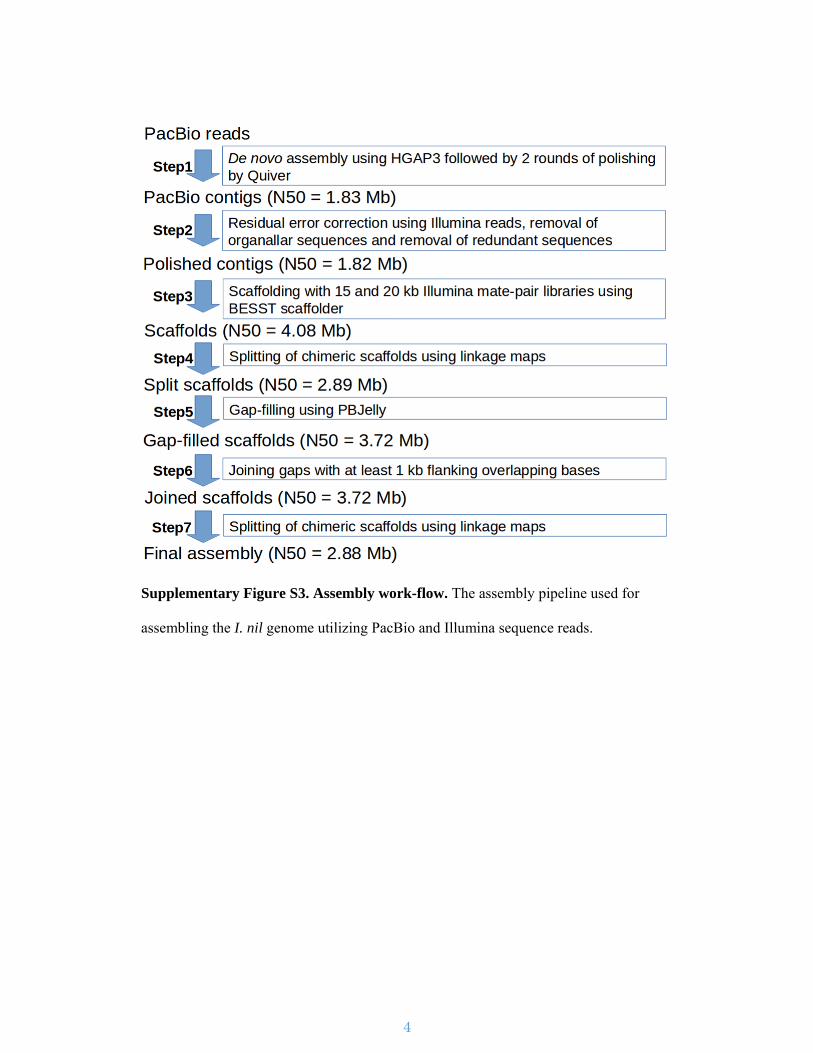
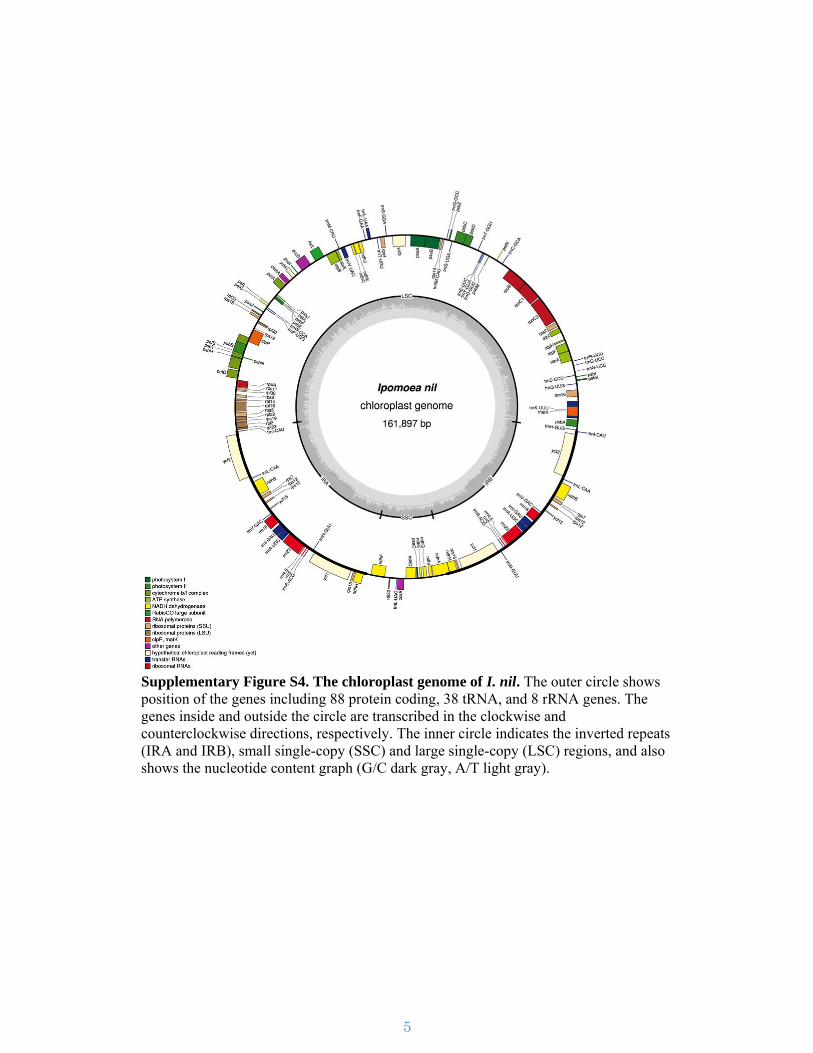
Supplementary Figure S4. The chloroplast genome of I. nil. The outer circle shows position of the genes including 88 protein coding, 38 tRNA, and 8 rRNA genes. The genes inside and outside the circle are transcribed in the clockwise and counterclockwise directions, respectively. The inner circle indicates the inverted repeats (IRA and IRB), small single-copy (SSC) and large single-copy (LSC) regions, and also shows the nucleotide content graph (G/C dark gray, A/T light gray).
6
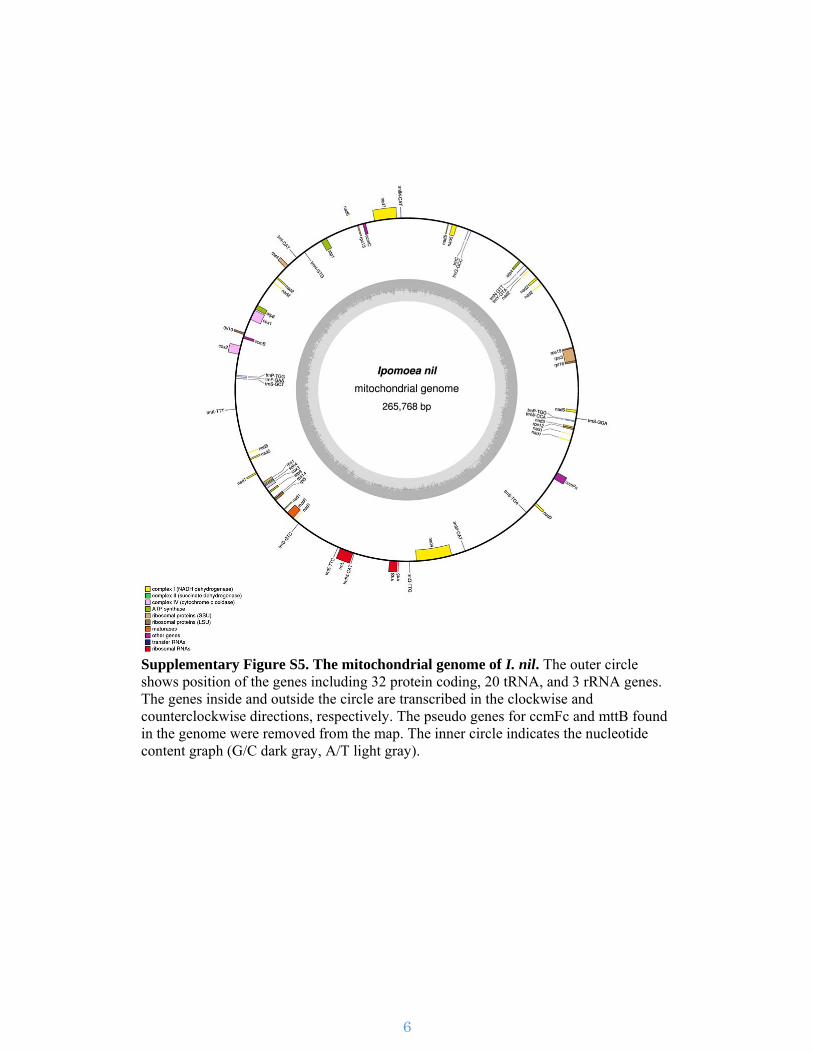
Supplementary Figure S5. The mitochondrial genome of I. nil. The outer circle shows position of the genes including 32 protein coding, 20 tRNA, and 3 rRNA genes. The genes inside and outside the circle are transcribed in the clockwise and counterclockwise directions, respectively. The pseudo genes for ccmFc and mttB found in the genome were removed from the map. The inner circle indicates the nucleotide content graph (G/C dark gray, A/T light gray).
7
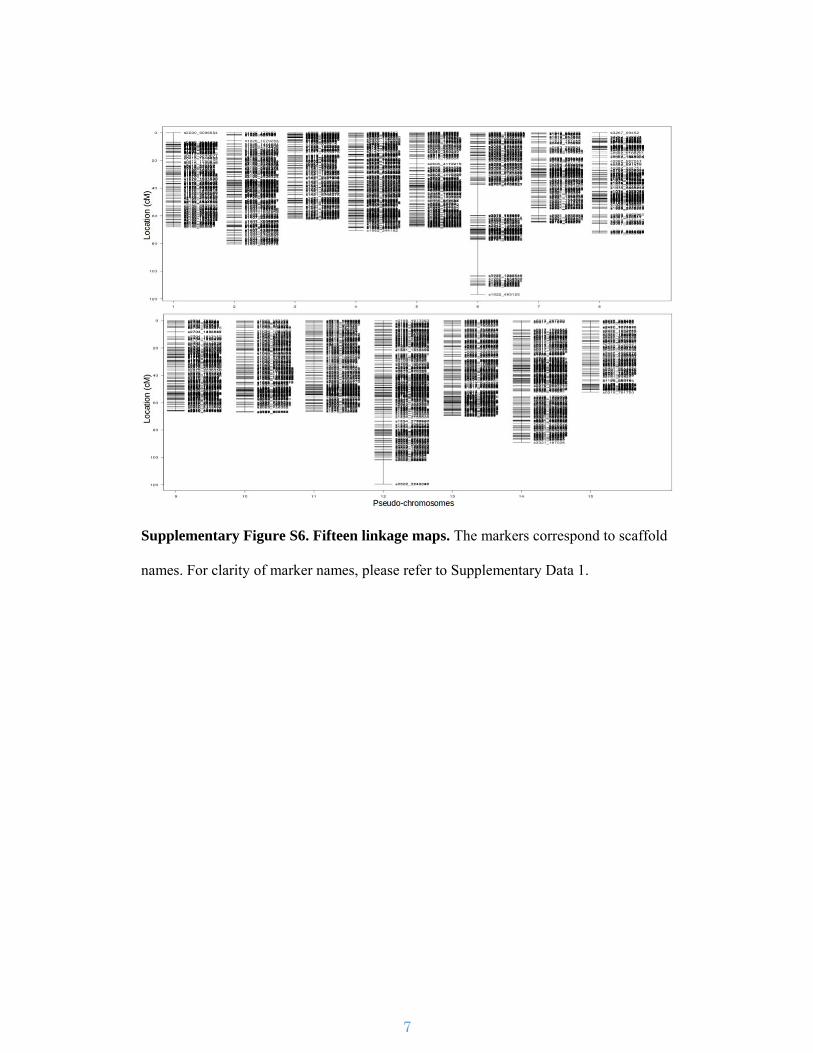
Supplementary Figure S6. Fifteen linkage maps. The markers correspond to scaffold
names. For clarity of marker names, please refer to Supplementary Data 1.
8
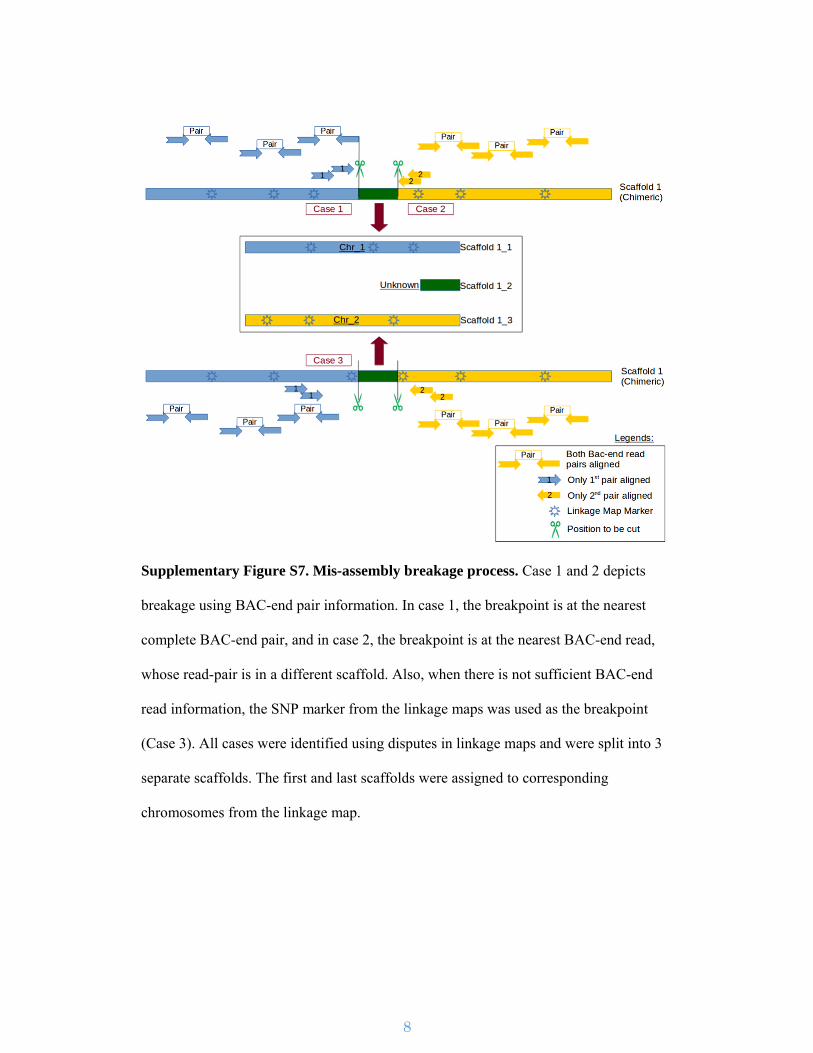
Supplementary Figure S7. Mis-assembly breakage process. Case 1 and 2 depicts
breakage using BAC-end pair information. In case 1, the breakpoint is at the nearest
complete BAC-end pair, and in case 2, the breakpoint is at the nearest BAC-end read,
whose read-pair is in a different scaffold. Also, when there is not sufficient BAC-end
read information, the SNP marker from the linkage maps was used as the breakpoint
(Case 3). All cases were identified using disputes in linkage maps and were split into 3
separate scaffolds. The first and last scaffolds were assigned to corresponding
chromosomes from the linkage map.
9
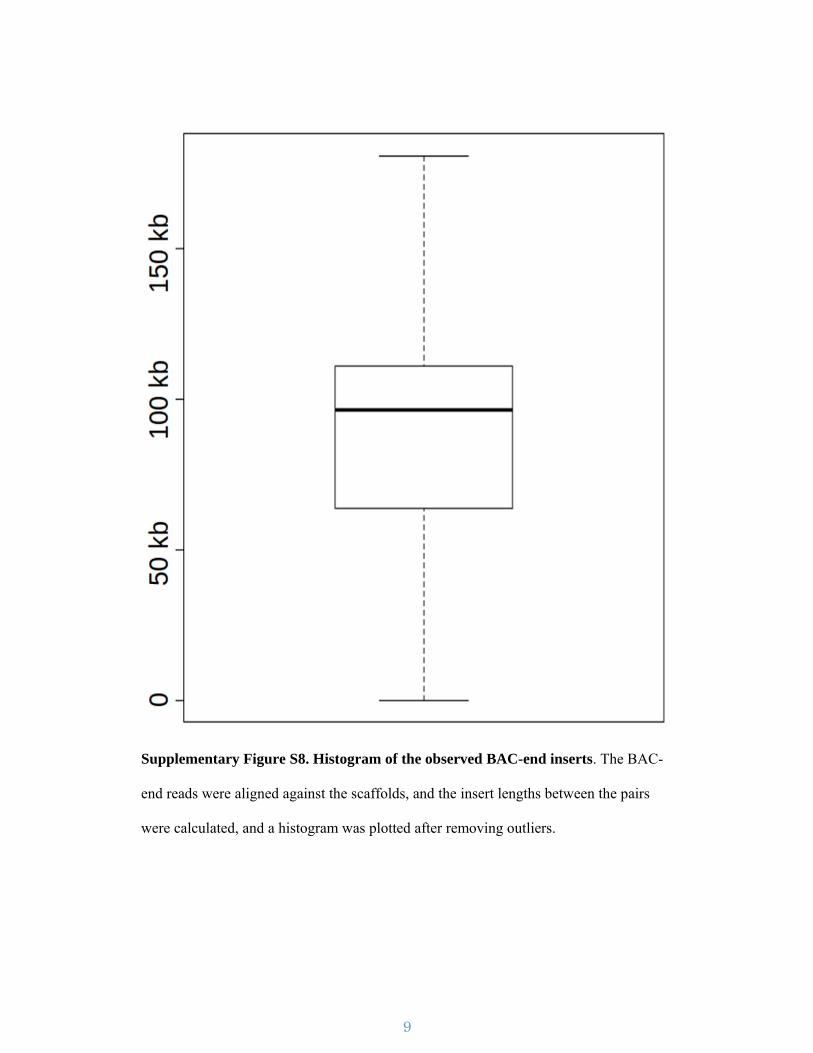
Supplementary Figure S8. Histogram of the observed BAC-end inserts. The BAC-
end reads were aligned against the scaffolds, and the insert lengths between the pairs
were calculated, and a histogram was plotted after removing outliers.
10
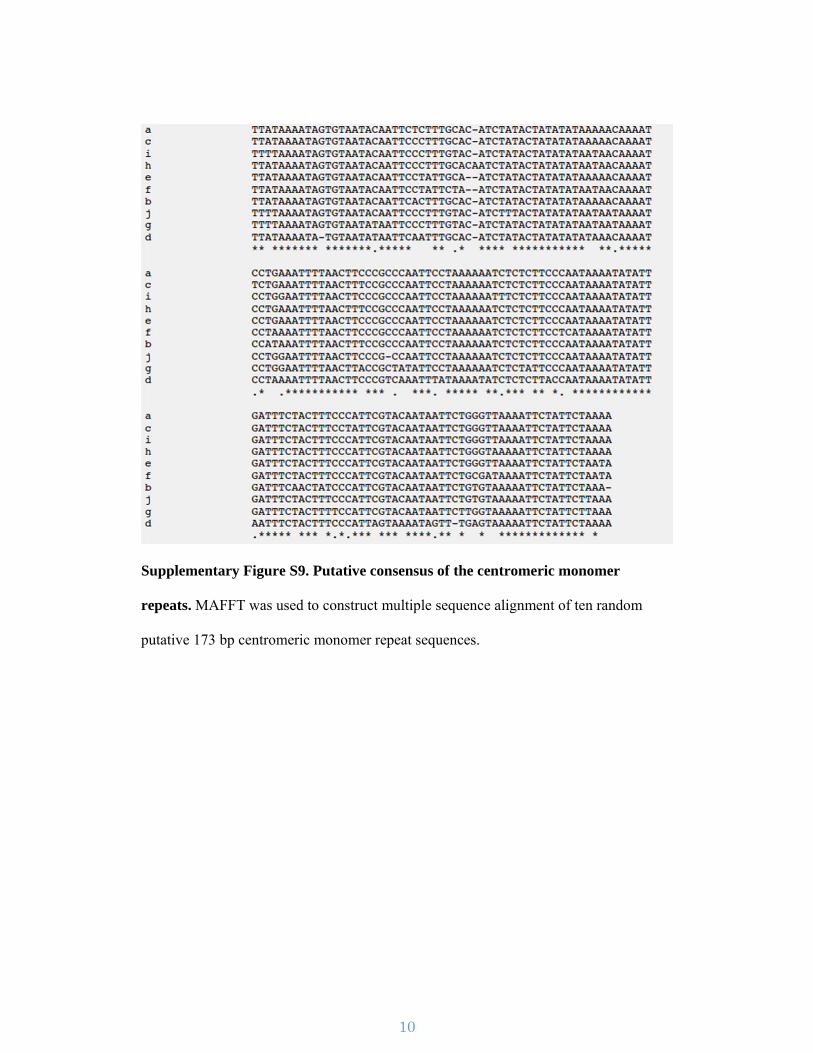
Supplementary Figure S9. Putative consensus of the centromeric monomer
repeats. MAFFT was used to construct multiple sequence alignment of ten random
putative 173 bp centromeric monomer repeat sequences.
11
Supplementary Figure S10. Structure of a Tpn1 family transposon. The first and
last identical 28 bp represent Terminal Inverted Repeats (TIRs) across all the Tpn1
transposons, flanked by typical 3-bp Transposon Site Duplications (TSDs). The TIRs
are followed by sub-terminal repetitive regions (SRRs) and the region in-between can
have incorporated genes from the host.
12
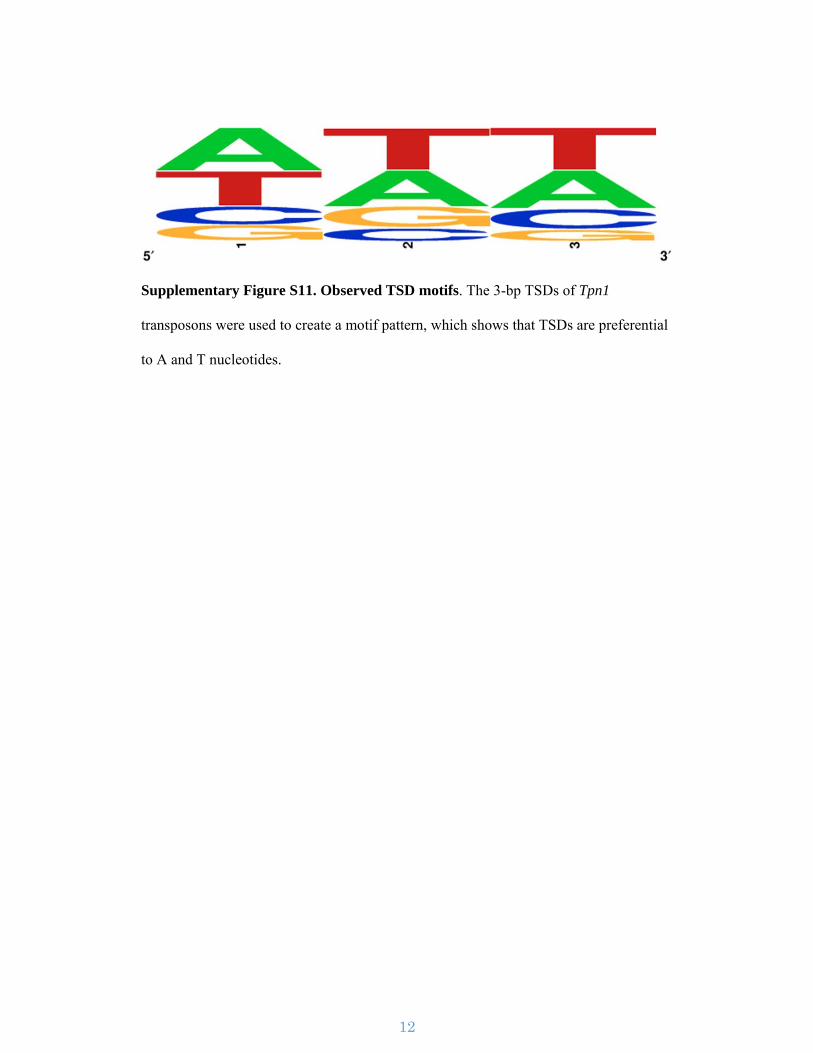
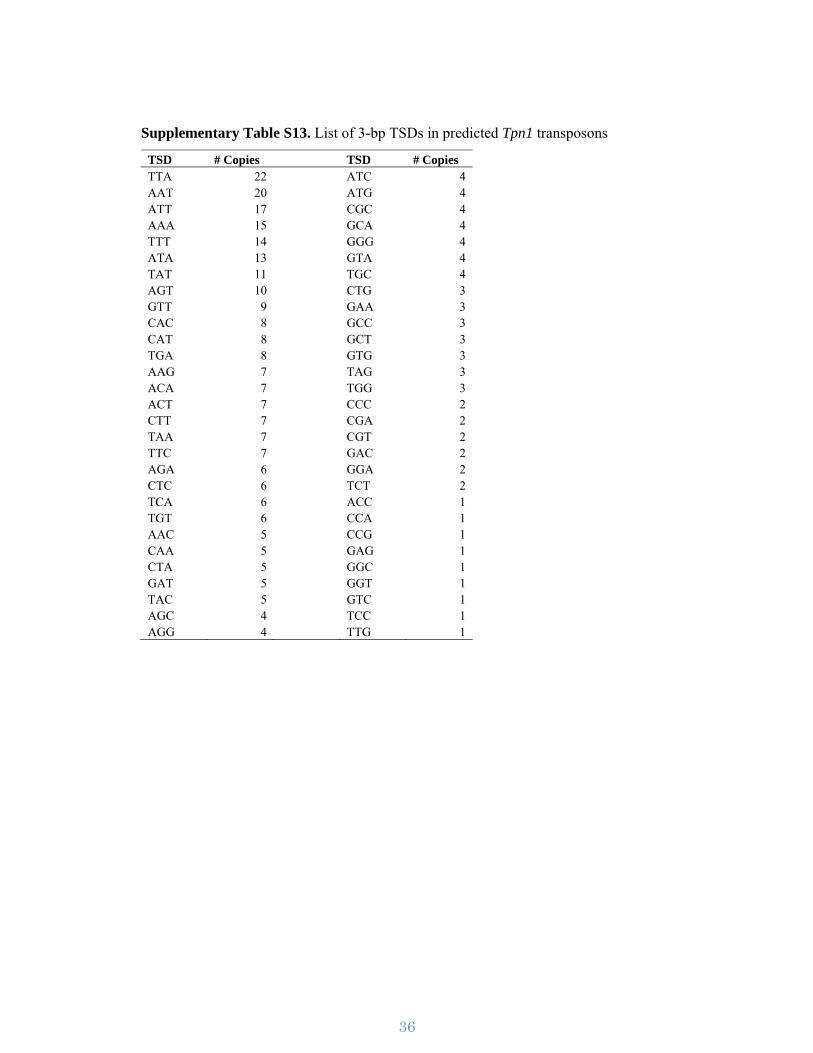
Supplementary Figure S11. Observed TSD motifs. The 3-bp TSDs of Tpn1
transposons were used to create a motif pattern, which shows that TSDs are preferential
to A and T nucleotides.
13
14
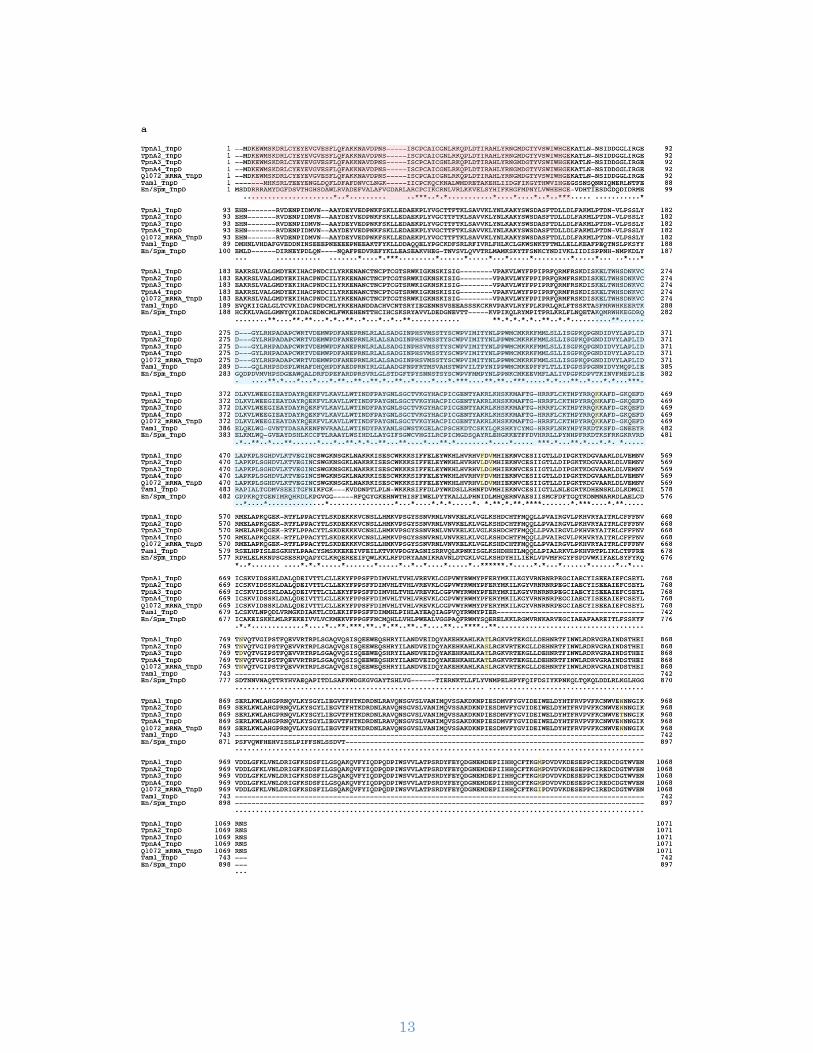
Supplementary Figure S12. Alignment of putative transposases. Amino acid
sequences of TnpD transposases (a), TnpA transposases (b), and the conserved domain
of TnpA transposases (c) from the Tpn1 family elements, maize En/Spm (M25427), and
snapdragon Tam1 (X57297) were aligned. Yellow boxes show polymorphic amino
acids among the Tpn1 family elements. Bars show gaps. Asterisks and dots indicate
amino acids conserved among all and parts of the aligned sequences respectively. Red,
blue, and green shaded regions are conserved domains of transposase family tnp2
(pfam02992), transposase-associated domain (pfam13963), and plant transposase of
Ptta/En/Spm family (pfam03004) respectively. Sequences were aligned using
ClustalW17 and conserved domains were searched using NCBI’s Conserved Domain
Database (CDD)18.
15
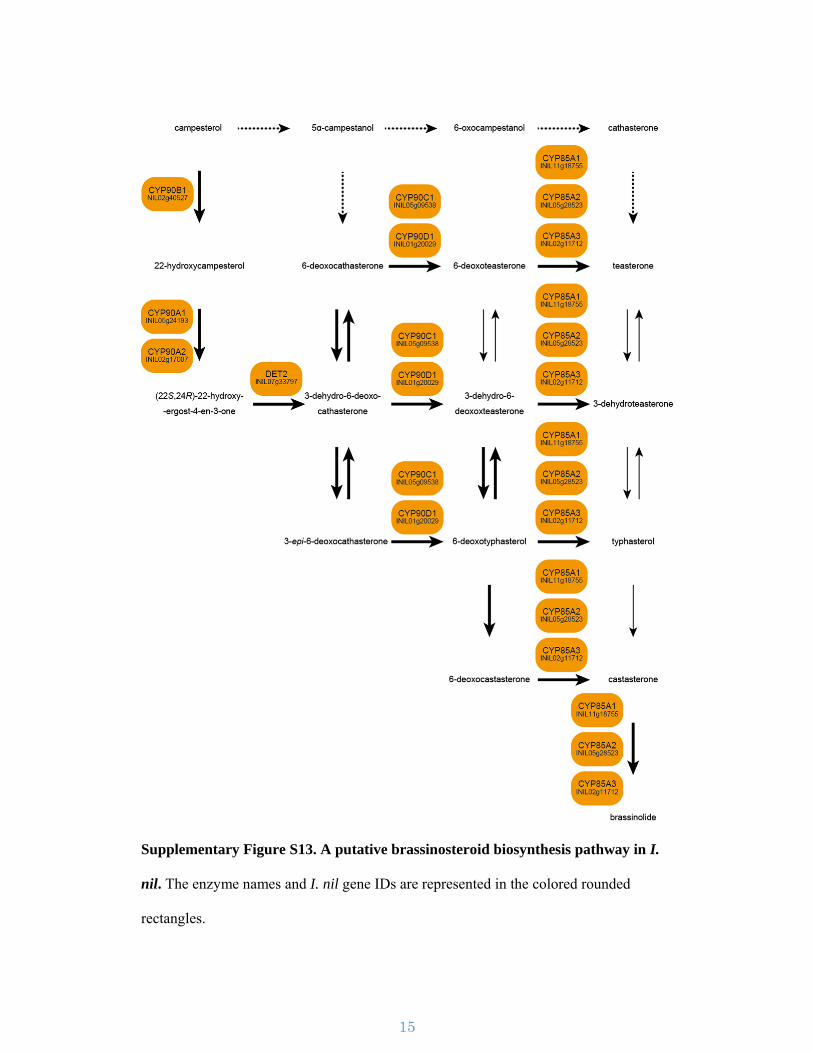
Supplementary Figure S13. A putative brassinosteroid biosynthesis pathway in I.
nil. The enzyme names and I. nil gene IDs are represented in the colored rounded
rectangles.
16
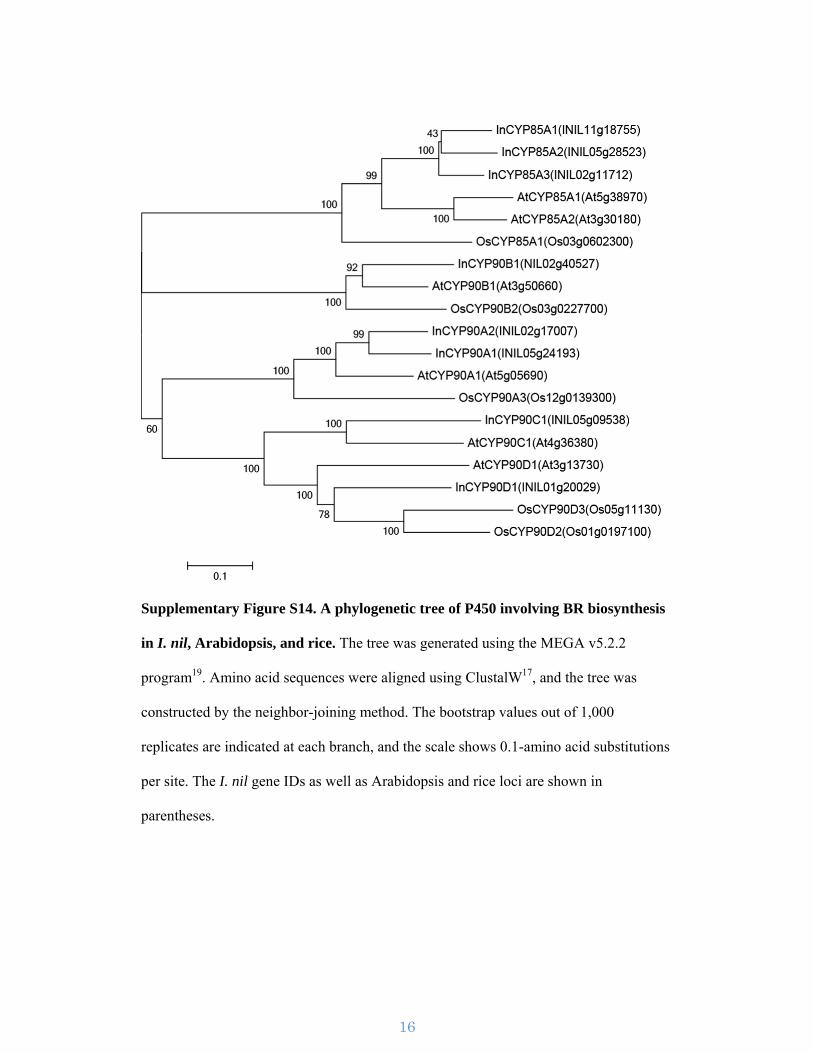
Supplementary Figure S14. A phylogenetic tree of P450 involving BR biosynthesis
in I. nil, Arabidopsis, and rice. The tree was generated using the MEGA v5.2.2
program19. Amino acid sequences were aligned using ClustalW17, and the tree was
constructed by the neighbor-joining method. The bootstrap values out of 1,000
replicates are indicated at each branch, and the scale shows 0.1-amino acid substitutions
per site. The I. nil gene IDs as well as Arabidopsis and rice loci are shown in
parentheses.
17
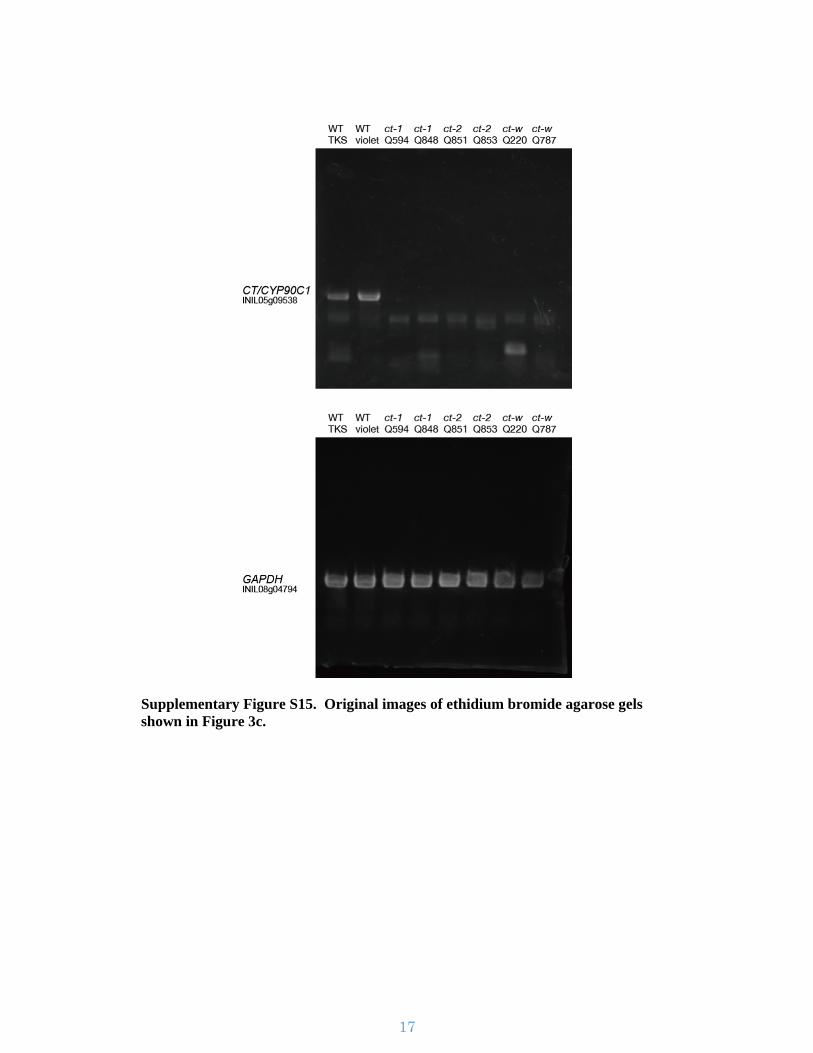
Supplementary Figure S15. Original images of ethidium bromide agarose gels shown in Figure 3c.
18
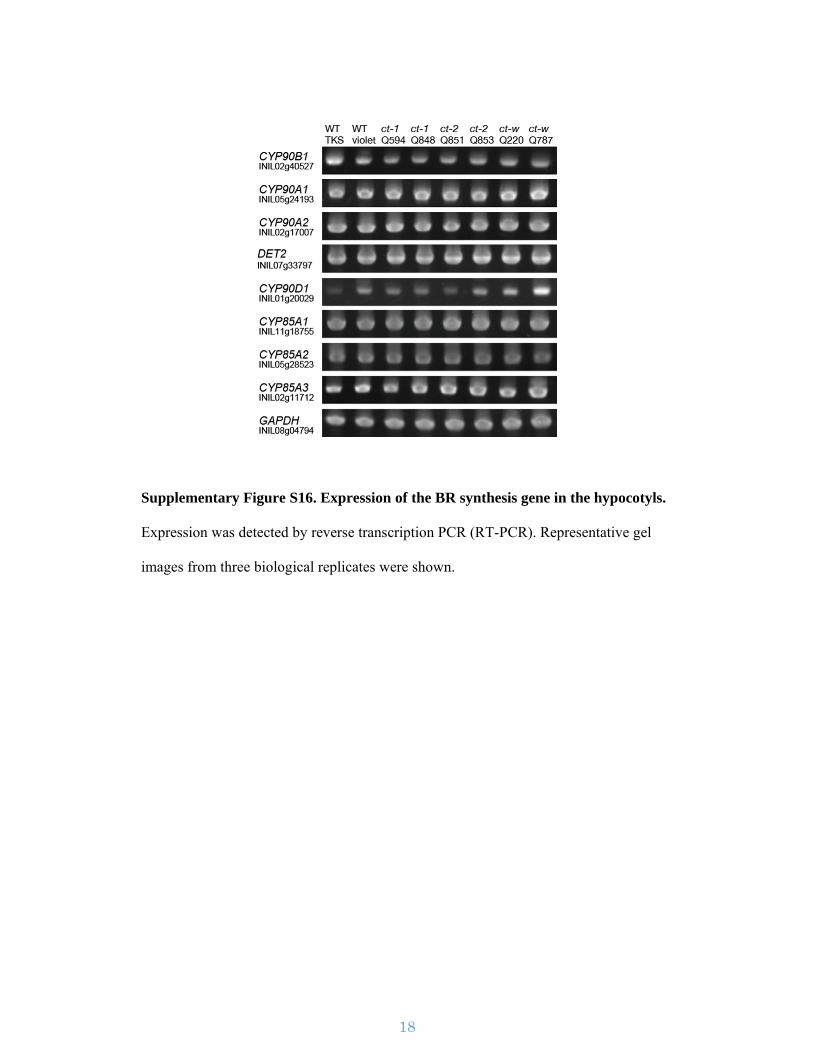
Supplementary Figure S16. Expression of the BR synthesis gene in the hypocotyls.
Expression was detected by reverse transcription PCR (RT-PCR). Representative gel
images from three biological replicates were shown.
19
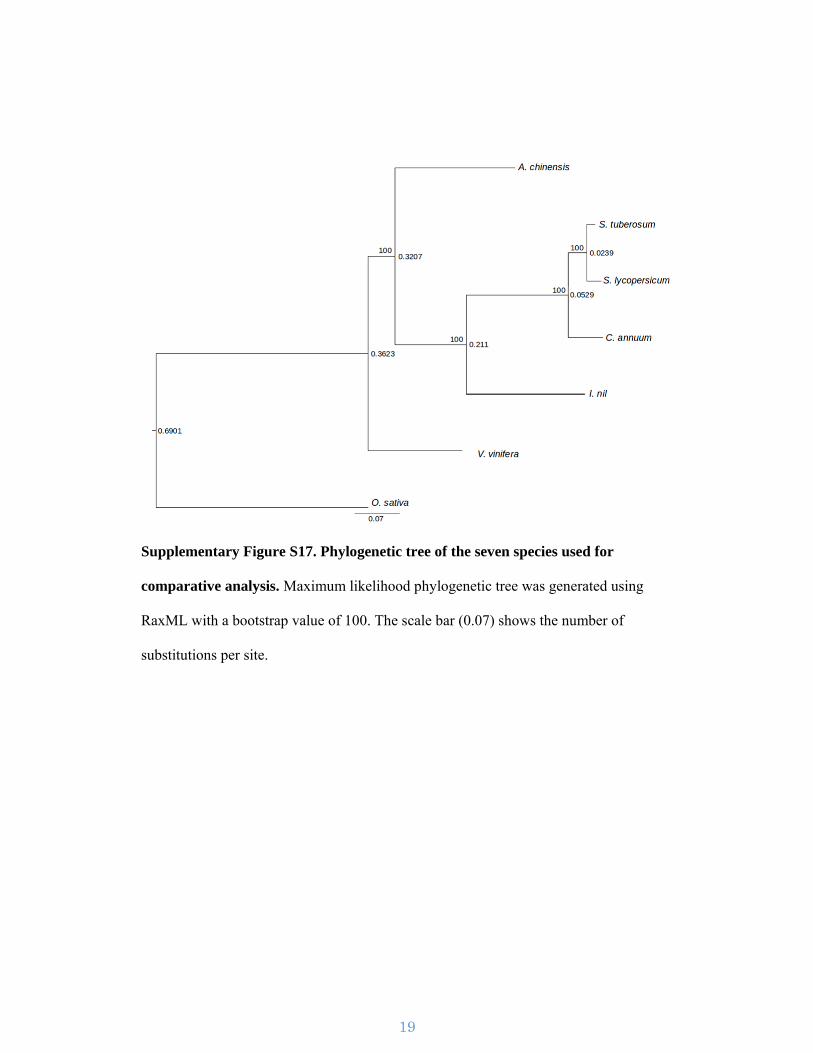
Supplementary Figure S17. Phylogenetic tree of the seven species used for
comparative analysis. Maximum likelihood phylogenetic tree was generated using
RaxML with a bootstrap value of 100. The scale bar (0.07) shows the number of
substitutions per site.
20
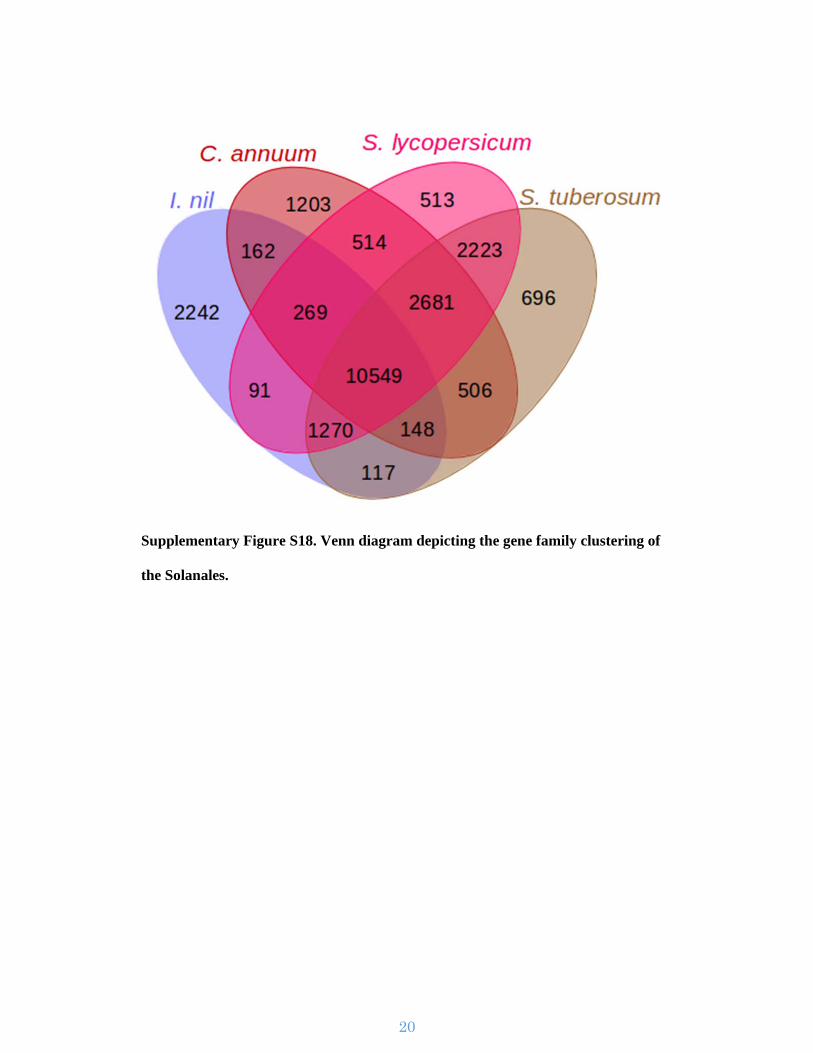
Supplementary Figure S18. Venn diagram depicting the gene family clustering of
the Solanales.
21
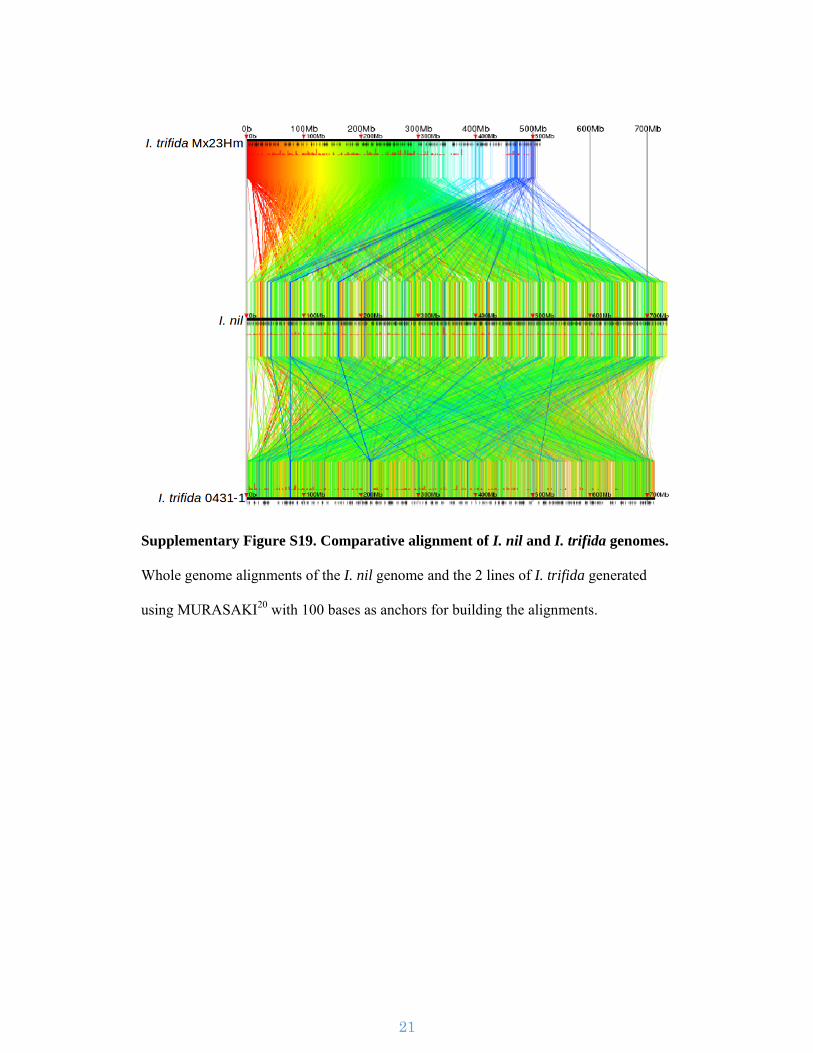
Supplementary Figure S19. Comparative alignment of I. nil and I. trifida genomes.
Whole genome alignments of the I. nil genome and the 2 lines of I. trifida generated
using MURASAKI20 with 100 bases as anchors for building the alignments.
22
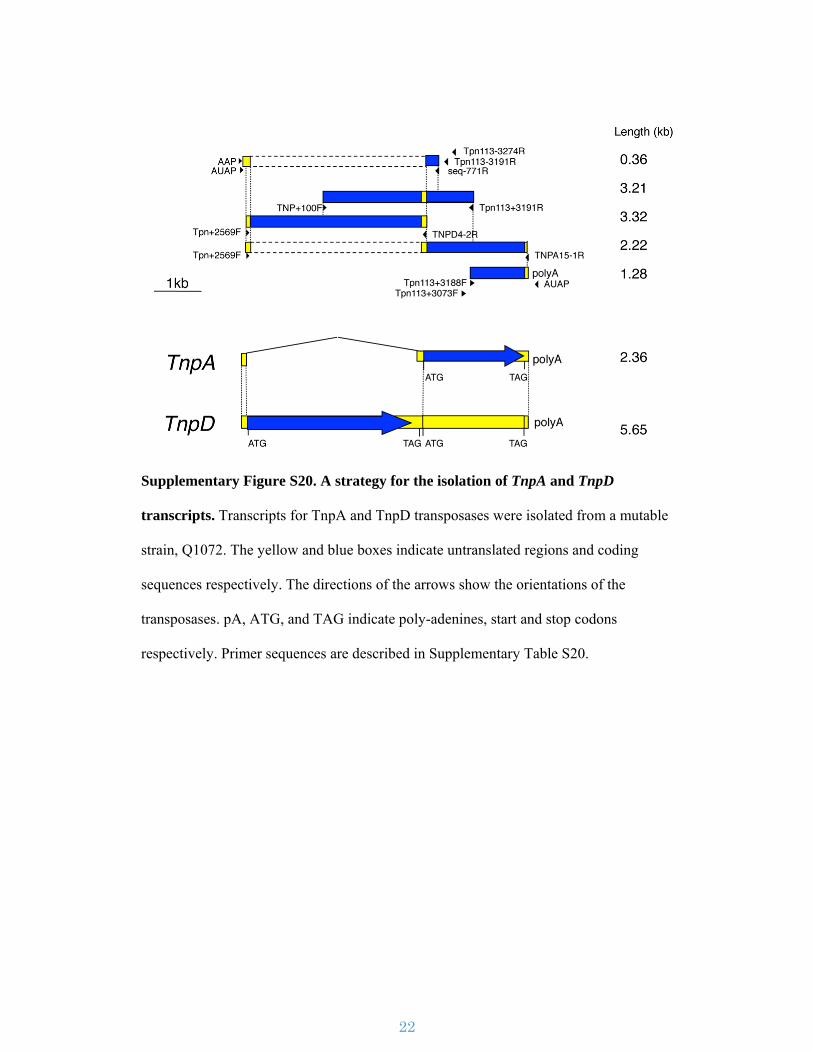
Supplementary Figure S20. A strategy for the isolation of TnpA and TnpD
transcripts. Transcripts for TnpA and TnpD transposases were isolated from a mutable
strain, Q1072. The yellow and blue boxes indicate untranslated regions and coding
sequences respectively. The directions of the arrows show the orientations of the
transposases. pA, ATG, and TAG indicate poly-adenines, start and stop codons
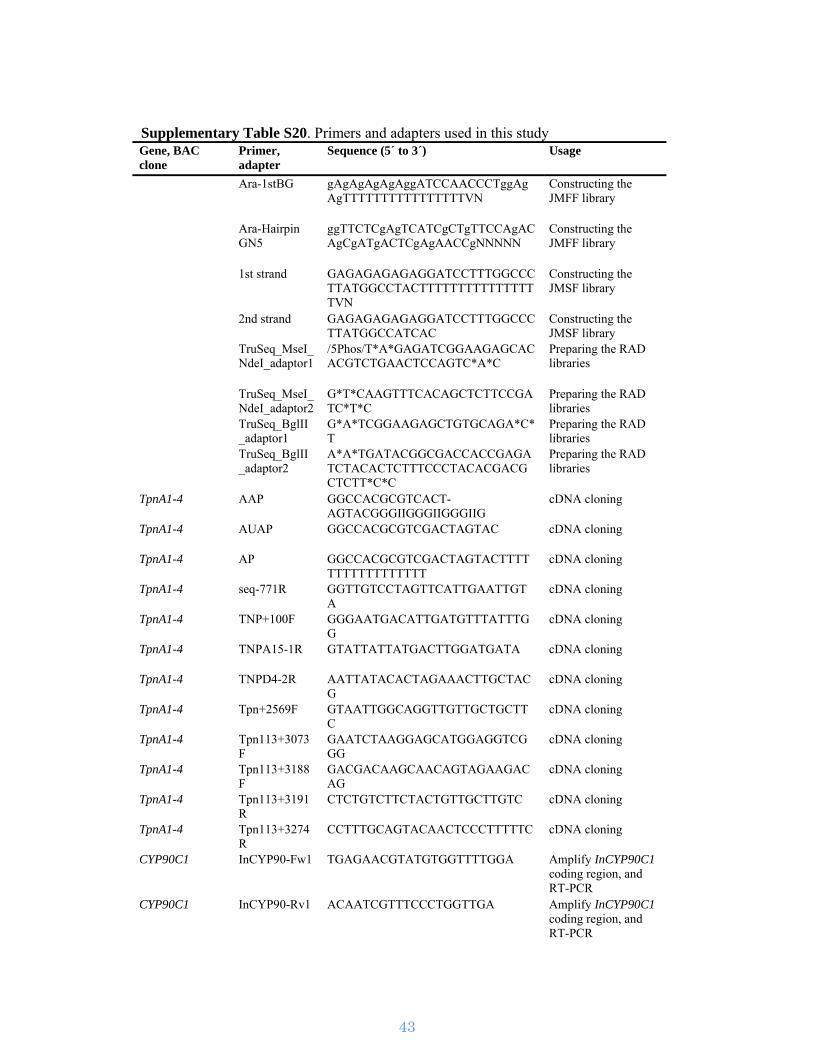
respectively. Primer sequences are described in Supplementary Table S20.
23
Supplementary Tables
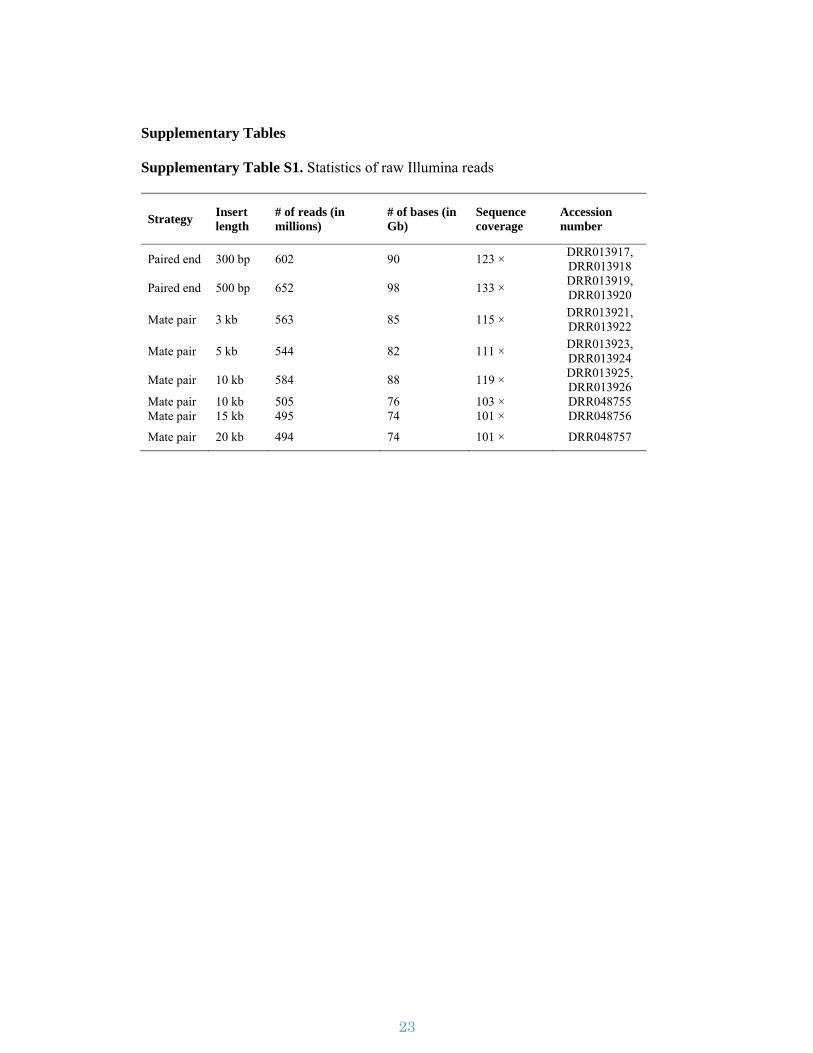
Supplementary Table S1. Statistics of raw Illumina reads
Strategy Insert length
# of reads (in millions)
# of bases (in Gb)
Sequence coverage
Accession number
Paired end 300 bp 602 90 123 × DRR013917, DRR013918
Paired end 500 bp 652 98 133 × DRR013919, DRR013920
Scaffold Start End Length Orientation # Repeating units Pseudo-chromosomes
BDFN01001407 6,507,520 6,510,126 2,607 3' 379.3 2
BDFN01001026 1 1,414 1,414 5' 203.3 2
BDFN01003340 373,876 377,001 3,126 3' 447.6 3
BDFN01002922 15 5,582 5,568 5' 797.9 4
BDFN01001719 538,273 539,293 1,021 5' 145.1 5
BDFN01003069 10,854,526 10,854,850 325 5' 47.1 6
BDFN01001622 1 2,780 2,780 3' 396 6
BDFN01003087 4,002,600 4,007,449 4,850 3' 707.4 8
BDFN01003267 1 3,440 3,440 5' 493 8
BDFN01002704 1 1,760 1,760 5' 254.6 9
BDFN01001043 1 5,813 5,813 5' 825.9 10
BDFN01000302 1 7,517 7,517 3' 1,085.4 12
BDFN01000688 8,724,735 8,729,492 4,758 5' 678 13
BDFN01000317 1 2,185 2,185 5' 314.7 14
BDFN01003321 1 1,885 1,885 3' 270 14
BDFN01002480 3 3,164 3,162 5' 454.9 15
BDFN01000242 1 8,918 8,918 - 1,260.3 -
BDFN01000287 1 1,736 1,736 - 248.9 -
BDFN01000409 4 2,254 2,251 - 335.6 -
BDFN01000413 1 3,520 3,520 - 504.4 -
BDFN01000448 1 11,350 11,350 - 1,597.9 -
BDFN01000658 3 4,407 4,405 - 633.1 -
BDFN01001077 3 6,554 6,552 - 937.1 -
BDFN01001434 1 2,617 2,617 - 376.4 -
BDFN01001461 1 7,302 7,302 - 1,053.6 -
BDFN01001704 1 32,455 32,455 - 4,613.9 -
BDFN01001887 1 4,704 4,704 - 679.9 -
BDFN01002452 1 3,490 3,490 - 493.7 -
BDFN01003094 3 7,951 7,949 - 1,148.3 -
BDFN01002227 14,878 16,227 1,350 - 199.3 -
31
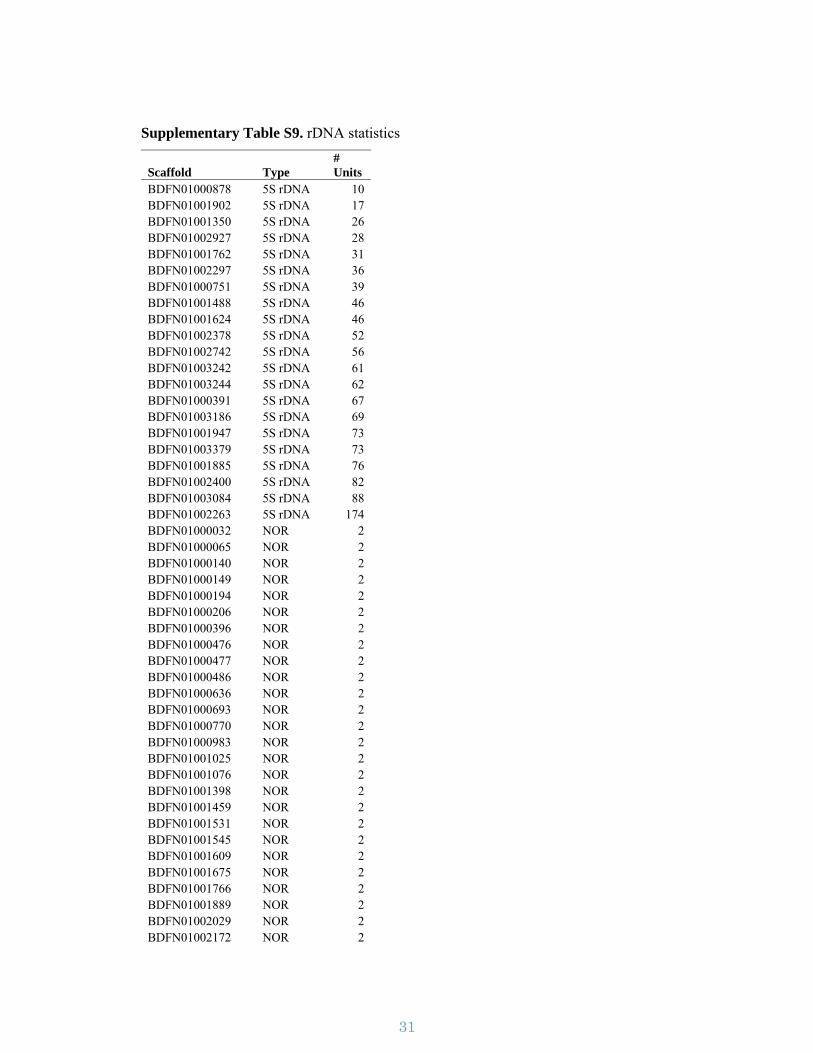
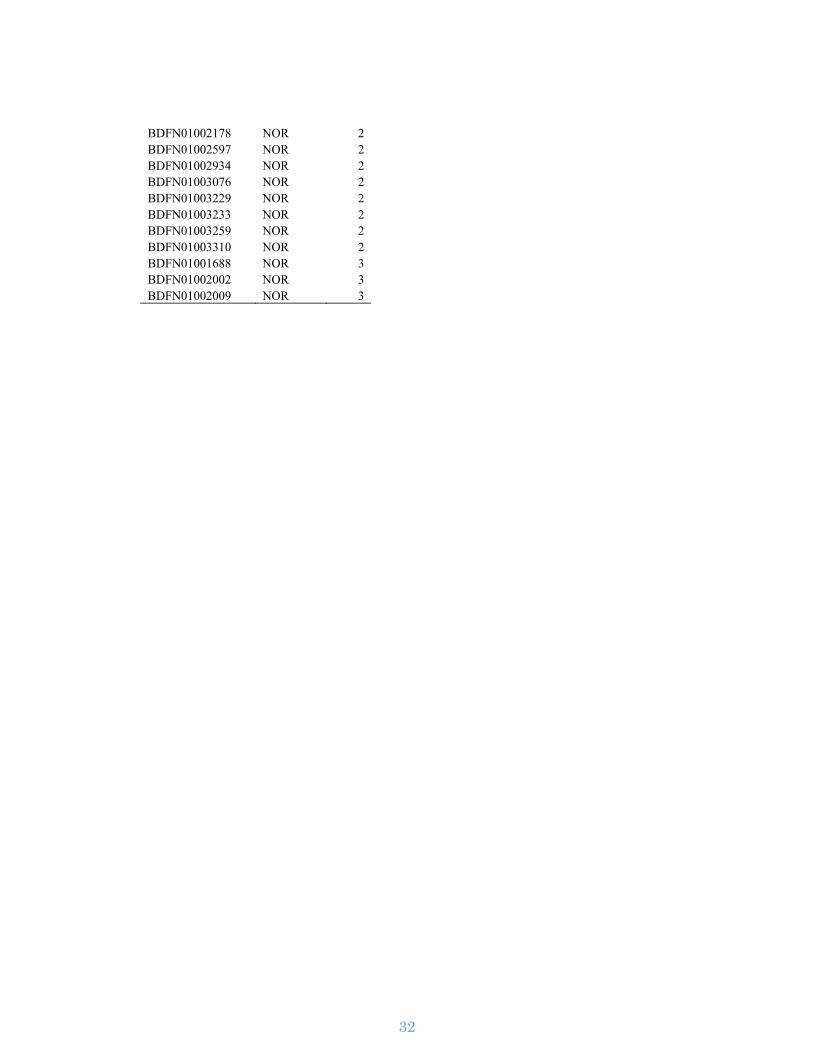
Supplementary Table S9. rDNA statistics
Scaffold Type # Units
BDFN01000878 5S rDNA 10 BDFN01001902 5S rDNA 17BDFN01001350 5S rDNA 26 BDFN01002927 5S rDNA 28 BDFN01001762 5S rDNA 31 BDFN01002297 5S rDNA 36 BDFN01000751 5S rDNA 39 BDFN01001488 5S rDNA 46 BDFN01001624 5S rDNA 46 BDFN01002378 5S rDNA 52 BDFN01002742 5S rDNA 56 BDFN01003242 5S rDNA 61 BDFN01003244 5S rDNA 62 BDFN01000391 5S rDNA 67 BDFN01003186 5S rDNA 69 BDFN01001947 5S rDNA 73 BDFN01003379 5S rDNA 73 BDFN01001885 5S rDNA 76 BDFN01002400 5S rDNA 82 BDFN01003084 5S rDNA 88 BDFN01002263 5S rDNA 174 BDFN01000032 NOR 2 BDFN01000065 NOR 2BDFN01000140 NOR 2 BDFN01000149 NOR 2 BDFN01000194 NOR 2 BDFN01000206 NOR 2 BDFN01000396 NOR 2 BDFN01000476 NOR 2BDFN01000477 NOR 2 BDFN01000486 NOR 2 BDFN01000636 NOR 2 BDFN01000693 NOR 2 BDFN01000770 NOR 2 BDFN01000983 NOR 2BDFN01001025 NOR 2 BDFN01001076 NOR 2 BDFN01001398 NOR 2 BDFN01001459 NOR 2 BDFN01001531 NOR 2 BDFN01001545 NOR 2 BDFN01001609 NOR 2 BDFN01001675 NOR 2 BDFN01001766 NOR 2 BDFN01001889 NOR 2 BDFN01002029 NOR 2 BDFN01002172 NOR 2
32
BDFN01002178 NOR 2 BDFN01002597 NOR 2 BDFN01002934 NOR 2 BDFN01003076 NOR 2 BDFN01003229 NOR 2 BDFN01003233 NOR 2BDFN01003259 NOR 2 BDFN01003310 NOR 2 BDFN01001688 NOR 3 BDFN01002002 NOR 3 BDFN01002009 NOR 3
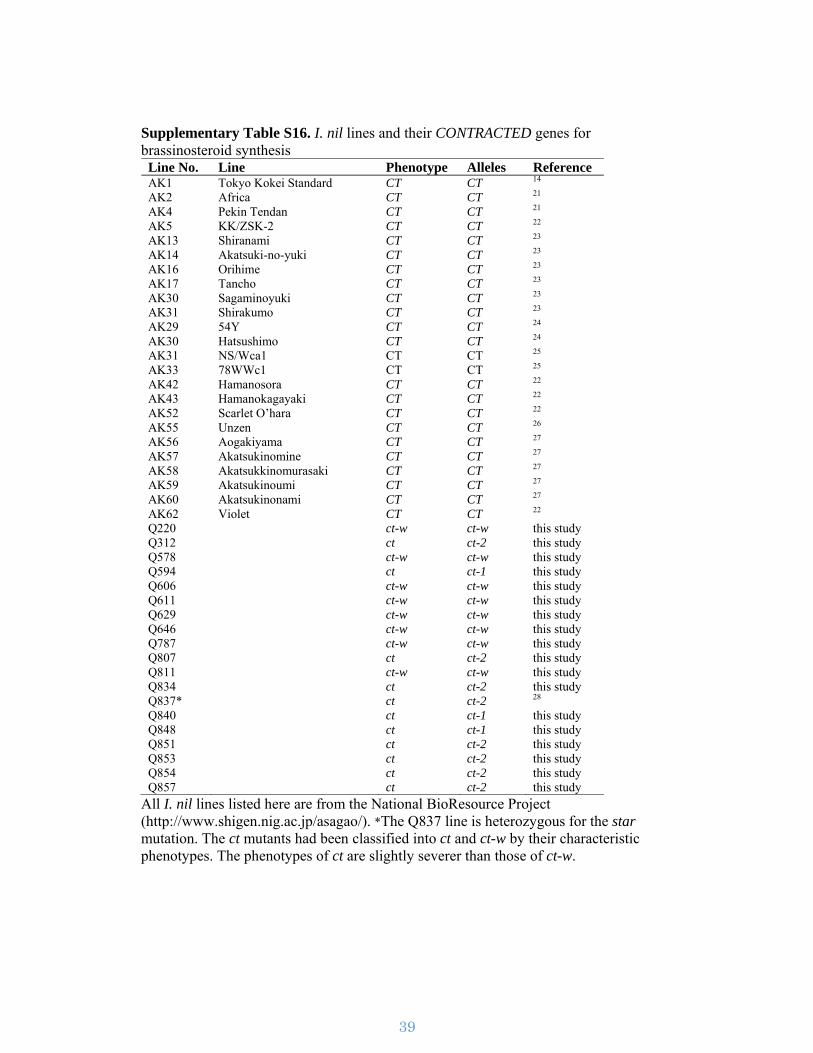
Q220 ct-w ct-w this study Q312 ct ct-2 this study Q578 ct-w ct-w this study Q594 ct ct-1 this study Q606 ct-w ct-w this study Q611 ct-w ct-w this study Q629 ct-w ct-w this study Q646 ct-w ct-w this study Q787 ct-w ct-w this study Q807 ct ct-2 this study Q811 ct-w ct-w this study Q834 ct ct-2 this study Q837* ct ct-2 28 Q840 ct ct-1 this study Q848 ct ct-1 this study Q851 ct ct-2 this study Q853 ct ct-2 this study Q854 ct ct-2 this study Q857 ct ct-2 this study
All I. nil lines listed here are from the National BioResource Project (http://www.shigen.nig.ac.jp/asagao/). *The Q837 line is heterozygous for the star mutation. The ct mutants had been classified into ct and ct-w by their characteristic phenotypes. The phenotypes of ct are slightly severer than those of ct-w.
40
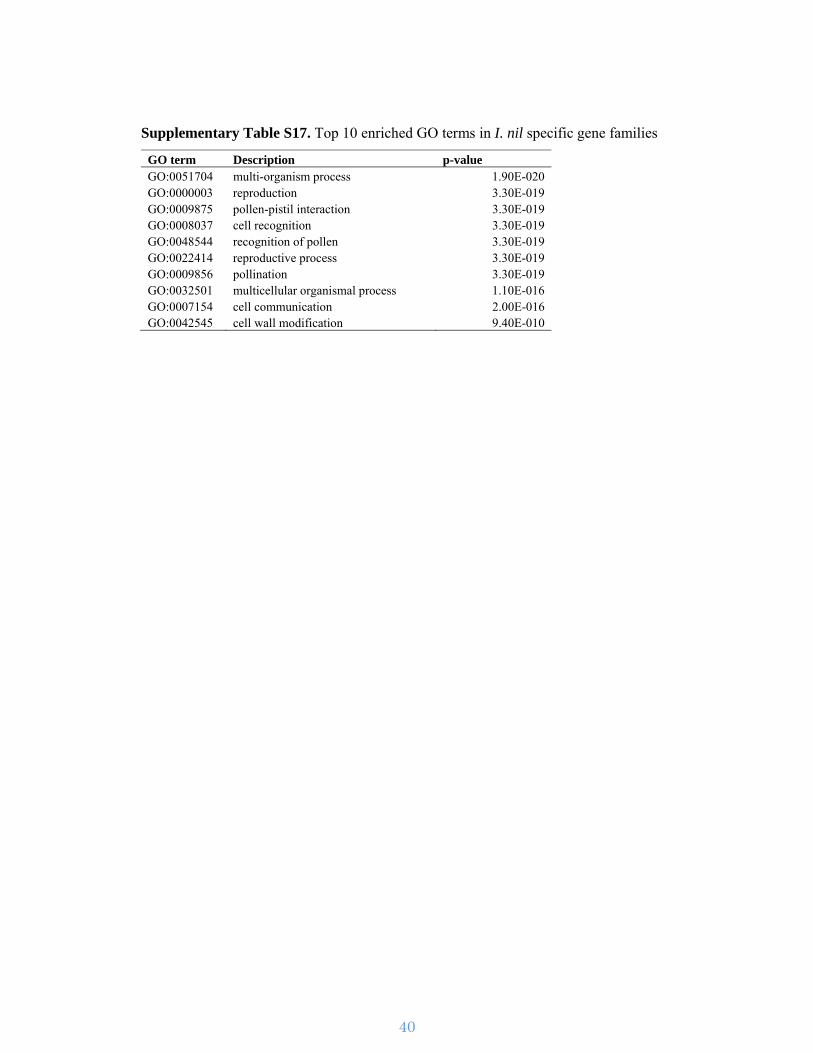
Supplementary Table S17. Top 10 enriched GO terms in I. nil specific gene families
GO term Description p-value GO:0051704 multi-organism process 1.90E-020 GO:0000003 reproduction 3.30E-019 GO:0009875 pollen-pistil interaction 3.30E-019 GO:0008037 cell recognition 3.30E-019 GO:0048544 recognition of pollen 3.30E-019 GO:0022414 reproductive process 3.30E-019 GO:0009856 pollination 3.30E-019 GO:0032501 multicellular organismal process 1.10E-016 GO:0007154 cell communication 2.00E-016 GO:0042545 cell wall modification 9.40E-010
41
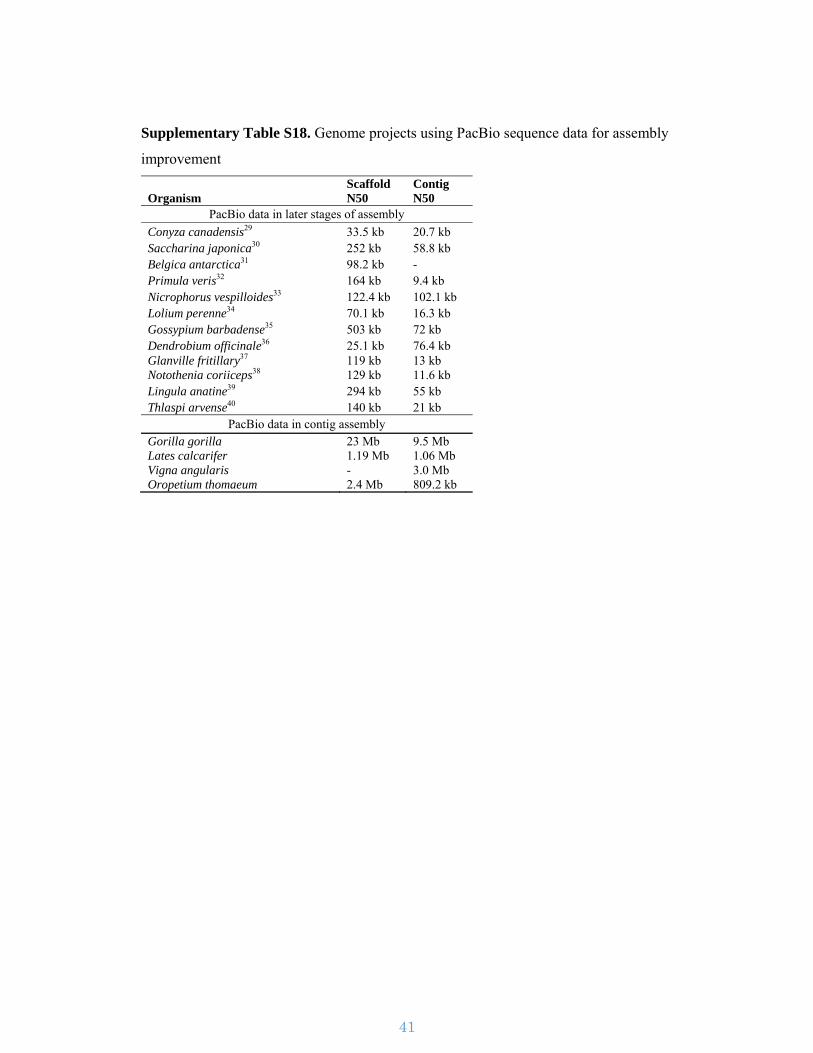
Supplementary Table S18. Genome projects using PacBio sequence data for assembly
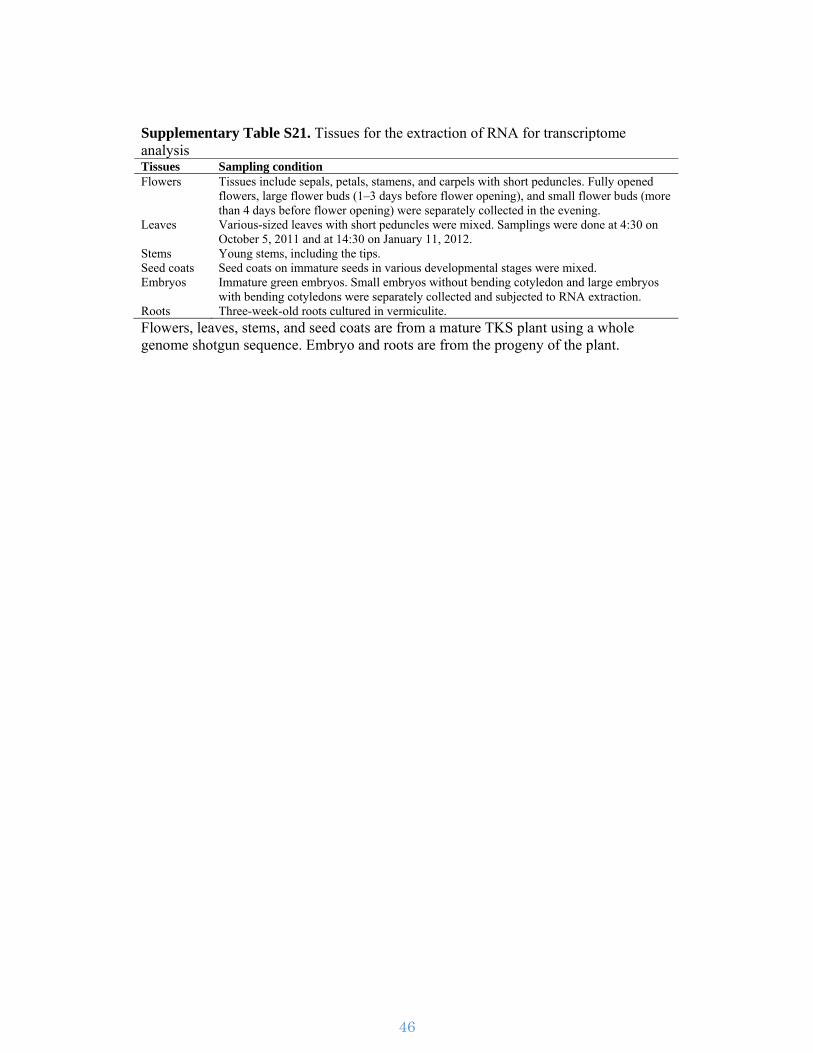
Supplementary Table S21. Tissues for the extraction of RNA for transcriptome analysis Tissues Sampling condition Flowers Tissues include sepals, petals, stamens, and carpels with short peduncles. Fully opened
flowers, large flower buds (1–3 days before flower opening), and small flower buds (more than 4 days before flower opening) were separately collected in the evening.
Leaves Various-sized leaves with short peduncles were mixed. Samplings were done at 4:30 on October 5, 2011 and at 14:30 on January 11, 2012.
Stems Young stems, including the tips. Seed coats Seed coats on immature seeds in various developmental stages were mixed. Embryos Immature green embryos. Small embryos without bending cotyledon and large embryos
with bending cotyledons were separately collected and subjected to RNA extraction. Roots Three-week-old roots cultured in vermiculite.
Flowers, leaves, stems, and seed coats are from a mature TKS plant using a whole genome shotgun sequence. Embryo and roots are from the progeny of the plant.
47
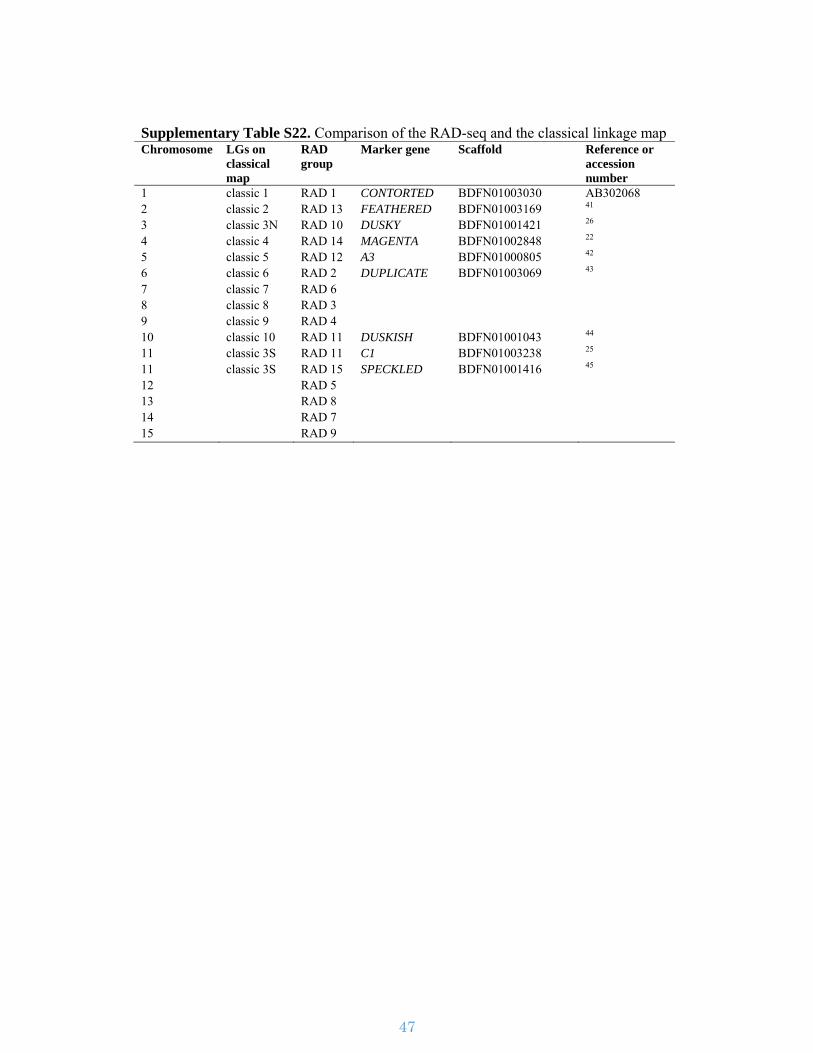
Supplementary Table S22. Comparison of the RAD-seq and the classical linkage map Chromosome LGs on
classical map
RAD group
Marker gene Scaffold Reference or accession number
1 classic 1 RAD 1 CONTORTED BDFN01003030 AB302068 2 classic 2 RAD 13 FEATHERED BDFN01003169 41 3 classic 3N RAD 10 DUSKY BDFN01001421 26 4 classic 4 RAD 14 MAGENTA BDFN01002848 22 5 classic 5 RAD 12 A3 BDFN01000805 42 6 classic 6 RAD 2 DUPLICATE BDFN01003069 43 7 classic 7 RAD 6 8 classic 8 RAD 3 9 classic 9 RAD 4 10 classic 10 RAD 11 DUSKISH BDFN01001043 44 11 classic 3S RAD 11 C1 BDFN01003238 25 11 classic 3S RAD 15 SPECKLED BDFN01001416 45 12 RAD 5 13 RAD 8 14 RAD 7 15 RAD 9
48
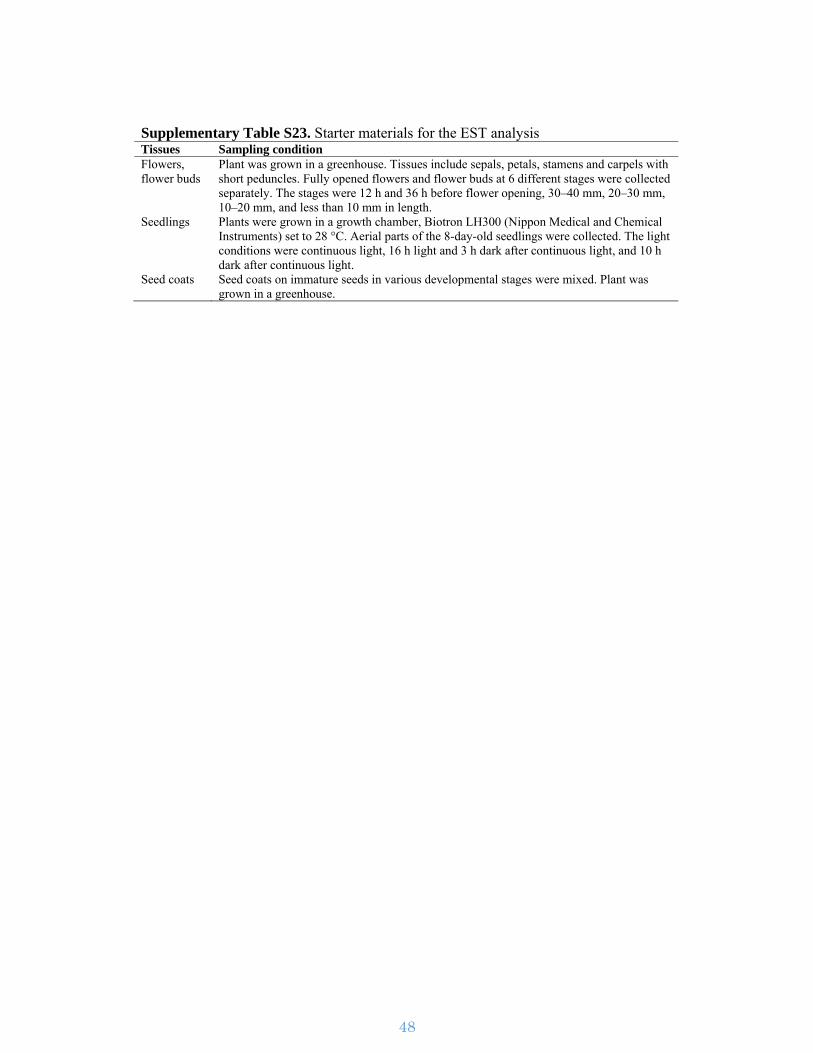
Supplementary Table S23. Starter materials for the EST analysis Tissues Sampling condition Flowers, flower buds
Plant was grown in a greenhouse. Tissues include sepals, petals, stamens and carpels with short peduncles. Fully opened flowers and flower buds at 6 different stages were collected separately. The stages were 12 h and 36 h before flower opening, 30–40 mm, 20–30 mm, 10–20 mm, and less than 10 mm in length.
Seedlings Plants were grown in a growth chamber, Biotron LH300 (Nippon Medical and Chemical Instruments) set to 28 °C. Aerial parts of the 8-day-old seedlings were collected. The light conditions were continuous light, 16 h light and 3 h dark after continuous light, and 10 h dark after continuous light.
Seed coats Seed coats on immature seeds in various developmental stages were mixed. Plant was grown in a greenhouse.
49
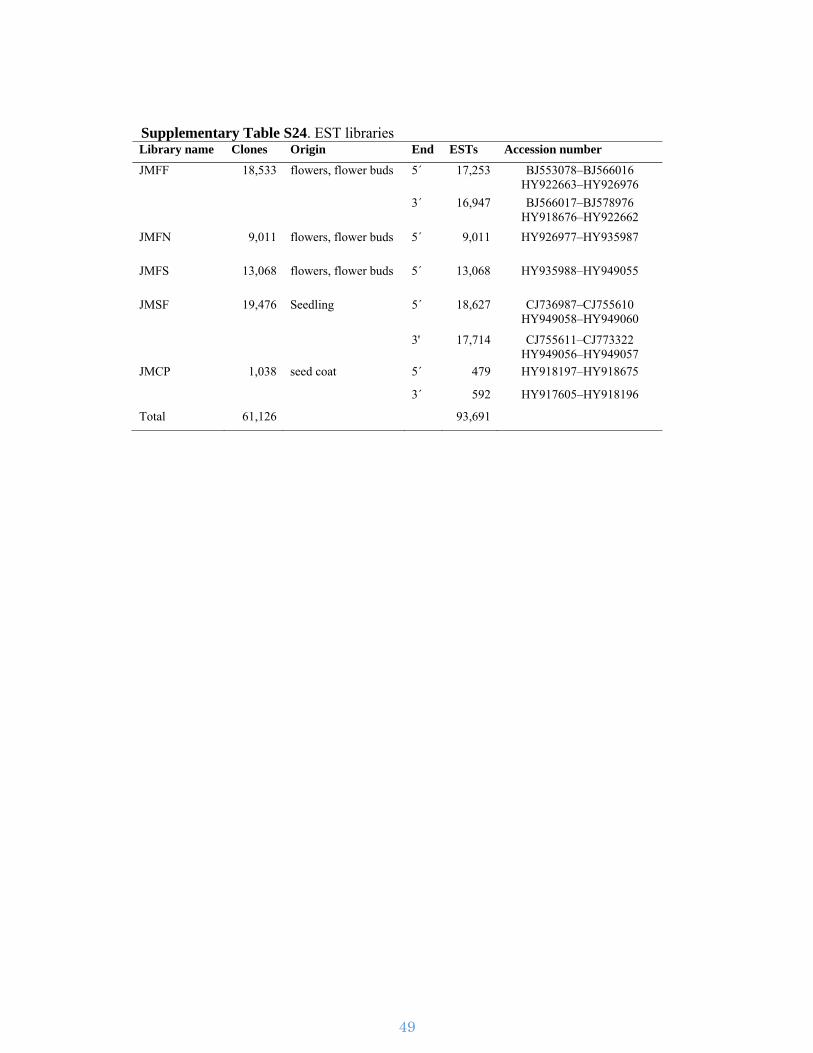
Supplementary Table S24. EST libraries Library name Clones Origin End ESTs Accession number