6
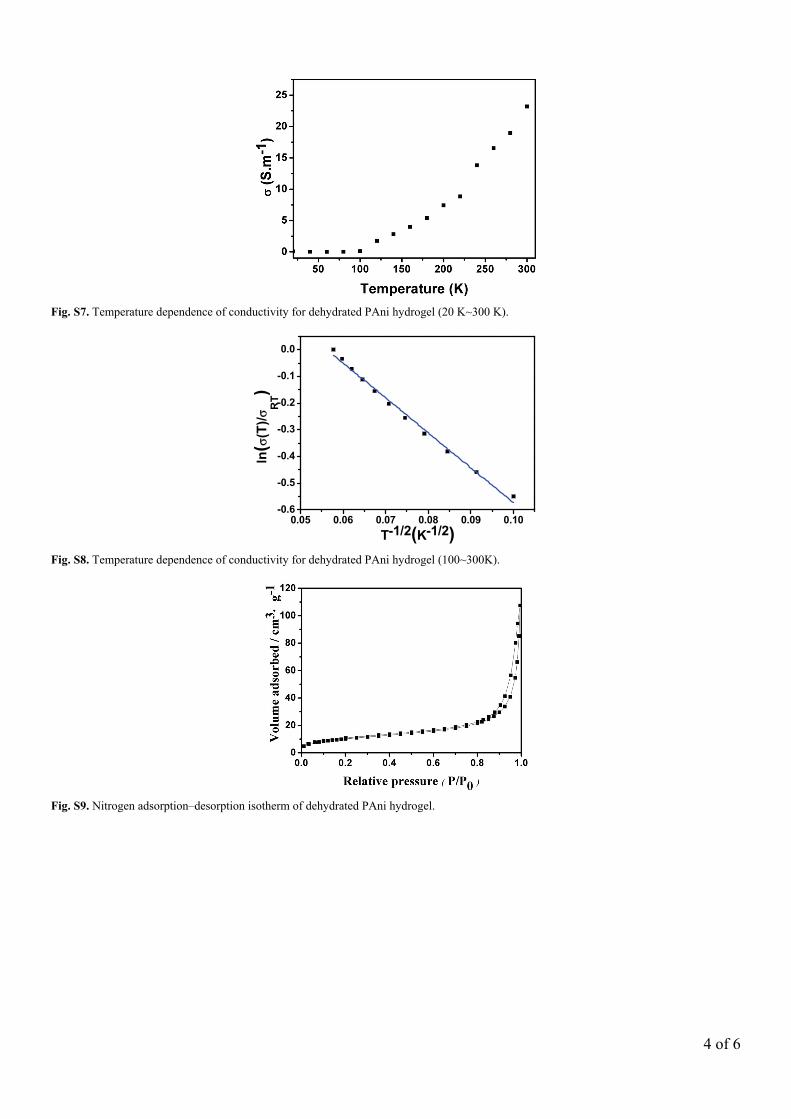
1 of 6 Supplementary Information Pan et al. 12.2636/pnas. 1202636109 SI Materials and Methods 1. Materials. Aniline (ACS reagent, ≥99.5%), ammonium persulfate (ACS reagent, ≥98.0%), chloroform, and phytic acid (also named as inositol hexphosphate, 50 %, w/w in water) were purchased from Sigma-Aldrich. The aniline monomer was distilled before use under reduced pressure. Phosphate buffered saline (PBS) was purchased from Sigma-Aldrich (Saint Louis, Missouri, US). GOx (EC 1.1.3.4, from Aspergillusniger, ∼200 U/mg, Sigma), β-D-(+)-glucose (Sigma) were used as received. 2. Hydrogel synthesis. The PAni hydrogel can also be synthesized by a bi-phasic reaction. For example, placing the aniline monomer in a chloroform phase with phytic acid and the initiator in the aqueous phase produced dark green PAni at the interface, which gradually diffused into the aqueous phase, and formed PAni hydrogel in the aqueous phase finally (Fig. S3). 0.286 g (1.25 mmol) ammonium persulfate was dissolved in 1 ml de-ionized (DI) water, then, 0.921 ml (1 mmol) phytic acid was mixed in, taken as solution A. Solution B is prepared by dissolving 0.458 ml (3 mmol) aniline in 1 ml chloroform. The A and B solution were cooled to 4 °C, and then A solution was poured in to B solution quickly. Polymerization happened in minutes, it was observed that interface between water and chloroform turning green first, and then the whole water phase turned green and forming hydrogel, as shown as Fig. S3. 3. FT-IR spectrum of the samples. The FTIR spectrum of phytic acid doped PAni is identical to emeraldine salt form of PAni. The large descending baseline in spectral region around 3000~2000 cm –1 was attributed to free–electron conduction in the doped polymer (S1). The characteristic peaks at 1570 and 1480 cm –1 are due to the stretching vibration of quinoid ring and benzenoid ring, respectively, which indicates that the chemical structure of phytic acid doped PAni are emeraldine rather than solely leucoemeraldine or permigraniline form (S2). The bands at 1300 and 1246 cm –1 can be assigned to C–N stretching vibration with aromatic conjugation (S2). It is generally accepted that the absorption peak near 1140 cm –1 is resulted from the N=Q=N (Q denotes quinoid ring) stretching mode, which is also an indication of the electron delocation in PAni (S3). The absorption around 798 and 505 cm –1 is attributed to the bending vibrations of the C–H bonds within the 1,4−disubstituted aromatic ring (S2-3). 4. Uv-Vis spectrum of the samples. The bands of PAni hydrogel around 440 nm, and a long tail at wavelength longer than 800 nm, revealing its chemical structure is identical to the doped emeraldine state of PAni (S4). The bands around 440 nm and the long tail at wavelength longer than 800 nm can be attributed to polaron−π* transition and π−polaron transition, respectively. Since the polyaniline/phytic acid hydrogel have no absorption due to free phytic acid at 262 nm (Curve C, Fig. S5, orange line), phytic acid is most likely tightly incorporated as anions within the polyaniline backbone during the in situ polymerization of aniline in phytic acid solution. Dedoped polyaniline nanofibers (Curve B) can be obtained by dialyzing the pristine PAni hydrogel against 0.1 M ammonium hydroxide, which produces the emeraldine base form of polyaniline (Fig. S5, blue line). 5. Impedance measurement of PAni hydrogel. It should be noted the conductivity of conductive hydrogel must be measured by impedance method using alternating current. Using direct current to measure will include a big capacitance of PAni. The conductivity of PAni hydrogel was evaluated by measuring impedance between two-terminal Platinum electrodes within the frequency range of 0.01 Hz~100 KHz (BioLogic VMP3 equipped with electrochemical impedance spectroscopy (EIS) board), where the purified PAni hydrogel was put in a glass tube with a length of 32.56 mm and a diameter of 6.8 mm, and sandwiched between a pair of platinum electrodes. 6. Temperature dependence of conductivity of dehydrated PAni hydrogel. The temperature dependence of conductivity of the dehydrated powder of the PAni hydrogel (pressed into pellet) was studied by a standard four-point-probe method. The room temperature electric conductivity was measured to be 0.23 S·cm -1 . The conductivity of the phytic acid doped PAni increased with decreasing temperature between 80K-20K, showing metallic conductivity behaviour. Between 80K-300K, the conductivity decreased with decreasing temperature, exhibiting a typical semiconductor behaviour. Further investigation shows that it is in agreement with one-dimensional variable range hopping (1D-VRH) model proposed by Mott (Fig. S8). It was found that the conductivity of the sample decreased with decreasing temperature between 100~300K, exhibiting a typical semiconductor behaviour. The data are best fit to the relationship of lnσ plotted vs T -1/2 as shown in Fig. S8. So it is reasonable to believe that the temperature dependence of conductivity in this temperature scope is in agreement with one-dimensional variable range hopping (1D-VRH) model proposed by Mott (S5), which is expressed as ], ) / ( exp[ ) ( 1 / 1 0 0 + − = n T T T σ σ n=1, 2, 3 [S1] where σ 0 is a constant, T 0 the hopping barrier, and T the Kelvin temperature. The T 0 values of PAni doped with phytic acid (T 0 =13.05 K) are comparable to those reported in the literature (S6). 7. XRD patterns of dehydrated and wet PAni hydrogel. The intensity of the peaks centred around 2θ=16.0° and 20.0° corresponding to periodicity paralleling to the polymer chains were obviously decrease in the hydrogel sample (S7,S8), implying the relative ordering structure are disappeared due to swelling, and the distance between polymer chains was increased. However, the peak centred at 2θ=25.0 ° (3.56 Å) (dried PAni) shifted to 2θ=28.0 ° (3.18 Å) (swelled hydrogel), which is attributing to the periodicity perpendicular to the polymer chains (π-π stacking) (S9). This may result from reduced distortion of PAni chains and increased mobility of chain segment. For organic conductors, it is well known that cofacially stacked, conjugated backbones (the π-π stacking distance) greatly influences electron orbital overlap and therefore the conductivity (S10), the decreased π-π stacking distance leads to the high conductivity of our hydrogel samples. 8. Viscosity measurement of the solutions. The viscosity of the solutions is suitable for inkjet printing and allows direct deposit without any additives to reduce the viscosity (Table S1). The viscosity of the solution containing the oxidative initiator (solution A) is measured to be about 1.05 cP (Table S1), and the viscosity of the solution containing the aniline and the phytic acid (solution B) is about 0.64-16.0 cP (depends on rotor rotating speed of the viscometer, between 2~100 RPM), which is suitable for inkjet printing and allows direct deposit without any additives to reduce the viscosity. S1. Cao Y, Li S, Xue Z, Guo D (1986) Spectroscopic and electrical characterization of some aniline oligomers and polyaniline. Synth Met 16: 305-315. S2. Furukawa Y, Ueda F, Hyodo Y, Harada I, Nakajima T, Kawagoe T (1988) Vibrational-spectra and structure of polyaniline. Macromolecules 21: 1297-1305.