1 Supplementary Information for Chemical Informatics and Target Identification in a Zebrafish Phenotypic Screen Christian Laggner 1,8 , David Kokel 2,3,8 , Vincent Setola 4,5,8 , Alexandra Tolia 6,7 , Henry Lin 1 , John J. Irwin 1 , Michael J. Keiser 1 , Chung Yan J. Cheung 2,3 , Daniel L. Minor, Jr. 6,7 , Bryan L. Roth 4,5* , Randall T. Peterson 2,3* & Brian K. Shoichet 1* 1 Department of Pharmaceutical Chemistry, University of California, San Francisco, California, USA. 2 Cardiovascular Research Center and Division of Cardiology, Department of Medicine, Massachusetts General Hospital, Harvard Medical School, Charlestown, Massachusetts, USA. 3 Broad Institute, Cambridge, Massachusetts, USA. 4 Department of Pharmacology, University of North Carolina Chapel Hill School of Medicine, Chapel Hill, North Carolina, USA. 5 National Institute of Mental Health Psychoactive Drug Screening Program, University of North Carolina Chapel Hill School of Medicine, Chapel Hill, 6 Cardiovascular Research Institute, University of California, San Francisco, California, USA. 7 Department of Biochemistry and Biophysics, University of California, San Francisco, California, USA. 8 These authors contributed equally to this work. * Correspondence: Bryan Roth: [email protected], phone: 919-966-7539, fax: 919-843-5788 Randall Peterson: [email protected], phone: 617-724-9569, fax: 617-726-5806 Brian Shoichet: [email protected], phone: 415-514-4126, fax: 415-514-4126 Nature Chemical Biology: doi:10.1038/nchembio.732
Transcript
1
Supplementary Information for Chemical Informatics and Target Identification in a Zebrafish
Phenotypic Screen
Christian Laggner1,8, David Kokel2,3,8, Vincent Setola4,5,8, Alexandra Tolia6,7, Henry Lin1,
John J. Irwin1, Michael J. Keiser1, Chung Yan J. Cheung2,3, Daniel L. Minor, Jr. 6,7, Bryan
L. Roth4,5*, Randall T. Peterson2,3* & Brian K. Shoichet1* 1Department of Pharmaceutical Chemistry, University of California, San Francisco, California,
USA. 2Cardiovascular Research Center and Division of Cardiology, Department of Medicine,
Massachusetts General Hospital, Harvard Medical School, Charlestown, Massachusetts, USA. 3Broad Institute, Cambridge, Massachusetts, USA. 4Department of Pharmacology, University of
North Carolina Chapel Hill School of Medicine, Chapel Hill, North Carolina, USA. 5National
Institute of Mental Health Psychoactive Drug Screening Program, University of North Carolina
Chapel Hill School of Medicine, Chapel Hill, 6Cardiovascular Research Institute, University of
California, San Francisco, California, USA. 7Department of Biochemistry and Biophysics,
University of California, San Francisco, California, USA. 8These authors contributed equally to
Brian Shoichet: [email protected], phone: 415-514-4126, fax: 415-514-4126
Nature Chemical Biology: doi:10.1038/nchembio.732
2
SUPPLEMENTARY RESULTS Supplementary Table 1 | Representative, high-confidence but untested target predictions for compounds active in the zebrafish screen. Targets across biological categories (i.e.,
GPCRs, ligand-gated ion channels, transporters, nuclear hormone receptors, enzymes) are
predicted.
Compound Predicted Target Confidence relative to random (SEA E-value)
N
N
O
N
NO
F
F
Me
O
Me
15
PDE1B 7.76×10⁻¹¹
16
PDE4A 6.52×10-65
17 (SKF-82958)
adenylate cyclase VII 2.99×10-57
18 (A-77636)
adenylate cyclase IX 6.38×10-44
Nature Chemical Biology: doi:10.1038/nchembio.732
3
N O
N
N
Cl
O
19
malic enzyme 1 2.52×10-60
O
NEtEt
20
Δ8-Δ7 sterol isomerase 3.23×10⁻¹⁵
NH O
F F
F
21
sirtuin 1 1.00×10⁻¹²
O
O
OAcO
O
OH
H H
22 (strophanthidinic acid
lactone acetate)
Na/K-transporting ATPase
1.54×10⁻²³
Nature Chemical Biology: doi:10.1038/nchembio.732
4
23 (β-toxicarol)
NADH-ubiquinone oxidoreductase
5.89×10-56
I
O
NH
N
24 (4-IBP)
acetylcholinesterase
MCH receptor 1
1.55×10-94
1.37×10-45
25 (PRE-084)
pancreatic alpha-amylase
M4 muscarinic receptor
1.62×10-70 (FCFP4)
2.08×10⁻¹⁷ (FCFP4)
O
NCOOHMe
OEt
26
glycine transporter 1
1.26×10-51
N
N
OHCl
27 (BRL 15572)
vesicular acetylcholine transporter 2.10×10⁻¹⁰
NH
NH
OMe
S
O
O
28
fatty acid transport protein 4 8.15×10⁻³⁰
Nature Chemical Biology: doi:10.1038/nchembio.732
5
O O
N
N
Me
OAc
29
macrophage migration inhibitory
factor
4.84×10⁻¹⁸
30
tubulin 1.92×10-43
31
Nav1.1
2.87×10⁻¹⁴
32
Nav1.5
2.01×10⁻²¹
33
GABA-A
4.16×10⁻¹⁰
(FCFP4)
Nature Chemical Biology: doi:10.1038/nchembio.732
6
34
5-HT3B
1.34×10⁻²¹
35
adenosine A1 receptor 2.34×10⁻²¹
36
vanilloid receptor 1
9.07×10⁻¹¹
NCl
N
NHO
37
mGluR5
5.83×10⁻¹¹
38
progesterone receptor
6.73×10⁻³⁰
Nature Chemical Biology: doi:10.1038/nchembio.732
7
N
HO
39
nociceptin receptor 2.14×10⁻³⁴
40 (fluspirilene)
nociceptin receptor
1.99×10-41
41
κ opioid
3.76×10⁻¹²
OHN
N
O
42
dopamine D3 7.75×10⁻²⁶
Nature Chemical Biology: doi:10.1038/nchembio.732
8
Supplementary Table 2 | Compound-target predictions that, though not in our databases, could be verified by literature search.
Compound Predicted Target Confidence relative to random (SEA E-value)
O
O
HH
H
43 (progesterone)
CYP17a
1.5710-15
NH
HN
O
44
melatonin MT3 1
melatonin MT1 1
melatonin MT2 1
3.78×10-60
3.78×10-60
7.97×10-58
HN
O
45
melatonin MT2 2
melatonin MT1 2
3.54×10⁻¹⁵
8.66×10⁻¹⁵
NH
O
OMe
Cl
Cl
OEt
O
46 (felodipine)
voltage-dependent L-type
calcium channel Cav1.2 3
8.22×10⁻²⁶
Nature Chemical Biology: doi:10.1038/nchembio.732
9
47 (5-methylurapidil)
5-HT1A 4
1.52×10-96
48 (zolantidine)
histamine N-
methyltransferase (HMT) 5
1.36×10- 54
49
5-HT1A 6 2.92×10⁻³¹
50 (CY 208-243)
dopamine D1 7 8.65×10⁻²⁰
SH2N O
OS
NH
HN
Cl
Cl
O O
Cl
51 (trichlormethiazide)
carbonate dehydratase IV 8 4.16×10⁻¹⁰ (FCFP4)
Nature Chemical Biology: doi:10.1038/nchembio.732
10
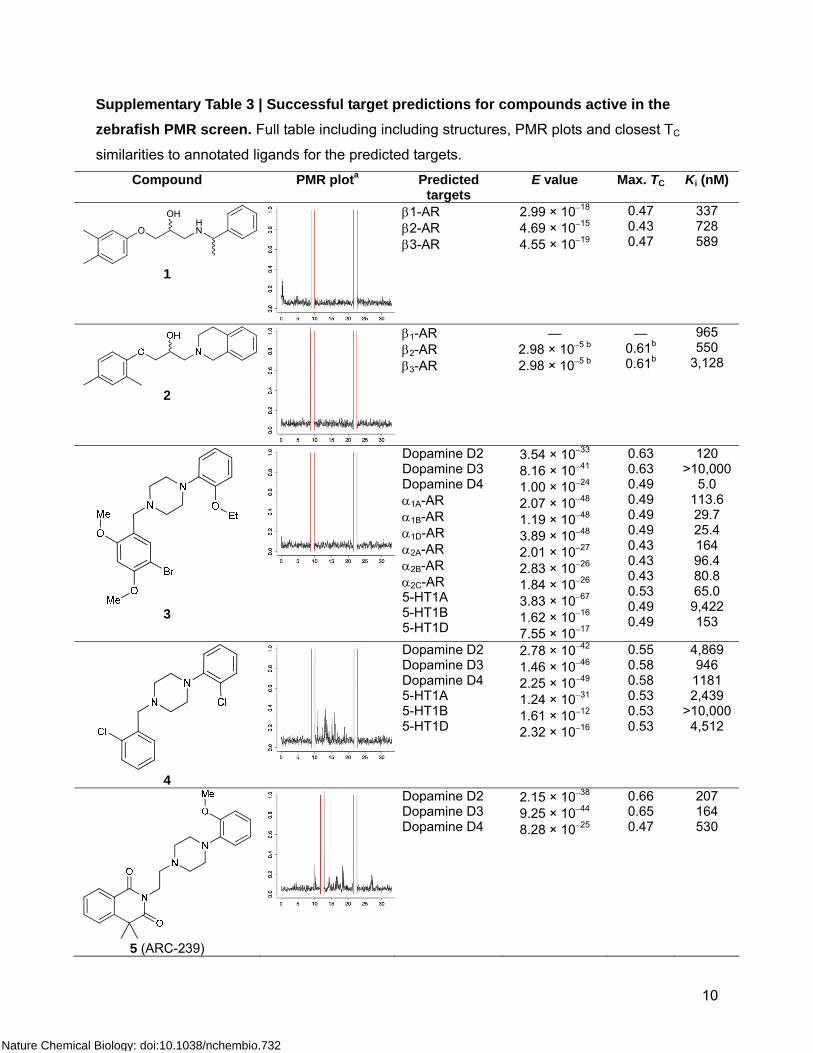
Supplementary Table 3 | Successful target predictions for compounds active in the zebrafish PMR screen. Full table including including structures, PMR plots and closest TC
similarities to annotated ligands for the predicted targets. Compound PMR plota Predicted
aThe aggregate motor activity of ten zebrafish embryos during the PMR assay. The y and x axes
represent the motion index and time, respectively. Red vertical bars at 10 s and 23 s represent the timing
and duration of the stimulus. bCalculated with Daylight fingerprints (note that TC values are not
comparable across different fingerprints; Daylight fingerprints usually give higher TC values than ECFP4
fingerprinting for the same compound pairs). cIC50 (nM). dEC50 (nM). eAssuming competitive inhibition, and
on the basis of the Cheng-Prusoff equation, Ki values would be about half the IC50 values for the kinase
inhibitors. f% Inhibition at 10 μM. AR, adrenergic receptor.
Nature Chemical Biology: doi:10.1038/nchembio.732
13
Supplementary Table 4 | Tested compounds that failed to show activity on the predicted molecular target.
Compound Predicted targets
E-value Ki (nM)
52
oxytocin
vasopressin 1A
1.49×10⁻²⁷
1.22×10-07
> 10,000
> 10,000
O
O
OO
N
53 (flavoxate)
5-HT4 1.50×10⁻²³ > 10,000
N
HNO
N
54
NK3 8.54×10-96 Agonist 1.8%
Antagonist 2.7%
Nature Chemical Biology: doi:10.1038/nchembio.732
14
N
N
N N
O
55
NK3 2.38×10-67 Agonist 3.1%
Antagonist 0.8%
56 (fenbendazole)
TIE-2 3.46×10⁻¹⁸ > 10,000
57 (albendazole)
TIE-2 7.53×10⁻¹⁸
> 10,000
58
CDK7
CDK9
1.92×10⁻¹³
7.19×10⁻¹³
> 10,000
> 10,000
59
CDK4
CDK7
CDK9
Aurora-A
Aurora-B
1.53×10⁻⁷
2.19×10⁻²³
1.54×10⁻¹⁸
4.69×10⁻⁵
3.88×10⁻⁸
> 10,000
> 10,000
> 10,000
> 10,000
> 10,000
60
LCK 1.01×10⁻¹⁴ > 10,000
Nature Chemical Biology: doi:10.1038/nchembio.732
15
Supplementary Figure 1 | The PMR is a behavior-based HTS screening assay in zebrafish.
(a) The aggregate motor activity of 10 zebrafish embryos during the PMR assay. The y-axis and
x-axis represent the motion index and time, respectively. Red vertical bars at 10s and 23s
represent the timing and duration of the stimulus. Dashed, solid and dotted lines indicate the
PMR background, excitation and refractory phases. (b) Image of 10 zebrafish embryos in a
single well of a 96-well plate. (c) Plots from ten independent control wells during the PMR
assay. (d) Bar plot showing the mean number ± s.d. of motor activity spikes/s during the
indicated PMR phase. (e) Four representative drugs that exhibit a specific PMR response. (f)
Plots showing the motor activity of animals in wells treated with the compounds indicated in
panel e.
Nature Chemical Biology: doi:10.1038/nchembio.732
16
Supplementary Figure 2 | Use of a post-SEA charge filter to remove predictions that did not have the same charge as the majority of annotated ligands. In retrospective
calculations, on known ligand-target annotations from the reference ChEMBL database, we
investigated how stringent a charge filter we could use to maximize our sensitivity (Se) and
specificity (Sp). The marked points corresponds to a cutoff value of 5%, at which Se=0.96 and
Sp=0.36, which was selected for filtering the predictions. The biggest improvement step in Sp
was reached by just requiring that the predicted protonation state of the candidate molecule was
reflected by at least one molecule in the target set (Charge percentage > 0%). Even at low
cutoff values we begin to lose some of the true actives, as can be seen in the decline of Se.
Nature Chemical Biology: doi:10.1038/nchembio.732
17
Nature Chemical Biology: doi:10.1038/nchembio.732
18
Supplementary Figure 3 | Concentration-response curves for all active molecules on their predicted targets. The black curves in A-S and V are those of reference compounds that were
measured together with our compounds. For Ki and IC50 values see Table 1. Concentration
values on the x-axis of T and U are given as log micromolar. Cpd. 5 was also assayed at
α1A,B,DARs, α2A,B,CARs, and 5HT1A – these targets were predicted, but found out later to be
known.9-11 In our hands, affinities of cpd. 5 at these targets were 0.8, 8.7, 1.1, 213.8, 15.7, 80.8,
treated with (a) DMSO, (b) compound 13 (Iso), or (c) compounds 13 + 1. The colorbar shows
the range of sigma values displayed in the heatmap. (d) Bar plot showing the mean number of
motor activity spikes in animals treated with DMSO, compound 13, compounds 13 and 14 (bopin), and compounds 13 and 1. Activities during background, excitation and refractory
phases of the PMR are shown. Error bars represent mean values ± s.d.
Nature Chemical Biology: doi:10.1038/nchembio.732
21
Supplementary Figure 6 | The predicted beta antagonist compound 1 shows specific interactions with compound 13 (isoproterenol). (a) Compound 1 does not rescue the
stimulating effects of the Na+/K+ ATP-ase blocker digitoxigenin. Bar plot showing the mean
number of motor activity spikes/s in animals treated with the indicated compounds. (b)
Compound 1, but not the Na+ channel blocker benzocaine, nor the GABA-A agonist diazepam,
rescues the stimulating effects of 13. (c) Line chart showing the percentage of animals rescued
by the indicated treatments. See also Supplemetary Fig. 1 for the PMR plots of 13,
digitoxigenin, benzocaine, and diazepam.
Nature Chemical Biology: doi:10.1038/nchembio.732
22
SUPPLEMENTARY METHODS Zebrafish behavioral pharmacology. Embryos were collected from group matings of Ekwill or
TuAB zebrafish and raised in HEPES (10 mM) buffered E3 media in a dark 28 °C incubator. At
28 hpf, groups of 8-10 embryos were distributed into the wells of a 96 well plate. Compound
stocks were diluted into each well at the specified concentration and allowed to incubate for 1
hour.
To assay the PMR, 1000 frames of digital video were recorded at 33fps using a Hamamatsu
ORCA-ER camera attached to a Nikon TE200 microscope at 1X magnification. Light stimuli
(1s)—from a 300Watt xenon bulb housed in a Sutter Lambda LS illuminator— were delivered
10s and 20s after the start of the video. Instrument control and data measurement were
performed using custom programs for Metamorph Software (Universal Imaging). Each video
was saved for review.
To analyze digital video recordings, custom software scripts (Metamorph) were used to
automatically draw six evenly spaced line segments across the well such that each embryo is
likely to be crossed by one of the lines. The software then tracks the average intensity of the
pixels for each segment over time. Embryo movement changes the light intensity at some
pixels, leading to a commensurate change in the average intensity of the affected lines. A
motion index was formed by taking the absolute value of the difference in average pixel intensity
for adjacent time points and then summing over the six segments. This motion index correlates
with the overall amount of motion in the well, both in terms of contraction frequency and number
of animals in motion. The value of this motion index over time constitutes the basic behavioral
phenotype. The motion index profile for each well was partitioned into three periods—
background, excitation and refractory— based on the following landmarks: Background = start
to pulse 1, Excitation = pulse 1 to pulse 2, refractory = pulse 2 to stop.
To treat zebrafish with chemicals, stock solutions in DMSO were added to each well, mixed, and
allowed to incubate for 1h. Final DMSO concentrations were <1%. In experiments with multiple
compounds, the compounds were added simultaneously.
Hierarchical clustering of behavioral profiles. For each well, the Motion Index was divided
into six behavioral features based on time and representing the PMR background, latency, early
Nature Chemical Biology: doi:10.1038/nchembio.732
23
excitation, late excitation, early refractory and late refractory phases (B, L, E1, E2, R1, R2).
These values were then transformed to the relative number of standard deviations (sigma
values) from the control mean for each feature. These six values comprise the behavioral
profile. Behavioral profiles were clustered using Euclidean distance and average linkage
clustering.
Chemoinformatics. We used the similarity ensemble approach (SEA) algorithms to predict
candidate molecular targets for every hit compound, using a selection of Scitegic12 and
Daylight13 topological fingerprints. SEA relates proteins based on the set-wise chemical
similarity of their ligands, or single molecules to target-ligand sets, correcting for the similarity
one might expect at random, as previously described.14-16 A filtered pre-release version of the
ChEMBL database (https://www.ebi.ac.uk/chembldb/) provided a reference set of target-
annotated compounds. Pipeline Pilot version 6.1.1.0 (Accelrys) provided Scitegic fingerprints
and was used to compare some behavioral similarities. For compound clustering we used
Cytoscape 2.8 with the Cluster, Cheminformatics, and VistaClara plugins. Charges for the
charge-filtering protocol were computed with Epik 2.1107 (Schrödinger), and chemical
structures were drawn with ChemDraw 12.0.
Clustering of hits by chemical and phenotypic similarity. Chemical and phenotypic
similarities were computed with Pipeline Pilot as Tanimoto values based on ECFP4 fingerprints
and Euclidean distance values based on the behavioral σ values for the different time slots,
respectively. Chemical distances above 0.72 and behavioral distances above 0.4 were
discarded. The compounds, their phenotypic profiles and remaining pairwise distance values
were imported into Cytoscape and clustered with Markov (MCL) and Transitivity Clustering
methods using chemical similarities. Several interesting clusters of compounds sharing both
chemical and behavioral similarities emerged, which helped us in prioritizing compounds that
were inspected for their predicted targets.
Target prediction using SEA. For each compound active in the behavioral screen, possible
targets were calculated with SEA, using Scitegic ECFP4, ECFP6, FCFP4, and FCFP6,12 as well
as Daylight fingerprints13 with the widely used Tanimoto coefficient (TC)17 as similarity metric.
Unless otherwise noted, numbers in the manuscript are given for the ECFP4 results. The
ChEMBL database (https://www.ebi.ac.uk/chembldb/) was filtered for compounds annotated for
protein targets with affinity values below 10μM and at least five molecules annotated for each
Nature Chemical Biology: doi:10.1038/nchembio.732
24
target. Only compound-target predictions that were not already known in ChEMBL were
considered. Initial predictions were filtered with a charge-filter protocol: for a given target, all
protonation states with a better than a 1% likelihood were calculated for each target compound
at pH 6-8. The most likely protonation state at pH 6-8 of predicted compounds also was
calculated. A compound-target prediction was only kept if the primary protonation state of the
candidate molecule was represented in at least 5% of the target set compounds
(Supplementary Fig. 2). As an additional guide during visual inspection, targets were annotated
with biological process information from the Gene Ontology (GO) database
(http://www.geneontology.org) and pathway information from the Reactome database
(http://www.reactome.org).
Ligands selected for target identification. Selected hits from our SEA prediction that passed
a visual inspection and had testable targets were sourced from the following commercial
vendors: compounds 1, 3, 4, 6-8, 10, 11, and 52, 54, 55, 58, and 60 were ordered from
ChemBridge, compound 2 from Life Chemicals, compound 5 from Tocris, compounds 9, 56, and
57 from Sigma-Aldrich, compound 53 from MP Biomedicals, and compound 59 from Otava
Chemicals. All compounds were sourced at 95% or greater purity as described by the vendors.
All active compounds were further tested at UCSF for purity by LC/MS, and all were found to be
pure as judged by peak height and identity. For the phenocopy and phenotype inversion
experiments, compounds 12 and 13 were sourced from Sigma-Aldrich and compound 14 from
Enzo Life Sciences, at 98% or greater purity grades.
Radioligand competition binding assays of compounds 1-5, 8, 52 and 53. Crude P2
(21,000 x g) membrane preparations were prepared from cell lines expressing (either stably or
transiently) recombinant human GPCRs using 50 mM Tris, 1% BSA, pH 7.4 at a concentration
of ca. 50 μg protein/μL (assayed by Bradford assay using BSA as a standard). Next, 50 μL of
membrane suspension were added to the wells of a 96-well plate containing 100 μL of binding
assay buffer, 50 μL of radioligand at a concentration equal to five times the dissociation constant
(Kd) for the receptor being assayed, and 50 μL of test drug or reference compound at a
concentration equal to five times the desired assay concentration (Supplementary Table 5).
Reactions were incubated for 60 to 90 min at room temperature in the dark, and then harvested
onto 0.3% PEI-treated GF/A filtermats (Wallac). After three washes with ice-cold wash buffer (50
mM Tris, pH 7.4), filter mats were dried in a microwave oven and impregnated with Meltilex
scintillant (Wallac). Residual binding of radioligand, measured by scintillation counting using a
Nature Chemical Biology: doi:10.1038/nchembio.732
25
TriLux microbeta counter (Wallac), was fit to the one-site radioligand competition binding model
(i.e., a three-parameter logistic equation) in Prism 4.0 (GraphPad) to obtain log IC50 values.
Affinity constants (Ki values) were calculated from best-fit IC50 values using the Cheng-Prusoff
approximation.
Functional Agonist/Antagonist Assays of compounds 54 and 55. HEK293 cells stably
expressing recombinant human NK3 receptors were plated in poly-L-lysine-coated 384-well
plates at a density of 20,000 cells per well in DMEM containing 1% dialyzed fetal bovine serum.
The next day, the cell culture media was replaced with 20 μl/well of HBSS, 20 mM HEPES, 2.5
mM probenecid, pH 7.4 (assay buffer) containing 1X Fluo4 direct calcium assay reagent
(Invitrogen). After a one-hour incubation at 37˚C, the plates were loaded into a FLIPR Tetra
(MDS) and the baseline fluorescence was read for 10 sec (1 read/sec). To measure agonist
activity, the cells were stimulated with 10 μL of 3X test drug or reference compound (substance
P) prepared in assay buffer, and calcium responses (fold over baseline) were recorded for 180
sec (1 read/sec). To assess antagonist activity, the cells were treated with test compound or
buffer and incubated for 6 min, after which the cells were challenged with agonist (substance P)
at a concentration equal to the EC90 at the receptor being assayed.
Electrophysiological studies of compounds 6 and 7. For these recordings, 10ng of rat Kv1.2
mRNA (T7 mMessenger, Ambion) were microinjected into defolliculated stage V-VI Xenopus
laevis oocytes.18 Two-electrode voltage clamp recordings were performed 24 hours post-
injection in a bath of 90K solution (90 mM KCl, 2.0 mM MgCl2, 10mM HEPES pH 7.5) using
standard microelectrodes (0.3 to 3 MΩ) filled with 3M KCl. Currents were recorded using a
GeneClamp 500B amplifier (Axon Instruments) controlled by a 1200 MHz processor computer
(Celeron Gateway) running CLAMPEX 8.2.0.244. Currents were digitized at 1 kHz with Digidata
1332A (Axon Instruments) and analyzed with Clampfit 8.2 (Axon Instruments).To generate
concentration-response curves, membrane potential was held at -80mV and depolarized from -
100 to +30mV in 10mV steps, followed by a tail current command of -80mV. Current amplitudes
were compared at +30mV after application of various compound concentrations for 1300msec,
and the data were fitted using the Hill equation: I=Imin + (Imax-Imin)/[1+([inh]/IC50)H], where I is the
percentage of remaining current in the presence of the inhibitor, Imax and Imin are maximal and
minimal current values respectively, [inh] represents the inhibitor concentration and H is the Hill
coefficient. Each data point represents the mean of four to seven independent measurements
and error bars indicate SEM.
Nature Chemical Biology: doi:10.1038/nchembio.732
26
Inhibition of SERT uptake by compound 9. Substrate uptake into HEK-SERT cells treated
with vehicle, compound 9, or reference compounds was assessed using the Molecular Devices
Transporter Explorer Kit following the manufacturer’s protocol. Compound 9 inhibited substrate
uptake by HEK-SERT cells with a potency similar to that of cocaine. HEK cells not expressing
SERT exhibited no specific substrate uptake (i.e., fluorescence values were comparable to
those observed in HEK-SERT cells treated with 10 μM fluoxetine). Furthermore, compound 9
exhibited an IC50 > 10 μM for substrate uptake by HEK-DAT cells, suggesting that the effect
seen in HEK-SERT cells reflects compound activity at SERT itself and not modulation of some
other component of transporter activity (e.g., ion gradients, ATP, etc.).
Off-chip Mobility Shift Assay (MSA) for compounds 10, 11, and 56-60. Assays were
performed by CarnaBio using the following procedure: The 5 μL of x4 compound solution, 5 μL
of x4 substrate/ATP/Metal solution, and 10 μL of x2 kinase solution were prepared with assay
buffer (20 mM HEPES, 0.01% Triton X-100, 2 mM DTT, pH7.5) and mixed and incubated in a
well of a polypropylene 384 well microplate for 1 or 5 hours at room temperature (depending on
the kinase). To stop the reactions, 60 μL of Termination Buffer (QuickScout Screening Assist
MSA; Carna Biosciences) were added to the well. The reaction mixture was applied to a
LabChip3000 system (Caliper Life Science), and the product and substrate peptide peaks were
separated and quantitated. Substrate-to-product conversion was calculated from the peak
heights of the product(P) and substrate(S) peptides as P/(P+S). Detailed reaction conditions are


![[Supplementary] Brain-wide neural dynamics at single-cell resolution during rapid motor adaptation in larval zebrafish](https://static.documents.pub/doc/80x56/577d1f7a1a28ab4e1e90ae45/supplementary-brain-wide-neural-dynamics-at-single-cell-resolution-during.jpg)


