Supplementary Information for:Oxygen Solubility and Transport in Li-Air Battery Electrolytes: Establishing Criteria and
Strategies for Electrolyte Design
Forrest S. Gittleson*, Reese E. Jones, Donald K. Ward, Michael E. FosterSandia National Laboratories, Livermore, CA 94550, USA
Electrochemically Active Surface Area (ECSA) CalculationThe ECSA of Sigracet 25BC carbon electrodes was measured capacitatively using a symmetric cell with two 15 mm diameter electrodes sandwiching a separator impregnated with 60 μL 1M LiTFSI/Pyr14TFSI (1-butyl-1-methylpyrrolidinium bis(trifluoromethanesulfonyl)imide). After 800 cycles in the range 0-0.8 V at a rate of 15.7 μA, a capacitance of ~5900 μF was obtained.
As shown by Zhang et al.,1 the specific capacitance of sp2 carbon materials can be related to the effective specific surface area (a.k.a. electrochemically active surface area) with the equation:
C = εε0A/d
Where ε is the relative dielectric constant of the electrolyte, ε0 is the vacuum permittivity (8.85 x 10⁻¹² F/m), A is the surface area and d is the thickness of the electric double layer (the distance between the center of the interacting species and pore wall). While Zhang et al. prove the correlation using imidazolium-based ionic liquids, we employ Pyr14TFSI which has a permittivity (ε) of 11.7.2 If we assume O2 molecules (~1.5 Å radius) interact at the electrode surface rather than Pyr14
+ (~3.4 Å radius) or Li+ (~0.9 Å radius) ions, then we can use d = 1.5 Å. This assumption is reasonable given the one electron limiting reaction during discharge in our Li-air cell (O2 + e- ↔ O2
-). With the experimentally determined capacitance and equation above, we calculate A = 83 cm2 per 15 mm diameter Sigracet 25BC electrode.
Electrochemical Methods for Determining D(O2) and C(O2)Several electrochemical methods exist to determine the diffusion coefficient and concentration of a redox active solute in solution. Li-O2 chemistry, however, has unique challenges that limit the accuracy of some methods. In particular, the tendency of insulating reduction products to precipitate and passivate an electrode makes certain stagnant electrolyte techniques difficult to implement with confidence. Both the Cottrell method using chronoamperometry and the Randles-Sevcik/Nicholson-Shain method using cyclic voltammetry in stagnant electrolytes3 are prone to error from rapidly accumulating solid products. Furthermore, these techniques are likely to induce convection in the electrolyte at longer time scales, which will negatively influence the analysis.4 The use of a microelectrode is able to limit some of these undesired affects, but electrode passivation is still a concern.5
Both the Levich technique and hydrodynamic chronocoulometry6,7 using rotating disc or rotating ring disc electrodes make use of controlled electrolyte convection. By rapidly sweeping the semi-soluble Li-O2 reduction intermediates from a flat disc electrode, passivation can be reduced vs. stagnant electrolyte experiments. Since the Levich equation includes terms for both concentration and diffusion coefficient, it is unreliable to determine both parameters from the same set of data.
Hydrodynamic chronocoulometry attempts to solve this by determining the diffusion coefficient and concentration from different aspects of the same data set. The tactic we employ in this work is to independently determine D(O2) from the transit time method using a rotating ring disc electrode8 and C(O2) using the Levich method (examples in Fig. S8b,d,f,g). We believe this methodology provides additional confidence in D(O2) and C(O2) measurements for Li+ electrolytes compared to previous reports. Reported literature values for D(O2) in lithium and tetraalkylammonium electrodes using some of these methods are found in Table S5 and compare favorably to the values derived in this work.
A final note considers the use of commercial dissolved oxygen meters which employ galvanic techniques.9–11 Since these tools are typically calibrated for use in aqueous solutions, the quality of C(O2) data for non-aqueous solutions should be viewed as highly suspect, particularly with lithium chemistries.
Supplemental Figures
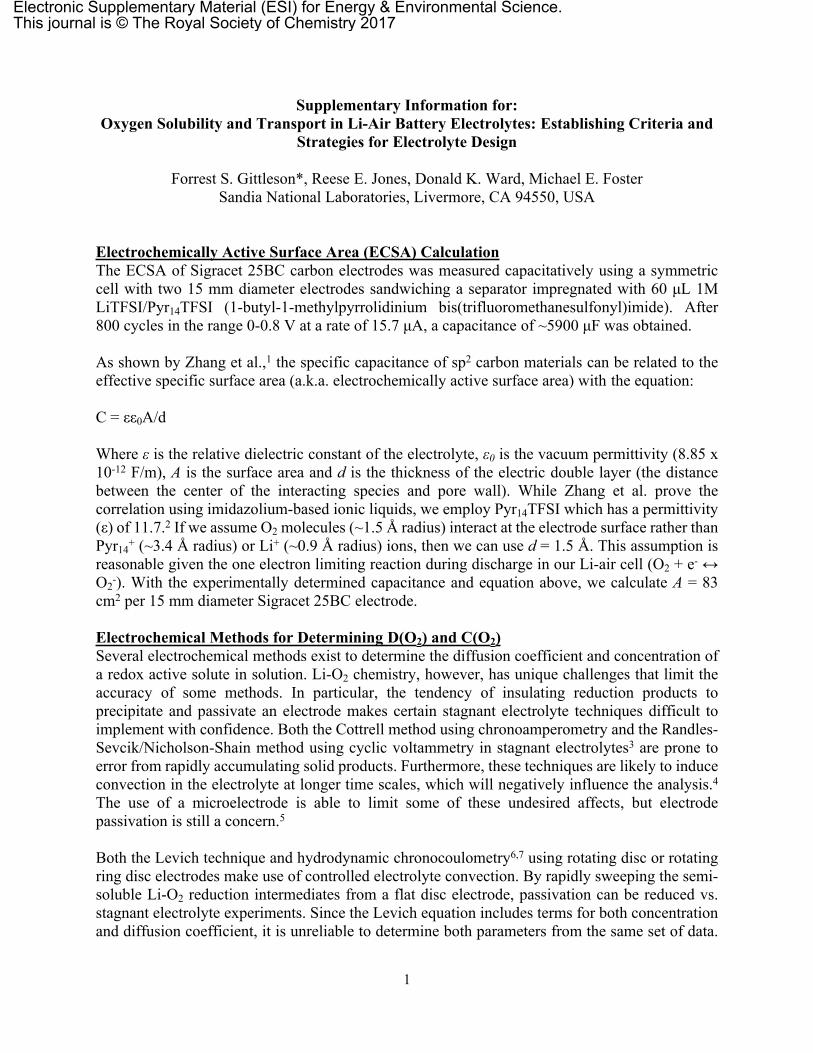
Figure S1. Calculated Onsager diffusion coefficients for oxygen in 1M LiX/TEGDME electrolytes from molecular dynamics simulation with comparison to experimental values.
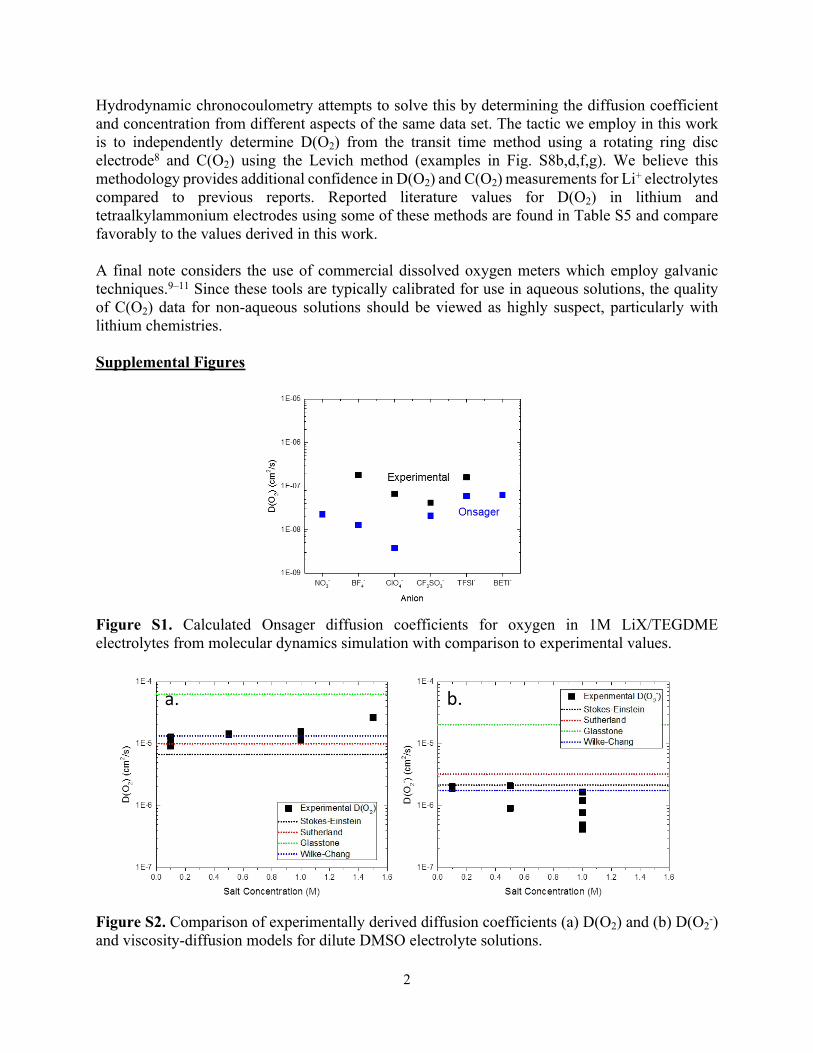
Figure S2. Comparison of experimentally derived diffusion coefficients (a) D(O2) and (b) D(O2-)
and viscosity-diffusion models for dilute DMSO electrolyte solutions.
3
Several diffusion models have been used to predict the diffusion coefficient of solutes in dilute solutions.12 These equations and the parameters we used to calculate D(O2) and D(O2
-) as a function of viscosity, η, for dilute solutions of DMSO are shown below.
Models Basic equation
Stokes-Einstein 𝐷=𝑘𝐵𝑇
6𝜋𝜂𝑅0
Sutherland 𝐷=𝑘𝐵𝑇
4𝜋𝜂𝑅0(Non-stick solute surface)
Glassstone 𝐷=𝑘𝐵𝑇
2𝜂𝑅0(Diffusion as a rate process)
Wilke-Chang 𝐷=7.4 × 10 ‒ 8(𝜑𝑀2)
1/2𝑇
𝜂𝑉0.61(Empirical)
ParameterskB = 1.38 x 10⁻²³ m2 kg/s2 K (Boltzmann constant)T = 295 KR0 = 1.5 x 10⁻¹⁰ m (radius of O2)R0 = 4.9 x 10⁻¹⁰ m (radius of O2
-[DMSO]6)φ = 1.0 (factor for non-hydrogen bonded solvents, i.e. DMSO) M2 = 78.13 g/mol (molecular weight of DMSO)V1 = 25.6 cm3/g mol (molal volume of O2 at boiling point)V1 = 751.3 cm3/g mol (estimated molal volume of O2
- at boiling point, corrected for solvated volume of O2
-[DMSO]6)
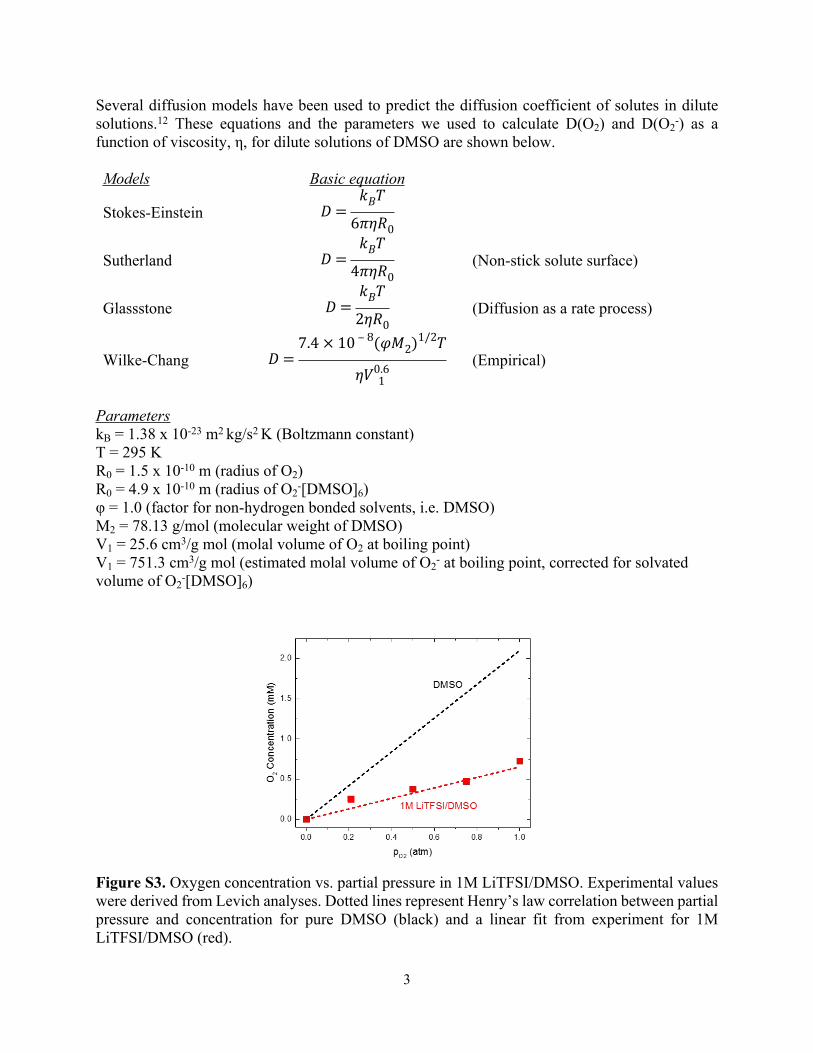
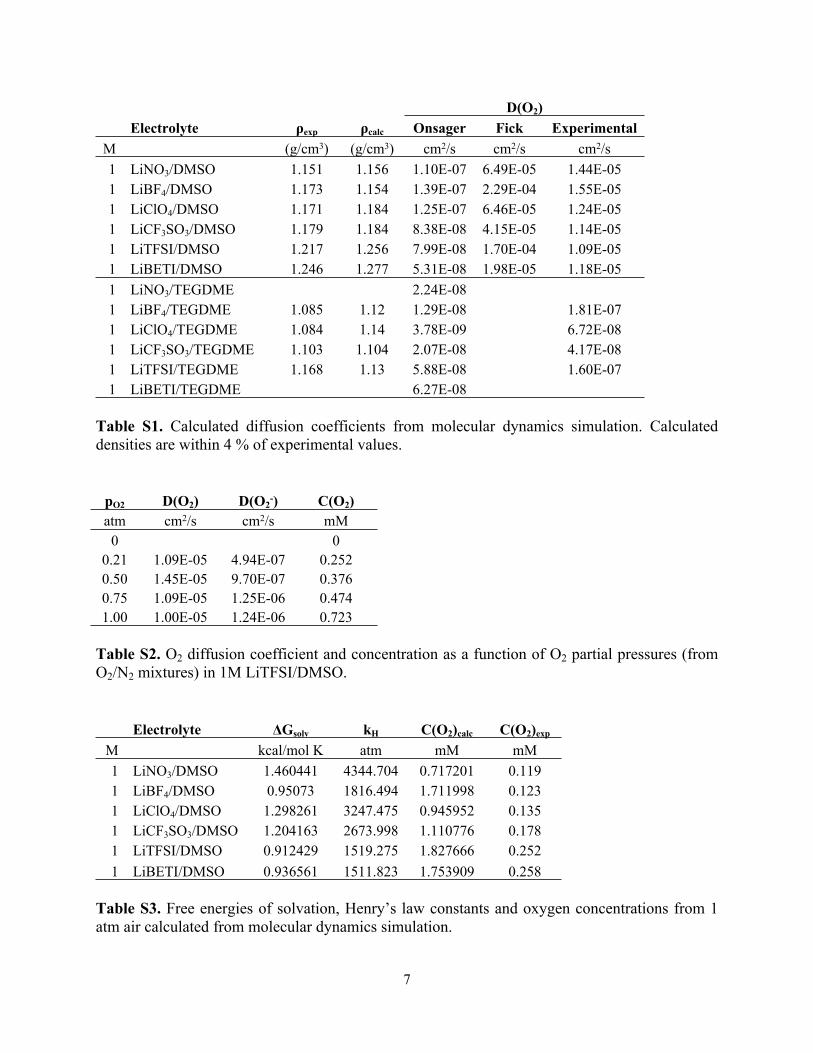
Figure S3. Oxygen concentration vs. partial pressure in 1M LiTFSI/DMSO. Experimental values were derived from Levich analyses. Dotted lines represent Henry’s law correlation between partial pressure and concentration for pure DMSO (black) and a linear fit from experiment for 1M LiTFSI/DMSO (red).
4
Figure S4. Oxygen concentration as a function of cation volume in 0.1M X-BF4/DMSO electrolytes. Tetramethylammonium (TMA+), tetraethylammonium (TEA+) and tetrabutylammonium (TBA+) are used as cations. Note that fully solvated Li+[DMSO]4 fits with the trend of tetraalkylammonium cations.
Figure S5. Energy density as a function of discharge rate to accompany Figure 6.
5
Figure S6. Discharge capacity for various electrolyte compositions as a function of discharge rate.
Figure S7. Discharge profiles for LiTFSI/DMSO electrolytes showing the impact of the Li+ diffusion limit at low Li+ concentration. All cells are discharged at 108 μA/cm2
ECSA, which is lower than calculated ilim(O2) values and ilim(Li+) values for 0.5M and 1M but higher than the calculated ilim(Li+) value for 0.1M. This implies that at this current rate, a cell with a 0.1M LiTFSI/DMSO electrolyte is Li+ transport limited.
6
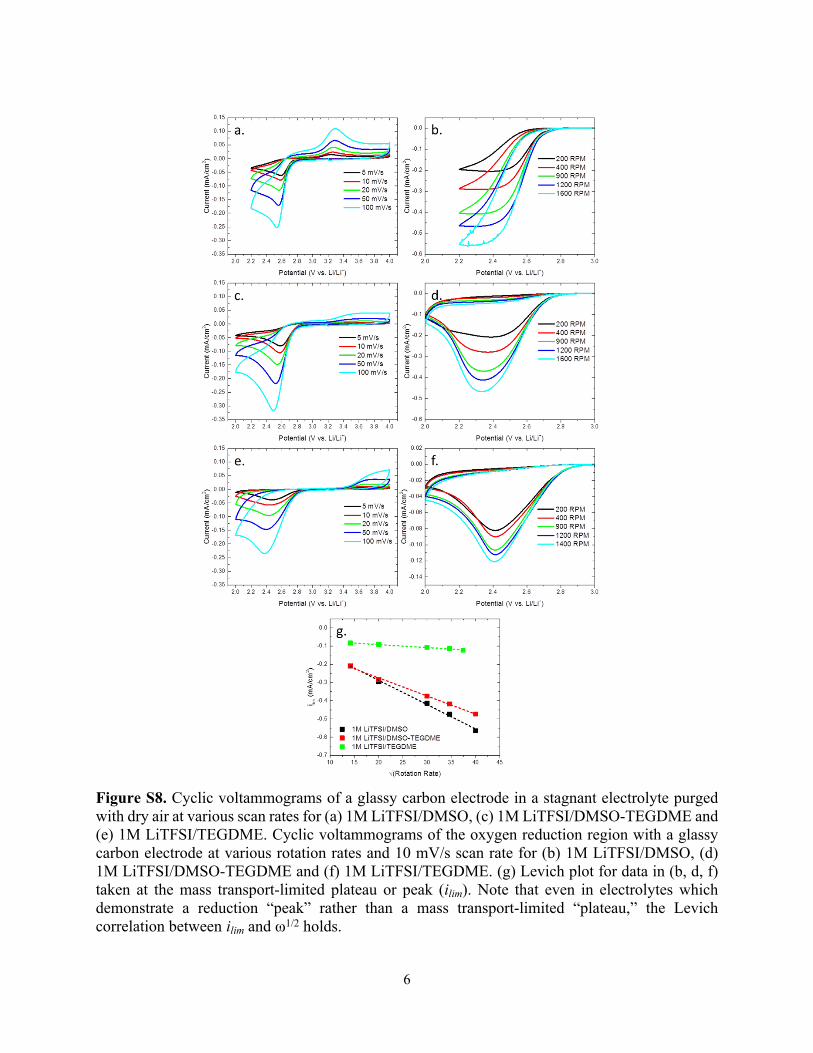
Figure S8. Cyclic voltammograms of a glassy carbon electrode in a stagnant electrolyte purged with dry air at various scan rates for (a) 1M LiTFSI/DMSO, (c) 1M LiTFSI/DMSO-TEGDME and (e) 1M LiTFSI/TEGDME. Cyclic voltammograms of the oxygen reduction region with a glassy carbon electrode at various rotation rates and 10 mV/s scan rate for (b) 1M LiTFSI/DMSO, (d) 1M LiTFSI/DMSO-TEGDME and (f) 1M LiTFSI/TEGDME. (g) Levich plot for data in (b, d, f) taken at the mass transport-limited plateau or peak (ilim). Note that even in electrolytes which demonstrate a reduction “peak” rather than a mass transport-limited “plateau,” the Levich correlation between ilim and ω1/2 holds.
7
D(O2)Electrolyte ρexp ρcalc Onsager Fick Experimental
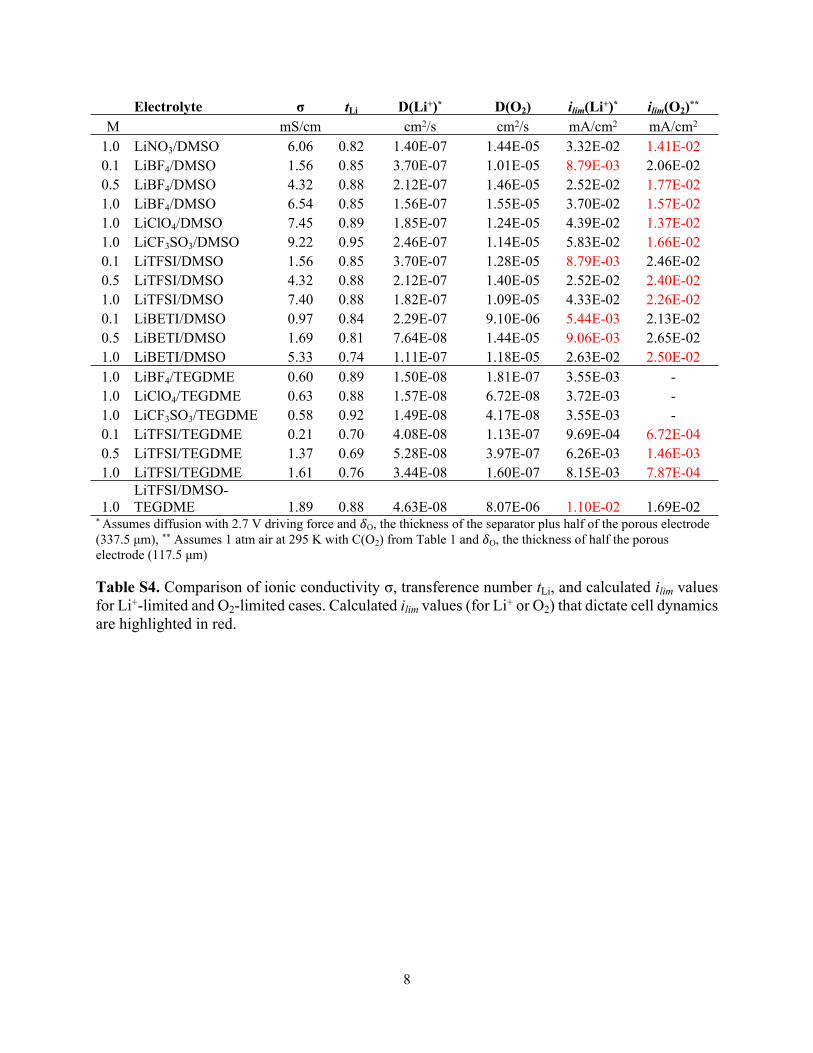
* Assumes diffusion with 2.7 V driving force and 𝛿O, the thickness of the separator plus half of the porous electrode (337.5 μm), ** Assumes 1 atm air at 295 K with C(O2) from Table 1 and 𝛿O, the thickness of half the porous electrode (117.5 μm)
Table S4. Comparison of ionic conductivity σ, transference number tLi, and calculated ilim values for Li+-limited and O2-limited cases. Calculated ilim values (for Li+ or O2) that dictate cell dynamics are highlighted in red.
Table S5. Diffusion coefficients of O2 with lithium and alkylammonium electrolytes from literature.
10
References1 L. Zhang, X. Yang, F. Zhang, G. Long, T. Zhang, K. Leng, Y. Zhang, Y. Huang, Y. Ma, M.
Zhang and Y. Chen, J. Am. Chem. Soc., 2013, 135, 5921−5929.2 H. Weingärtner, P. Sasisanker, C. Daguenet, P. J. Dyson, I. Krossing, J. M. Slattery and T.
Schubert, J. Phys. Chem. B, 2007, 111, 4775–4780.3 C. O. Laoire, S. Mukerjee, K. M. Abraham, E. J. Plichta and M. A. Hendrickson, J. Phys.
Chem. C, 2010, 114, 9178–9186.4 M. Chatenet, M. B. Molina-Concha, N. El-Kissi, G. Parrour and J. P. Diard, Electrochim.
Acta, 2009, 54, 4426–4435.5 I. Gunasekara, S. Mukerjee, E. J. Plichta, M. A. Hendrickson and K. M. Abraham, J.
Electrochem. Soc., 2014, 161, A381–A392.6 S. E. Morris, Trends Anal. Chem., 1988, 7, 227–232.7 M. Tsushima, K. Tokuda and T. Ohsaka, Anal. Chem., 1994, 66, 4551–4556.8 F. Gan and D.-T. Chin, J. Appl. Electrochem, 1993, 23, 452–455.9 W. Xu, J. Xiao, J. Zhang, D. Wang and J.-G. Zhang, J. Electrochem. Soc., 2009, 156, A773–
A779.10 W. Xu, J. Xiao, D. Wang, J. Zhang and J.-G. Zhang, J. Electrochem. Soc., 2010, 157, A219–
A224.11 W. Xu, J. Hu, M. H. Engelhard, S. A. Towne, J. S. Hardy, J. Xiao, J. Feng, M. Y. Hu, J.
Zhang, F. Ding, M. E. Gross and J.-G. Zhang, J. Power Sources, 2012, 215, 240–247.12 E. L. Cussler, Diffusion: Mass Transfer in Fluid Systems, Cambridge University Press,
Cambridge, UK, 1997.13 C. O. Laoire, S. Mukerjee, K. M. Abraham, E. J. Plichta and M. A. Hendrickson, J. Phys.
Chem. C, 2009, 113, 20127–20134.14 D. Vasudevan and H. Wendt, J. Electroanal. Chem., 1995, 192, 69–74.15 D. T. Sawyer and J. L. Roberts, J. Electroanal. Chem., 1966, 12, 90–101.16 I. Gunasekara, S. Mukerjee, E. J. Plichta, M. A. Hendrickson and K. M. Abraham, J.