Page 1
1
SUPPLEMENTARY INFORMATION
TITLE: Mouse aldehyde-oxidase-4 controls diurnal rhythms, fat deposition and locomotor activity
Mineko Terao1, Maria Monica Barzago
1, Mami Kurosaki
1, Maddalena Fratelli
1, Marco Bolis
1,
Andrea Borsotti1, Paolo Bigini
2, Edoardo Micotti
3, Mirjana Carli
4, Roberto William Invernizzi
4,
Renzo Bagnati5, Alice Passoni
5 Roberta Pastorelli
6, Laura Brunelli
6, Ivan Toschi
7, Valentina
Cesari7, Seigo Sanoh
8 and Enrico Garattini
1,9.
1Laboratory of Molecular Biology and
2Laboratory of Biochemistry and Protein Chemistry,
Department of Molecular Biochemistry and Pharmacology; 3Laboratory of Neurodegenerative
diseases; 4Laboratory of Neurochemistry and Behaviour, Department of Neuroscience.
5Analytical
Instrumentation Unit and 6Laboratory of Mass Spectrometry, Department of Environmental Health
Sciences; IRCCS-Istituto di Ricerche Farmacologiche “Mario Negri”, via La Masa 19, 20156,
Milano, Italy. 7Department of Agricultural and Environmental Sciences; Università degli Studi di
Milano, via Celoria 2, 20133 Milano, Italy.
8Graduate School of Biochemical and Health Sciences, Hiroshima University, Hiroshima Japan.
9Correspondence to: Enrico Garattini, MD, Laboratory of Molecular Biology. IRCCS-Istituto di
Ricerche Farmacologiche “Mario Negri”, via La Masa 19, 20156, Milano, Italy. Tel. No.
+390239014533; e-mail address: [email protected] .
Page 2
2
SUPPLEMENTRY METHODS
Circadian cycles
Seventeen Aox4-/-
and 20 WT females (10-12 weeks) were randomized in two groups. In the
first group 8 Aox4-/-
and 10 WT mice were maintained in rooms on a 12h light-dark cycle with the
light on at 7:00 a.m (12L/12D). In the second group, animals (9 Aox4-/-
and 10 WT mice) were
maintained in rooms where the light-dark cycle is inverted (12D/12L). Animals were kept for at
least one month to let them get adjusted to the light-dark cycle before measurements of any
parameter. The same type of experiment was conducted on 19 male Aox4-/-
and 25 WT mice (14-16
weeks) after randomization in two groups. Body weight was recorded twice a week. After 10
weeks, animals were euthanized. Blood samples, HD, liver, hypothalamus, visceral, sub-cutaneous
and inguinal adipose tissue were removed and analysed. Three independent experiments were
performed on distinct cohorts of animals.
Taqman assays
For the PCR determination of the mRNA species described in the study, the following Taqman
assays (Applied Biosystems) were used: AOX1=Mm01255332_m1; AOX3= Mm00508167_m1;
Per2= Mm00478113_m1; Dbp=Mm00497539_m1; Arntl= Mm00500226_m1; Ucp1=
Mm01244861_m1; Elovl3=Mm00468164_m1; Cox7a1= Mm00438296_m1; Clock=Mm00455950;
Rorα=Mm01173766; Rev-Erbβ (NR1d2)=Mm00441730; Mrps33= Mm03009791_m1. Reverse
transcription of total RNA was performed as described (Centritto et al., 2015; Fisher et al., 2015).
Measurement of Melatonin
The HPLC-MS/MS system used for the analysis of melatonin consisted of a 1200 series pumps and
autosampler, (Agilent Technologies, Santa Clara, CA) interfaced to an API 5500 triple quadrupole
Page 3
3
mass spectrometer, equipped with a turbo ion spray source (AB Sciex, Thornhill, Ontario, Canada).
The HPLC separation was obtained with an Atlantis C18 column, 150×2.1 mm, 3.5μm particle size
(Waters Corporation, Milford, MA), using an elution mixture composed of solvent A (0.1 % formic
acid in water) and solvent B (acetonitrile). The injection volume was 8 μl and the flow rate was 160
μL/min. The elution gradient was from 2 to 62% of solvent B in 12 minutes, then to 99% of solvent
B for 2 minutes and re-equilibration for 9 min at 2% of solvent B. The mobile phase was directly
introduced into the ion source, which was operated with a turbo ion gas temperature of 400 C°.
Kynurenin-D4 was used as the internal standard (IS), at the concentration of 1 ng/mL. An external
calibration curve was prepared with variable amounts of melatonin (0, 1, 3, 10 and 30 pg) and a
fixed amount of kynurenin-D4 (1,000 pg), in 200 μL of initial HPLC mobile phase. Mass
spectrometric analyses were performed using positive ionization and selected reaction monitoring
(SRM) mode, measuring the fragmentation products of the protonated pseudo-molecular ions, as
shown in the table below which lists SRM transition and collision energies for melatonin and the
internal standard kinurenin-D4.
Substance SRM transitions Collision Energy
Melatonin 233.2 -> 174.1
233.2 -> 130.1
19
57
Kinurenin-D4 213.2 -> 150.1
213.2 -> 80.0
27
20
Samples (300 μL) were spiked with internal standard (300 pg) and extracted with 3 volumes of
acetonitrile (900 μL). After vortexing for 1 min, the samples were centrifuged at 13200 rpm in an
Eppendorf centrifuge and the supernatant was transferred to another Eppendorf tube. The tubes
were placed in an evaporative centrifuge at 30°C until complete dryness. The residue was
reconstituted with 70 μL of initial HPLC mobile phase, centrifuged and transferred to autosampler
vial inserts.
Page 4
4
Untargeted Metabolomics
Sample Preparation: Harderian glands (HG) from Aox4-KO and -WT mice (3 mice/group) were
homogenized by sonication using a Branson sonicator (model 250, Branson, Danbury, Conn., USA)
in 1mL ice-cold MeOH. Homogenates were centrifuged at 16000xg for 15 minute at 4°C.
Supernatants were divided into two aliquots, dried, and then reconstituted in acidic or basic LC-
compatible solvent.
Liquid Chromatograophy_tandem mass spectrometry (LC-MS/MS) analysis: A portion (2 microL)
of metabolite extract was analysed by LC-MS/MS, using an LTQ Orbitrap XL™ (Thermo
Scientific), interfaced with a 1200 series capillary pump (Agilent). The MS instrument was operated
in positive (POS) and negative (NEG) ionization modes. Untargeted metabolomic data were
processed using the MS label free differential analysis software SIEVE v 2.2 (ThermoFisher).
SIEVE was run on all the LC–MS full-scan chromatograms using the component extraction setting.
The chromatograms were time-aligned, blank subtracting (solvent background) and referencing the
sample acquired in the middle of the sequence. The framing parameters were set at 0.01 Da for the
m/z window and 0.35 min for the retention time (RT) window; 500,000 was used as the intensity
threshold. Before any statistical analysis the value of each molecular species (frame) detected by
SIEVE was normalized to the intensity of the internal standards using the FRAME option for spiked
internal standards (all frames are normalized to the designated frame with the internal standard ion).
An additional filtering criterion was then applied to include in the dataset only frames with an
intensity coefficient of variation <50% in at least one experimental group
Multivariate data analysis: The normalized ion intensity data for each sample was submitted to the
SIMCA-P13 software package (Umetrics) for multivariate data analysis. The variables were scaled
using Pareto scaling to increase the low abundance ions without significantly amplifying the noise.
To maximize class discrimination, the data were analysed by orthogonal partial least-squares
discriminant analysis (OPLS-DA). S-plots were calculated to visualize the relationship between
Page 5
5
covariance and correlation within the OPLS-DA results. The features that significantly contributed
to discrimination between groups were identified.
Identification of metabolites: For metabolite identification, the frame m/z values were used for
batch searches on the METLIN database (http://metlin.scrpss.edu) and Human Metabolome
Database (HMDB, http://www.hmdb.ca/). Accurate mass data and isotopic distribution for the
precursor and product ion were compared to spectral data of the reference compounds in the
databases. Lipids were tentatively identified by high mass accuracy and MS/MS fragment ions
using the LIPID Mass database without authentic standards. Identifications were reported only for
metabolites with accurate mass match < 5 ppm.
Isolation of mitochondria and determination of respiratory chain enzymatic activities
Mitochondrial fractions were prepared from HD and WADT tissues derived from 6-8 animals per
experimental group according to the method described by Frezza et al., 2007. The mitochondrial
respiratory chain enzymatic activities of Complexes I-IV and citrate synthase were assessed
according to the methods described by Spinazzi et al., 2012, while Complex-V (ATP synthase),
was measured according to the protocol described by Barrientos et al., 2009. The crude
mitochondrial extracts (8-10 µg of protein) were used in 0.2 ml reaction, and the absorbance was
measured in Tecan infinite M200 spectrophotometer (Tecan, Maennedorf, Switzerland). The
results obtained are presented as Specific Activities (mmol/min/mg protein).
Protein purification, enzymatic assays and mass-spectrometry
Catalytically active AOX4 and AOX3 were purified from HG and liver respectively (Terao
et al., 2009). Enzymatic assays on the purified proteins were performed with tryptophan and 5HIAA
using the Amplex Red XOR assay kit (Molecular Probes), which measures the formation of H2O2.
Melatonin and ATRA were also measured by mass-spectrometry.
Page 6
6
Mass Spectrometry
The HPLC-MS/MS system used for the analysis of the AOX4 and AOX3 products
generated from 5HIAA and tryptophan consisted of a 1200 series pumps and autosampler, (Agilent
Technologies, Santa Clara, CA) interfaced to a Q Exactive Orbitrap mass spectrometer, equipped
with a HESI source (Thermo Fisher Scientific, Waltham MA). The HPLC separation was obtained
with an Atlantis C18 column, 150×2.1 mm, 3.5μm particle size (Waters Corporation, Milford, MA),
using an elution mixture composed of solvent A (0.1 % formic acid in water) and solvent B
(acetonitrile). The injection volume was 5 μl and the flow rate was 200 μL/min. The elution
gradient was from 1 to 50% of solvent B in 16 minutes, then to 99% of solvent B in 2 minutes and
re-equilibration for 6 min at 1% of solvent B. The Q Exactive instrument conditions were as
follows: polarity: positive, spray voltage: 4000 V, capillary temp.: 320 °C, probe heater temp.: 300
°C, full MS resolution: 70000, scan range: 125 to 600 m/z, MS/MS resolution: 17500, isolation
window: 2.0 m/z; normalized collision energy: 35.
Samples (200 – 500 μL) were evaporated in a rotary vacuum centrifuge and reconstituted in
40 μL of water. The mass spectrometric analyses were done in full MS and MS/MS scans of the
appropriate pseudo-molecular ions: 205.09715, 221.09207, 192.06552, 208.06043 m/z for
tryptophan, hydroxy-tryptophans, 5HIAA and dihydroxyindoleacetic acid, respectively. The
substances were identified by extracting their high resolution ion chromatograms at 5 ppm width
and their MS/MS spectra at the corresponding retention times. ATRA was measured by mass-
spectrometry as already described (Terao et al., 2009).
Insulin-dependent phosphorylation of IR and AKT in the liver, WADT and muscles of WT and
Aox4-/-
mice
ND-fed WT and Aox4-/-
mice were starved overnight and subsequently treated with insulin (750
milliunits/kg) for 15 minutes. Liver, inguinal WADT and muscles (soleus and gastrocnemius) were
isolated (Agouni et al., 2010). Total tissue extracts were used to perform Western blot analysis with
Page 7
7
the following antibodies: anti-IR (ab69508, Abcam), anti- phosphorylated-IR (ab5678, Abcam),
anti-AKT (Cat. No. 9272, Cell Signaling), anti-phosphorylated AKT (Cat. No. 9271, Ser473, Cell
Signaling) and anti-tubulin (T5168, Sigma).
Measurement of lipid content in the faeces
The amount of total lipids in the faeces of WT and Aox4-/-
mice was determined according to a
standard procedures (Kraus et al., 2015) after extraction with chloroform/methanol (2:1 v/v, Folch
Method). Single lipid species were quantitated after thin layer chromatography of the
chloroform/methanol extracts on Silica gel 60 TLC plates (Art. 5721, Merck) in hexane/ethyl-
ether/acetic acid (80/20/1 v/v) and staining with 50% sulphuric acid at 120°C for 10 minutes
(Fuchs et al., 2011).
SUPPLEMENTARY REFERENCES
Agouni, A., Owen, C., Czopek, A., Mody, N. & Delibegovic, M. In vivo differential effects of
fasting, re-feeding, insulin and insulin stimulation time course on insulin signaling pathway
components in peripheral tissues. Biochem Biophys Res Commun 401, 104-111, doi:S0006-
291X(10)01693-1 (2010).
Barrientos, A., Fontanesi, F. and Diaz, F. (2009) Evaluation of the mitochondrial respiratory chain
and oxidative phosphorylation system using polarography and spectrophotometric enzyme assays.
In Current Protocols of Human Genetics. Chapter Unit 9.3 doi: 10.1002/0471142905.hg1903s63.
Centritto, F., Paroni, G., Bolis, M., Garattini, S.K., Kurosaki, M., Barzago, M.M., Zanetti, A.,
Fisher, J.N., Scott, M.F., Pattini, L., Lupi, M., Ubezio, P., Piccotti, F., Zambelli, A., Rizzo, P.,
Fisher, J.N., Terao, M., Fratelli, M., Kurosaki, M., Paroni, G., Zanetti, A., Gianni, M., Bolis, M.,
Lupi, M., Tsykin, A., Goodall, G.J., and Garattini, E. (2015). MicroRNA networks regulated by all-
Page 8
8
trans retinoic acid and Lapatinib control the growth, survival and motility of breast cancer cells.
Oncotarget 6, 13176-13200.
Fuchs, B., Suss, R., Teuber, K., Eibisch, M. and Schiller, J. (2011). Lipid analysis by thin-layer
chromatography-A review of the current state. J Chromatogr A 1218: 2754-2774.
Kraus, D., Yang, Q. and Kahn B.B. (2015) Lipid Extraction from mouse feces. Bio-protocol, 5,
January 5, 2015 (http://www.bio-protocol.org/e1375).
Frezza C, Cipolat S, Scorrano L. (2007) Organelle isolation: functional mitochondria from mouse
liver, muscle and cultured fibroblasts. Nat Protoc, 2:287-95.
Gianni, M., Fratelli, M., Terao, M., and Garattini, E. (2015). Cellular and molecular determinants of
all-trans retinoic acid sensitivity in breast cancer: Luminal phenotype and RARalpha expression.
EMBO Mol Med 7, 950-972.
Sarachana T, Hu VW (2013) Genome-wide identification of transcriptional targets of RORA
reveals direct regulation of multiple genes associated with autism spectrum disorder. Mol Autism
4(1): 14.
Spinazzi M, Casarin A, Pertegato V, Salviati L, Angelini C. (2012) Assessment of mitochondrial
respiratory chain enzymatic activities on tissues and cultured cells. Nat Protoc, 7: 1235-46.
Terao, M., Kurosaki, M., Barzago, M.M., Fratelli, M., Bagnati, R., Bastone, A., Giudice, C.,
Scanziani, E., Mancuso, A., Tiveron, C., and Garattini, E. (2009). Role of the molybdoflavoenzyme
aldehyde oxidase homolog 2 in the biosynthesis of retinoic acid: generation and characterization of
a knockout mouse. Mol Cell Biol 29, 357-377.
Page 9
9
SUPPLEMENTARY DATA
Suppl. Table S1 Genes differentially expressed in HG, WADT and liver of Aox4-/-
mice and
pathway enrichment analysis
The table contains the list of genes significantly up- or down-regulated in the HG, WADT and liver
of Aox4-/-
relative to WT mice. Only genes with a Log2 fold change above +0.5 and below -0.5 are
listed. Each expression value corresponds to a single animal. REP = replicate value. Pathway
enrichment analysis was performed on the genes differentially up- or down-regulated in HG,
WADT and liver of Aox4-/-
relative to WT mice. Total = total number of genes constituting the
pathway; FDR = False Discovery Rate; In Data = the value indicates the number of differentially
expressed genes which are part of the pathway. The pathways of interest for the phenotype of
Aox4-/-
animals are boxed in yellow.
Suppl. Table S2 Metabolomics analyses performed in HGs of Aox4-/-
and WT mice
The table lists the metabolites whose levels are significantly different in the HG of Aox4-/-
and WT
animals.
Suppl. Table S3 Genes differentially expressed in HG, WADT and liver of Aox4-/-
mice fed HFD
and pathway enrichment analysis
The table contains the list of genes significantly up- or down-regulated in HG, WADT and liver of
Aox4-/-
relative to WT mice subjected to HFD for 2 months. Only genes with a Log2 fold change
above +0.5 and below -0.5 are listed. Each expression value corresponds to a single animal. REP =
replicate value. Pathway enrichment analysis was performed on the genes differentially up- or
down-regulated in HG, WADT and liver of Aox4-/-
relative to WT mice subjected to HFD. Total =
total number of genes constituting the pathway; FDR = False Discovery Rate; In Data = the value
Page 10
10
indicates the number of differentially expressed genes which are part of the pathway. The
pathways of interest for the phenotype of Aox4-/-
animals are boxed in yellow.
Suppl. Table S4 Rorα target genes regulated in Aox4-/-
mice
The table contains the overlaps between the list of genes significantly up- or down-regulated in our
experimental conditions and the list of putative Rorα direct target genes (Sarachana et al., 2013).
The significance of the enrichments is calculated with the hypergeometric test. A representation
factor >1.0 would indicate enrichment.
Page 11
11
Suppl. Fig. S1 Expression of circadian rhythm genes and AOXs in HG, WADT and Liver
(a) The heatmaps of the Log2 fold changes (Aox4-/-
vs WT) in the expression of the genes belonging
to the “Circadian Rhythms” pathway observed in the indicated tissues are shown. Each box
represents the mean of 4 separate Aox4-/-
and WT animals. The genes are listed in a descending
order of fold changes. (b-d) Expression of the Per2, Dbp and Arntl mRNAs was evaluated in HG
(b), WADT (c) and liver (d) of Aox4-/-
and WT mice by RT-PCR on the same samples used to
determine the levels of the three transcripts with the gene-expression microarray platform. Each
value is the mean+S.D of 4 animals *Significantly different (Student's t-test, p<0.05).
Suppl. Fig. S2 Circadian oscillations of Rev-erbβ mRNA expression in HG, liver and WADT of
male and female animals
The linear graphs show the levels of the clock gene, Rev-erbβ, mRNA measured by PCR at the
indicated zeitgebers (ZT) in HD, liver and WADT of female and male animals. Values are the
mean+SE of 4 mice.
Suppl. Fig. S3 Protoporphyrin IX and melatonin in the HG of Aox4-/-
and WT mice
(a) At the indicated zeitgebers (ZT), the levels of protoporphyrin IX in Aox4-/-
and WT HGs were
determined. Protoporphyrin IX was extracted from homogenates with acidic ethanol and
fluorescence intensity was measured (Excitation: 400 nm; Emission: 605 nm) using 1 µM
mesporphyrin IX as a standard. Each value is the mean+SD of 5 distinct mice. White boxes =
light-phase; Black boxes = dark-phase. *Significantly different according to the Student's t-test
(p<0.05). **Significantly different according to the Student's t-test (p<0.01). (b) The panel
illustrates the mass-spectra of melatonin and the corresponding external standard (Kynurenin-D4)
which were determined in the indicated samples.
Page 12
12
Suppl. Fig. S4 OPLS-DA analysis of metabolomics data in HG of Aox4-/-
and WT animals.
(a) OPLS-DA score plot showing classes separated according to their metabolic signature
(POSITIVE ION mode), where classes correspond to Aox4-/-
and WT. (b) S-plot highlighting which
ions of interest (POSITIVE ION mode) are up or down regulated in their respective group. (c)
OPLS-DA score plot showing classes separated according to their metabolic signature (NEGATIVE
ION mode), where classes correspond to Aox4-/-
and WT. (d) S-plot highlighting which ions of
interest (NEGATIVE ION mode) are up or down regulated in their respective group.
Suppl. Fig. S5 Serotonin and melatonin biosynthetic pathway
The boxed compounds indicate the metabolites of the serotonin/melatonin pathway whose levels are
significantly different in Aox4-/-
and WT mice, as assessed by metabolomics.
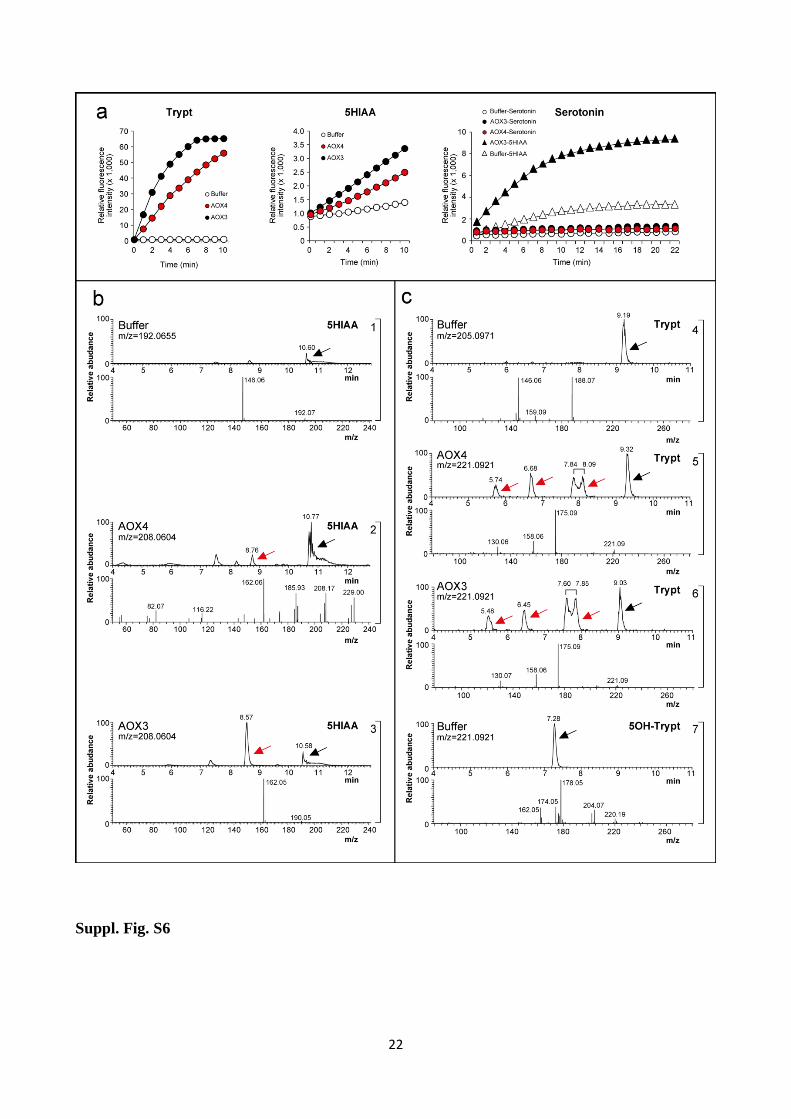
Suppl. Fig. S6 Tryptophan and 5HIAA are transformed into mono-hydroxylated products by AOX4
and AOX3
(a) Purified AOX4 and AOX3 (0.3 and 0.5µg) were incubated with tryptophan (10µM), 5HIAA
(1mM) or serotonin (1mM). Enzymatic activity was measured with a peroxidase coupled
fluorescence assay. The negative controls shown were run in the absence of the two enzymes,
although similar results were obtained after boiling the enzymes for 10 minutes prior to the assay.
In the leftmost panel illustrating the results obtained with serotonin, the internal positive control of
the experiment is represented by 5HIAA, as indicated. (b) The panels illustrate the LC-MS/MS
results obtained after incubation of 5HIAA with no enzyme (1), 25 µg AOX4 (2) and 75 µg AOX3
(3) in 200 µl 20 mM ammonium acetate (pH 7.5) at 37°C for 5 minutes. Upper: The HPLC
separation chromatogram is presented. Lower: The fragmentation profiles of tryptophan and mono-
hydroxylated products are shown as indicated. (c) The panels show the LC-MS/MS results
obtained after incubation of tryptophan with no enzyme (4), purified AOX4 (5) and purified AOX3
Page 13
13
(6). Panel (7) shows the results obtained with the 5-OH tryptophan standard. The upper and lower
sections of each panel are as in (b).
Suppl. Fig. S7 Mitochondrial respiratory chain enzymatic activities in HG of Aox4-/-
and WT mice
HGs of Aox4-/-
and WT mice kept under standard conditions were used to isolate mitochondria.
Crude mitochondrial fractions were obtained from individual animals (4 mice/experimental group)
as detailed in SUPPLEMENTARY METHODS and the indicated mitochondrial enzymatic
activities were measured. Values are the mean+SE of at least 4 samples. * Significantly different
(Student's t-test, p<0.05).
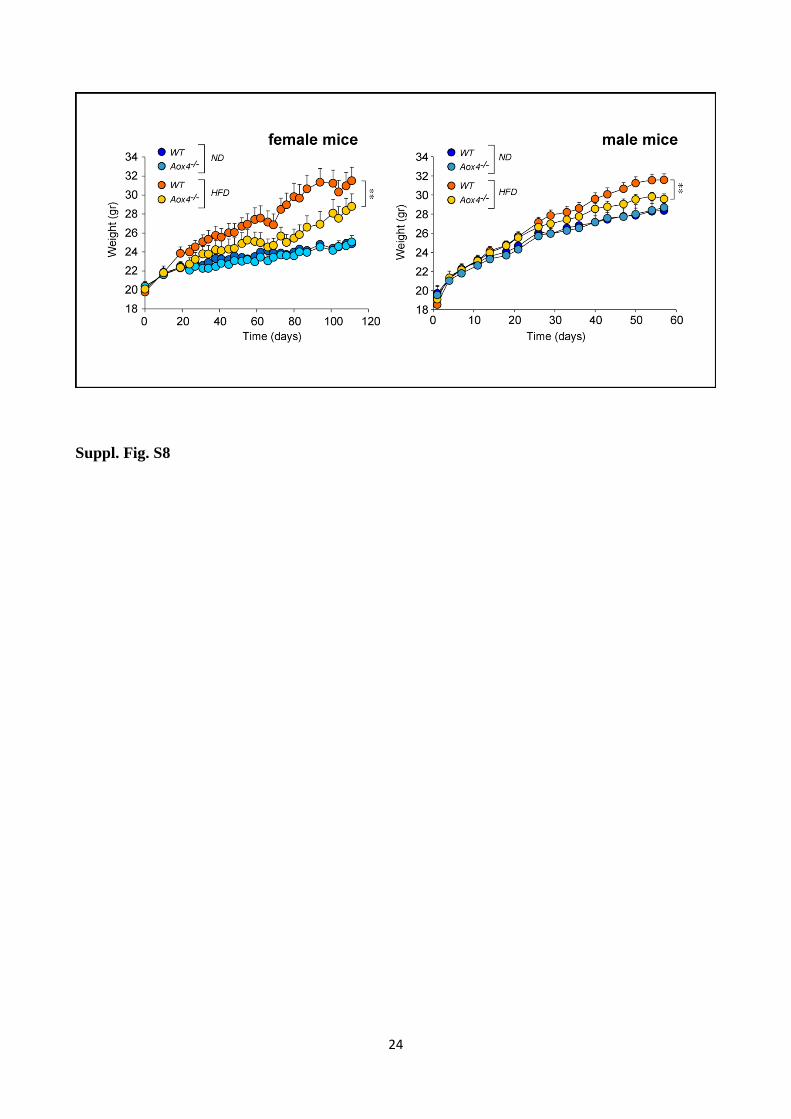
Suppl. Fig. S8 Body weight of female and male WT and Aox4-/-
Female or male WT and Aox4-/-
mice were subjected to normal (ND) and high fat (HFD) for 110 or
60 days. The panels show the body weight curves of female and male WT and Aox4-/-
mice. Values
are the mean+SD of 10 mice. ** Significantly different (Student's t-test, p<0.01).
Suppl. Fig. S9 Analysis of faeces and urines in Aox4-/-
and WT mice
(a) and (b) Eight animals/experimental group were housed in four metabolic cages (2 mice/cage)
and maintained under standard conditions for a period of 24 hours. Faeces (a) and urines (b) were
collected and the corresponding amounts or volumes measured. The results are representative of 3
independent experiments and do not show significant differences between Aox4-/-
and WT female
or male animals following t-test. The results are the mean+SD. (c) Left: Twelve Aox4-/-
or WT
animals/experimental group were fed ND or HFD, as indicated, for 15 days. Faeces from single
cages housing 3 animals/cage were collected during the last 3 days and total lipids were extracted
with chloroform/methanol. The content of total lipids in the faeces (mg/gram of faeces) is
illustrated and each value is the mean+SE of 4 separate cages/experimental group. ** Significantly
different (Student's t-test, p<0.01). Right: The panel illustrates the qualitative lipid composition of
Page 14
14
the faecal chloroform/methanol extracts of Aox4-/-
or WT animals subjected to ND or HFD, as
assessed by thin layer chromatography. The migration of the following lipid standards is indicated
on the left: 1 = cholesterol esters; 2 = triglycerides; 3 = diglycerides; 4 = free fatty acids; 5 =
cholesterol; 6 = phospholipids.
Suppl. Fig. S10 Expression of BADT marker mRNAs in WADT of Aox4-/-
and WT mice
Female WT and Aox4-/-
mice were subjected to ND and HFD for 110 days. The graphs illustrate the
expression of the indicated mRNAs in WADT, as determined by microarray analysis. Values are the
mean+SE of 4 mice. **Significantly different ( Student's t-test, p<0.01).
Suppl. Fig. S11 Mitochondrial respiratory chain enzymatic activities in WADT of Aox4-/-
and WT
mice
Aox4-/-
and WT mice were subjected to ND and HFD for 110 days. Crude mitochondrial fractions
were isolated from individual animals as detailed in SUPPLEMENTARY METHODS and the
indicated mitochondrial enzymatic activities were measured. Values are the mean+SE of at least 4
mice. * Significantly different (Student's t-test, p<0.05); ** Significantly different (Student's t-test,
p<0.01).
Suppl. Fig. S12 Effect of Insulin on the phosphorylation/activation of the Insulin Receptor and the
downstream AKT kinase in WADT, liver and muscles of Aox4-/-
and WT mice
Aox4-/-
and WT mice were starved overnight. The next morning, 6 animals/experimental group
were treated with vehicle (DMSO) or 750 milliunits/kg of insulin intraperitoneally. Total extracts
of inguinal WADT, liver and a mixture of soleus and gastrocnemium muscles were subjected to
Western Blot analysis for the indicated proteins. IR = Insulin receptor; AKT = AKT
serine/threonine kinase 1. Tubulin was used as a loading control. Each lane represents an
individual animal. The column graphs indicate the densitometric analyses of the phosphorylated IR
Page 15
15
and AKT bands, as indicated. The values are calculated as ratio of the densitometric volumes of the
phosphorylated-IR and total-IR (IRp/IR) or the phosphorylated-AKT and total-AKT (AKTp/AKT)
bands. Each value is the mean+S.E. of 3 individual pooled extracts (2 individual animals/pool).
Suppl. Fig. S13 Body temperature of female and male Aox4-/-
and WT mice
The graphs show the rectal body temperatures in female and male Aox4-/-
and WT animals measured
at different zeitgebers. The first points (ZT=4) are repeated at the end of the graph to better
represent the circadian rhythm oscillations. Each value is the mean+SE of 45-55 measurements
over a period of 12 weeks in 8-10 mice per group. White boxes=light on; Black boxes=light off.
Suppl. Fig. S14 UCP-1 activity in BADT, abdominal fat volume and total body weight of Aox4-/-
and WT mice kept in thermo-neutral conditions
Female Aox4-/-
and WT mice normally kept at 22°C in standard animal house conditions were
maintained for 30 days in thermoneutral conditions (30°C). (a) Intra-scapular brown adipose tissue
(BADT) was isolated from each animal. Total RNA was extracted and the levels of UCP-1 mRNA
were determined by a specific Taqman assay. Values are the mean+SE of 4 mice. ** Significantly
different (Student's t-test, p<0.01). (b) The abdominal fat volume (MRI analysis) was determined
as detailed for Fig. 6a and 6b before switching the animals from 22°C to 30°C (time 0) and after 30
days at 30°C (time 30). ** Significantly different (Student's t-test, p<0.01). (c) The panel
illustrates the total body weight determined at the indicated times following switching from 22°C
(time 0) to 30°C. Values are the mean+SE of 8 animals.
Suppl. Fig. S15 Serum ATRA levels of Aox4-/-
and WT mice
The graphs show the serum levels of ATRA measured in Aox4-/-
and WT animals by mass-
spectrometry, using Acitretin as an internal standard. The first points (ZT=4) are repeated at the
end of the graph to better represent the circadian rhythm oscillations. Each value is the mean+SE of
Page 16
16
10 distinct mice. White boxes=light on; Black boxes=light off. *Significantly different according
to the Student's t-test (p<0.05).
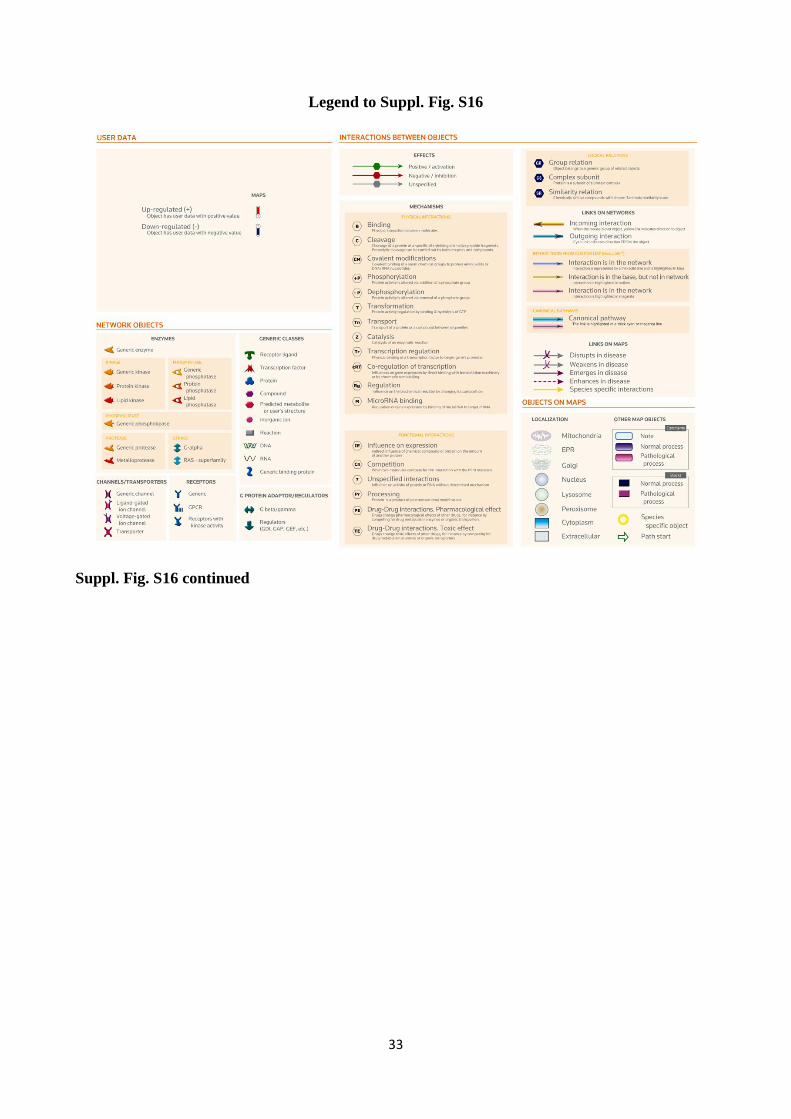
Suppl. Fig. S16 Map of the “Development_Insulin, IGF1 and TNFα in brown adipocyte
differentiation” pathway
The figure summarizes the changes (Aox4-/-
vs WT ) in the expression of the genes belonging to the
Metacore “Development_Insulin, IGF1 and TNFα in brown adipocyte differentiation” pathway map
animals in the three tissues considered. The map is based on the results obtained with the whole-
genome gene expression microarrays. Only significant changes are indicated (p<0.05, fold change
>0.6). 1 = HG of animals fed ND; 2 = HG of animals fed HFD; 3 = Liver of animals fed ND; 4 =
Liver of animals fed HFD; 5 = WADT of animals fed ND; 6 = WADT of animals fed HFD
Suppl. Fig. S17 Survival curves of Aox4-/-
and WT mice
Kaplan-Meier survival curves of female and male Aox4-/-
and WT animals. Censored events
(vertical lines) indicate animals which were sacrificed for independent reasons. The p-values are the
results of COX proportional hazard analysis.
Page 17
17
Suppl. Fig. S1
Page 18
18
Suppl. Fig. S2
Page 19
19
Suppl. Fig. S3
Page 20
20
Suppl. Fig. S4
Page 21
21
Suppl. Fig. S5
Page 22
22
Suppl. Fig. S6
Page 23
23
Suppl. Fig. S7
Page 24
24
Suppl. Fig. S8
Page 25
25
Suppl. Fig. S9
Page 26
26
Suppl. Fig. S10
Page 27
27
Suppl. Fig. S11
Page 28
28
Suppl. Fig. S12
Page 29
29
Suppl. Fig. S13
Page 30
30
Suppl. Fig. S14
Page 31
31
Suppl. Fig. S15
Page 32
32
Suppl. Fig. S16
Page 33
33
Legend to Suppl. Fig. S16
Suppl. Fig. S16 continued
Page 34
34
Suppl. Fig. S17


![30th June 2016, 7pm Edoardo Zosi On the occasion of the ... · Sarasate: "Zigeunerweisen" Op.20 (Spain) [8] violin: Edoardo Zosi piano: Richard Black Edoardo Zosi: Edoardo made this](https://static.documents.pub/doc/80x56/5e1875b1e1d29a68bd53fd71/30th-june-2016-7pm-edoardo-zosi-on-the-occasion-of-the-sarasate-zigeunerweisen.jpg)
