Page 1
Contents
Supplementary Materials and Methods .......................................................................................... 3
Patient samples............................................................................................................................ 3
Next Generation Sequencing ...................................................................................................... 3
Whole genome sequencing ..................................................................................................... 3
Chromothripsis ........................................................................................................................ 4
RNA sequencing ..................................................................................................................... 5
Validation of genetic alterations ............................................................................................. 5
Calculation of background mutation rate ................................................................................ 6
Calculation of significance of SV position ............................................................................. 6
Fluorescence in situ Hybridization (FISH) ................................................................................. 7
Immunohistochemistry ............................................................................................................... 7
Western Blot Analysis ................................................................................................................ 8
RT-PCR....................................................................................................................................... 8
Cloning and Retroviral Production ............................................................................................. 8
Fractionation of Nuclear and Cytoplasmic extracts .................................................................... 9
Promoter transactivation Reporter assays ................................................................................... 9
Mouse RNA Samples .................................................................................................................. 9
Ingenuity Pathway Analysis (IPA) ........................................................................................... 10
Affymetrix microarray analysis ................................................................................................ 11
Supplementary Results.................................................................................................................. 12
C11orf95 & Protein Sequence Analysis ................................................................................... 12
Genomic Aberrations ................................................................................................................ 12
Singleton and low frequency mutations ................................................................................ 12
Copy number variations ........................................................................................................ 13
Structural variations .............................................................................................................. 14
Chromothripsis ...................................................................................................................... 15
Details of all fusion cases ..................................................................................................... 15
Ingenuity Pathway Analysis (IPA). .......................................................................................... 21
Telomere Analysis .................................................................................................................... 22
Supplementary Figures ................................................................................................................. 23
Figure S1: CIRCOS Plots ......................................................................................................... 24
Figure S2: Mutation frequencies for WGS discovery cases. .................................................... 33
WWW.NATURE.COM/NATURE | 1
SUPPLEMENTARY INFORMATIONdoi:10.1038/nature13109
Page 2
Figure S3: Copy Number of WGS Cases (CONSERTING) .................................................... 34
Figure S4: Copy number variations of discovery series tumours (SNP Array) ........................ 35
Figure S5: SNVs in ependymomas. .......................................................................................... 36
Figure S6: Focal deletion of CDKN2A. ................................................................................... 37
Figure S7: Focal deletions of TUSC1 and BCOR. ................................................................... 38
Figure S8: ST8 chromothripsis producing C11orf95-RELA fusion. ........................................ 39
Figure S9: ST5 chromothripsis producing C11orf95-RELA fusion. ........................................ 40
Figure S10: Genomic structural variation breakpoints of the nine supratentorial ependymomas analyzed by whole-genome sequencing. ................................................................................... 41
Figure S11: ST17 C11orf95-MAML2 fusion details. .............................................................. 42
Figure S12: IPA Activated Regulators. .................................................................................... 43
Figure S13: IPA Significant Networks. .................................................................................... 44
Figure S14: Primary and secondary structural representation of C11orf95. ............................ 45
Figure S15: Telomere length analysis....................................................................................... 46
Supplementary References ............................................................................................................ 47
WWW.NATURE.COM/NATURE | 2
SUPPLEMENTARY INFORMATIONRESEARCHdoi:10.1038/nature13109
Page 3
SUPPLEMENTARY MATERIALS AND METHODS
Patient samples
Ependymomas were obtained from the St. Jude Children's Research Hospital (SJCRH) tissue
resource core facility and the Children’s Oncology Group (COG) through SJCRH and COG
Institutional Review Board approved protocols. Tissue samples were snap-frozen and / or
formalin fixed and paraffin embedded (FFPE) at the time of resection. DNA and RNA were
extracted from frozen tissue and peripheral blood leukocytes using previously described
methods28. Forty-one samples were submitted for whole genome sequencing (WGS), and 77
samples underwent transcriptome sequencing (RNASeq; Table S1). An additional 89 FFPE
ependymomas were screened for structural variations (Table S1). Criteria for submission of a
tumour sample for WGS were a minimum of 5μg of tumour DNA and a minimum of 5μg of
matching peripheral white blood cell DNA. Quant-iT PicoGreen (Invitrogen) assay was used to
quantify double stranded genomic DNA for sequencing. Basic clinical data for all patients
providing tumour samples is summarized in Supplementary Table S1.
Next Generation Sequencing
Whole genome sequencing
All methods employed for library construction and WGS have been
described previously29,30. Methods employed for WGS mapping, coverage and quality
assessment, single nucleotide variations (SNV) / indel detection, tier annotation for sequence
mutations, prediction of deleterious effects of missense mutations, and identification of loss-of-
heterozygosity have been described previously31. Structural variations were analyzed using
WWW.NATURE.COM/NATURE | 3
SUPPLEMENTARY INFORMATIONRESEARCHdoi:10.1038/nature13109
Page 4
CREST32 and annotated as previously described31. SNVs were classified as described
previously33 (Fig. S1-S2).
Copy number variations (CNVs) were identified by evaluating the difference of read depth for
each tumour and its matching normal DNA using the novel algorithm CONSERTING (COpy
Number SEgmentation by Regression Tree In Next-Gen sequencing31; Fig. S3). Confidence for
a CNV segment boundary was determined using a series of criteria, including: length of flanking
segments, difference of CNV between neighboring segments, presence of sequence gaps on the
reference genome, presence of structural variation (SV) breakpoints, and any CNV in the
matching germline sample. CNV were also detected using SNP 6.0 arrays that were used as an
additional quality control step for WGS (Fig. S4).
Chromothripsis
Korbel and Campbell34 recently proposed four criteria that define chromothripsis: (1) clustering
of breakpoints; (2) randomness of DNA fragment joins; (3) randomness of DNA fragment order;
and (4) ability to walk the derivative chromosome. Since randomness of DNA fragment order
(Criteria 3) was not entirely valid based on Korbel and Campbell’s own analysis, we decided not
to evaluate this feature. For all structural variations (SVs) with at least 1 breakpoint on
chromosome 11, we performed Bartlett's goodness-of-fit test for exponential distribution to
assess whether the distribution of SV breakpoints in each tumor departs from the null hypothesis
of random distribution. A significant departure from random distribution supports clustering of
SV breakpoints. To evaluate whether there is any bias in the DNA fragment joints categorized by
the SV types (i.e. deletion, tandem duplication, head-to-head re-arrangements and tail-to-tail re-
WWW.NATURE.COM/NATURE | 4
SUPPLEMENTARY INFORMATIONRESEARCHdoi:10.1038/nature13109
Page 5
arrangements), we applied goodness-of-fit tests separately for inter- and intra- chromosomal
events with a minimum of 5 SVs. A significant p value suggests biased fragment joins, which
would not support chromothripsis. When both inter- and intra- chromosomal data are available,
we reported the lower p value to represent a more conservative assessment of the random
distribution for DNA fragment joints.
RNA sequencing
Paired-end sequencing was performed using the Illumina Genome Analyzer IIx or HighSeq
platform with 100-bp read length. The resulting paired-end reads were aligned to four databases
using Burrows-Wheeler Aligner (BWA 0.5.5)35: (i) human NCBI Build 37 reference sequence,
(ii) RefSeq, (iii) a sequence file that represents all possible combinations of non-sequential pairs
in RefSeq exons, and (iv) AceView flat file (UCSC), representing transcripts constructed from
human expressed sequence tags (ESTs). After this initial mapping, final BAM files were
produced by selecting the best alignment in the four databases. Structural variation detection was
carried out using CREST32. Additionally, to identify fusion transcripts from RNA-Seq we
created an application called “CICERO” (Cicero Is Crest Extended for RNA Optimizations), a
local assembly-based method that utilizes unmapped and soft-clipped reads. CICERO assembles
reads around breakpoints and maps the contig to the genome to find structural variations at the
transcription level. CICERO is able to find fusions with low expression, fusions within repetitive
regions, fusions with a short first exon, and complex fusions involving more than two genes.
Validation of genetic alterations
A custom capture array was designed to enrich for the 18,826 high quality SNVs (tiers1-3) and
WWW.NATURE.COM/NATURE | 5
SUPPLEMENTARY INFORMATIONRESEARCHdoi:10.1038/nature13109
Page 6
indels and 947 SVs discovered by WGS. This array was used to validate the presence of the non-
reference allele in tumour DNA and its absence from the matched normal sample. After
enrichment, samples were sequenced using Illumina technology, and resulting reads were
mapped to the reference genome.
For sequences that remained uncovered we performed independent polymerase chain reaction
(PCR) amplification followed by sequencing on the MiSeq platform (Illumina). Reads were
mapped as before, and 10889 alterations were validated as somatic mutations.
RNAseq was also used to confirm the presence of aberrant SV transcripts detected by DNA
sequencing. Reverse-transcriptase (RT)-PCR was also used to validate the presence of fusion
transcripts (see below).
Calculation of background mutation rate
The background mutation rate was calculated using validated and high quality tier 3 mutations
(i.e. mutations in non-coding, non-regulatory and non-repetitive regions) normalized against all
tier3 regions with effective coverage (i.e. covered by >10x in both tumour and matching normal
samples).
Calculation of significance of SV position
The genome was divided into bins of 10 Mb. Breakpoint frequencies in each bin were calculated
for individual samples. The enrichment of SV breakpoint frequency in cerebral samples was
measured by the Mann-Whitney test and raw p values were adjusted using the Holm method
WWW.NATURE.COM/NATURE | 6
SUPPLEMENTARY INFORMATIONRESEARCHdoi:10.1038/nature13109
Page 7
implemented in the p.adjust function in R (version 2.11.1).
Fluorescence in situ Hybridization (FISH)
Dual-color interphase FISH was performed as previously described36. FISH probes were derived
from BAC clones (BACPAC Resources, Oakland, CA), labeled with either AlexaFluor-488 or
Rhodamine fluorochromes, and validated on normal control metaphase spreads (Table S15).
Immunohistochemistry
Immunohistochemistry was performed on both human and mouse tumours using sections (5µm)
of FFPE tissue. For detection of p-RELA, sections were treated to heat-induced antigen retrieval
for 40 minutes, followed by overnight incubation with p-NF-κB p65 antibody (Ser276, bs-
3543R, Bioss, Woburn, MA, 1:500 dilution). Signal detection used the Ultravision Plus detection
system (Thermo Scientific, Waltham, MA). Immunohistochemistry for L1CAM was carried out
using the Leica BOND-III platform (Leica Microsystems, Buffalo Grove, IL). The protocol
consisted of heat-induced antigen-retrieval for 20 min followed by a 15 minute incubation with
anti-LICAM antibody (L4543, Sigma-Aldrich, St. Louis, MO, 1:100 dilution). Signal detection
used the Novocastra Bond Polymer Refine Detection kit (Leica Microsystems, Buffalo Grove,
IL). Immunohistochemistry for CCND1 was undertaken on the BenchMark ULTRA system
(Ventana, Tucson AZ). Following heat-induced antigen-retrieval for 36 min, tissues were
incubated for 32 min with anti-CCND1 antibody (241R-18, Cell Marque, Rocklin CA,
prediluted). The ultraView Universal DAB detection kit (Ventana, Tucson AZ) was used for
signal detection.
WWW.NATURE.COM/NATURE | 7
SUPPLEMENTARY INFORMATIONRESEARCHdoi:10.1038/nature13109
Page 8
Western Blot Analysis
Western Blot analysis was performed using standard techniques. Antibodies employed included
NF-κB p65 (ab32536; Rb monoclonal and Cell Signaling #4282), GAPDH (Millipore #374),
Lamin B1 (Abcam #ab16048), and β-Actin (CST 4967; Rb polyclonal).
RT-PCR
Transcription of fusion produces from SVs was confirmed by RT-PCR. RNA was extracted from
either snap-frozen or FFPE tumour samples, and reverse-transcribed using SuperScript®
VILO™ (Life Technologies, Grand Island, NY) and iScript cDNA Synthesis System (Bio-Rad,
Hercules, CA) respectively. PCR was carried out using GoTaq® Long PCR Master Mix
(Promega, Madison, WI), using specific primers (Supplementary Table S14). Fusions were
confirmed by direct sequencing.
Cloning and Retroviral Production
Human cDNA clones of C11ORF95, RELA and YAP1 were cloned into the pCX4-IRES-Red
Fluorescence (cRFP) vector. The Clontech In-Fusion HD EcoDry Cloning Plus system was used
to generate fusion constructs. All constructs were verified by sequencing and used to make
retroviruses as described7. Retrovirus-containing medium was collected, centrifuged, filtered and
concentrated using Centricon plus 70-Millipore. The viral titer was determined by flow
cytometric analysis of neural stem cells transduced with different dilutions of cDNA encoding
retroviruses.
WWW.NATURE.COM/NATURE | 8
SUPPLEMENTARY INFORMATIONRESEARCHdoi:10.1038/nature13109
Page 9
Fractionation of Nuclear and Cytoplasmic extracts
Cells were lysed directly on plate using 500uL Buffer A (10mM HEPES, pH 7.9, 10mM KCl;
0.1mM EDTA, 1mM EDTA, 4% IGEPAL and 10ug/mL of aprotinin, leupeptin, and pepstatin A)
for 10min at room temperature. After high speed centrifugation, lysates corresponding to the
cytoplasmic fraction were transferred to a new tube. The pellet was resuspended by vigorous
shaking at 4oC in 150uL buffer B (20mM HEPES, pH 7.9, 0.4M NaCl, 1mM EDTA, 10%
Glycerol and 10ug/mL of aprotinin, leupeptin, and pepstatin A). Following top speed
centrifugation, lysates corresponding to the nuclear fraction were transferred to a new tube. Total
protein concentration was assessed by Bradford analysis and samples were prepared for western
blot using equal volumes of 2x RIPA Buffer.
Promoter transactivation Reporter assays
Cells were co-transfected with 6µg of NF-κB reporter plasmid 5xkB.eGFP. Forty-eight hours
later cells were stimulated, or not, for 6-8 hours with 5-50ng/mL human TNF. Reporter
fluorescence was quantified by flow cytometry using a LSR II device (BD Biosciences).
Mouse RNA Samples
Total RNA was extracted with TRIzol reagent (Invitrogen) and cDNA was synthesized using the
SuperScript® VILO™ cDNA Synthesis Kit (Invitrogen), according to the manufacturer’s
instructions. Quantitative real-time PCR was performed by using iQ SYBR Green Supermix on
iCycler Real-Time Detection System (BioRad). The primer set used for C11ORF95 was 5`
GCGCTACTACCACGACCACT 3` and 5` CTCCAATGCAAGGAGTAGGG 3`.
WWW.NATURE.COM/NATURE | 9
SUPPLEMENTARY INFORMATIONRESEARCHdoi:10.1038/nature13109
Page 10
Ingenuity Pathway Analysis (IPA)
To investigate the effect of the C11orf95-RELA fusion products on cell transcriptomes, we used
Ingenuity Pathway Analysis (IPA) software (http://www.ingenuity.com/products/ipa) to compare
gene expression profiles among cells and tumours harboring various C11orf95-RELA fusions. In
each analysis, only genes demonstrating a ≥4-fold expression difference between datasets were
included for network and transcription regulator analysis. Differential expression profiles were
generated for the following 4 datasets using HT MG-430 PM Affymetrix array:
1) Mouse embryonic E14.5 NSC derived RELAFUS1 tumours vs parental mouse embryonic E14.5
NSCs (1,470 genes; 2,016 probe sets).
2) Mouse embryonic E14.5 NSCs transduced with RELAFUS1 vs control-transduced NSC (946
genes; 1320 probe sets).
3) Mouse embryonic E14.5 NSCs transduced with RELAWT vs control-transduced NSCs (134
genes; 178 probe sets).
4) Mouse embryonic E14.5 NSCs transduced with C11orf95 vs control-transduced NSCs (15
genes; 18 probe sets).
Ingenuity networks were constructed by comparing differentially expressed genes from each
dataset to the curated Ingenuity database, which includes physical interactions and associations
between genes and microRNAs derived from multiple public databases and the
literature. Networks of fixed size that maximize connectivity to our gene list were constructed
and ranked by inclusivity of differentially expressed genes and the number of multiply connected
or ‘focus genes’ in the Ingenuity database. Statistical significance of networks was determined
WWW.NATURE.COM/NATURE | 10
SUPPLEMENTARY INFORMATIONRESEARCHdoi:10.1038/nature13109
Page 11
by Fishers exact test. Log ratio data were introduced into network visualization, but were not part
of the statistical model. The top 10 significant networks in each dataset are presented in Table
S17.
Affymetrix microarray analysis
mRNA expression profiles were generated using total RNA isolated from human and mouse
tissues and the U133 Plus 2.0 and 430 v 2 microarrays, respectively (Affymetrix, Santa Clara,
CA). Gene expression data were normalized using the MAS 5.0 algorithm. The data were then
transformed and variance stabilized by addition of small factor of 20 that shrinks the effects of
small numbers and then taking the natural logarithm. The median absolute difference (MAD) of
these transformed signals was calculated for each probe set across all samples on each array
separately within species. The data was then imported into Spotfire Decision Site (Palo Alto
CA, USA) and for each probe set and subject z-scores were calculated by computing the mean
and standard deviation across subjects within each probeset. Differences in gene expression
between defined groups (e.g., control transduced vs. RELAFUS1 transduced NSCs) were defined
using a series of Welch t-tests. The resultant lists of p-values were used to define probesets that
passed the Bonferroni threshold at 0.05 percent. Targets of NF-κB signaling were identified from
a compilation of Rel/NF-κB target genes that is derived from the survey paper Activators and
target genes of Rel/NF-kappaB transcription factors (Pahl, Oncogene 1999), the Rel/NF-kappaB
transcription factors website of TD Gilmore, and additional search with PubMed available at
http://www.bu.edu/nf-kb/gene-resources/target-genes/.
WWW.NATURE.COM/NATURE | 11
SUPPLEMENTARY INFORMATIONRESEARCHdoi:10.1038/nature13109
Page 12
SUPPLEMENTARY RESULTS
C11orf95 & Protein Sequence Analysis
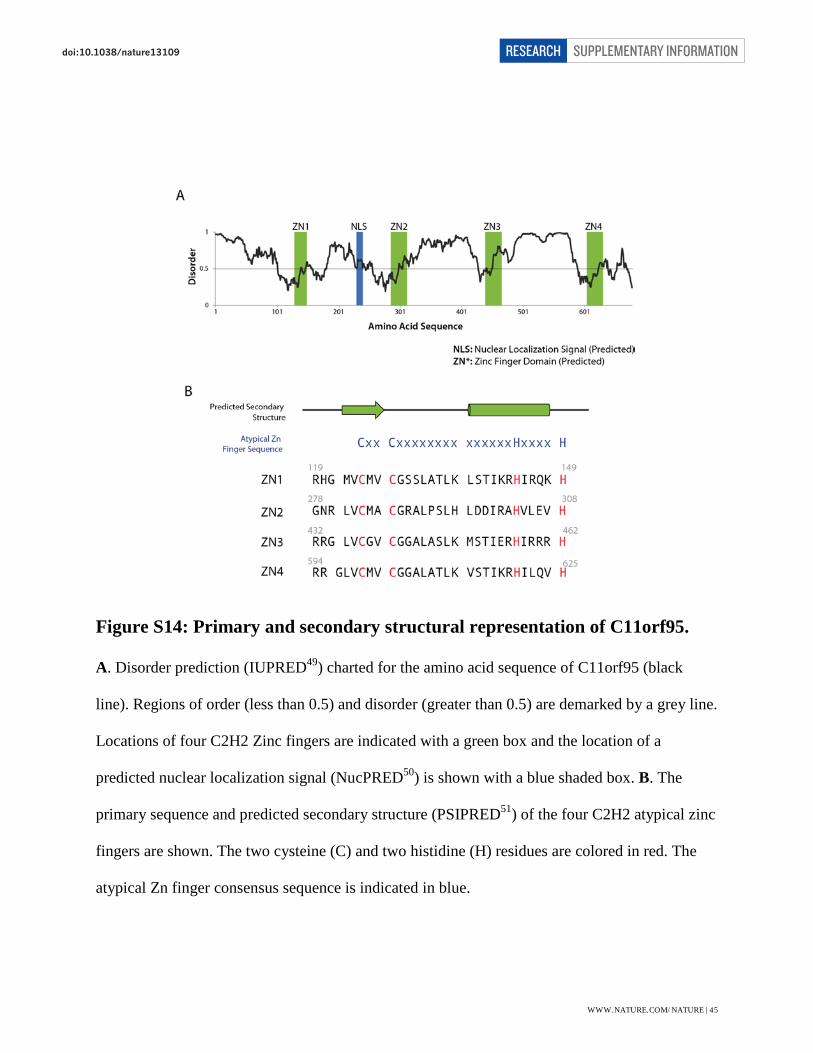
The C11orf95 gene translates a 678 amino acid protein with four predicted C2H2 Zinc-binding
motifs (Zn), each separated by a disordered linker of ~130 amino acids (Extended Data Fig. 3a;
Fig. S14). In addition, a predicted nuclear localization signal is present between Zn 1 and Zn 2.
C11orf95 is a gene of unknown function; however, it has previously been reported to be the 5’
partner in a fusion gene detected in chondroid lipomas37. In this disease, C11orf95 is recurrently
fused to MLK2 on chromosome 19, but whether this fusion is created through chromothripsis is
unknown. The fusion product contains exons 1-5 of C11orf95 and exons 9-13 of MLK2. This
preserves the four Zn fingers predicted to be contained within C11orf95.
Analysis of the four Zn fingers reveals an atypical C2H2 Zn-finger pattern where Zn 1-4 differ
from the typical consensus Zn finger pattern by having two additional amino acids between the
Cys and His motifs (14 instead of 12 in a typical motif) and lacking the ususal aromatic residues
around the Cys motif38. The canonical Zn motif was built from a consensus of Zn peptides that
bind DNA and would be a better predictor of a nucleic acid binding function39.
Genomic Aberrations
Singleton and low frequency mutations
Recurrent alterations of the same gene or pathway are often observed in pediatric malignancies,
even though the overall mutation burden in these tumours is lower than in adult tumours (Ref.
WWW.NATURE.COM/NATURE | 12
SUPPLEMENTARY INFORMATIONRESEARCHdoi:10.1038/nature13109
Page 13
27, main manuscript). However, we did not observe recurrent sequence mutations in
ependymomas. Across our dataset, no more than two tumours harbored a mutation in the same
gene. Cerebral ependymomas had a median of 10 tier 1 SNVs, with a median of 3 missense
mutations per sample, while mutation numbers were lower still in posterior fossa tumours with a
median of 5 tier 1 SNVs total and a median of 2 missense mutations per sample.
Out of a total of 41 samples submitted for WGS, we detected 277 coding mutations. Four
tumours were outliers with >20 coding mutations (Extended Data Fig. 2a). In spite of this low
level of recurrence, several potentially oncogenic mutations were detected and validated,
including 10 coding mutations in genes listed in the cancer gene consensus. Two missense
mutations were found in PIK3CA (Fig. S5). One of these tumours also inactivated both alleles of
TP53 (indel and missense mutations), and the region also showed loss of heterozygosity (Fig.
S5). Altogether, 51 nonsense mutations were detected and validated, including ASXL1, which is
implicated in myeloid leukemogenesis40. An FGFR1 missense mutation (N544K) was also
discovered. This SNV also occurs in low-grade glioma41. Twelve in-frame protein deletions or
insertions were also detected in nine samples, including a deletion of 3 amino acids in SMC1A,
which regulates chromosomal segregation42, and a 2 amino acid deletion in AFF3, which has
previously been implicated in acute lymphoblastic leukemia43.
Copy number variations
In addition to chromothripsis-associated CNVs on chromosome 11, we also observed CNVs of
other chromosomes including chromosome X. CNVs associated with C11orf95-RELA fusion
events were generally focal loss. Focal CDKN2A deletions, which we have previously reported
WWW.NATURE.COM/NATURE | 13
SUPPLEMENTARY INFORMATIONRESEARCHdoi:10.1038/nature13109
Page 14
in cerebral ependymomas, were detected in 3 cases (Fig. S6; Ref. 6 main manuscript). In
addition, we found single deletions of BCOR and TUSC1 (Fig. S7). Posterior fossa
ependymomas had an average number of three CNVs, with many tumours containing no
detectable CNVs by WGS (Table S10). Consistent with previous reports, about 20% of posterior
fossa tumours show gain of chromosome 1q (Fig. S3).
Structural variations
A combination of WGS and RNA sequencing data gave us the opportunity to study SVs and
resulting fusion transcripts. Using CREST, and our CNV calling tool, CONSERTING (see
Supplementary Methods), we detected recurrent, focal chromothripsis of chromosome 11 in
cerebral tumours. To our knowledge this is the first report of high frequency, focal
chromothripsis in a specific subtype of cancer. It is interesting to note that chromosome 11q13
was identified as a site of cytogenetic abnormality in cerebral ependymomas more than 25 years
ago44,45.
Combined analysis of WGS and RNA sequence data revealed that SVs at 11q13 result in read-
through from C11orf95 into an intragenic region and then into RELA. This large out of frame
transcript is spliced to remove the intragenic region, and in most cases exon 1 of RELA, creating
the final in-frame oncogenic fusion transcript. In some cases, the SV is more complex involving
inversions, UTRs and intronic sequence. Details on each case with a fusion can be found below
and in Extended Data Fig. 4. Using the CICERO algorithm we were able to detect additional
non-RELA and non-C11orf95 fusion events (Table S16c).
WWW.NATURE.COM/NATURE | 14
SUPPLEMENTARY INFORMATIONRESEARCHdoi:10.1038/nature13109
Page 15
Chromothripsis
The results of statistical tests of chromothripsis characteristics on chromosome 11q13.1 are
summarized in Table S12, and show clustering of breakpoints as well as randomness of DNA
fragment joins in all tumors, meeting the criteria for chromothripsis.
To provide further support for chromothripsis, we selected three tumors to evaluate the
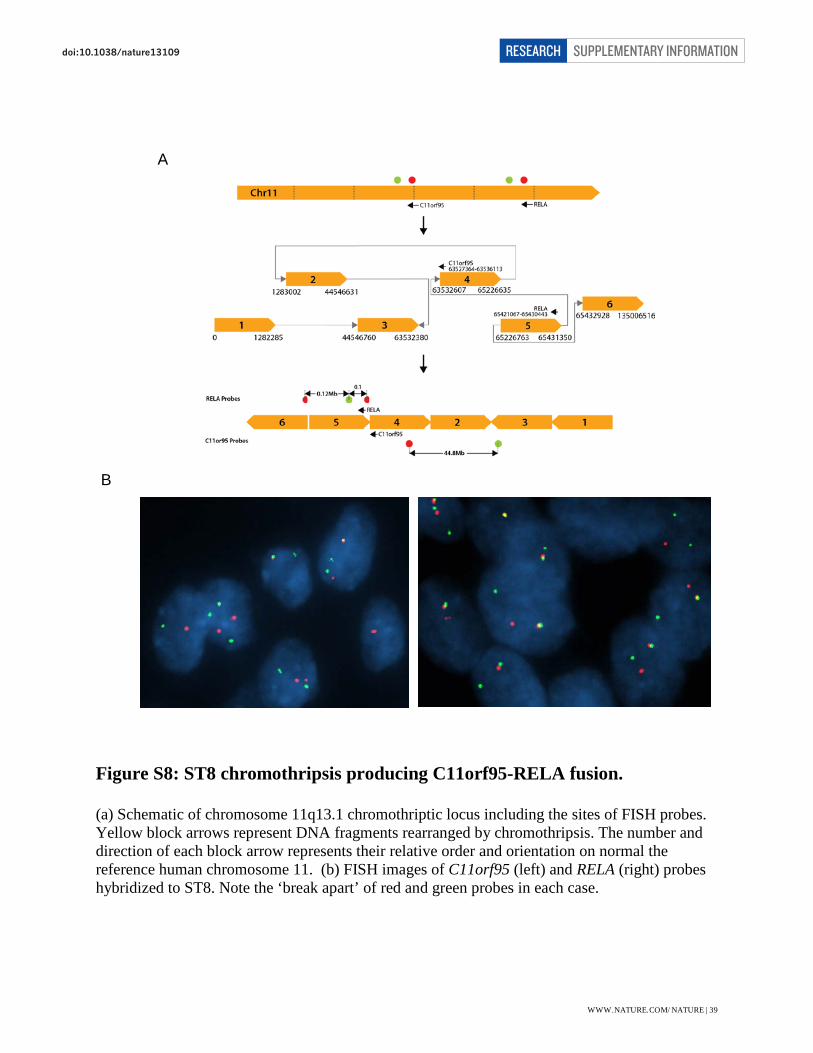
possibility of constructing derivative chromosomes. The first case (ST8) has 5 SVs on
chromosome 11 and we were able to construct a single, inter-connected derivative chromosome
comprised of 6 segments with the four internal segments reshuffled and re-oriented from their
original genomic locations (Fig. S8). For the second case (ST6), we were able to construct a 17-
segment derivative chromosome using the SV breakpoints on chromosome 11 (main text Fig.
1d). The order and orientation of segments on the derivative chromosome were completely
reshuffled compared with their original genomic locations. The third case (ST5) has a total of 7
SVs with breakpoints on chromosomes 6, 8 and 11. We were able to construct three derivative
chromosomes depicted in Fig. S9. Two small deletions identified in this tumor by CNV analysis
match exactly to the lost segments predicted by the construction of the derivative chromosomes,
indicating that all 7 SVs arose from a single complex re-arrangement event.
Details of all fusion cases
All fusions were identified by WGS and/or RNASeq and validated by RNASeq, rtPCR or FISH;
most often a combination of two or all of these techniques. All tumour numbers are those
referred to in Fig. 1a and Table S1. The genomic breakpoints in RELA and C11orf95 in all
supratentorial tumors analyzed by WGS are shown in Fig. S10. Maps illustrating the various
WWW.NATURE.COM/NATURE | 15
SUPPLEMENTARY INFORMATIONRESEARCHdoi:10.1038/nature13109
Page 16
sorts of arrangements identified are shown immediately beneath the descriptions of exemplary
cases.
TUMOUR ST1: contains a C11orf95-RELA Type 1 fusion transcript. Genomic breakpoints lie
within genes, exon 3 of C11orf95 and intron 1 of RELA. RNASeq confirms that exon 3 of
C11orf95 is omitted from the final product, with evidence for a transcript that contains the fusion
of C11orf95 and RELA exon 2.
TUMOUR ST2: We validated a genomic event involving exon 4 of C11orf95 and intron 1 of
RELA, and this Type 6 product is highly expressed. However, using RNASeq we discovered
additional events that support the splicing of exon 2 of C11orf95 to exon 2 of RELA to create an
in-frame Type 1 transcript. Reads present in RNASeq also support the splicing of exon 3 of
C11orf95 to exon 2 of RELA producing a Type 2 transcript.
WWW.NATURE.COM/NATURE | 16
SUPPLEMENTARY INFORMATIONRESEARCHdoi:10.1038/nature13109
Page 17
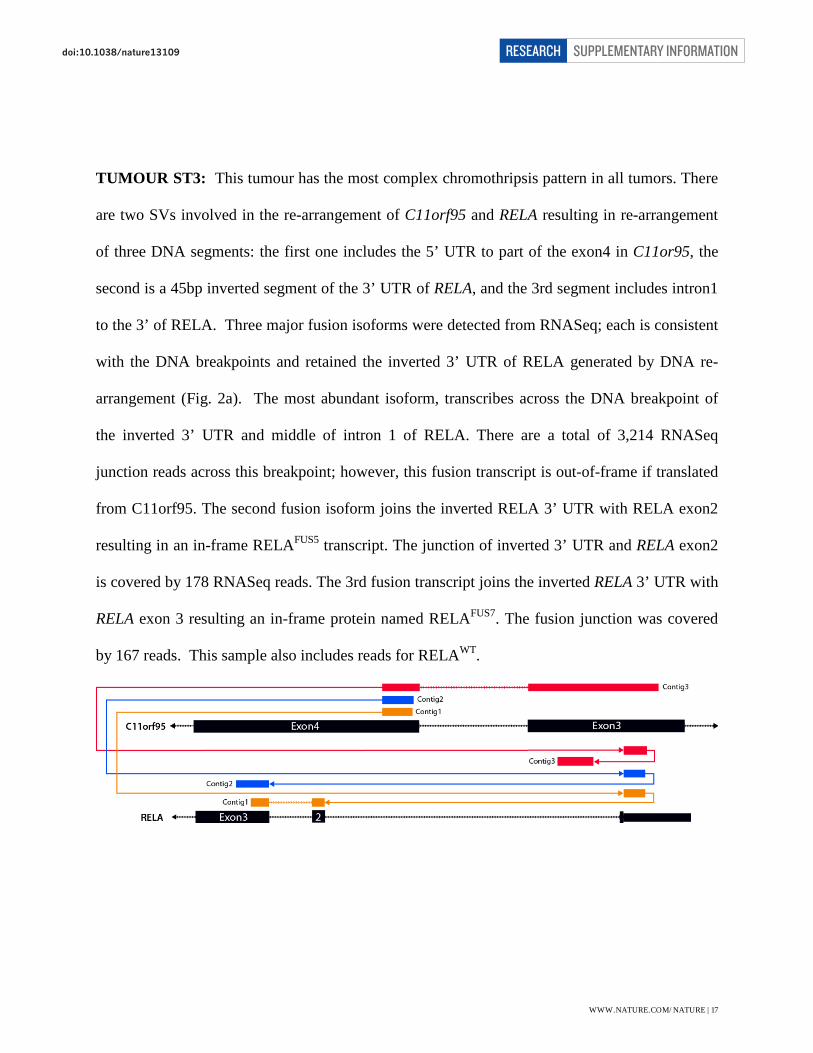
TUMOUR ST3: This tumour has the most complex chromothripsis pattern in all tumors. There
are two SVs involved in the re-arrangement of C11orf95 and RELA resulting in re-arrangement
of three DNA segments: the first one includes the 5’ UTR to part of the exon4 in C11or95, the
second is a 45bp inverted segment of the 3’ UTR of RELA, and the 3rd segment includes intron1
to the 3’ of RELA. Three major fusion isoforms were detected from RNASeq; each is consistent
with the DNA breakpoints and retained the inverted 3’ UTR of RELA generated by DNA re-
arrangement (Fig. 2a). The most abundant isoform, transcribes across the DNA breakpoint of
the inverted 3’ UTR and middle of intron 1 of RELA. There are a total of 3,214 RNASeq
junction reads across this breakpoint; however, this fusion transcript is out-of-frame if translated
from C11orf95. The second fusion isoform joins the inverted RELA 3’ UTR with RELA exon2
resulting in an in-frame RELAFUS5 transcript. The junction of inverted 3’ UTR and RELA exon2
is covered by 178 RNASeq reads. The 3rd fusion transcript joins the inverted RELA 3’ UTR with
RELA exon 3 resulting an in-frame protein named RELAFUS7. The fusion junction was covered
by 167 reads. This sample also includes reads for RELAWT.
WWW.NATURE.COM/NATURE | 17
SUPPLEMENTARY INFORMATIONRESEARCHdoi:10.1038/nature13109
Page 18
TUMOUR ST4: Two breakpoints in this example of a C11orf95-RELA fusion create an in-
frame transcript. However, the SV at the DNA level occurs at the end of exon 3 of C11orf95,
which is translocated to an intragenic region of chromosome 11 upstream of RELA. Using
RNASeq, we were able to determine the hybrid transcripts created by this event, the data
indicating that the intragenic region is expressed and that there are two major products. Soft
clipped reads from RNASeq show both C11orf95 and exon 2 RELA sequence providing strong
evidence that the intragenic region and exon 1 of RELA are spliced out of the final product. Two
species of C11orf95 sequence are present in these soft-clipped reads, sequence from the end of
exon 2 or sequence from the end of exon 3. This tumour, therefore, is thought to harbor both
Type 1 and Type 2 C11orf95-RELA fusions.
TUMOUR ST5: contains a Type 1 fusion transcript. The splicing event fuses exon 2 of
C11orf95 to exon 2 of RELA creating an in-frame fusion transcript.
TUMOUR ST6: This case is similar to tumour ST4, producing both a Type 1 and Type 2 fusion
transcript, with the RELA side of the breakpoint lying slightly upstream of the 5’ end of the gene
WWW.NATURE.COM/NATURE | 18
SUPPLEMENTARY INFORMATIONRESEARCHdoi:10.1038/nature13109
Page 19
and the other breakpoint lying in intron 3 of C11orf95. RNASeq contains reads which support
the fusion of exons 2 and 3 of C11orf95 to exon 2 of RELA.
TUMOUR ST7: Tumour 7 contains only a Type 1 C11orf95-RELA fusion product. Breakpoints
in this case lie in intron 2 of C11orf95 and in the intragenic region upstream of RELA. Again
evidence from RNASeq supports the production of an in-frame fusion transcript with splicing of
C11orf95 exon 2 to exon 2 of RELA.
TUMOUR ST8: Breakpoints in this case lie in exon 3 of C11orf95 and upstream of RELA.
RNASeq was not available for this tumour, but the fusion product was confirmed by RT-PCR as
a Type 1 C11orf95-RELA fusion between exon 2 of C11orf95 and exon 2 of RELA.
No WGS data are available for the following tumours. All fusions are based on RNASeq data
supported by RT-PCR validation.
TUMOUR ST9: RNASeq contains soft-clipped reads from the end of exon 3 of C11orf95 to
exon 2 of RELA, a Type 2 fusion transcript. RT-PCR confirmed the presence of the Type 2
fusion event and was also able to detect a Type 1 transcript, in which exon 3 of C11orf95 was
WWW.NATURE.COM/NATURE | 19
SUPPLEMENTARY INFORMATIONRESEARCHdoi:10.1038/nature13109
Page 20
excluded from the fusion product.
TUMOUR ST11: Reads detected by RNASeq indicate genomic breakpoints in intron 2 of
C11orf95 and the 5’ UTR of RELA, and further soft-clipped reads are present to support
subsequent splicing of exon 2 of C11orf95 to exon 2 of RELA, creating an in-frame Type 1
fusion transcript. This interpretation was confirmed by RT-PCR.
TUMOUR ST12: Reads supporting two splicing events are present in RNASeq for this tumour
and span the end of exon 2 of C11orf95 into exon 2 of RELA, providing evidence for a Type 1
C11orf95-RELA fusion. RT-PCR confirmed the presence of a Type 1 fusion, but was also able
to detect a Type 2 fusion. On further analysis of the RNASeq data, we were able to find reads
supporting an event that occurs between intron 3 and ~7bp upstream of RELA. This transcript
could, through splicing, give rise to the Type 2 product identified by RT-PCR.
TUMOUR ST13: Reads are present to support the genomic event that causes fusion of exon 3 of
C11orf95 to intron 1 of RELA. Exon 3 of C11orf95 and intronic RELA sequences are not,
however, present in what we believe to be the major product of this fusion. Further soft-clipped
reads provide evidence that exon 2 of C11orf95 is spliced to exon 2 of RELA, resulting in an RT-
PCR validated Type 1 fusion transcript.
TUMOUR ST14: Reads from RNASeq contain both the end of C11orf95 exon 3 and the start of
RELA exon 2, which support the existence of a Type 2 fusion transcript, and this was validated
by RT-PCR.
WWW.NATURE.COM/NATURE | 20
SUPPLEMENTARY INFORMATIONRESEARCHdoi:10.1038/nature13109
Page 21
TUMOUR ST15: RNASeq reads support a Type 4 fusion, where exon 2 of C11orf95 is spliced
to exon 3 of RELA.
TUMOUR 10_D & 10_R: In this case, a single species of RNASeq soft-clipped reads support a
C11orf95-RELA fusion. These reads map to the end of C11orf95 exon 3 and the start of exon 3
of RELA, which we have designated as a Type 3 fusion transcript.
TUMOUR ST16: C11orf95 creates an in frame fusion protein with the gene product of YAP1.
Genomically, this event is straightforward, with breakpoints in the coding region of exon 5 of
C11orf95 and the coding region of exon 1 of YAP1. RNASeq confirms that an in-frame
transcript is produced from this event.
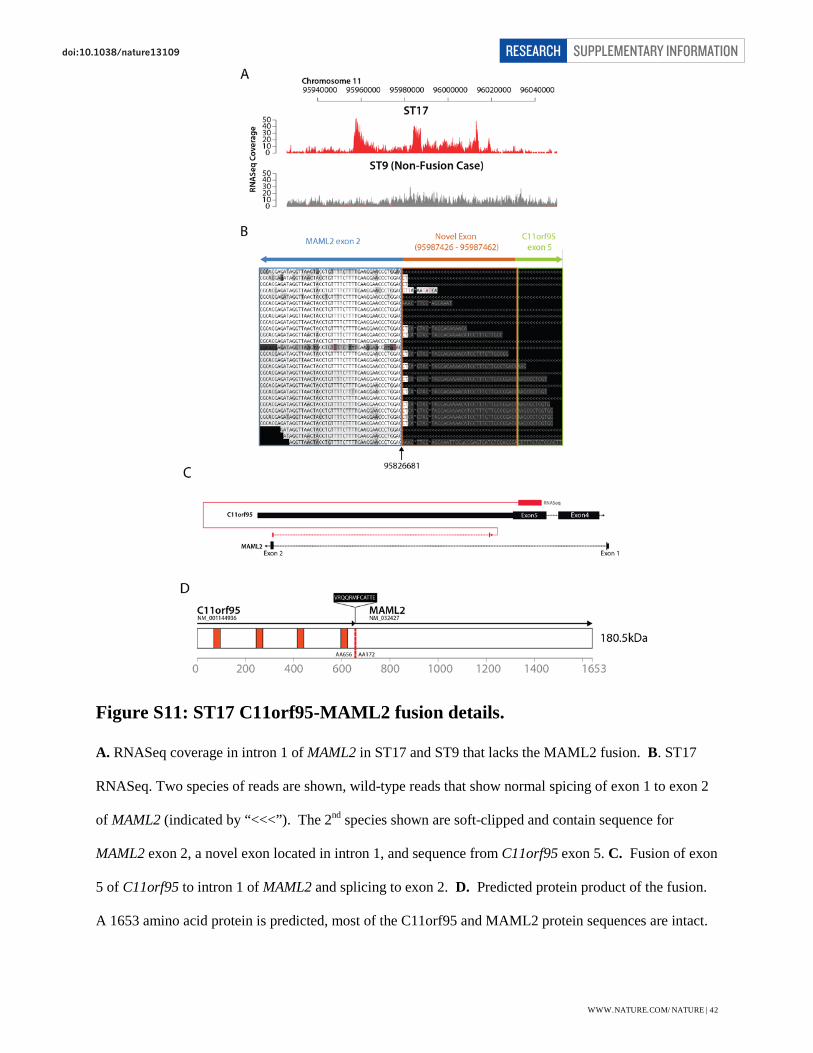
TUMOUR ST17: This tumour harbors a translocation of C11orf95 to MAML2. The breakpoint
lies in exon 5 of C11orf95 and intron 1 of MAML2. The rearrangement creates a novel 34bp
exon in intron 1 of MAML2, which forms an additional splice site resulting in the joining of this
novel exon and C11orf95 to exon 2 of MAML2 (Fig. S11). The resulting protein contains 656
amino acids of C11orf95, 12 amino acids that are the product of the new exon, and 1653 amino
acids of MAML2. This translates to an AA breakpoint at residue 172 MAML2, similar to that in a
report of a MLL-MAML2 fusion in secondary acute myelogenous leukemia46.
Ingenuity Pathway Analysis (IPA).
No significantly activated transcription regulator was found in the C11orf95-transduced NSCs;
WWW.NATURE.COM/NATURE | 21
SUPPLEMENTARY INFORMATIONRESEARCHdoi:10.1038/nature13109
Page 22
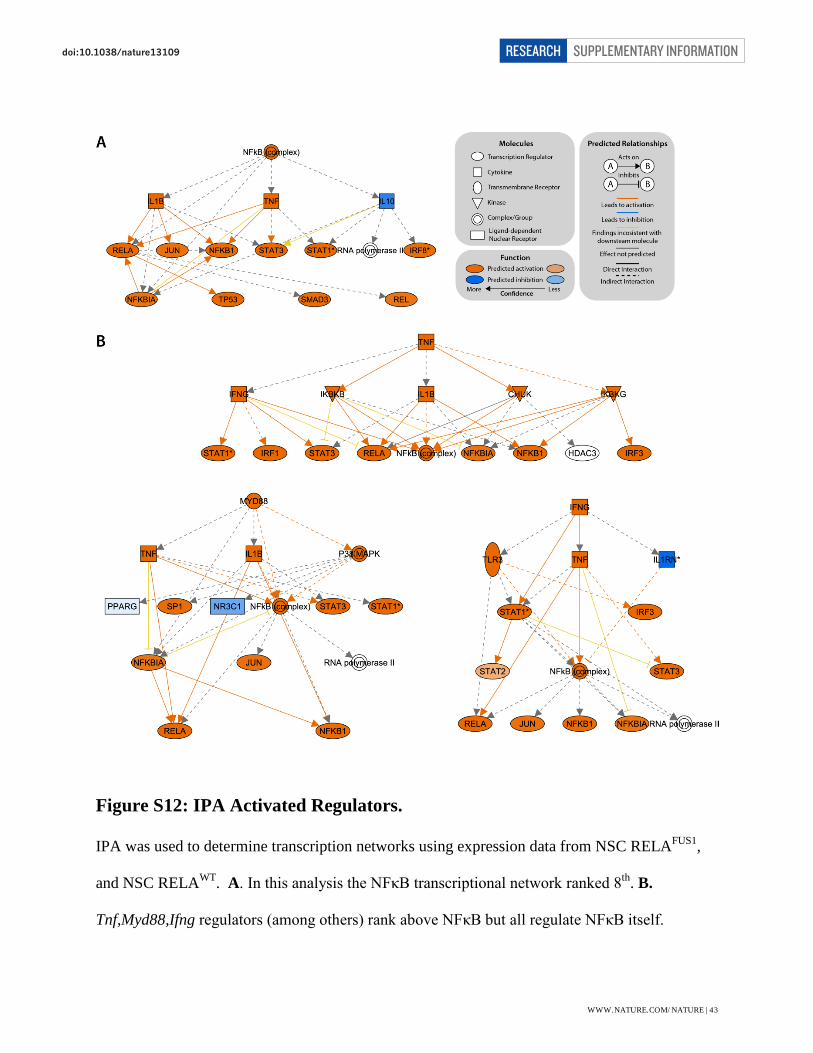
however, the NF-κB complex was ranked 12th, 7th and 9th most significantly activated regulator
in mouse RELAFUS1 NSC, mouse RELAWT NSCs, and RELAFUS1 tumour respectively (Table
S17a). Furthermore, the regulators ranked above the NF-κB complex in these datasets are all
upstream activators of NF-κB itself. For example, the NF-κB complex was predicted to be
significantly activated in RELAFUS1 tumours (z-score = 5.846, P = 1.57e-17) with 50
differentially expressed genes from the input gene list demonstrating directional evidence in IPA
as NF-κB target genes. Of these 50 targets, 49 genes are expected to be up-regulated, according
to the literature, while one gene is expected to be down-regulated. Expression data show 46
genes in our expression data match the directional changes expected from the literature (Fig.
S12-S13). The 8 regulators ranked above NF-κB, i.e., Ifng, Tnf, Myd88, Ikbkb, Tgm2, Ticam1,
Tlr4 and Tlr3, are upstream activators of NFκB itself.
Telomere Analysis
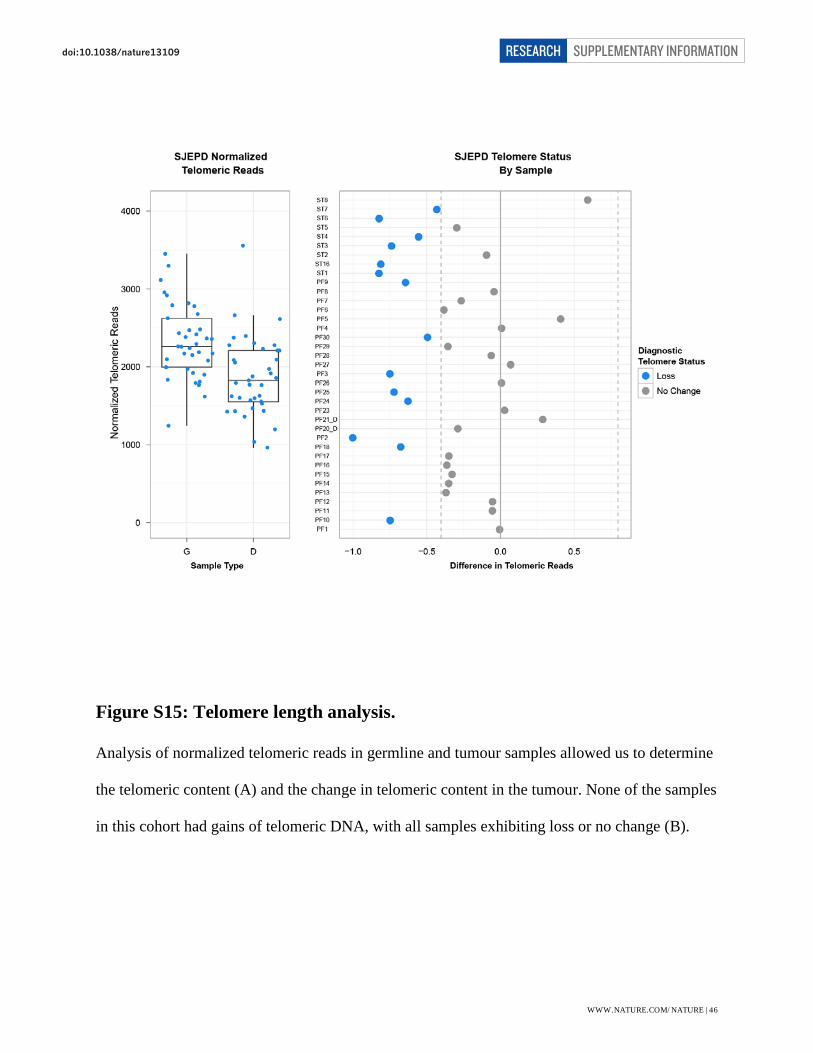
Change in telomeric DNA size was measured in tumour samples compared to matched normal
blood, as described previously47. All tumours had either a loss of telomeric DNA (n=14) or no
change (n=23) indicating that alternative lengthening of telomeres is not a method of telomere
maintenance / dysfunction in this tumour type (Fig. S15).
WWW.NATURE.COM/NATURE | 22
SUPPLEMENTARY INFORMATIONRESEARCHdoi:10.1038/nature13109
Page 23
SUPPLEMENTARY FIGURES
WWW.NATURE.COM/NATURE | 23
SUPPLEMENTARY INFORMATIONRESEARCHdoi:10.1038/nature13109
Page 24
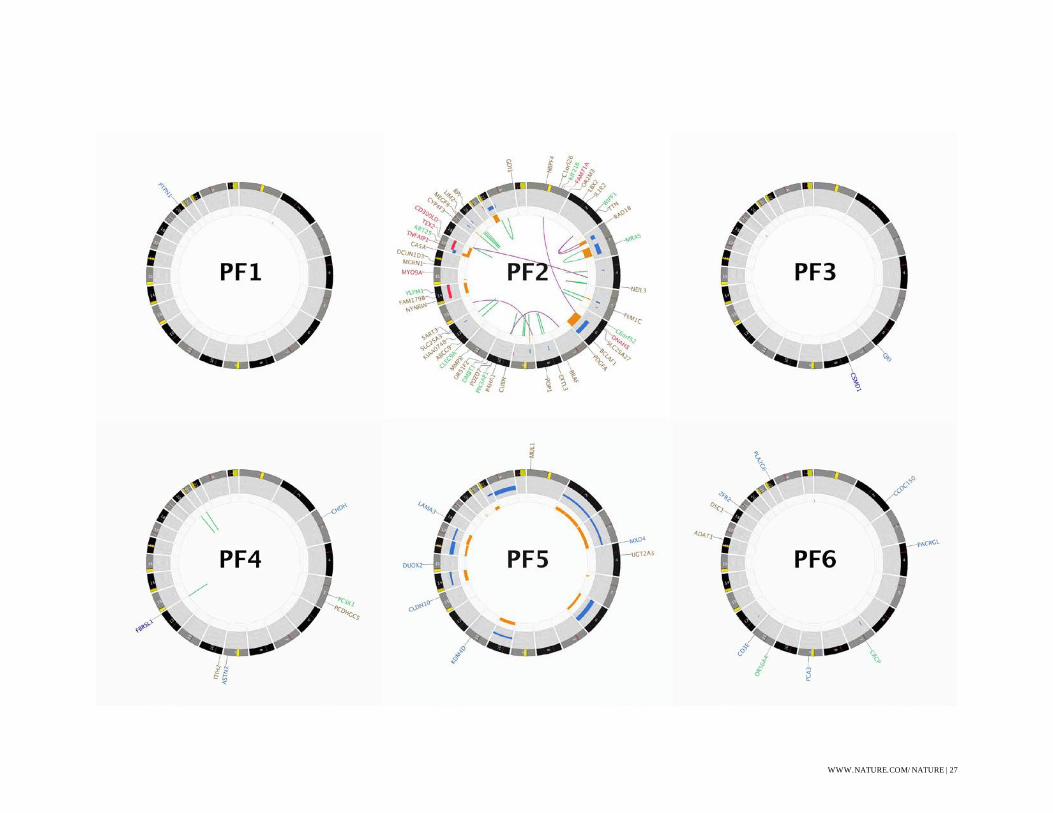
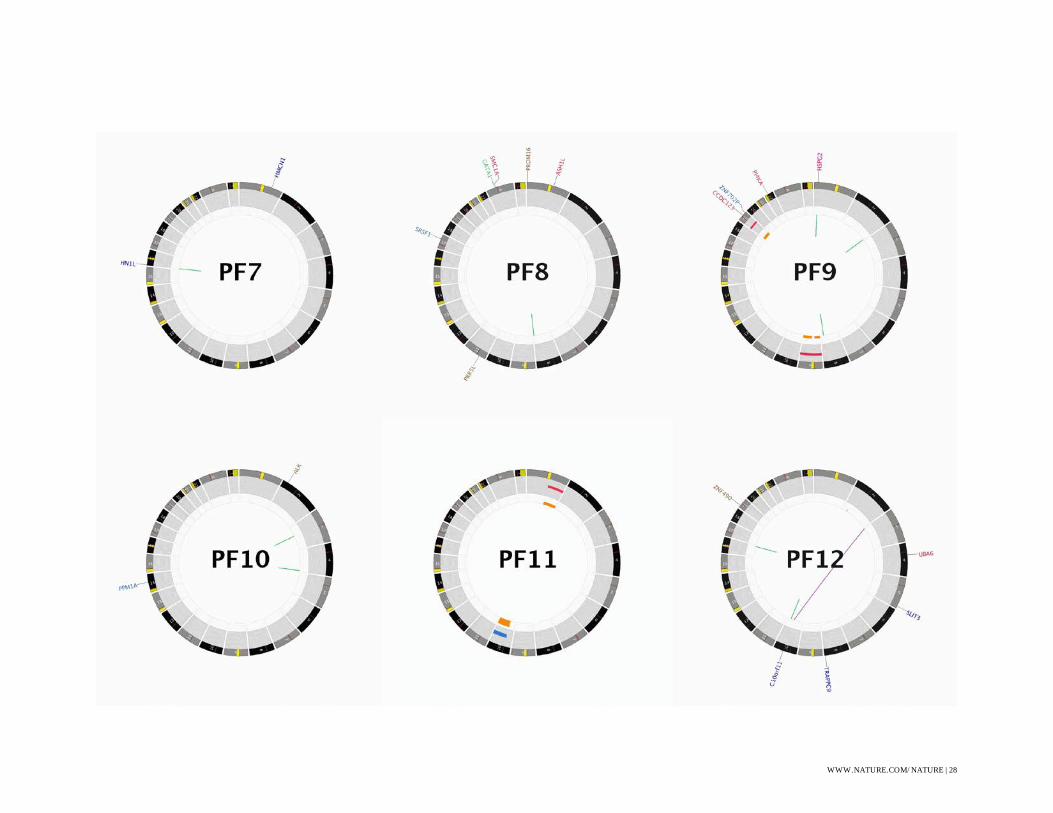
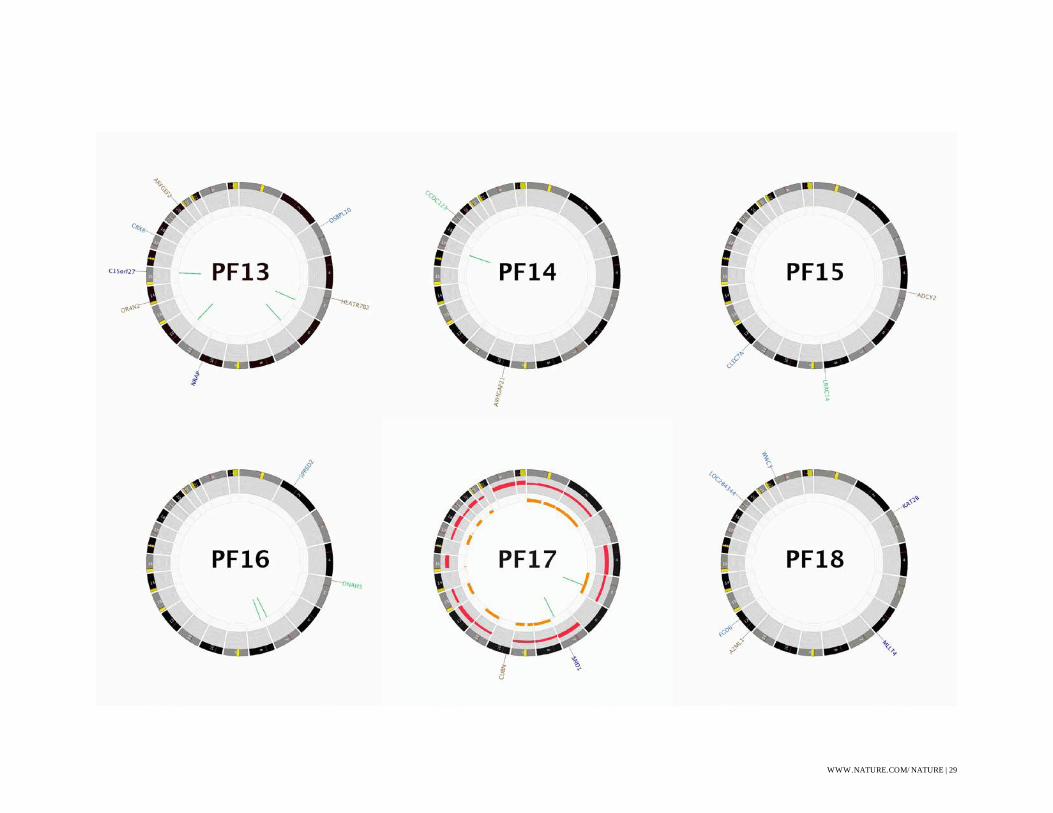
Figure S1: CIRCOS Plots
CIRCOS48 plots for all WGS sequenced ependymoma. Some labels have been removed in order
to produce plots without text overlap, these omissions are indicated with a (*).
WWW.NATURE.COM/NATURE | 24
SUPPLEMENTARY INFORMATIONRESEARCHdoi:10.1038/nature13109
Page 25
WWW.NATURE.COM/NATURE | 25
Page 26
WWW.NATURE.COM/NATURE | 26
Page 27
WWW.NATURE.COM/NATURE | 27
Page 28
WWW.NATURE.COM/NATURE | 28
Page 29
WWW.NATURE.COM/NATURE | 29
Page 30
WWW.NATURE.COM/NATURE | 30
Page 31
WWW.NATURE.COM/NATURE | 31
Page 32
WWW.NATURE.COM/NATURE | 32
Page 33
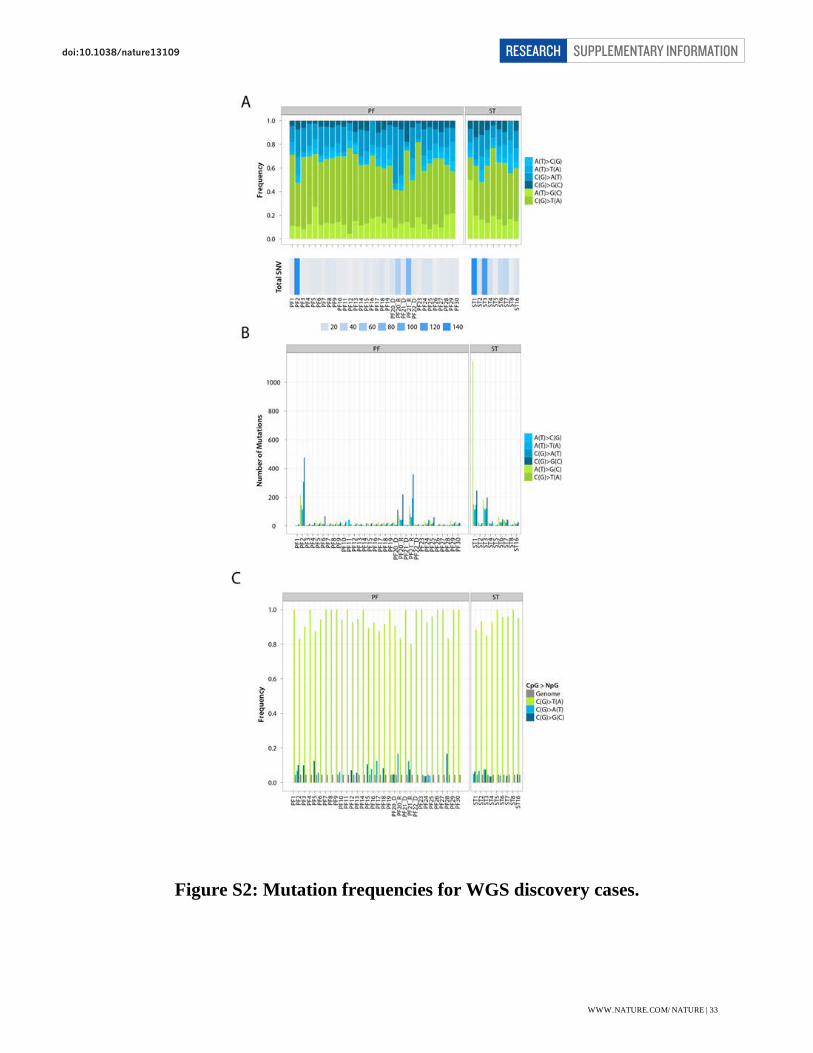
Figure S2: Mutation frequencies for WGS discovery cases.
WWW.NATURE.COM/NATURE | 33
SUPPLEMENTARY INFORMATIONRESEARCHdoi:10.1038/nature13109
Page 34
Figure S3: Copy Number of WGS Cases (CONSERTING)
CNVs found in WGS data using CONSERTING (manuscript in preparation). CNVs were
manually curated, using structural variation information and manual review of coverage.
WWW.NATURE.COM/NATURE | 34
SUPPLEMENTARY INFORMATIONRESEARCHdoi:10.1038/nature13109
Page 35
Figure S4: Copy number variations of discovery series tumours (SNP Array)
All discovery cases underwent SNPArray for quality control and for CNV discovery.
WWW.NATURE.COM/NATURE | 35
SUPPLEMENTARY INFORMATIONRESEARCHdoi:10.1038/nature13109
Page 36
Figure S5: SNVs in ependymomas.
(Top) ST3 and PF30 contain missense mutations affecting PIK3CA. (bottom) ST3 contains two
validated TP53 mutations, a missense R342P and a frameshift indel F341fs. These are present on
alternate alleles and result in a double hit to TP53.
WWW.NATURE.COM/NATURE | 36
SUPPLEMENTARY INFORMATIONRESEARCHdoi:10.1038/nature13109
Page 37
Figure S6: Focal deletion of CDKN2A.
Recurrent deletions of CDKN2A are found by WGS in ependymoma. Histograms show the
WGS coverage over the CDKN2A locus, red is the tumour and grey is the matched normal
sample. A. ST1 and ST7 have broad deletions of the CDKN2A locus with several other genes
involved in the deletion. B. ST3 has a very focal deletion of CDKN2A and CDKN2B only.
WWW.NATURE.COM/NATURE | 37
SUPPLEMENTARY INFORMATIONRESEARCHdoi:10.1038/nature13109
Page 38
Figure S7: Focal deletions of TUSC1 and BCOR.
(Top) PF2 harbors a focal deletion of TUSC1, which is upstream of CDKN2A and CDKN2B.
(Bottom) ST1 contains a focal deletion of the entire ORF of BCOR.
WWW.NATURE.COM/NATURE | 38
SUPPLEMENTARY INFORMATIONRESEARCHdoi:10.1038/nature13109
Page 39
Figure S8: ST8 chromothripsis producing C11orf95-RELA fusion.
(a) Schematic of chromosome 11q13.1 chromothriptic locus including the sites of FISH probes. Yellow block arrows represent DNA fragments rearranged by chromothripsis. The number and direction of each block arrow represents their relative order and orientation on normal the reference human chromosome 11. (b) FISH images of C11orf95 (left) and RELA (right) probes hybridized to ST8. Note the ‘break apart’ of red and green probes in each case.
A
B
WWW.NATURE.COM/NATURE | 39
SUPPLEMENTARY INFORMATIONRESEARCHdoi:10.1038/nature13109
Page 40
Figure S9: ST5 chromothripsis producing C11orf95-RELA fusion.
(a) Schematic of chromosome 11q13.1 chromothriptic locus and breakpoints on chromosomes 6 and 8. Yellow block arrows as in Fig. S8. (b) Deletion detected by WGS matches that of the derivative chromosome. (c) FISH images of C11orf95 (left) and RELA (right) probes hybridized to ST5. Note the ‘break apart’ of red and green probes in each case.
WWW.NATURE.COM/NATURE | 40
SUPPLEMENTARY INFORMATIONRESEARCHdoi:10.1038/nature13109
Page 41
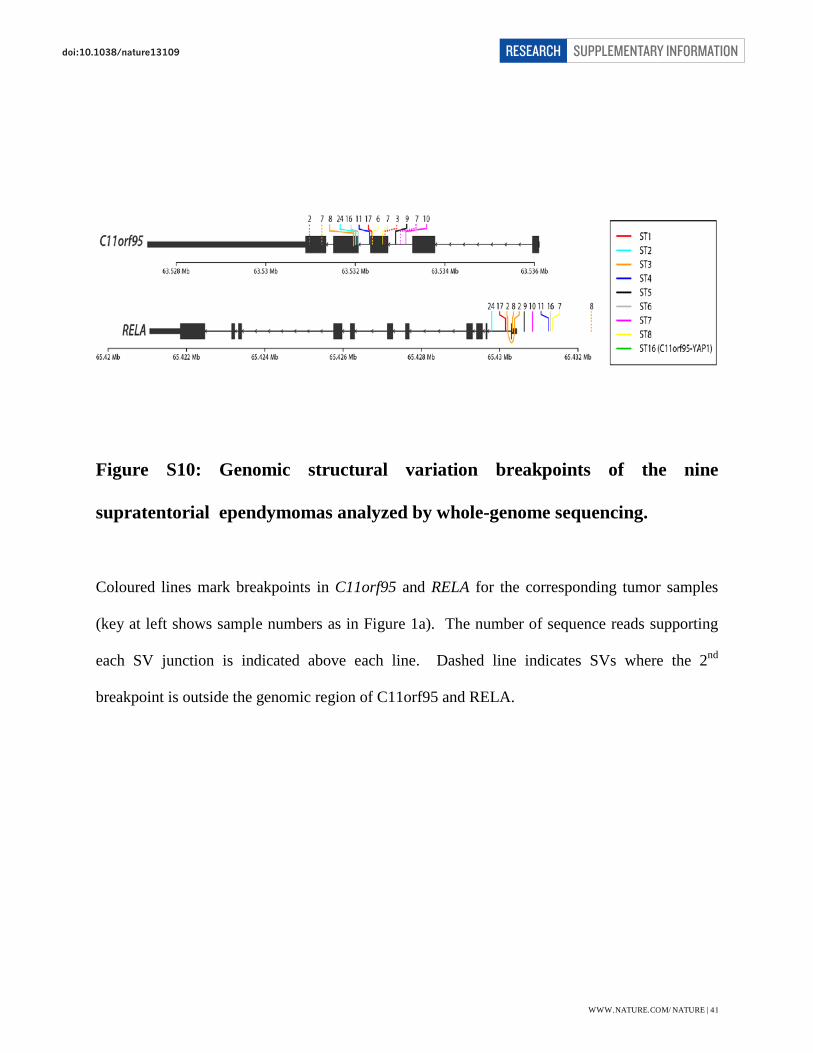
Figure S10: Genomic structural variation breakpoints of the nine
supratentorial ependymomas analyzed by whole-genome sequencing.
Coloured lines mark breakpoints in C11orf95 and RELA for the corresponding tumor samples
(key at left shows sample numbers as in Figure 1a). The number of sequence reads supporting
each SV junction is indicated above each line. Dashed line indicates SVs where the 2nd
breakpoint is outside the genomic region of C11orf95 and RELA.
WWW.NATURE.COM/NATURE | 41
SUPPLEMENTARY INFORMATIONRESEARCHdoi:10.1038/nature13109
Page 42
Figure S11: ST17 C11orf95-MAML2 fusion details.
A. RNASeq coverage in intron 1 of MAML2 in ST17 and ST9 that lacks the MAML2 fusion. B. ST17
RNASeq. Two species of reads are shown, wild-type reads that show normal spicing of exon 1 to exon 2
of MAML2 (indicated by “<<<”). The 2nd species shown are soft-clipped and contain sequence for
MAML2 exon 2, a novel exon located in intron 1, and sequence from C11orf95 exon 5. C. Fusion of exon
5 of C11orf95 to intron 1 of MAML2 and splicing to exon 2. D. Predicted protein product of the fusion.
A 1653 amino acid protein is predicted, most of the C11orf95 and MAML2 protein sequences are intact.
WWW.NATURE.COM/NATURE | 42
SUPPLEMENTARY INFORMATIONRESEARCHdoi:10.1038/nature13109
Page 43
Figure S12: IPA Activated Regulators.
IPA was used to determine transcription networks using expression data from NSC RELAFUS1,
and NSC RELAWT. A. In this analysis the NFκB transcriptional network ranked 8th. B.
Tnf,Myd88,Ifng regulators (among others) rank above NFκB but all regulate NFκB itself.
WWW.NATURE.COM/NATURE | 43
SUPPLEMENTARY INFORMATIONRESEARCHdoi:10.1038/nature13109
Page 44
Figure S13: IPA Significant Networks.
A. Using mouse tumour data the NFκB complex was predicated to be significantly activated (z-
score = 5.846, P = 1.57e-17), as 50 differentially expressed genes from the input gene list were
known to have directional evidence in the IPA Knowledge base as NFκB target genes. B. Of
these 50 targets, 49 genes are expected to be up-regulated according to the literature, while one
gene is expected to be down-regulated. The expression data show 46 genes in our expression
data match the directional changes expected from the literature.
WWW.NATURE.COM/NATURE | 44
SUPPLEMENTARY INFORMATIONRESEARCHdoi:10.1038/nature13109
Page 45
Figure S14: Primary and secondary structural representation of C11orf95.
A. Disorder prediction (IUPRED49) charted for the amino acid sequence of C11orf95 (black
line). Regions of order (less than 0.5) and disorder (greater than 0.5) are demarked by a grey line.
Locations of four C2H2 Zinc fingers are indicated with a green box and the location of a
predicted nuclear localization signal (NucPRED50) is shown with a blue shaded box. B. The
primary sequence and predicted secondary structure (PSIPRED51) of the four C2H2 atypical zinc
fingers are shown. The two cysteine (C) and two histidine (H) residues are colored in red. The
atypical Zn finger consensus sequence is indicated in blue.
WWW.NATURE.COM/NATURE | 45
SUPPLEMENTARY INFORMATIONRESEARCHdoi:10.1038/nature13109
Page 46
Figure S15: Telomere length analysis.
Analysis of normalized telomeric reads in germline and tumour samples allowed us to determine
the telomeric content (A) and the change in telomeric content in the tumour. None of the samples
in this cohort had gains of telomeric DNA, with all samples exhibiting loss or no change (B).
WWW.NATURE.COM/NATURE | 46
SUPPLEMENTARY INFORMATIONRESEARCHdoi:10.1038/nature13109
Page 47
Supplementary References
28 Forshew, T. et al. Activation of the ERK/MAPK pathway: a signature genetic defect in posterior fossa pilocytic astrocytomas. The Journal of pathology 218, 172-181, doi:10.1002/path.2558 (2009).
29 Ding, L. et al. Genome remodelling in a basal-like breast cancer metastasis and xenograft. Nature 464, 999-1005, doi:nature08989 [pii]
10.1038/nature08989 (2010). 30 Mardis, E. R. et al. Recurring mutations found by sequencing an acute myeloid leukemia
genome. N Engl J Med 361, 1058-1066, doi:NEJMoa0903840 [pii] 10.1056/NEJMoa0903840 (2009). 31 Zhang, J. et al. The genetic basis of early T-cell precursor acute lymphoblastic
leukaemia. Nature 481, 157-163, doi:10.1038/nature10725 (2012). 32 Wang, J. et al. CREST maps somatic structural variation in cancer genomes with base-
pair resolution. Nat Methods 8, 652-654, doi:nmeth.1628 [pii] 10.1038/nmeth.1628 (2011). 33 Robinson, G. et al. Novel mutations target distinct subgroups of medulloblastoma.
Nature 488, 43-48, doi:10.1038/nature11213 (2012). 34 Korbel, Jan O. & Campbell, Peter J. Criteria for Inference of Chromothripsis in Cancer
Genomes. Cell 152, 1226-1236, doi:http://dx.doi.org/10.1016/j.cell.2013.02.023 (2013). 35 Li, H. & Durbin, R. Fast and accurate short read alignment with Burrows-Wheeler
transform. Bioinformatics 25, 1754-1760, doi:10.1093/bioinformatics/btp324 (2009). 36 Ellison, D. W. et al. Definition of disease-risk stratification groups in childhood
medulloblastoma using combined clinical, pathologic, and molecular variables. Journal of clinical oncology : official journal of the American Society of Clinical Oncology 29, 1400-1407, doi:JCO.2010.30.2810 [pii]
10.1200/JCO.2010.30.2810 (2011). 37 Huang, D. et al. C11orf95-MKL2 is the resulting fusion oncogene of t(11;16)(q13;p13)
in chondroid lipoma. Genes, chromosomes & cancer 49, 810-818, doi:10.1002/gcc.20788 (2010).
38 Brayer, K. J. & Segal, D. J. Keep your fingers off my DNA: protein-protein interactions mediated by C2H2 zinc finger domains. Cell biochemistry and biophysics 50, 111-131, doi:10.1007/s12013-008-9008-5 (2008).
39 Wolfe, S. A., Nekludova, L. & Pabo, C. O. DNA recognition by Cys2His2 zinc finger proteins. Annual review of biophysics and biomolecular structure 29, 183-212, doi:10.1146/annurev.biophys.29.1.183 (2000).
40 Abdel-Wahab, O. et al. ASXL1 mutations promote myeloid transformation through loss of PRC2-mediated gene repression. Cancer cell 22, 180-193, doi:10.1016/j.ccr.2012.06.032 (2012).
41 St. Jude Children's Research Hospital-Washington University Pediatric Cancer Genome, P. et al. Whole-genome sequencing identifies genetic alterations in pediatric low-grade gliomas. Nature genetics 45, 602-612, doi:10.1038/ng.2611 (2013).
42 Rocques, P. J. et al. The human SB1.8 gene (DXS423E) encodes a putative chromosome segregation protein conserved in lower eukaryotes and prokaryotes. Human molecular genetics 4, 243-249 (1995).
WWW.NATURE.COM/NATURE | 47
SUPPLEMENTARY INFORMATIONRESEARCHdoi:10.1038/nature13109
Page 48
43 Ma, C. & Staudt, L. M. LAF-4 encodes a lymphoid nuclear protein with transactivation potential that is homologous to AF-4, the gene fused to MLL in t(4;11) leukemias. Blood 87, 734-745 (1996).
44 Sainati, L. et al. Cytogenetic t(11;17)(q13;q21) in a pediatric ependymoma. Is 11q13 a recurring breakpoint in ependymomas? Cancer genetics and cytogenetics 59, 213-216 (1992).
45 Dal Cin, P. & Sandberg, A. A. Cytogenetic findings in a supratentorial ependymoma. Cancer genetics and cytogenetics 30, 289-293 (1988).
46 Nemoto, N. et al. Identification of a novel fusion gene MLL-MAML2 in secondary acute myelogenous leukemia and myelodysplastic syndrome with inv(11)(q21q23). Genes, chromosomes & cancer 46, 813-819, doi:10.1002/gcc.20467 (2007).
47 Parker, M. et al. Assessing telomeric DNA content in pediatric cancers using whole-genome sequencing data. Genome biology 13, R113, doi:10.1186/gb-2012-13-12-r113 (2012).
48 Krzywinski, M. et al. Circos: an information aesthetic for comparative genomics. Genome research 19, 1639-1645, doi:10.1101/gr.092759.109 (2009).
49 Dosztanyi, Z., Csizmok, V., Tompa, P. & Simon, I. IUPred: web server for the prediction of intrinsically unstructured regions of proteins based on estimated energy content. Bioinformatics 21, 3433-3434, doi:10.1093/bioinformatics/bti541 (2005).
50 Brameier, M., Krings, A. & MacCallum, R. M. NucPred--predicting nuclear localization of proteins. Bioinformatics 23, 1159-1160, doi:10.1093/bioinformatics/btm066 (2007).
51 McGuffin, L. J., Bryson, K. & Jones, D. T. The PSIPRED protein structure prediction server. Bioinformatics 16, 404-405 (2000).
WWW.NATURE.COM/NATURE | 48
SUPPLEMENTARY INFORMATIONRESEARCHdoi:10.1038/nature13109


![[sv] Validity date from LAND Marocko 00258 [SV] SECTION … · 2020. 5. 22. · 1 / 35 LAND [SV] SECTION Marocko Fiskeriprodukter [sv] Validity date from 10/08/2007 [sv] Date of publication](https://static.documents.pub/doc/80x56/5fbce723db71870cc10035f6/sv-validity-date-from-land-marocko-00258-sv-section-2020-5-22-1-35-land.jpg)