In the format provided by the authors and unedited.
1
SUPPLEMENTARY INFORMATION Broad-spectrum Non-toxic Antiviral Nanoparticles with a Virucidal Inhibition Mechanism Valeria Cagno1,2,3†, Patrizia Andreozzi4,5†, Marco D’Alicarnasso6, Paulo Jacob Silva2, Marie
Mueller2, Marie Galloux7, Ronan Le Goffic7, Samuel T. Jones2,8, Marta Vallino9, Jan Hodek10, Jan Weber10, Soumyo Sen11 Emma-Rose Janeček2, Ahmet Bekdemir2, Barbara Sanavio12, Chiara Martinelli4, Manuela Donalisio1, Marie-Anne Rameix Welti13,14, Jean-
Francois Eleouet7 Yanxiao Han11, Laurent Kaiser15, Lela Vukovic16, Caroline Tapparel3,15, Petr Král11,17, Silke Krol12, 18, David Lembo1*, Francesco Stellacci2,19*
1Dipartimento di Scienze Cliniche e Biologiche, Univerisita’ degli Studi di Torino, Orbassano, Italy. 2Institute of Materials, Ecole Polytechnique Fédérale de Lausanne (EPFL), Lausanne, Switzerland. 3Faculty of Medicine of Geneva, Department of Microbiology and Molecular medicine, Geneva, Switzerland. 4IFOM - FIRC Institute of Molecular Oncology, IFOM-IEO Campus, Milan, Italy. 5CIC biomaGUNE Soft Matter Nanotechnology Group San Sebastian-Donostia, Spain. 6Fondazione Centro Europeo Nanomedicina (CEN), Milan, Italy. 7VIM, INRA, Université Paris-Saclay, Jouy-en-Josas, France. 8 Jones Lab, School of Materials, University of Manchester, Oxford Road, Manchester, M13 9PL 9Istituto per la Protezione Sostenibile delle Piante, CNR, Torino, Italy. 10Institute of Organic Chemistry and Biochemistry of the Czech Academy of Sciences, Prague, Czech Republic. 11Department of Chemistry, University of Illinois at Chicago, USA. 12Fondazione IRCCS Istituto Neurologico «Carlo Besta», IFOM-IEO Campus, Milan, Italy.
13UMR INSERM U1173 I2, UFR des Sciences de la Santé Simone Veil—UVSQ, Montigny-Le-Bretonneux, France 14AP-HP, Laboratoire de Microbiologie, Hôpital Ambroise Paré, 92104, Boulogne-Billancourt, France 15Geneva University Hospitals, Infectious Diseases Divisions, Geneva, Switzerland. 16Department of Chemistry, University of Texas at El Paso, USA. 17Department of Physics and Department of Biopharmaceutical Sciences, University of Illinois at Chicago, USA. 18IRCCS Istituto Tumori "Giovanni Paolo II", Bari, Italy 19Interfaculty Bioengineering Institute, Ecole Polytechnique Fédérale de Lausanne (EPFL), Lausanne, Switzerland.
Supplementary Figure 1: Characterisation of MUS:OT-NPs (A) TEM images of the MUS:OT gold nanoparticle cores. Scale bar 50 nm. (B) Particle size distribution obtained from TEM analysis: the average core diameter was 2.8±0.6nm.
Supplementary Figure 2: Characterisation of MUS:OT-NPs ligand composition. 1H-NMR (400 MHz, Bruker AVANCE 400) of MUS:OT-NPs etched with Iodine solution in MeOD-d4 reveals 34% OT content, i.e. a 2:1 MUS:OT stoichiometric ratio.
Supplementary Figure 3: Characterisation of MUS-NPs (A) TEM images of the MUS gold nanoparticle cores. Scale bar 50 nm. (B) Particle size distribution obtained from TEM analysis: the average core diameter was 2.5±0.7nm.
Supplementary Figure 4: Characterisation of EG2-OH-NPs A) TEM images of the EG2-OH gold nanoparticle cores. Scale bar 50 nm. B) Particle size distribution obtained from TEM analysis: the average core diameter was 6.2 ± 0.8 nm .
Supplementary Figure 5: Characterisation of MUP-NPs A) TEM images of the MUP gold nanoparticle cores. Scale bar 50 nm. B) Particle size distribution obtained from TEM analysis: indicating a bimodal distribution of particle sizes. One population of NPs is centered at 3.5 nm. Nanoparticles with a diameter less than 0.5 nm were below the threshold of the data analysis used.
Supplementary Figure 6: Characterisation of MES-NPs A) TEM images of the MES nanoparticles. Scale bar 50 nm. B) Histogram of particle size distribution shows particles having mean core diameter around 2.6 nm. Threshold is set to 0.6 nm for particle counts.
Supplementary Figure 7: Characterisation of DOS-NPs TEM images of the DOS iron oxide nanoparticle cores. Scale bar 25 nm
Supplementary Figure 8: MUS is not inhibitory against LV-VSVG. To verify the inhibitory properties of MUS capping molecules, LV-VSV-G virus was incubated with ligand MUS present in the NPs surface. The antiviral assay was conducted incubating LV-VSV-G particles for 1 h at 37°C with the capping molecules (MUS) at two different concentrations (0.1 µg/mL) and (1 µg/mL). As a control MUS:OT-NPs at the IC50 (1µg/mL) concentration were used (red bar). The amount of MUS ligand present onto NPs surface was measured by TGA as 10% of its weight (data not shown).
Supplementary Figure 9: Attachment assays for MUS:OT-NPs and Heparin. MUS:OT-NPs and Heparin were incubated at different concentrations with HSV-2 (MOI 0.005) for 2 hours at 4°C: this condition allows viral binding but not entry to the cells. The inoculum was removed after 2 h, the cells were extensively washed with PBS and then cultured in MEM containing MTC at 37°C. The percentage of infection was calculated comparing the number of plaques in treated and untreated wells. The EC50 was calculated with GraphPad Prism software. These data are the results of 3 independent experiments performed in duplicate.
Supplementary Figure 10: MUS:OT-NPs inhibition of infection as a function of incubation time. MUS:OT-NPs were incubated at different concentrations with HSV-2 (MOI 0.001) for 0 h or 1 h at 37°C
and then added on cells. After 2 h of infection at 37°C the inoculum was removed and the samples were washed with PBS. Finally, MEM containing MTC was added. The percentage of infection were calculated comparing the number of plaques in treated and untreated wells. The EC50 was calculated with GraphPad Prism software. These data are the results of 3 independent experiments performed in duplicate.
Supplementary Figure 11: Virucidal Assays and Interaction with HSV-2 viruses for EG2-OH-NPs. A) Cryo-TEM (up) and negative staining TEM (down) images of HSV-2 virus (105 pfu) treated with EG2-OH-NPs. B) Virucidal assay of HSV-2 virus treated with EG2-OH-NPs. n=3 C) % distribution of not sulfonated EG2-OHNPs associated with HSV-2 after 1.5 h of incubation. The majority of viruses were not associated with any NP. The distribution was calculated analysing between 50 and 100 images. The scale bars indicate 100 nm
Supplementary Figure 12: MUS:OT-NPs associated with HPV-16 PsVs. In the upper panel the images were acquired by cryo-TEM. In the panel below the samples were stained with uranyl acetate 0.5% for 5 min and acquired by TEM. Images a and d represent the HPV-16, while b, c, e and f represent different types of NPs association with HPV-16 PsVs. The scale bars indicate 100nm.
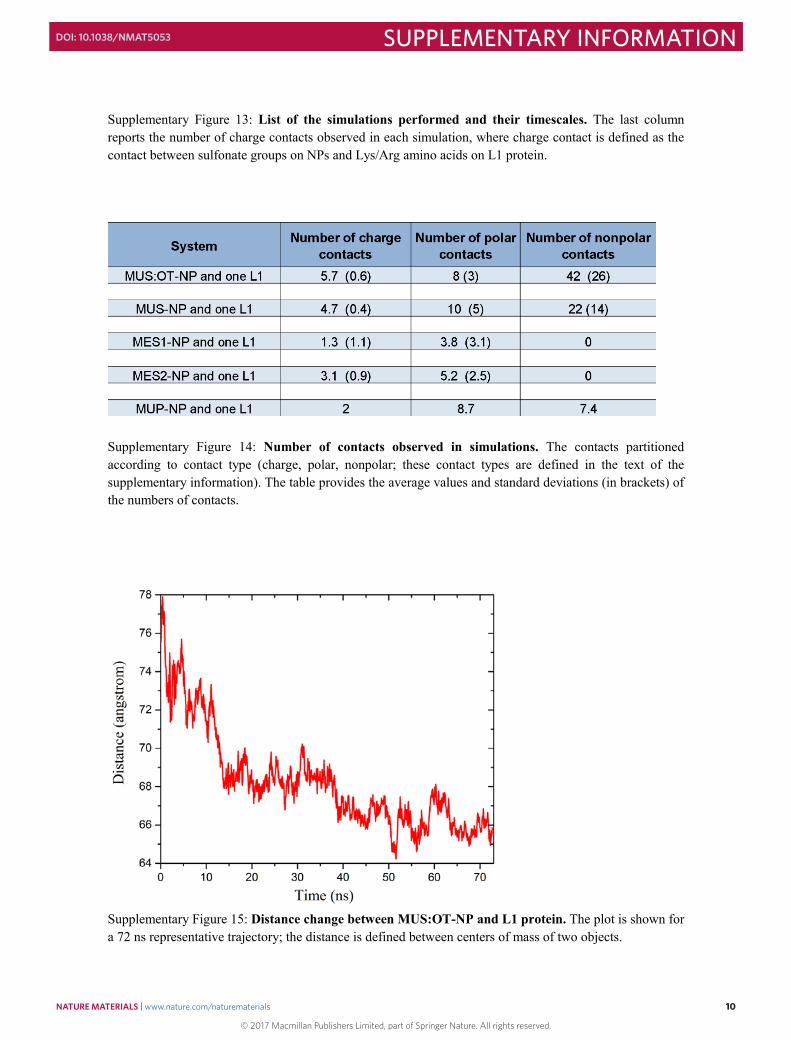
Supplementary Figure 13: List of the simulations performed and their timescales. The last column reports the number of charge contacts observed in each simulation, where charge contact is defined as the contact between sulfonate groups on NPs and Lys/Arg amino acids on L1 protein.
Supplementary Figure 14: Number of contacts observed in simulations. The contacts partitioned according to contact type (charge, polar, nonpolar; these contact types are defined in the text of the supplementary information). The table provides the average values and standard deviations (in brackets) of the numbers of contacts.
Supplementary Figure 15: Distance change between MUS:OT-NP and L1 protein. The plot is shown for a 72 ns representative trajectory; the distance is defined between centers of mass of two objects.
Supplementary Figure 16: MUS:OT-NPs interaction with L1. Side view of a large MUS:OT NP (5 nm core) binding to two L1 pentamers at initial time in the small representation, and after 10 ns simulations (main representation). Red arrows indicate the reorientations of L1 pentamers. Scale bars are 1 nm.
Supplementary Figure 17: Post treatment assay. A) HSV-2 (MOI 0.01) was added to cells for 2 h at 37°C. After the removal of the viral inoculum different concentrations of MUS:OT-NPs were added to the infected cells. B) HSV-2 (MOI 0.01) was added to cells for 2 h at 37°C. After 2, 4, 6 h MUS:OT-NPs (100 µg/mL) were added to the infected cells, the 24 hpi treatment was done after an infection with MOI 0.001
to treat the cells when the cytopathic effect was not already involving the entire monolayer. Results are expressed as % of viral titer, calculated in comparison with untreated wells. Results are mean of 3 independent experiments performed in triplicate. Conditions % of viability LDH release Mock 1h 100 0.884 ± 0.06 MUS:OT 1h 83.67 ± 1.89 0.720 ± 0.03 Mock 4h 100 0.704 ± 0.08 MUS:OT 4h 97.17 ± 3.53 0.726 ± 0.07 Mock 18h 100 1.141 ± 0.11 MUS:OT 18h 96.11 ± 2.84 1.059 ± 0.09 Triton 0.1% 2h 19.74 1.360 ± 0.12 Supplementary Figure 18: Epivaginal cytotoxicity. MUS:OT-NPs (500 nM) were incubated for different times on EpiVaginal tissues and subsequently the viability and cytotoxicity were evaluated with MTT and LDH.
Supplementary Figure 19: Nanoparticles biodistribution. ICP-MS was conducted on mouse organ homogenates.
Supplementary Figure 20: Dose response and virucidal activity of MUS-NPs against Dengue virus type 2. A) MUS-NPs were incubated at different concentrations with DENV-2, added to Vero cells and after 3 days incubation fluorescent immuno-stained plaque assay was performed. The % of infection was calculated comparing the numbers of infected cells in treated and untreated wells using ImageJ software. The results are mean and sem from experiment performed in triplicate. B) Virucidal assays were performed by incubating DENV-2 (8x10⁴ IU) with 200 µg/mL of MUS-NPs for 2 h. The virucidal effect was determined by titrating serial dilutions of the mixtures on Vero cells and the residual infectivity was assessed at dilutions at which the nanoparticles are no more effective. The results are mean and sem of 3 independent experiments. *** p<0.001, Student’s t-test, t=38, df=4 Movie M1: MUS:OT-small-L1 (MUSOT-small-L1.avi) Atomistic MD simulations of an L1 pentamer of HPV capsid protein with the small NP (2.4 nm core, 50 MUS, 50 OT ligands). The NP and the protein are shown by van der Waals (vdW) and ribbon representations respectively. In the protein, the HSPG binding amino acids are displayed by vdW representation. Movie M2: MUS:OT-large-L1-pair (MUSOT-large-L1-pair.avi) Atomistic MD simulations of two L1 pentamers of HPV capsid protein with the large NP (5.0 nm core, 180 MUS, 180 OT ligands). The NP and the protein are shown by van der Waals (vdW) and ribbon representations respectively. In the protein, the HSPG binding amino acids are displayed by vdW representation.
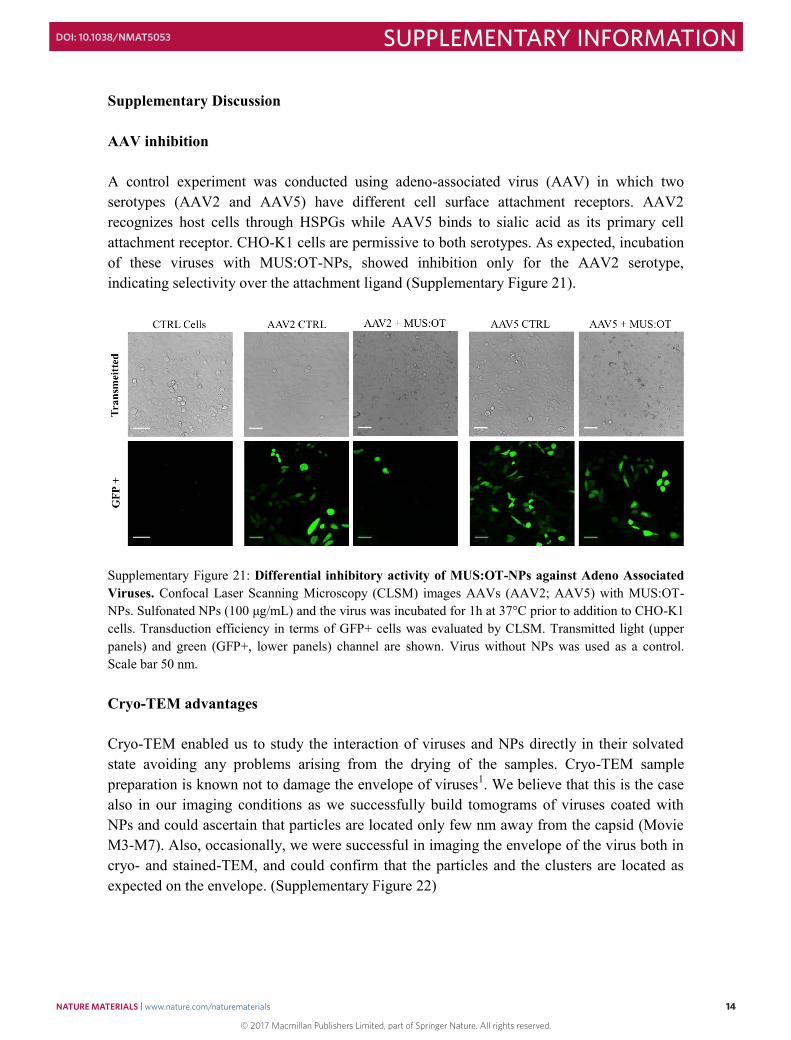
Supplementary Discussion AAV inhibition A control experiment was conducted using adeno-associated virus (AAV) in which two serotypes (AAV2 and AAV5) have different cell surface attachment receptors. AAV2 recognizes host cells through HSPGs while AAV5 binds to sialic acid as its primary cell attachment receptor. CHO-K1 cells are permissive to both serotypes. As expected, incubation of these viruses with MUS:OT-NPs, showed inhibition only for the AAV2 serotype, indicating selectivity over the attachment ligand (Supplementary Figure 21).
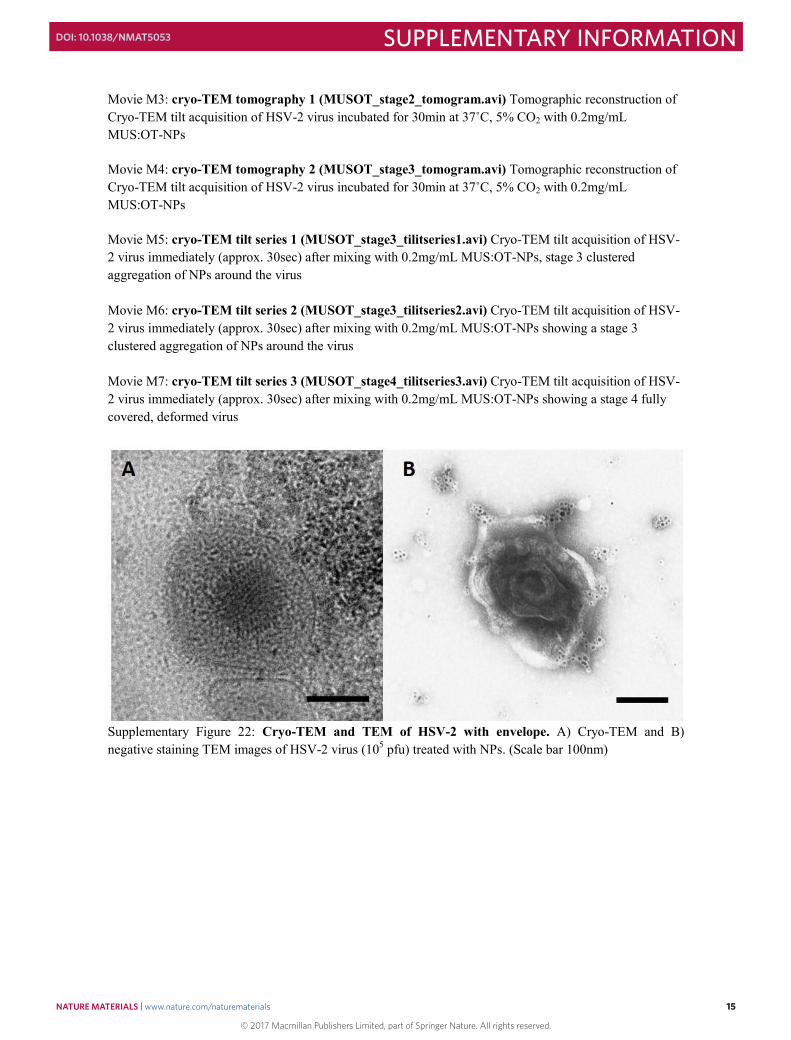
Supplementary Figure 21: Differential inhibitory activity of MUS:OT-NPs against Adeno Associated Viruses. Confocal Laser Scanning Microscopy (CLSM) images AAVs (AAV2; AAV5) with MUS:OT-NPs. Sulfonated NPs (100 μg/mL) and the virus was incubated for 1h at 37°C prior to addition to CHO-K1 cells. Transduction efficiency in terms of GFP+ cells was evaluated by CLSM. Transmitted light (upper panels) and green (GFP+, lower panels) channel are shown. Virus without NPs was used as a control. Scale bar 50 nm. Cryo-TEM advantages Cryo-TEM enabled us to study the interaction of viruses and NPs directly in their solvated state avoiding any problems arising from the drying of the samples. Cryo-TEM sample preparation is known not to damage the envelope of viruses1. We believe that this is the case also in our imaging conditions as we successfully build tomograms of viruses coated with NPs and could ascertain that particles are located only few nm away from the capsid (Movie M3-M7). Also, occasionally, we were successful in imaging the envelope of the virus both in cryo- and stained-TEM, and could confirm that the particles and the clusters are located as expected on the envelope. (Supplementary Figure 22)
Movie M3: cryo-TEM tomography 1 (MUSOT_stage2_tomogram.avi) Tomographic reconstruction of Cryo-TEM tilt acquisition of HSV-2 virus incubated for 30min at 37˚C, 5% CO2 with 0.2mg/mL MUS:OT-NPs Movie M4: cryo-TEM tomography 2 (MUSOT_stage3_tomogram.avi) Tomographic reconstruction of Cryo-TEM tilt acquisition of HSV-2 virus incubated for 30min at 37˚C, 5% CO2 with 0.2mg/mL MUS:OT-NPs Movie M5: cryo-TEM tilt series 1 (MUSOT_stage3_tilitseries1.avi) Cryo-TEM tilt acquisition of HSV-2 virus immediately (approx. 30sec) after mixing with 0.2mg/mL MUS:OT-NPs, stage 3 clustered aggregation of NPs around the virus Movie M6: cryo-TEM tilt series 2 (MUSOT_stage3_tilitseries2.avi) Cryo-TEM tilt acquisition of HSV-2 virus immediately (approx. 30sec) after mixing with 0.2mg/mL MUS:OT-NPs showing a stage 3 clustered aggregation of NPs around the virus Movie M7: cryo-TEM tilt series 3 (MUSOT_stage4_tilitseries3.avi) Cryo-TEM tilt acquisition of HSV-2 virus immediately (approx. 30sec) after mixing with 0.2mg/mL MUS:OT-NPs showing a stage 4 fully covered, deformed virus
Supplementary Figure 22: Cryo-TEM and TEM of HSV-2 with envelope. A) Cryo-TEM and B) negative staining TEM images of HSV-2 virus (105 pfu) treated with NPs. (Scale bar 100nm)
Atomistic molecular dynamics simulations on different NPs
Supplementary Figure 23: A snapshot of a MUS, MUP, MES1 and MES2 NP binding to the HPV L1 protein. Side view of the interactions of MUS, MUP, MES1 and MES2 (4 nm core) NPs with a HPV L1 protein pentamer. Strong multivalent binding is developed within 15 ns simulation only for MUS NP. For other NPs multivalent binding is not developed. The scale bar is 1 nm Movie M8: MES-small-L1 (MES-small-L1.avi) Atomistic MD simulations of an L1 pentamer of HPV capsid protein with the small NP (2.4 nm core, 100 MES ligands). The NP and the protein are shown by van der Waals (vdW) and ribbon representations respectively. In the protein, the HSPG binding amino acids are displayed by vdW representation. Movie M9: MES-large-L1 (MES-large-L1.avi) Atomistic MD simulations of an L1 pentamer of HPV capsid protein with the small NP (4 nm core, 250 MES ligands). The NP and the protein are shown by van der Waals (vdW) and ribbon representations respectively. In the protein, the HSPG binding amino acids are displayed by vdW representation. Movie M10: MUP-small-L1 (MUP-small-L1.avi) Atomistic MD simulations of an L1 pentamer of HPV capsid protein with the small NP (2.4 nm core, 100 MUP ligands). The NP and the protein are shown by van der Waals (vdW) and ribbon representations respectively. In the protein, the HSPG binding amino acids are displayed by vdW representation.
Supplementary Figure 24: Radial distribution function. Radial distribution function for phosphorus atoms on MUP-NPs (red) and sulfur atoms on MUS-NPs (black) in simulations of these NPs near L1 proteins. The neighboring phosphonate groups on NPs are on average closer to each other than are the neighboring sulfonate groups on NPs. Sizes of phosphonate and sulfonate groups (inset) are similar. The RDF was calculated using the RDF plugin in VMD software2. Binding for sulphonated NPs All the simulations are listed in Supplementary Figure 13. To examine a local convergence of the simulated systems, we determined the average number of contact points between NP ligands and L1 residues, as reported in Supplementary Figure 14. The contact points can be partitioned into contacts involving positively charged amino acids (Lys, Arg), polar amino acids (Thr, Asn, Gln, Ser), and nonpolar amino acids (the number of nonpolar contacts is defined as the number of alkyl carbons of NP ligands within 4 Å of the hydrophobic residues of L1 protein - the selection was visually inspected to include all the direct contacts between alkyl carbons of the ligands and hydrophobic residues). Charged and polar amino acids are observed to primarily interact with sulfonate groups of NP ligands, while the nonpolar amino acids interact primarily with the alkane chains of NP ligands. The determined numbers of contacts, averaged over three independent trajectories, provide the statistical expectations: MUS and MUS:OT NPs are expected to bind via sulfonate groups to 4-6 positively charged amino acids on HPV L1 protein, and to non-charged amino acids via polar (10 and 8 contacts) and non-polar interactions (22 and 42 contacts). A representative example of the time evolution of the number of contacts between MUS:OT NP and L1 protein is shown in Supplementary Figure 26 for a single 72 ns trajectory. During the first 40 ns, the numbers of contact points gradually increase, and then during the last 32 ns they plateau for all types of contact interactions (charged, polar, nonpolar), thus suggesting
a local convergence. Overall, our analysis hints at a local convergence, as the numbers of contacts plateau in individual simulations to similar values. To understand better the hydrophobic interactions between NPs and HPV L1 proteins, we calculated the Gibbs free energy of binding of an undecane chain to the L1 protein surface (Supplementary Figure 26), using an umbrella sampling (US) method. The reaction coordinate, which was defined as the distance between the undecane center of mass and several L1 residues (Phe50, Pro121, Leu222, Pro51), was partitioned into 25 windows of 1 Å width, where confinement potentials were introduced in the form of harmonic restraints with a force constant of k = 3 kcal/(mol Å2). Each US window was run for 10 ns, as undecane molecule quickly sampled its binding conformations. The weighted histogram analysis method (WHAM) was used to reconstruct the PMF. A Monte Carlo bootstrap error analysis was performed with the WHAM algorithm (with num_MC_trials set to 3)3,4. The histograms of the US windows used to reconstruct the PMF were examined and shown to have an appropriate overlap. The obtained binding free energy was -2.8 kcal/mol when 5.6 alkyl groups interacted on average with hydrophobic L1 residues. Therefore, the binding free energy per alkyl group of the ligand was -0.5 kcal/mol. Since 42 and 22 nonpolar contacts were observed on average for MUS:OT-NP and MUS-NP, the hydrophobic contributions to the free energies of binding of these NPs and the L1 protein were estimated to be -20.8 kcal/mol and -11.2 kcal/mol, respectively. The time sequence of NPs binding to the viral capsid can be characterized as follows. In the simulations of MUS:OT and MUS NPs, the NPs are initially bound to the L1 surface via Coulombic coupling between the sulfonate groups and lysine amino acids. Once the NPs are adsorbed in a stable way on the capsid surface, alkyl groups of NP ligands start interacting with a gradually increasing number of hydrophobic protein residues (Supplementary Figure 26). The only difference between MUS:OT and MUS which was observed, is that MUS takes more time to be properly bound on L1 pentamer surface. In the case of MES1 (Supplementary Figure 24) and MES2 (Supplementary Figure 23) NPs adsorb to the HPV L1 surface practically only through Coulombic coupling, since there are almost no hydrophobic contacts between L1 protein and the shorter MES ligands. MES1 NP only hopping on the surface whereas MES2 occasionally binds to 1-2 lysine residues, but it is not nesting well on the L1 proteins to deform them. The simulations suggest two advantages of long alkane chains being present on NPs. Firstly, long ligand chains can reach wide and make multiple Coulombic contacts within a short time, thus exerting a large force on the L1 protein. Secondly, after the initial Coulombic binding, hydrophobic interactions between ligands and the protein become established, they can help in establishing more Coulomb contacts by holding the ligand at the capsid surface. The dynamics of different NPs is captured by movies (showing 1) a small MUS:OT-NP (2.4 nm core) binding to a single L1 protein pentamer via HSPG-specific binding sites and nesting on it via multivalent binding (Movie M1), 2) a large MUS:OT-NP (5 nm core) binding to two L1
pentamers and inducing changes in their orientations (Movie M2), 3) a small and large MES (2.4 nm and 4 nm) (Movie M8, Movie M9) and 4) a small MUP-NP (2.4 nm core) binding to a single L1 pentamer without significantly nesting on it (Movie M10) . NPs-binding induced forces on viral capsids The performed simulations can be used to estimate the force that MUS:OT and MUS NPs exert on L1 protein. The force estimate can be based on measuring the change of binding free energy with changing the distance between the centers of NP and the L1 pentamer with respect to the initial distance. For the calculation of force, we use the time-averaged number of contacts formed between NPs and L1 proteins, as reported in Supplementary Figure 14. On average, MUS:OT and MUS NPs interact with 5.7 and 4.7 positively charged amino acids, respectively. To determine the change of relative distance between the centers of NP and L1 protein, we analysed the last 5 ns of the simulations and used the maximum change of the distance in the calculation of force to get a more conservative number. The experimental binding free energy between sulfonate with positively charged amino acids is -6 kcal/mol5. If we call these binding contributions Coulombic, the total free energies of binding for MUS:OT and MUS NPs are estimated to be -55 kcal/mol (Coulombic -34 kcal/mol and nonpolar -20.8 kcal/mol) and -39 kcal/mol (Coulombic -28 kcal/mol, nonpolar -11.2 kcal/mol), respectively, where the above estimates for non-polar binding of alkyl chains are also included. Since only the Coulombic binding originates from localized contacts, for simplicity, we assume that only this coupling component should be used to estimate the effective force with which the NPs act on the L1 protein complexes. The change of distance for MUS:OT and MUS NPs are 10.4 Å and 12.5 Å, respectively (Supplementary Figure 15 shows an example for the change of distance between centers of mass of MUS:OT-NP and the L1 protein). By combining the Coulombic energy change with the distance over which the NPs move while acquiring this binding energy, the estimated forces are 189 pN for MUS:OT and 124 pN for MUS. Another question to ask is if the NPs action damages the L1 (highly stable) pentamers or rather their mutual (weaker) binding. To probe the idea that NP attacks the capsid between neighboring pentamers, we simulated a system in which a large MUS:OT-NP was placed in the middle of two adjacent L1 protein pentamers. Supplementary Figure 16 shows that the NP binds to two neighboring L1 pentamers (in the arrangement observed within the complete HPV capsid). The number of binding sites gradually increases in time, which induces mutual reorientation of the unsupported L1 pentamers. In the complete viral capsid, the reorientation of L1 proteins is likely to be slow and taking part opportunistically during natural fluctuations of the capsid, because of their stable array-like supported arrangement. Despite their slow but steady progression, the local changes could accumulate and ultimately lead to larger irreversible changes in the virus capsid surface (Figure 3B, main text).
Besides the specific binding of NPs to the HSPG binding sites, we hypothesize that in a later stage of NP-HPV binding the charged NPs could also bind to capsid proteins in other possible ways. Supplementary Figures 27A and 27B show that the bottom of L1 protein is a highly positively charged region, which may be attractive for (negatively charged) NPs binding. Supplementary Figure 27C shows this binding, which could occur by the NPs when the L1 protein is reoriented. Our simulations show that this binding can be very strong. Binding for phosphonated NPs We would also like to figure out why MUP NPs can’t irreversibly modify the viruses, as observed in our experiments. MUP-coated NPs have been previously reported in the reference by P. Fiurasek et. Al6: NPs coated with alkyl chains that terminate with phosphonate ligands were observed to aggregate, due to strong intra- and inter-particle hydrogen bonding. In this reference, the authors observed that MUP-NPs either aggregate, when the MUP ligands are singly protonated at pH 5.5 (-HPO4
-), or they form stable colloidal dispersions, when MUP ligands are fully deprotonated above pH 10 (-PO4
2-). Based on the reference6, it could be expected that close to neutral pH, at which the experiments in the present paper were conducted, most MUS NPs are stably dispersed in solution and can make strong interactions with virus capsid protein, while MUP-NPs could be self-aggregating and not available for interactions with virus capsid proteins. The simulations of MUP-NPs and HPV L1 proteins reveal a different nature of interactions than in MUS-NPs (Supplementary Figure 23). In particular, MUP ligands, which have phosphonate (-HPO4
-) groups dangling on alkyl ligands and facing the solvent, are observed to self-interact and form clusters (Supplementary Figure 24, Movie M10). The reason for this MUP ligands clustering is that neighbouring -HPO4
- groups form hydrogen bonds and clusters, since -HPO4
- groups act both as hydrogen bond donors and acceptors. On the other hand, sulfonate groups (-SO3
-) remain separated from each other, as the sulfonate groups act only as hydrogen bond acceptors. In our simulations, sulfonate groups are observed to flexibly search for binding partners on HPV L1 protein and form Coulombic, polar and non-polar contacts, while phosphonate groups tend to self-interact, form dynamic clusters, and do not establish a strong polyvalent bonding with the HPV L1 protein.
Supplementary Figure 25: Time-dependent number of contacts in a representative trajectory. The plots are shown for different types of contact points between MUS:OT and L1 protein pentamer during a representative 72 ns trajectory.
Supplementary Figure 26: Free energy profile of undecane binding to the L1 protein surface. The profile is determined in umbrella sampling calculations (described in the text).
Supplementary Figure 27: Structure of the HPV capsid segment. (A, B) Electrostatic potential surfaces of 3 L1 protein pentamers of HPV capsid. The light pink surface is negatively charged, while the light blue surface is positively charged. The equipotential value of positive surface is 7.5V, negative surface is -7.5V. Amino acid residues shown in blue are implicated in HSPG binding. C) Strong interactions of large NP (5 nm core) with the bottom side of the L1 pentamers (10 ns of simulation). Scale bars are 1 nm. Iron oxide NPs Having demonstrated the feasibility of this approach, we designed NPs with a comparable ligand shell but a more biocompatible core than gold. Preliminary results with 6-((3,4-dihydroxyphenethyl)amino)-6-oxohexane-1-sulfonate (DOS) coated iron oxide NPs show virucidal activity similar to their gold counterpart (Supplementary Figure 28), indicating the importance of the particles molecular coating rather than their core material.
Supplementary Figure 28: Virucidal assay for DOS-NPs against LV-VSV-G. LV-VSV-G virucidal assay with sulfonated iron oxide NPs, DOS (500 µg/mL), and untreated LV-VSV-G virus after 2h at 37°C. The transducing unit/mL (TU/mL) of LV-VSV-G virus with and without NPs were measured after 48 h post-infection. The results are mean and sem of 3 independent experiments.
Supplementary Methods Chemicals All chemicals were purchased from Sigma Aldrich and used as is unless otherwise specified. All solvents purchased were reagent grade and purged with nitrogen gas for more than 30 min prior to the reaction. Synthesis of 11-mercapto-1-undecanesulfonate (MUS) ligand MUS ligands were synthesized according to a modified literature method.7 A gram-scale synthesis is outlined, adaptable to scales from 1 to 40 g of precursor. A synthesis using 25 mL of the precursor is described. Sodium undec-10-enefulfonate: 11-bromo-1-undecene (25 mL, 111.975 mmol), Sodium Sulfite Na2SO3 (28.75 g, 227.92 mmol) benzyltriethyl-ammonium bromide (10 mg) were added to a mixture of 200 mL methanol and 450 mL DI-water (4:9 MeOH:H2O ratio) in a 1 L round bottom flask. The mixture was refluxed at 102°C for 48h. The mixture was extracted with diethyl ether 5 times, (5 x 400 mL), and the aqueous phase was evaporated in a rotary evaporator. The white powder was dried under high vacuum, suspended in pure ethanol and filtered. The methanolic solution was evaporated, and the process was repeated twice, to decrease the amount of inorganic salts. Usually, about 33 g of white, methanol soluble power was collected at this scale. 1H-NMR (D2O): 5.76 (m, 1H), 4.78 (m, 2H), 2.69 (t, 2H), 1.53 (m, 2H), 1.11 (br s, 12H). Sodium 11-acetylthio-undecanefulfonate: Sodium undec-10-enefulfonate (33 g, 147.807 mmol) was dissolved in 500 mL of methanol. A 2.6 times excess of thioacetic acid (27.324 mL, 384.3 mmol) was added to the solution and stirred in front of a UV lamp overnight (12h). The solution was evaporated in a rotary evaporator until the solid residue turned orange-red. The solid was washed with diethyl ether, until no colored material could be removed. The solid was dried under high vacuum, and then dissolved in methanol producing a yellow solution. About 3 g of carbon black was added to the solution, vigorously mixed, and the mixture was filtered through celite in a fluted filter paper. The filtered solution was clear, the solvent completely evaporated and about 35 g of white solid was collected. 1H-NMR (D2O): 2.69 (t, 4H), 2.17 (s, 3H), 1.53 (m, 2H), 1.39 (m, 2H), 1.11 (br s, 14H). 11-mercapto-1-undecanesulfonate (MUS): Sodium 11-acetylthio-undecanefulfonate was refluxed at 102°C in 400 mL of 1M HCl for 12 h. 200mL of 1M NaOH was added to the final solution, additional 400 mL of DI-water was added to create a 1 L volume. The clear solution was kept at 4°C and crystallized overnight. The viscous white product was centrifuged down in 50 mL falcon tubes, and dried under high vacuum. 12 g (about 30% yield) of methanol soluble MUS is collected from this purification step. More material can be extracted from the supernatant of the centrifugation step, by reducing volume and keeping it at 4°C. 1H-NMR
(D2O): 2.69 (t, 4H), 2.34 (t, 3H), 1.53 (m, 2H), 1.39 (m, 2H), 1.11 (br s, 14H). Mass spectrum (ESI) found m/z = 291.107, calculated mass 290.42 g/mol. Synthesis of all MUS and MUS:OT gold nanoparticles 1.2 mmol of gold salt (HAuCl4) was dissolved in 200 mL of ethanol and 1.2 mmol of the desired thiol ligand mixture (two MUS to each OT, for MUS:OT NPs) was added while stirring the reaction solution, then a saturated ethanol solution of sodium borohydride (NaBH4) was added drop-wise over 2 h. The solution was stirred for 3 h and the reaction flask was then placed in a refrigerator overnight. The product was washed several times (5 to 10) by suspending and centrifuging (5500 rpm) it in methanol, ethanol and then acetone. Finally, the product was washed 5 times with DI-water using Amicon® Ultra-15 centrifugal filter devices (30k NMWL). The particles were then suspended in a minimal amount of water and freeze-dried to yield ≈ 250 mg of a black powder. The NPs were imaged by TEM, the average core diameter of MUS:OT-NPs was 2.8 ± 0.8 nm, Supplementary Figure 1 and MUS-NPs 2.5 ± 0.7 nm, Supplementary Figure 3. After etching of MUS:OT-NPs (10mg) in a solution of 15 mg Iodine (Acros) in 0.6 mL of MeOD-d4 (Sigma) for 30 min under sonication, the spectra revealed a 34% OT content, i.e. a 2:1 MUS:OT stoichiometry, Supplementary Figure 2. Synthesis of Oligo-Ethylene Glycols gold nanoparticles, EG2-OH NPs EG2-OH NPs were synthesized according to a modified Stucky procedure.8 The reaction was performed in a 100 mL 3-neck round bottom flask in a total volume of 20 mL of a mixture of dimethylformamide (DMF) and 20% Methanol, at 100 °C in an oil bath under reflux. Briefly, 0.25 mmol of chloro(triphenylphosphine)gold(I) and 0.125 mmol of EG2-OH, i.e. HS-(CH2)6)-(OCH2CH2)2-OH (ProChimia Surfaces, Poland) were dissolved in 15 mL of a mixture of dimethylformamide (DMF) and 20% Methanol and then stirred for at least 20 min. When the reaction temperature is reached, 2.5 mmol of borane tert-butylmine complex previously dissolved in 5 mL of solvent mixture were added in one portion to the reaction mixture. The solution colour turns from transparent to light brown and then slowly to deep red. The reaction was stirring at 100 °C for 1 h 30 min. Afterward, the heating was turned off and the solution left stirring for additional 3 h. The NPs were precipitated with acetone and kept overnight at 4°C. A black precipitate of Au-NPs was suspended and centrifuged at 3220 g for 20 min in acetone for five times. The black precipitate was left to dry under vacuum. Subsequently the black precipitate was dissolved in ultrapure deionized water (18.2 MΩ cm at 25 °C) and dialysed extensively against ultrapure deionized water. Removal of residual salts from the synthesis was checked by measuring the conductivity of a 0.5 mg/mL solution of NPs, which had to be below 5 μS/cm. The solution obtained after the dialysis was then concentrated through diafiltration with Vivaspin 6 mL to a final volume between 1-2 mL. This volume was then freeze dried and lyophilized and the powder recovered. The NPs were imaged by TEM, the average core diameter was 6.2 ± 0.8 nm, Supplementary Figure 4.
Synthesis of MUP gold nanoparticles, MUP-NPs Separately 12-mercaptoundecylphosphoric acid (MUP) (255 mg, 0.9 mmol) was dissolved in ethanol (20 mL, Fluka, Puriss > 99.8%) and NaBH4 (2 g) was dissolved in ethanol (200 mL, Fluka). Both solutions were then sonicated to aid dissolution and filtered to remove any insoluble residue. In a third container gold (III) chloride trihydrate (354 mg, 0.9 mmol) was dissolved in ethanol (200 mL, Fluka). The ligand (MUP) solution was then added to the gold salt solution with stirring for 10 minutes. To this vigorously stirred solution was then added dropwise the NaBH4 solution. After complete addition of the reducing agent the mixture was stirred for 1h and then the reaction flask was stored overnight at 4°C to precipitate the NPs. NPs were then spun down (5000 rpm). The supernatant was removed and NPs re-dispersed in 45 mL of ethanol. Ethanol washing was repeated 3 times. The residue was then dispersed in water (15 mL) and filtered through Amicon® Ultra-50 centrifugal filter devices (30k MW cut off) to further wash the particles. This was repeated extensively until the water removed no longer foamed when shaken. The NPs solution were then dialyzed (8k MW cut off) against water for 2 weeks with water changes once per day. At the end of this process the particles appeared less soluble in water so they were further dialysed (tubing Mw cut off 8k) against aqueous NaOH (pH 12) for two days before dialysis against pure water for 1 day. The particles were then freeze dried to yield a purple powder. Synthesis of all MES gold nanoparticles, MES-NPs 1mM of gold salt (HAuCl4) was dissolved in 150 mL of H2O and 9 mmol (50mL in H2O) of sodium 2-mercaptoethanesulfonate (MES) was added while stirring the reaction solution. Aqueous NaBH4 solution (10 mL, 0.01 g) was added at one portion and left for stirring at room temperature for 1 h. Second portion of NaBH4 (5 mL, 0.04 g) was added and dark-brown color was observed almost immediately. The reaction was left stirring overnight for completion. The product was washed several times (5 to 10) with DI-water using Amicon® Ultra-15 centrifugal filter devices (3k NMWL). The particles were then suspended in a minimal amount of water and freeze-dried to yield ≈ 25 mg of a black powder. The NPs were imaged by TEM, the average core diameter was 2.6 nm, Supplentary Figure 6. Synthesis of iron oxide nanoparticles, DOS-FeO NPs The ligand was synthesized as follows: 6-Bromohexanoic acid (1 g, 5.13 mmol) was dissolved in dichloromethane (20 mL) and N-hydroxysuccinimide (0.59 g, 5.13 mmol) added. The mixture was then cooled to 0°C followed by the addition of N,N’-dicyclohexylcarbodiimide (1.27 g, 6.16 mmol) in dichloromethane (10 mL). This was stirred at 0°C for 15 min followed by the addition of 4-(dimethylamino)pyridine (0.125 g, 1.02 mmol). The mixture was stirred at 0°C for 1 h and then allowed to warm to room temperature where it was allowed to stir for a further 24 h. The formed precipitate was removed and the supernatant dried. The crude mixture was dissolved in dimethylformamide (DMF) (5 mL) and the precipitate removed. A yellow waxy substance was obtained after drying (1.388 g) as the crude activated acid. Dopamine hydrochloride (1.15 g, 6.06 mmol) was dissolved in dry DMF (10 mL) and degassed with nitrogen for 10 min. Diisopropylethylamine (DIPEA) (1.30
g, 0.01 mol) was then added slowly and the mixture stirred for 5 min. The crude activated acid (1.388 g, 5.04 mmol) was then added and the solution stirred at room temperature for 64 h. The DMF was then removed and the residue dissolved in ethyl acetate and washed against 1 M HCl and then brine. The organic fraction is then dried using Na2SO4 and concentrated to dryness. Column chromatography using ethyl acetate/hexane (3:1) afforded the pure product. The purified material (0.32 g, 0.969 mmol) was mixed with sodium sulphite (0.367 g, 2.91 mmol), and a catalytic amount of benzyltriethyl ammonium bromide in methanol/water (4:9). The mixture was then refluxed overnight. The methanol was then removed and the water washed against diethyl ether. The water fraction was collected and concentrated to dryness. The pure product was then extracted from the solid using hot methanol. The iron oxide NPs were synthesized as follows: FeCl3 (1.081 g, 4 mmol), FeCl2 (397.62 mg, 2 mmol), oleic acid (4.519 g, 16 mmol) were mixed in ethanol (12 mL)/degassed H2O (9 mL)/toluene (21 mL) and the mixture refluxed at 74°C. After 1 h sodium hydroxide (620 mg, 15.5 mmol) dissolved in ethanol (1.33 mL)/degassed H2O (1 mL)/toluene (2.33 mL) was added quickly. Reflux was continued for a further 2 h. Once cooled an excess of ethanol was added and the precipitate collected by centrifugation at 4000 g. The precipitate was washed 4 times with ethanol and the purified NPs were stored at -20°C until needed. The ligand exchange procedure was performed as follows: oleic acid functionalised iron oxide NPs were dissolved in chloroform at 10 mg/mL by sonication. Separately the sulfonated catechol (CHS) ligand (20 mg) was dispersed in methanol with sonication and heating. An aliquot of 500 μL of this mixture was added to the NPs solution until complete precipitation occurred. This precipitate was collected using a magnet and the supernatant removed. The precipitate was then dispersed in a methanol solution containing 30 mg of sulfonated catechol (CHS) with sonication. Sonication was continued until all the precipitate had been dissolved and the mixture was incubated for 48 h at room temperature. The now sulfonated iron oxide NPs were then precipitated with an acetone/hexane mixture and the precipitate collected by magnet. This was then washed a further 3 times by dissolving in a small amount of water followed by precipitation with acetone/hexane. The precipitate was then dried to give the final sulfonated iron oxide NPs. Calculation of molecular weight of gold nanoparticles The calculations of the molecular weight of the NPs followed the equations described in literature.9 NPs are composed of a gold core and a monolayer of organic molecules arranged onto NPs surface. A reasonable estimation of the molecular weight of NP is made by following equations:
where NA is the Avogadro’s number, the density of gold bulk, is 19.32 and the density of the ligand, is 1.2 .3 The length of MUS is approximately 1.7 nm, the radius of MUS:OT NP, is 1.4 nm. The molecular weight, MW of MUS:OT NP is 2.2x10⁵ Da. The number of NP in 1 mg is 3x10¹⁵. Cell Culture The cell lines used were: HeLa (human cervical carcinoma cell line ATCC CCL-2), HEK 293T (human embryonic kidney ATCC CRL-3216), CHO-K1 (Chinese hamster ovary cell line ATCC CCL-61), Vero (African green monkey fibroblastoid kidney cells ATCC CCL-81), Hep-2 (human larynx carcinoma epithelial cell line ATCC CCL-23) and HT-1080 (human fibrosarcoma cell line ATCC CCL-121). HEK 293T cells were cultured in Dulbecco’s modified Eagle’s medium (DMEM; Euroclone) containing 10% South American Foetal Bovine Serum (FBS-SA), 1% L-glutamine and 1% penicillin/streptomycin. HeLa cells were cultured in Eagle’s minimal essential medium (MEM - Invitrogen, Carlsbad, CA) supplemented with 10% FBS-SA, 1% L-glutamine and 1% penicillin/streptomycin (Euroclone). CHO-K1 were cultured in Ham’s F12-K medium (Invitrogen) supplemented with 10% FBS-SA, 1% L-glutamine and 1% penicillin/streptomycin. Vero cells, were grown in MEM medium (Gibco/BRL, Gaithersburg, MD) supplemented with 10 % heat inactivated foetal calf serum (FCS; Gibco-BRL), and 1 % antibiotic-antimycotic solution (Zell Shield, Minerva Biolabs GmbH, Berlin, Germany). 293TT cell line, derived from human embryonic kidney cells transformed with the simian virus 40 (SV40) large T antigen, was cultured in DMEM (Gibco-BRL, Gaithersburg, MD) supplemented with heat inactivated 10 % FCS (Gibco- BRL), Glutamax-I 1 % (Invitrogen, Carlsbad, CA) and nonessential amino acids 1% (Sigma Aldrich, Steinheim, Germany). All cells lines were grown in humidified atmosphere with 5% of CO2 at 37°C. Production and purification of Lentivirus (LV-VSV-G) Lentivirus (LV), derived from the human immunodeficiency virus (HIV), is the most widely used viral vector for gene delivery due to its ability to mediate potent transduction and stable expression into dividing and non-dividing cells. Lentiviral particles can be engineered to bear different glycoproteins (GPs) derived from other enveloped viruses (pseudotyping) allowing to an extension of the tropism. In this study, we used lentiviral vectors pseudotyped with the envelope glycoprotein of Vesicular Stomatitis Virus (VSV). Production of such phenotypically mixed virus particles was accomplished in three steps. Firstly, calcium phosphate transient co-transfection of HEK 293T cells with all necessary plasmids, secondly concentration of viral vectors using PEG 6000 and thirdly, purification by ultracentifugation on a sucrose cushion5. Generation of infectious lentiviral particles required the expression of essential genes in HEK 293T cells through several plasmids - lentiviral expression plasmid (pRRLSIN.cPTT.PGK-GFP.WPRE), carrying the transgene sequence encoding GFP, plasmids encoding packaging proteins (pMDLg/pRRE, pRSV-Rev), with gag, pol, rev and tat
genes and finally, pseudotyping plasmid (pMD2.G) encoding the heterologous envelope glycoprotein from VSV. Newly formed lentiviral particles were collected 48 hours after transfection, concentrated by precipitation using PEG- it™ (System Biosciences, SBI), resuspended in PBS and transferred in cryo-tubes and stored at -80°C. Subsequently, the titer of the virus was calculated as the number of functional particles able to deliver their genetic materials in cells (transducing units/mL - TU/mL), determined in HeLa cells through serial dilutions of lentiviral preparation, evaluating the percentage of GFP positive cells by flow cytometry10. In order to obtain lentiviral stocks with higher degree of purity, lentiviral particles stored at -80°C were rapidly thawed and further purified through ultracentrifugation on 20% (w/v) sucrose cushion. Viral preparations (200 μL) were layered on 1.5 mL of 20% sucrose in PBS (Phosphate Buffer Saline) solution into ultracentrifuge tubes (Beckman Coulter Inc). Subsequently, samples were ultracentrifuged at 19000 rpm for 2h at 20°C using a Beckman SW41 (Beckman Coulter Inc) swinging bucket rotor. Finally, the supernatant was discarded and the virus pellet was resuspended in 50 μL of PBS. Adenovirus 5 (AD5) Purified human recombinant Adenovirus type 5 (AD5) encoding for green fluorescent protein (GFP) was purchased from vector Biolabs (Philadelphia, PA, USA). Adenovirus was stored at -80 °C in PBS with 5% of glycerol. Adeno-Associated Virus (AAV) Different serotypes of recombinant Adeno-associated viruses (AAVs) encoding GFP (AAV2-GFP, AAV5-GFP) were purchased from Vector Biolabs (Philadelphia, PA, USA). They were stored at -80 °C in PBS with 5% glycerol. Herpes Simplex Virus type 1 and type 2 (HSV-1 and HSV-2) Clinical isolates of HSV-1 and HSV-2 were kindly provided by Prof. M. Pistello, (University of Pisa, Italy). HSV-1 and HSV-2 strains were propagated and titrated by plaque assay on Vero cells. Respiratory Syncytial Virus (RSV) RSV strain A2 (ATCC VR-1540) was propagated in HEp-2 cells by infecting a freshly prepared confluent monolayer grown in MEM supplemented with 2% of FCS. When the cytopathic effect involved the whole monolayer, the infected cell suspension was collected and the viral supernatant was clarified. The virus stocks were aliquoted and stored at −80°C. The infectivity of virus stocks was determined on HEp-2 cell monolayers by standard plaque assay. The cell lines and the RSV were obtained from the American Type Culture Collection (Manassas, VA, USA). A recombinant RSV expressing the firefly luciferase (rHRSV-Luc) in infected cells was used for in vivo experiments. The virus was produced as previously described11.
Dengue virus type 2 (DENV-2) Dengue virus type 2 was obtained from Dr. Jochen Bodem, University of Wurzburg (Wurzburg, Germany), propagated and titrated by immuno-stained plaque assay in Vero cells. Human Papilloma Pseudovirus (HPV16 PsV) production Plasmids and 293TT cells used for pseudovirus (PsV) production were kindly provided by John Schiller (National Cancer Institute, Bethesda, MD). HPV-16 PsVs were produced according to previously described methods12. Briefly, 293TT cells were transfected with plasmid expressing the papillomavirus major and minor capsid proteins (L1 and L2, respectively), together with a reporter plasmid expressing the secreted alkaline phosphatase (SEAP), named pYSEAP or a reporter plasmid expressing GFP. Capsids were allowed to mature overnight in cell lysate; the clarified supernatant was then loaded on top of a density gradient of 27 to 33 to 39 % Optiprep at room temperature for 3 h. The material was centrifuged at 28000 rpm for 16 h at 4°C in an SW41.1 rotor (Beckman Coulter, Inc., Fullerton, CA) and then collected by bottom puncture of the tubes. Fractions were inspected for purity in 10% sodium dodecyl sulfate (SDS)–Tris–glycine gels, titrated on 293TT cells to test for infectivity by SEAP or GFP detection, and then pooled and frozen at -80 °C until needed. The L1 protein content of PsV stocks was determined by comparison with bovine serum albumin standards in Coomassie-stained SDS-polyacrylamide gels. Cytotoxicity Assay The toxicity of Au-NPs was examined using propidium iodide (PI) assay by Flow cytometry or MTS [3-(4,5-dimethylthiazol-2-yl)-5-(3 carboxymethoxyphenyl)-2-(4- sulfophenyl)-2H-tetrazolium] assay. Propidium iodide, a fluorescent stain for nucleic acid, allows to determine the amount of dead cells due to its inability to penetrate into live cells. Indeed, PI could only penetrate into cells that exhibit compromised plasma membrane and intercalates into double stranded DNA. Once the dye is bound to DNA it is excited at 488nm and emits at a maximum wavelength of 617 nm. The percentage of viable cells was measured following the same experimental conditions as for the NPs/virus interaction study. Cells were incubated with different concentrations of NPs (from 0.1 μg/mL to 100 μg /mL) for 48 h at 37°C. After incubation with NPs, cells were harvested by trypsin, washed with 1mL of PBS supplemented with 1% BSA and the pellet was resuspended in 500 μL of PBS. Finally, 2 μL of PI, at the concentration of 50 μg/mL in PBS, were added to the samples and incubated for 5 min at RT in the dark. PI fluorescence was immediately determined on a FACS CANTOII flow cytometer (Beckton Dickinson, San Jose, CA). Unstained cells were used as negative control samples. The results were analysed using BD FACSDiva software. For the MTS assay, cell cultures seeded in 96-well plates were incubated with different concentrations of Au-NPs or ligand under the same experimental conditions as described for the antiviral assays. Cell viability was determined by the CellTiter 96 Proliferation Assay Kit (Promega, Madison, WI, USA) according to the manufacturer’s instructions. Absorbance was measured using a Microplate Reader (Model 680, BIORAD) at 490 nm. The effect on cell
viability at different concentrations of NPs was expressed as percentage of live cells, by comparing the absorbance of treated cells with the one of cells incubated with culture medium. Au-NPs preparation for antiviral assay NPs were dissolved in Milli-Q grade water, sonicated for 20 min at room temperature and then filtered with a 0.22 μm filter in order to sterilize and remove precipitates. Before the use with cells, an appropriate amount of 10x PBS was added to the NPs solutions in order to obtain the final concentration ready to use in 1x PBS. Inhibition Assays LV-VSV-G, Adenovirus and AVV2 and AVV5 VSV-G pseudotyped lentivirus (LV-VSV-G) or Adenovirus (AD5) or Adeno Associated Viruses (AAV2 and AAV5), carrying GFP as reporter gene, were resuspended in PBS and incubated with increasing concentrations of sulfonated or non-sulfonated NPs in PBS for 1 h at 37°C prior to cell infection. The mixture of virus/NPs was subsequently added to the HeLa cells for LV-VSV-G and AD5 whereas CHO-K1 cell lines were used for both serotypes of AAVs (AAV2 and AAV5). Transduction efficiency, calculated as the % GFP+ cells, of LV-VSV-G and AD5 was measured by flow cytometry while confocal laser scanning microscopy (CLSM) was used for AAVs. Transduction was stopped after 48h and cells were fixed with 4% paraformaldehyde (PFA) for 10 min at room temperature and resuspended in PBS. Inhibition Assay HSV-1, HSV-2 The effect of Au-NPs on HSV infection was evaluated by a plaque reduction assay. Vero cells were pre-plated 24 h in advance in 24-well plates at a density of 105 cells/well. Increasing concentrations of NPs or ligand were incubated with HSV-1 or HSV-2 with a multiplicity of infection (MOI) of 3x10⁻⁴ pfu (plaque forming units)/cell at 37 °C for 1 h and then the mixtures were added to the cells. Following virus adsorption (2 h at 37°C), the virus inoculum was removed and, the cells were washed with medium and then overlaid with a medium containing 1.2 % methylcellulose. After 24 h (HSV-2) or 48 h (HSV-1) of incubation at 37°C, cells were fixed and stained with 0.1 % of crystal violet in 20 % ethanol and viral plaques were counted. The concentration producing 50 % reduction in plaque formation (IC50) was determined using the Prism software by comparing drug-treated and untreated wells. Inhibition Assay HPV-16 PsV 293TT cells were plated 24 h in advance in 96-well tissue culture-treated flat bottom plates at a density of 2x10⁴ cells/well in 100 µL of neutralization buffer (DMEM without phenol red, 10 % FBS, 1 % glutamate, 1 % nonessential amino acids, 1 % penicillin-streptomycin-fungizone, and 10 mM HEPES). Diluted PsV stocks (80 µL/well) were placed on 96-well non treated sterile, polystyrene plates (Nalge-Nunc, Roskilde, Denmark), combined with 20 µL of serially diluted NPs or ligand solution, and placed for 1 h at 37°C. The 100-µL PsV-compound mixture was transferred onto the pre-plated cells and incubated for 72 h. The final
concentration of PsV was approximately 1 ng/mL L1. After incubation, 25 µL of supernatant was harvested. The SEAP content in the supernatant was determined using a Great Escape SEAP Chemiluminescence Kit (BD Clon-tech, Mountain View, CA) as directed by the manufacturer. 30 min after the addition of the substrate, samples were read using a Wallac 1420 Victor luminometer (PerkinElmer Life and Analytical Sciences, Inc., Wellesley, MA). Alternatively infection was measured by GFP positive cells. Inhibition Assays RSV NPs or ligand were serially diluted and incubated with RSV (MOI 0.01) for 1 h at 37 °C. Then the mixture was added to 104 A549 cells grown as monolayers in a 96-well plate to allow the viral adsorption for 3 h at room temperature; the monolayers were then washed and overlaid with 1.2 % methylcellulose medium. Three days post-infection, cells were fixed with cold methanol and acetone for 1 min and subjected to RSV-specific immunostaining using an RSV monoclonal antibody (Ab35958; Abcam, Cambridge, United Kingdom). Immunostained plaques were counted, and the percent inhibition of virus infectivity was determined by comparing the number of plaques in treated wells with the number in untreated control wells. Inhibition assay DENV-2 Two fold dilutions of NPs were added to DENV-2 (MOI 0.03) and incubated for 1 h at 37 °C in 5% CO2. After incubation the NPs/virus mixture was added to 20,000 Vero cells plated the day before in DMEM with 2% fetal bovine serum, 100 U of penicillin/mL and 100 µg of streptomycin/mL. After 72 h incubation at 37 °C in 5% CO2, cells were fixed with 4% PFA and permeabilized with 0.2% Triton X-100. The cells were washed with PBS and incubated overnight at 4 °C with DENV-2 serotype-specific mouse monoclonal antibody, which was harvested from HB-46 cells (ATCC, Manassas, VA). Then, the wells were washed three times with PBS and incubated 90 min with Cy3-labeled donkey anti mouse IgG (Jackson Immunoresearch Europe, Suffolk, UK). Infected cells were counted using fluorescence microscope Olympus IX-81 (Hamburg, Germany). ImageJ software (NIH) was used for image analysis and evaluation of percentage of infected cells. NPs concentrations required to inhibit virus replication by 50% (EC50) were calculated using nonlinear regression analysis using GraphPad Prism, version 6.05 (GraphPad Software, La Jolla, CA). The results are mean and sem from experiment performed in triplicate. Evaluation of virucidal activity against LV-VSV-G The effect of NPs upon transduction on HeLa cells of recombinant LV-VSV-G (106 TU/mL – MOI 10) and AD5 (2x10⁷ TU/mL – MOI 20) was evaluated by incubating an effective inhibitory concentration of MUS:OT-NPs (1000 µg/mL) with viruses for 2 h at 37°C as previously described13. After incubation, transduction efficiency was determined by titration at high dilutions and calculated as the percentage of GFP+ cells by flow cytometry
Evaluation of virucidal activity against HSV-2, RSV, HPV-16 Viruses (105 pfu for HSV-2, HPV-16 and 104 pfu for RSV) and 100 µg/mL of MUS:OT-NPs were incubated at different time points (0, 5, 30, 60 or 120 min) at 37°C and the virucidal effect was investigated with serial dilutions of the mixtures. Viral titers were calculated at dilutions at which the NPs were not effective. Evaluation of virucidal activity against DENV-2 DENV-2 was mixed with 200 µg/mL of all MUS-NPs and incubated for 2 h. As a control same amount of virus was incubated without NPs. After 2 h incubation residual virus was diluted twofold, each dilution was added to 2x10⁴ Vero cells in triplicate, incubated for 3 days in 5% CO2, 37°C and titer was determined by immuno-stained plaque assay. The results are mean and sem of 3 independent experiments. Data were analyzed using GraphPad Prism, version 6.05. P-value was calculated by non-paired Student’s t-test. Viral Yield Reduction Assay The assay is finalized to quantify the antiviral effect of compound testing its effect on the production of infectious viruses. Vero cells were seeded in 24-well plates at a density of 105 cells/well and infected in duplicate with HSV-2 at a MOI of 0.01 pfu/cell and in the presence of serial dilutions of the compound. Following adsorption at 37°C for 2 h, the virus inoculum was removed and cultures were grown in the presence of serial dilutions of MUS:OT-NPs until control cultures displayed extensive cytopathology. Alternatively Vero cells were pre-treated with MUS:OT-NPs (100 µg/mL) for 18 h and subsequently infected with MOI 0.01, or infected and then treated with MUS:OT-NPs (100 µg/mL) at 2, 4 or 24 h post-infection (pi) and cultures were grown until control cultures displayed extensive cytopathology. Supernatants were harvested and pooled as appropriate 24-48 h pi and cell-free virus infectivity titers were determined in duplicate by plaque assay in Vero cell monolayers. The quantification of the viral titer was performed at dilutions of the supernatant at which the nanoparticles were known to be no more effective. The end-point of the dose response assay was the effective concentration of nanoparticles that reduced virus yield by 50% (EC50) compared to untreated virus controls, while for the pre-treatment and post-treatment assays the end point was the significant reduction of viral yield. Epivaginal tissues The EpiVaginal Tissues (VEC-100/VEC-100-FT) were purchased from MatTek Corporation (Ashland, MA, USA). According to the manufaturer’s instructions, EpiVaginal cultures were seeded with the apical surface exposed to air in 6-well plates containing 5 mL MatTek assay medium (VEC-100-ASY) per well. Plates were incubated overnight at 37 ºC in 5% CO2. The following day the tissues were subjected to antiviral and cytotoxicity assays. MUS:OT-NPs at (500 nM) were added to the cell culture insert placed on top of the EpiVaginal samples feeded with 0.9 mL of basal MatTek assay medium, and incubated for 1,
4, and 18 h in duplicate. Tissues were incubated with 1.0% Triton X-100 as positive control. At the end of incubation, any liquid remaining on top of the tissue was decanted and inserts were washed with PBS to remove any residual material. The basal medium was collected and subjected to LDH evaluation with Cytotoxicity detection kit (Roche) according to manufacturer’s instruction. Tissues instead were transferred in a 6 well plate containing 300 µL of MTT solution (1 mg/mL) for 3 h and subsequently to a 24 well plate containing DMSO as extracting solution. After 2 h incubation the absorbance at 570 nm was recorded. The ET-50 value refers to the time required to reduce tissue viability to 50% and was determined using GraphPad Prism software. According to the manufacturer an ET-50 value > 18 h indicates that a compound does not cause vaginal irritation and can be used for feminine hygiene products. MUS:OT-NPs, MES-NPs and EG2OH-NPs at 500nM were mixed with HSV-2 (105 pfu) for 1 h at 37 ºC and then added for 2 h apically on EpiVaginal tissues in duplicate. At the end of incubation, any liquid remaining on top of the tissue was decanted and inserts were washed with PBS to remove any residual material. Alternatively tissues were treated with MUS:OT 1500 nM in 20 l of medium apically for 18 h and then infected with HSV-2 (105 pfu) for 2 h, or were infected and then treated with MUS:OT 1500 nM in 20 l of medium apically 8 or 24 hpi. The tissues were fed everyday with 5 mL of fresh medium basolaterally. After 48 h and 72 h 200 µL of assay medium were applied to the tissue apically for 30 min, the collected medium was used for subsequent titration on Vero cells. Ethics statement The in vivo work of this study was carried out in accordance with INRA guidelines in compliance with European animal welfare regulation. The protocols were approved by the Animal Care and Use Committee at “Centre de Recherche de Jouy-en-Josas” (COMETHEA) under relevant institutional authorization (“Ministère de l’éducation nationale, de l’enseignement supérieur et de la recherche”), authorization number 2015100910396112v1 (APAFIS#1487). All experimental procedures were performed in a biosafety level 2 facility. RSV infection of mice and intranasal treatment Females Balb/c mice were purchased from the Centre d’Elevage R. Janvier (Le Genest Saint-Isle, France) and were used at about 8 weeks of age. They were anesthetized with a mixture of ketamine and xylazine (1 and 0.2 mg per mouse, respectively) and treated by intranasal administration (i.n.) of 50 µl of MUS:OT at 1 µM in PBS or with PBS alone for control mice. Ten minutes later, mice were infected with 50 µl of rHRSV-Luc (intranasal inoculation of 5 x 10⁴ pfu). Three days pi, mice were anesthetized for the in vivo luminescence measurement as previously described14. In vivo luminescence measurements Mice were anesthetized, and luminescence was measured 5 min following i.n. injection of 50 µl of PBS containing 0.75 mg kg-1 of body weight D-luciferin. Photon emission of mock-
infected and rHRSV-Luc-infected mice was measured using the IVIS 200 imaging system (Xenogen Corp.). Living Image software (version 4.0; Caliper Life Sciences) was used to measure the luciferase activity. Bioluminescence images were acquired for 1 min with f/stop of 1 and binning of 8. Digital false-color photon emission images of mice were generated, and photons were counted within a constant region of interest corresponding to the surface of the chest encompassing the whole-airway area. Photon emission was measured as radiance in photons per second per square centimeter per steradian (p/s/cm2/sr). ICP-MS Organ samples have been retrieved and homogenized in a total volume of 1mL in Tissue homogenizing tubes prefilled with ceramic beads. Until measured the samples were kept frozen at -80˚C. For Inductively Coupled Plasmon Resonance-Mass spectrometry (ICP-MS) measurements tubes were thawed, re-homogenised and 100µl sample digested in 1mL freshly prepared aqua regia shaking for 2 days at RT. Afterwards the samples were diluted with MilliQ and measured on an HPLC ICP-MS PERKIN ELMER ELAN DRCII. Flow cytometry analysis Cells were trypsinized, washed with PBS and fixed in 1% PFA in PBS for 10 min at room temperature. Approximately 2x10⁴ events (cells) were analysed per sample and cells with no virus were used as negative control in order to determine the autofluorescence background. Transduced cells were calculated as the percentage of GFP+ cells over the total population of analysed cells. The expression of the GFP protein on cells transduced with LV-VSV-G or AD5 was assessed through the BD FACSCalibur™ flow cytometer (BD Biosciences) and data were analysed with BD CELLQuest™ software (BD Biosciences). Gating was performed to exclude cellular debris from the analysis. Confocal Laser Scanning Microscopy (CLSM) Transduction efficiency, as the number of GFP+ cells, of AAVs (AAV2, AAV5), in presence or absence of MUS:OT-NPs, was visualized by using an inverted confocal laser scanning microscope (Leica TCS SP5) equipped with blue (488 nm) excitation laser line, objectives 40x and 63x. Cells were previously fixed in 4% of PFA in PBS for 10 min at room temperature. TEM HSV-2 and HPV-PsV (105 pfu) were incubated with only medium, or with 100 µg/mL Au-NPs (MUS:OT, EG2-OH) were allowed to adsorb for about 5 min on carbon- and Formvar-coated grids, and then the grids were rinsed several times with water. Grids were negatively stained with 0.5% uranyl acetate, and excess fluid was removed with filter paper. Observations and photographs were made using a CM 10 electron microscope (Philips, Eindhoven, The Netherlands). Images were adjusted for brightness and contrast with GIMP software (GNU Image Manipulation Program).
Cryo-TEM For cryo-TEM HSV-2 and HPV-PsV treated with Au-NPs 0.2mg/mL suspended in buffer were flash-frozen in their native hydrated state. Briefly, a droplet has been deposited onto a holey carbon grid (Quantifoil® Micro Tools Gmbh, Jena, Germany), blotted and subsequently vitrified in liquid ethane using an FEI vitrobot Marc IV. Imaging was performed at -175˚C in a FEI Tecnai F20 Cryo 200kV transmission electron microscope at magnifications of 50.000x in LowDose Mode (approx. 1-3electrons/Ångström2). Atomistic molecular dynamics simulations We performed atomistic molecular dynamics (MD) simulations of ligated Au-NPs adsorbed on viral capsids. The model NPs had cores of different diameters (2.4 nm, 4 nm and 5 nm) and four types of ligands (MUS, MES, OT and MUP), evenly distributed on their surfaces (density ~ 5 ligands per nm2). Six different NPs were prepared in total: MUS:OT (2.4 nm core, 50 MUS ligands, 50 OT ligands), MUS (2.4 nm core, 100 MUS ligands), MES1 (2.4 nm core, 100 MES ligands), MES2 (4 nm core, 250 MES ligands), MUP (2.4 nm core , 100 MUP ligands) and large MUS:OT (5 nm core, 180 MUS and 180 OT ligands). We modeled the adsorption of these NPs on Human Papillomavirus (HPV) Type 16 L1 capsid proteins. The structure of the Human Papillomavirus Type 16 capsid viral capsid in our model is based on the pdb ID 3J6R (HPV-16)15; each protein unit of the pentamer contained residues 9 to 486, and the missing atoms in the structure were added with the VMD2 plugin psfgen. In the simulations, NPs were initially placed near the capsid surface and solvated in a 0.15 M NaCl solution. Since the amino acid residues of HPV L1 protein that are responsible for the recognition of heparan sulfate proteoglycans are known (K278, K356, K361, K54 and K59 residues)16,17, initially, the NPs were always placed near these lysine (K) residues (~ 1 nm away). Three independent structures were prepared for each of MUS:OT, MUS, MES1 and MES2 NPs, by placing these NPs near three different unit proteins of the L1 pentamer. Single structures were prepared for MUP-NP and a single L1 pentamer, a large MUS:OT-NP above two L1 pentamers, and a large MUS:OT-NP below a single L1 pentamer. Unit cells of the systems, containing MUS:OT, MUS, MES1, MES2 and MUP NPs with single HPV L1 pentamers in aqueous solution, had in total between 400,000 and 500,000 atoms, while the unit cell containing a large MUS:OT-NP and two L1 pentamers had ~1,000,000 atoms. The NP ligands were described with the CHARMM general force field and proteins were described with the CHARMM36 protein force field18,19,20. The simulations were performed with NAMD2.1121. The particle-mesh Ewald (PME) method22 was used for evaluation of long-range Coulomb interactions. The time step was set to 2.0 fs, and long-range interactions were evaluated every 1 (van der Waals) and 2 timesteps (Coulombic). After 2,000 steps of minimization, ions and water molecules were equilibrated for 2 ns around L1 proteins and NPs, which were restrained using harmonic forces with a spring constant of 1 kcal/(mol Å2). For all the systems, the last frames of restrained equilibration were used to start simulations
of unrestrained proteins and NPs. All the simulations were performed for 50 to 80 ns each in the NPT ensemble (pressure p = 1 bar and temperature T = 300 K), using the Langevin dynamics (γLang = 1 ps-1). All the simulated systems and their timescales are reported in Supplementary Figure 13. Supplementary References 1. Rochat, RH, Hecksel CW, Chiu W. in Herpes Simplex Virus, Methods and Protocols. Diefenbach RJ,
Fraefel C, Eds. Humana Press, Springer 1144, 129-149 (2014).
2. Humphrey, W., Dalke, A. and Schulten, K., "VMD - Visual Molecular Dynamics", J. Molec. Graphics,
14, 33-38 (1996).
3. Grossfield, A. WHAM: the weighted histogram analysis method; University of Rochester Medical
Center: Rochester, NY, 2012.
4. Kumar, S.; Rosenberg, J. M.; Bouzida, D.; Swendsen, R. H.; Kollman, P. A. The weighted histogram
analysis method for free-energy calculations on biomolecules. I. J. Comput. Chem. 13, 1011-1021 (1992).
5. Matulis, D. & Lovrien, R. 1-Anilino-8-naphthalene sulfonate anion-protein binding depends primarily
on ion pair formation. Biophys. J. 74, 422–429 (1998).
6. Fiurasek, P. et al. Phosphonic and Sulfonic Acid-Functionalized Gold Nanoparticles: A Solid-State
NMR Study. Langmuir 23, 2857 – 2866 (2007).
7. Verma, A. et al. Surface-structure-regulated cell-membrane penetration by monolayer-protected
nanoparticles. Nat Mater 7, 588–595 (2008).
8. Zheng, N., Fan, J. & Stucky, G. D. One-step one-phase synthesis of monodisperse noble-metallic
nanoparticles and their colloidal crystals. J. Am. Chem. Soc. 128, 6550–6551 (2006).
9. Carney, R. P. et al. Determination of nanoparticle size distribution together with density or molecular
weight by 2D analytical ultracentrifugation. Nat Commun 2, 335 (2011).
10. Tiscornia G et al. Production and purification of lentiviral vectors. Nat Prot 1, 241-245 (2006)