Supplementary Information, Postema et al. 1 Supplementary Information Postema et al., Analysis of structural brain asymmetries in Attention- Deficit/Hyperactivity Disorder in 39 datasets Table of Contents Supplementary Methods ...................................................................................................................3 Table S1. Characteristics of the different datasets ...............................................................................5 Table S2. Full linear model results for the subcortical volume AIs in children .................................. 11 Table S3. Full linear model results for the cortical surface area AIs in children ................................. 12 Table S4. Full linear model results for the cortical thickness AIs in children ..................................... 13 Table S5. Full linear model results for the subcortical volume AIs in adolescents ............................. 14 Table S6. Full linear model results for the cortical surface area AIs in adolescents ............................ 15 Table S7. Full linear model results for the cortical thickness AIs in adolescents. ............................... 16 Table S8. Full linear model results for the subcortical volume AIs in adults ...................................... 17 Table S9. Full linear model results for the cortical surface area AIs in adults .................................... 18 Table S10. Full linear model results for the cortical thickness AIs in adults....................................... 19 Table S11. Full linear model results for the subcortical volume AIs in all age groups combined. ....... 20 Table S12. Full linear model results for the cortical surface area AI in all age groups combined. ....... 21 Table S13. Full linear model results for the cortical thickness AIs in all age groups combined. ......... 22 Table S14 Directions of asymmetry changes in ADHD individuals versus controls for those AIs that had shown nominally significant (P<0.05) associations with diagnosis in any of the main analyses. ..23 Table S15. Sensitivity analyses for the effects of diagnosis in all age groups combined, for subcortical volume AIs. ......................................................................................................................................24 Table S16. Sensitivity analyses for the effects of diagnosis in all age groups combined, for cortical surface area AIs. ...............................................................................................................................25 Table S17. Sensitivity analyses for the effects of diagnosis in all age groups combined, for cortical thickness AIs. ...................................................................................................................................26 Table S18. Associations of subcortical volume AIs with disorder severity in ADHD individuals, all age groups combined. .......................................................................................................................27 Table S19. Associations of cortical surface area AIs with disorder severity in ADHD individuals, all age groups combined. .......................................................................................................................28 Table S20. Associations of cortical thickness AIs with disorder severity in ADHD individuals, all age groups combined...............................................................................................................................29 Table S21. Associations of subcortical volume AIs with psychostimulant medication use in ADHD individuals, all age groups combined. ................................................................................................30 Table S22. Associations of cortical surface area AIs with psychostimulant medication use in ADHD individuals, all age groups combined. ................................................................................................31 Table S23. Associations of cortical thickness AIs with psychostimulant medication use in ADHD individuals, all age groups combined. ................................................................................................32
Transcript
Supplementary Information, Postema et al.
1
Supplementary Information
Postema et al., Analysis of structural brain asymmetries in Attention-Deficit/Hyperactivity Disorder in 39 datasets
Table of Contents Supplementary Methods ...................................................................................................................3
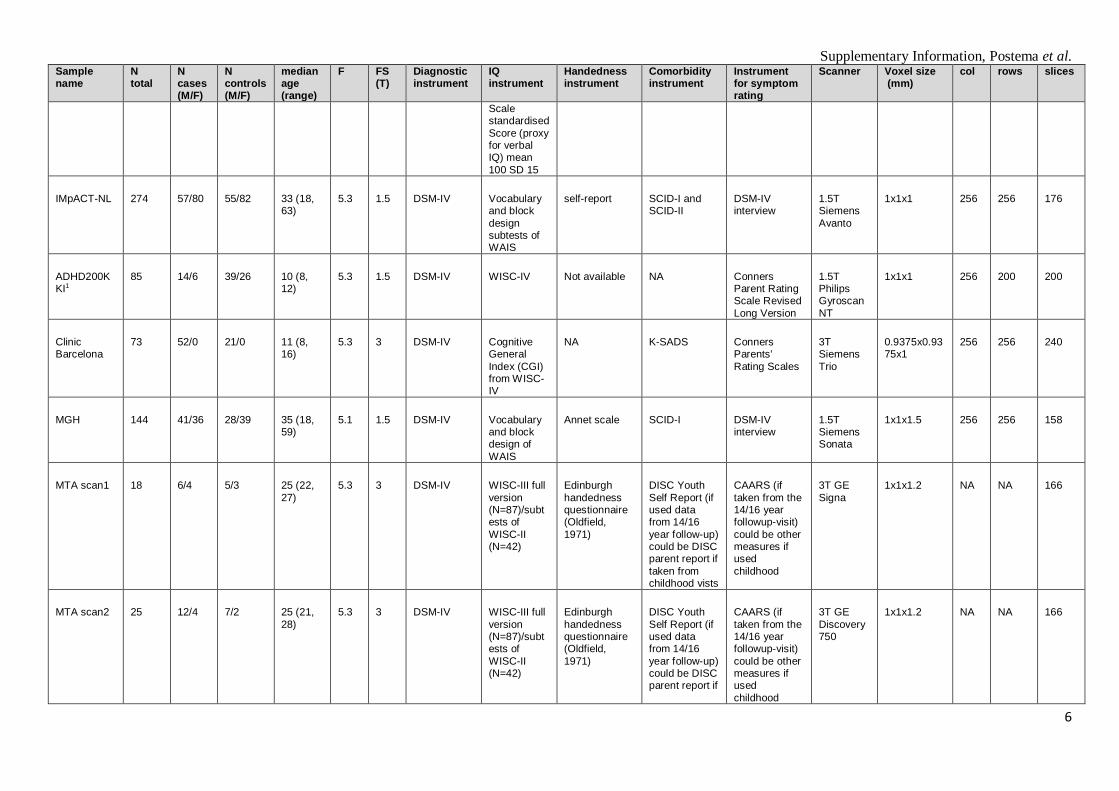
Table S1. Characteristics of the different datasets ...............................................................................5
Table S2. Full linear model results for the subcortical volume AIs in children .................................. 11
Table S3. Full linear model results for the cortical surface area AIs in children ................................. 12
Table S4. Full linear model results for the cortical thickness AIs in children ..................................... 13
Table S5. Full linear model results for the subcortical volume AIs in adolescents ............................. 14
Table S6. Full linear model results for the cortical surface area AIs in adolescents ............................ 15
Table S7. Full linear model results for the cortical thickness AIs in adolescents. ............................... 16
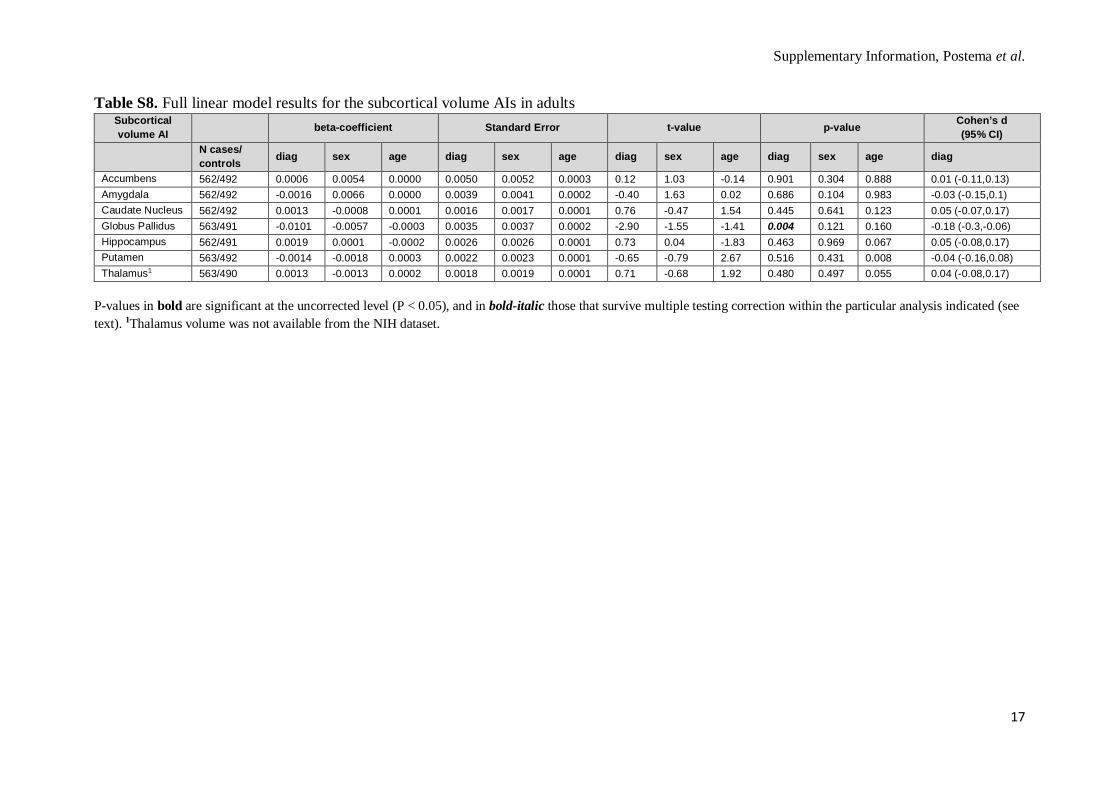
Table S8. Full linear model results for the subcortical volume AIs in adults ...................................... 17
Table S9. Full linear model results for the cortical surface area AIs in adults .................................... 18
Table S10. Full linear model results for the cortical thickness AIs in adults....................................... 19
Table S11. Full linear model results for the subcortical volume AIs in all age groups combined. ....... 20
Table S12. Full linear model results for the cortical surface area AI in all age groups combined. ....... 21
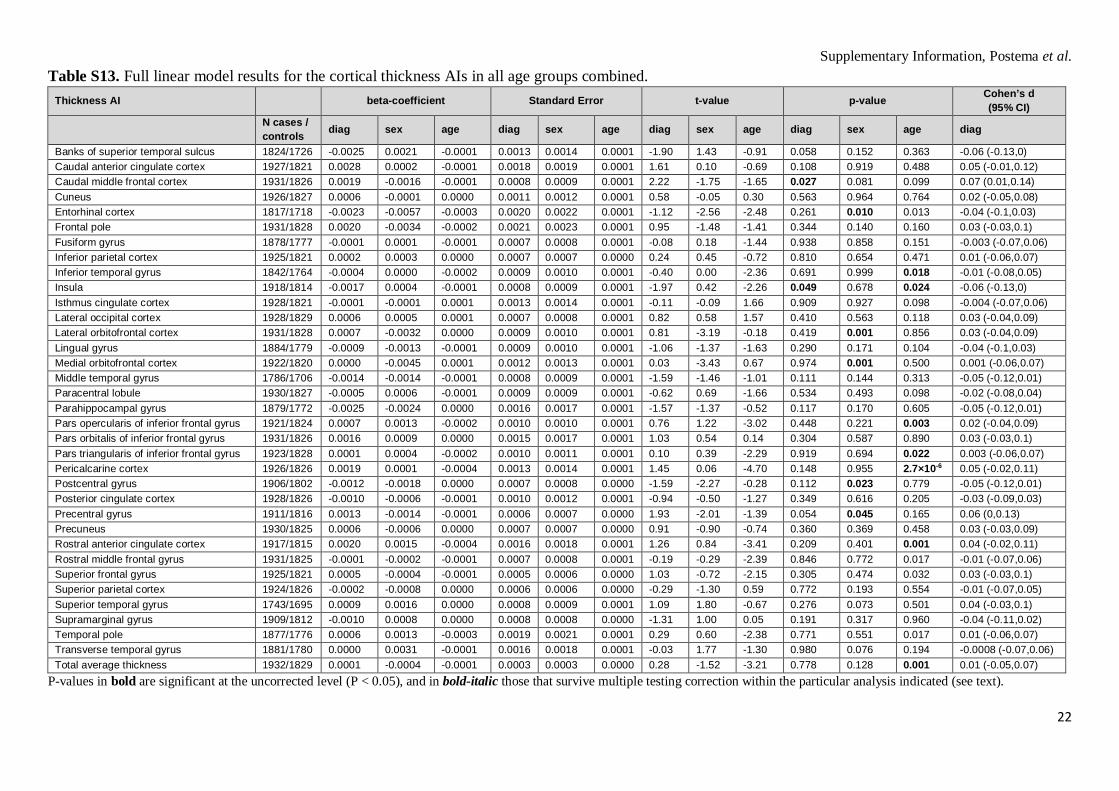
Table S13. Full linear model results for the cortical thickness AIs in all age groups combined. ......... 22
Table S14 Directions of asymmetry changes in ADHD individuals versus controls for those AIs that had shown nominally significant (P<0.05) associations with diagnosis in any of the main analyses. .. 23
Table S15. Sensitivity analyses for the effects of diagnosis in all age groups combined, for subcortical volume AIs. ...................................................................................................................................... 24
Table S16. Sensitivity analyses for the effects of diagnosis in all age groups combined, for cortical surface area AIs. ............................................................................................................................... 25
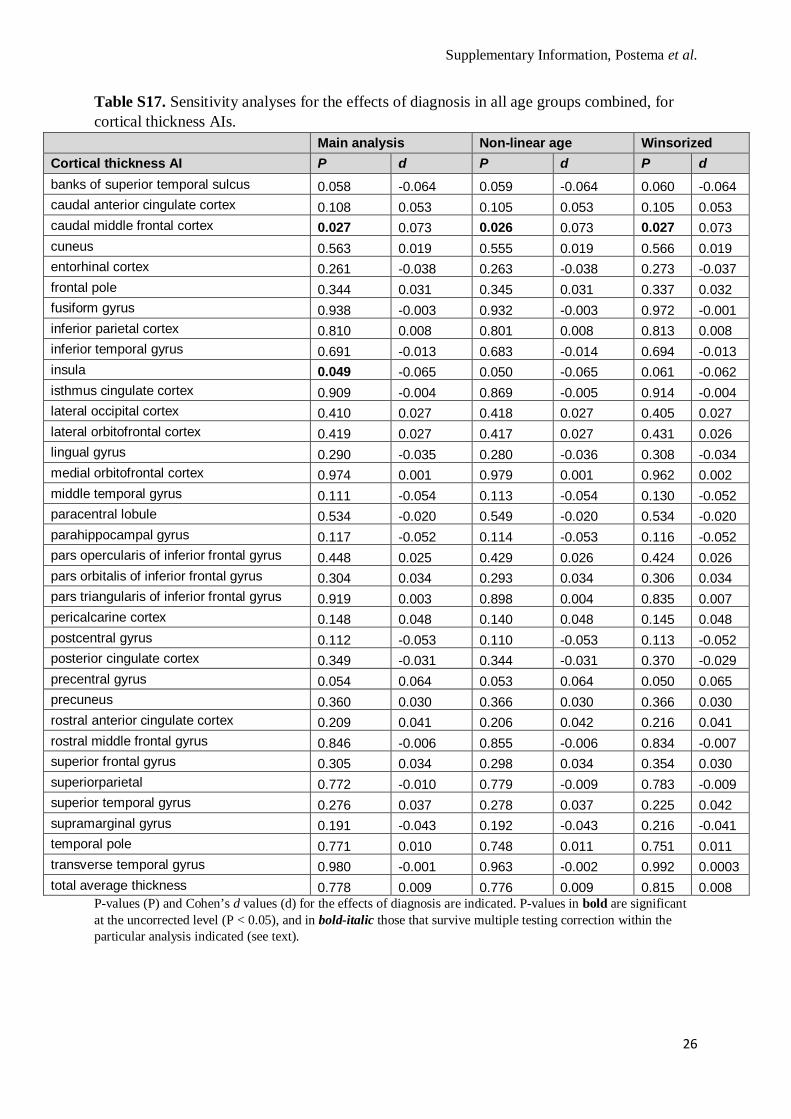
Table S17. Sensitivity analyses for the effects of diagnosis in all age groups combined, for cortical thickness AIs. ................................................................................................................................... 26
Table S18. Associations of subcortical volume AIs with disorder severity in ADHD individuals, all age groups combined. ....................................................................................................................... 27
Table S19. Associations of cortical surface area AIs with disorder severity in ADHD individuals, all age groups combined. ....................................................................................................................... 28
Table S20. Associations of cortical thickness AIs with disorder severity in ADHD individuals, all age groups combined. .............................................................................................................................. 29
Table S21. Associations of subcortical volume AIs with psychostimulant medication use in ADHD individuals, all age groups combined. ................................................................................................ 30
Table S22. Associations of cortical surface area AIs with psychostimulant medication use in ADHD individuals, all age groups combined. ................................................................................................ 31
Table S23. Associations of cortical thickness AIs with psychostimulant medication use in ADHD individuals, all age groups combined. ................................................................................................ 32
Supplementary Information, Postema et al.
2
Table S24 Associations of subcortical volume AIs with comorbidities in ADHD individuals, all age groups combined. .............................................................................................................................. 33
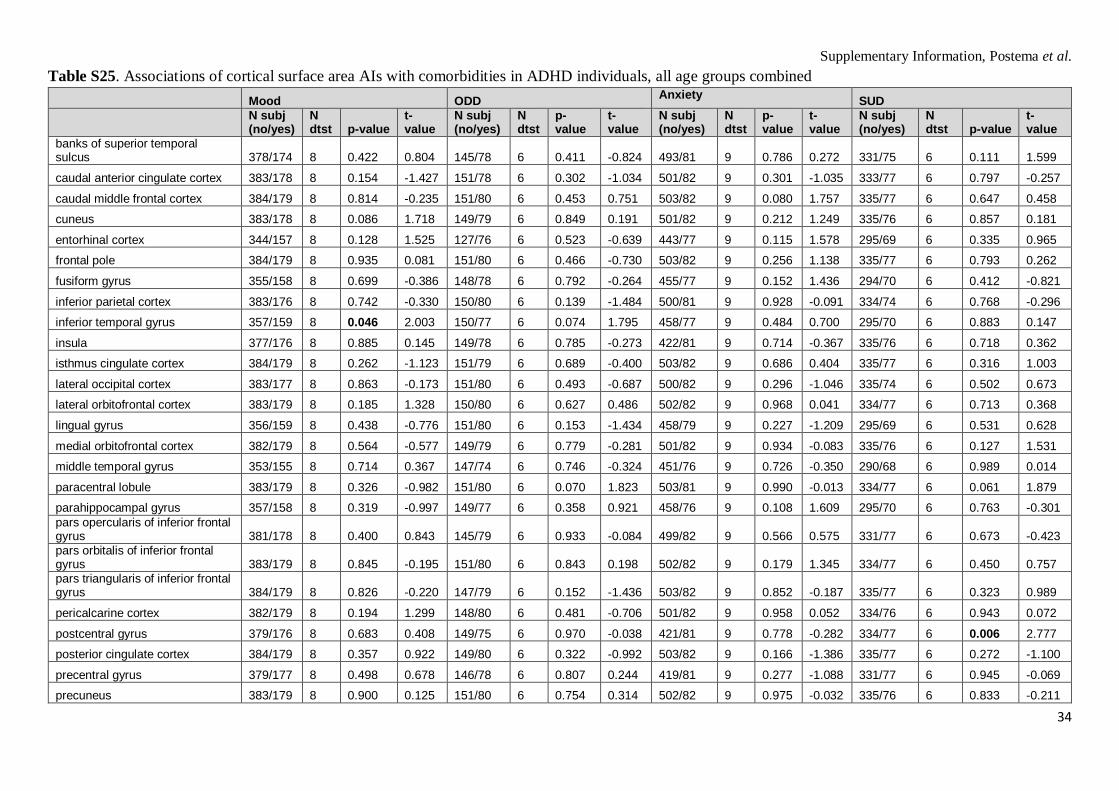
Table S25. Associations of cortical surface area AIs with comorbidities in ADHD individuals, all age groups combined............................................................................................................................... 34
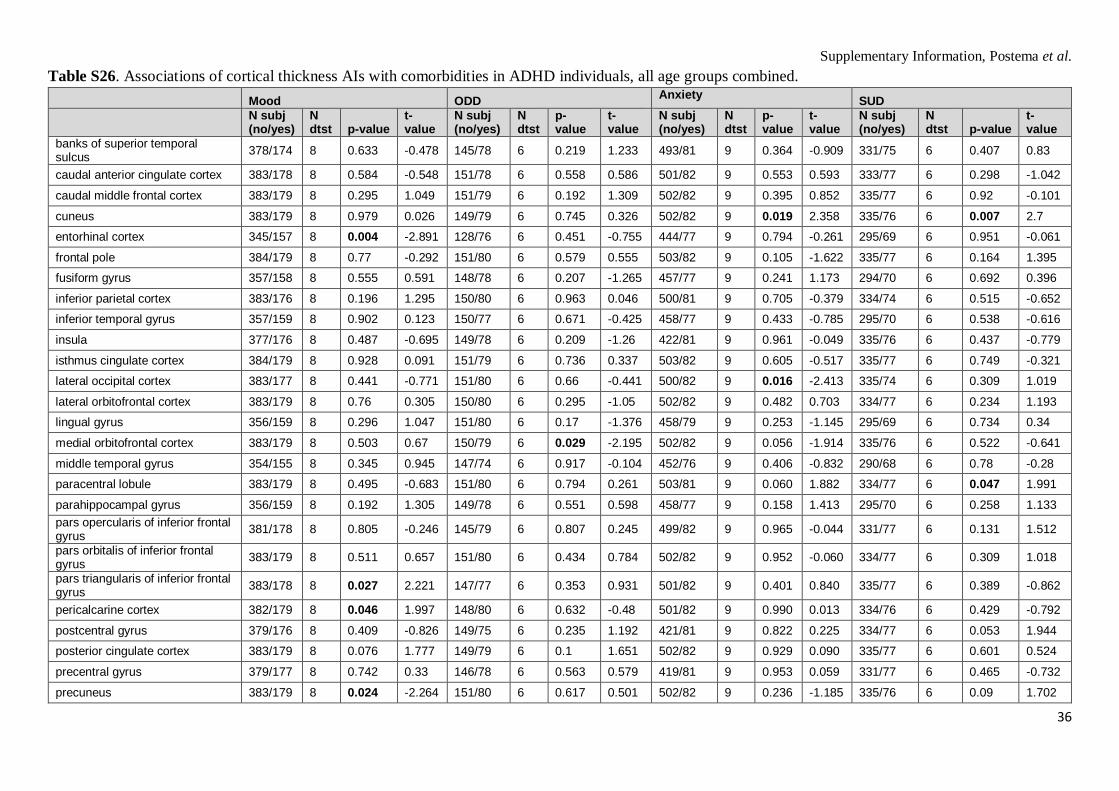
Table S26. Associations of cortical thickness AIs with comorbidities in ADHD individuals, all age groups combined. .............................................................................................................................. 36
Table S27. Associations of subcortical volume AIs with IQ in all age groups combined.................... 38
Table S28. Associations of cortical surface area AIs with IQ in all age groups combined. ................. 39
Table S29. Associations of cortical thickness AIs with IQ in all age groups combined. ..................... 40
Figure S1. Joyplot of the distributions of AIs in the total study sample (without winsorization), in ADHD cases and controls. ................................................................................................................ 41
Figure S2. Correlations between AIs of subcortical volumes in the total study sample, as well as in cases and controls.. ........................................................................................................................... 42
Figure S3. Correlations between AIs of cortical surface areas in the total study sample, cases, and controls.. ........................................................................................................................................... 43
Figure S4. Correlations between AIs of cortical thickness in the total study sample, cases, and controls.. ........................................................................................................................................... 44
Figure S5. Residual plots of the linear mixed effects model analysis of subcortical volume AIs in the total study sample.. ........................................................................................................................... 45
Figure S6. Residual plots of the linear mixed effects model analysis of cortical surface area AIs and the AI of the total average surface area (totalsurf) in the total study sample. ...................................... 46
Figure S7. Residual plots of the linear mixed effects model analysis of cortical thickness AIs and the AI of the total average thickness (totalthick) in the total study sample. .............................................. 47
Figure S8. Scatter plots of the relationship between age and AIs of the subcortical volumes. ............ 48
Figure S9. Scatter plots of the relationship between age and AIs of the cortical surface areas. ........... 49
Figure S10. Scatter plots of the relationship between age and AIs of the cortical thickness. .............. 50
Figure S11. Distributions of age, sex, handedness, IQ and ICV in ADHD and controls ..................... 51
Figure S12. Distributions within ADHD cases of hyperactivity/impulsivity symptom scores, inattention symptom scores, medication status, and comorbidity status .............................................. 52
Figure S13. Bar plots of the Cohen’s d effect sizes for diagnosis in the different age groups analyzed.. ......................................................................................................................................................... 53
Supplementary Methods ENIGMA MRI quality control Visual inspection of both internal and external Freesurfer segmentations was done per site. All sites followed the standardized ENIGMA protocols that are publicly available on http://enigma.ini.usc.edu/protocols/imaging-protocols. In short, outliers were determined by calculating the interquartile range (IQR) for each of the values per cohort and per diagnostic group (ADHD and Controls). Values that were above or below 1.5 times the IQR were identified as an outlier, and were visually inspected (3D) by the researcher. When a segmentation failure was identified, all values from the affected regions were excluded from further analyses. Additionally, cortical segmentations were overlayed on T1 images of the subjects. Webpages were generated with snapshots from internal slices, and also with external views of the segmentation from different angles. All sites were provided with the manual on how to judge these images, including the most common segmentation errors. Cohen’s d calculation The t-statistic for the factor ‘diagnosis’ in each linear mixed effects model was derived and used to calculate Cohen’s d, with
𝑑𝑑 = t∗ (n1+n2)�(𝑛𝑛1∗𝑛𝑛2) ∗�𝑑𝑑𝑑𝑑
where 𝑛𝑛1 and 𝑛𝑛2 are the number of cases and controls, and 𝑑𝑑𝑑𝑑 the degrees of freedom. The latter was derived from the lme summary table in R, but can also be calculated using 𝑑𝑑𝑑𝑑 =𝑜𝑜𝑜𝑜𝑜𝑜 − (𝑥𝑥1 + 𝑥𝑥2), wherein 𝑜𝑜𝑜𝑜𝑜𝑜 equals the number of observations, 𝑥𝑥1 the number of groups and 𝑥𝑥2 the number of factors in the model.
The 95% confidence intervals for Cohen's d were calculated using 95% 𝐶𝐶𝐶𝐶 = 𝑑𝑑 ± 1.96 ∗ 𝑆𝑆𝑆𝑆, with the standard error (SE) around Cohen's d calculated according to:
𝑆𝑆𝑆𝑆 = �𝑛𝑛1+𝑛𝑛2𝑛𝑛1∗𝑛𝑛2
+ 𝑑𝑑2
2∗(𝑛𝑛1+𝑛𝑛2−2)
Additional traits IQ was assessed differently per dataset, but most frequently using an age-appropriate version of the Wechsler intelligence scales (Supplementary Table S1). Comorbidity was most often assessed by means of the Structural Clinical Interview for DSM-IV Axis I Disorders (SCID) (1), or using the Schedule for Affective Disorders and Schizophrenia for School-Age Children Present and Lifetime Version (KSADS-PL) (2) (Supplementary Table S1). ADHD severity was assessed based on the Conners questionnaires (3), and included hyperactivity/impulsivity and inattention scores, which were tested for associations with brain asymmetries in separate models.
The use of psychostimulant medication was recorded in two different ways: current use at the time of scanning (‘currently using stimulants’ versus ‘not currently using stimulants’), or else in terms of lifetime use (‘ever used stimulants’ versus ‘never used stimulants’). Handedness was assessed in different ways across datasets, most often using the Edinburgh handedness questionnaire (4) (Supplementary Table S1). Most sites provided handedness data as a binary variable, which we coded 0=left, 1=right. For the NY200 dataset we binarized continuous data from the Edinburgh inventory: left-handers < -0.25 and right-handers >0.25, with those in between assigned as missing.
Supplementary Information, Postema et al.
5
Table S1. Characteristics of the different datasets Sample name
1 Included in the mega-analysis by Douglas et al. (2018), mentioned in the introduction. 2 Only cortical data available for these datasets. F=FreeSurfer version; FS= Field Strength.
Supplementary Information, Postema et al.
11
Table S2. Full linear model results for the subcortical volume AIs in children Subcortical volume AI
beta-coefficient Standard Error t-value p-value Cohen’s d (95% CI)
N cases/ controls diag sex age diag sex age diag sex age diag sex age diag
P-values in bold are significant at the uncorrected level (P < 0.05 and in bold-italic those that survive multiple testing correction within the particular analysis indicated (see text). 1Thalamus volume was not available from the NIH dataset.
Supplementary Information, Postema et al.
12
Table S3. Full linear model results for the cortical surface area AIs in children Cortical surface area AI beta-coefficient Standard Error t-value p-value Cohen’s d
(95% CI) N cases /
controls diag sex age diag sex age diag sex age diag sex age diag
P-values in bold are significant at the uncorrected level (P < 0.05), and in bold-italic those that survive multiple testing correction within the particular analysis indicated (see text).
Supplementary Information, Postema et al.
13
Table S4. Full linear model results for the cortical thickness AIs in children
P-values in bold are significant at the uncorrected level (P < 0.05), and in bold-italic those that survive multiple testing correction within the particular analysis indicated (see text).
Cortical thickness AI beta-coefficient Standard Error t-value p-value Cohen’s d (95% CI)
N cases / controls diag sex age diag sex age diag sex age diag sex age diag
Table S5. Full linear model results for the subcortical volume AIs in adolescents
P-values in bold are significant at the uncorrected level (P < 0.05 and in bold-italic those that survive multiple testing correction within the particular analysis indicated (see text). 1Thalamus volume was not available from the NIH dataset.
Subcortical volume AI
beta-coefficient Standard Error t-value p-value Cohen’s d (95% CI)
N cases/ controls diag sex age diag sex age diag sex age diag sex age diag
Table S6. Full linear model results for the cortical surface area AIs in adolescents Cortical surface area AI beta-coefficient Standard Error t-value p-value Cohen’s d
(95% CI) N cases /
controls diag sex age diag sex age diag sex age diag sex age diag
P-values in bold are significant at the uncorrected level (P < 0.05), and in bold-italic those that survive multiple testing correction within the particular analysis indicated (see text).
Supplementary Information, Postema et al.
16
Table S7. Full linear model results for the cortical thickness AIs in adolescents.
P-values in bold are significant at the uncorrected level (P < 0.05), and in bold-italic those that survive multiple testing correction within the particular analysis indicated (see text).
Cortical thickness AI beta-coefficient Standard Error t-value p-value Cohen’s d (95% CI)
N cases / controls diag sex age diag sex age diag sex age diag sex age diag
P-values in bold are significant at the uncorrected level (P < 0.05), and in bold-italic those that survive multiple testing correction within the particular analysis indicated (see text). 1Thalamus volume was not available from the NIH dataset.
Supplementary Information, Postema et al.
18
Table S9. Full linear model results for the cortical surface area AIs in adults Cortical surface area AI beta-coefficient Standard Error t-value p-value Cohen’s d
(95% CI) N cases /
controls diag sex age diag sex age diag sex age diag sex age diag
P-values in bold are significant at the uncorrected level (P < 0.05), and in bold-italic those that survive multiple testing correction within the particular analysis indicated (see text).
Supplementary Information, Postema et al.
19
Table S10. Full linear model results for the cortical thickness AIs in adults Cortical thickness AI beta-coefficient Standard Error t-value p-value Cohen’s d
(95% CI) N cases /
controls diag sex age diag sex age diag sex age diag sex age diag
P-values in bold are significant at the uncorrected level (P < 0.05), and in bold-italic those that survive multiple testing correction within the particular analysis indicated (see text).
Supplementary Information, Postema et al.
20
Table S11. Full linear model results for the subcortical volume AIs in all age groups combined. Subcortical volume AI
beta-coefficient Standard Error t-value p-value Cohen’s d (95% CI)
N cases/ controls diag sex age diag sex age diag sex age diag sex age diag
P-values in bold are significant at the uncorrected level (P < 0.05), and in bold-italic those that survive multiple testing correction within the particular analysis indicated (see text). 1Thalamus volume was not available from the NIH dataset
Supplementary Information, Postema et al.
21
Table S12. Full linear model results for the cortical surface area AI in all age groups combined.
P-values in bold are significant at the uncorrected level (P<0.05), and in bold-italic those that survive multiple testing correction within the particular analysis indicated (see text).
Surface area AI beta-coefficient Standard Error t-value p-value Cohen’s d (95% CI)
N cases / controls diag sex age diag sex age diag sex age diag sex age diag
Table S13. Full linear model results for the cortical thickness AIs in all age groups combined. Thickness AI beta-coefficient Standard Error t-value p-value Cohen’s d
(95% CI) N cases /
controls diag sex age diag sex age diag sex age diag sex age diag
P-values in bold are significant at the uncorrected level (P < 0.05), and in bold-italic those that survive multiple testing correction within the particular analysis indicated (see text).
Supplementary Information, Postema et al.
23
Table S14 Directions of asymmetry changes in ADHD individuals versus controls for those AIs that had shown nominally significant (P<0.05) associations with diagnosis in any of the main analyses.
The raw means and standard deviations are indicated, as well as the Cohen’s d effect sizes for left and right hemispheric measures (i.e., when left or right hemispheric measures were analyzed separately as dependent variables). Additionally, the average direction of asymmetry in controls (derived from the raw mean AI) and its change in ADHD is shown. Positive AI values indicate leftward asymmetry, negative AI values indicate rightward asymmetry.
Supplementary Information, Postema et al.
24
Table S15. Sensitivity analyses for the effects of diagnosis in all age groups combined, for subcortical volume AIs.
Main analysis Non-linear age Winsorized Subcortical volume AI P d P d P d Accumbens 0.321 -0.035 0.324 -0.035 0.311 -0.036 Amygdala 0.606 -0.018 0.605 -0.018 0.682 -0.014 Caudate Nucleus 0.407 0.029 0.412 0.029 0.411 0.029 Globus Pallidus 0.010 -0.091 0.011 -0.090 0.010 -0.091 Hippocampus 0.616 0.018 0.617 0.018 0.524 0.022 Putamen 0.263 -0.040 0.260 -0.040 0.359 -0.032 Thalamus1 0.146 0.053 0.149 0.053 0.137 0.055
P-values (P) and Cohen’s d values (d) for the effects of diagnosis are indicated. P-values in bold are significant at the uncorrected level (P < 0.05), and in bold-italic those that survive multiple testing correction within the particular analysis indicated (see text). 1Thalamus volume was not available from the NIH dataset
.
Supplementary Information, Postema et al.
25
Table S16. Sensitivity analyses for the effects of diagnosis in all age groups combined, for cortical surface area AIs.
P-values (P) and Cohen’s d values (d) for the effects of diagnosis are indicated. P-values in bold are significant at the uncorrected level (P < 0.05), and in bold-italic those that survive multiple testing correction within the particular analysis indicated (see text).
Supplementary Information, Postema et al.
26
Table S17. Sensitivity analyses for the effects of diagnosis in all age groups combined, for cortical thickness AIs.
P-values (P) and Cohen’s d values (d) for the effects of diagnosis are indicated. P-values in bold are significant at the uncorrected level (P < 0.05), and in bold-italic those that survive multiple testing correction within the particular analysis indicated (see text).
Supplementary Information, Postema et al.
27
Table S18. Associations of subcortical volume AIs with disorder severity in ADHD individuals, all age groups combined.
P-values (P) and t-values (t) for the effects of ADHD severity, as measured by hyperactivity/impulsivity and inattention symptoms, are indicated. P-values in bold are significant at the uncorrected level (P < 0.05), and in bold-italic those that survive multiple testing correction within the particular analysis indicated (see text). 1Thalamus volume was not available from the NIH dataset
Region Hyperactivity/impulsivity Inattention N subjects Ndtst p-value t-value N subjects Ndtst p-value t-value
Table S19. Associations of cortical surface area AIs with disorder severity in ADHD individuals, all age groups combined.
P-values (P) and t-values (t) for the effects of ADHD severity, as measured by hyperactivity/impulsivity and inattention symptoms, are indicated. P-values in bold are significant at the uncorrected level (P < 0.05), and in bold-italic those that survive multiple testing correction within the particular analysis indicated (see text).
Region
Hyperactivity/impulsivity Inattention N subjects Ndtst p-value
transverse temporal gyrus 322 7 0.637 -0.472 322 7 0.067 -1.836 total average surface area 322 7 0.812 -0.238 322 7 0.430 0.791
Supplementary Information, Postema et al.
29
Table S20. Associations of cortical thickness AIs with disorder severity in ADHD individuals, all age groups combined.
P-values (P) and t-values (t) for the effects of ADHD severity, as measured by hyperactivity/impulsivity and inattention symptoms, are indicated. P-values in bold are significant at the uncorrected level (P < 0.05), and in bold-italic those that survive multiple testing correction within the particular analysis indicated (see text).
Region
Hyperactivity/impulsivity Inattention N subjects Ndtst p-value t-value
total average thickness 322 7 0.113 1.591 322 7 0.486 0.697
Supplementary Information, Postema et al.
30
Table S21. Associations of subcortical volume AIs with psychostimulant medication use in ADHD individuals, all age groups combined.
P-values (P) and t-values (t) for the effects of current and lifetime psychostimulant medication use are indicated. P-values in bold are significant at the uncorrected level (P < 0.05), and in bold-italic those that survive multiple testing correction within the particular analysis indicated (see text). 1Thalamus volume was not available from the NIH dataset
Region
Lifetime medication use Current medication use N subjects (no/yes)
Table S22. Associations of cortical surface area AIs with psychostimulant medication use in ADHD individuals, all age groups combined.
P-values (P) and t-values (t) for the effects of current and lifetime psychostimulant medication use are indicated. P-values in bold are significant at the uncorrected level (P < 0.05), and in bold-italic those that survive multiple testing correction within the particular analysis indicated (see text).
Region
Lifetime medication use Current medication use N subjects (no/yes)
temporal pole 188/337 9 0.700 -0.386 377/360 15 0.401 -0.840
transverse temporal gyrus 188/337 9 0.182 -1.335 377/361 15 0.020 -2.336 total average surface area 188/337 9 0.919 0.102 377/361 15 0.140 -1.477
Supplementary Information, Postema et al.
32
Table S23. Associations of cortical thickness AIs with psychostimulant medication use in ADHD individuals, all age groups combined.
P-values (P) and t-values (t) for the effects of current and lifetime psychostimulant medication use are indicated. P-values in bold are significant at the uncorrected level (P < 0.05), and in bold-italic those that survive multiple testing correction within the particular analysis indicated (see text)
Region
Lifetime medication use Current medication use N subjects (no/yes)
Table S24 Associations of subcortical volume AIs with comorbidities in ADHD individuals, all age groups combined.
P-values (P) and t-values (t) for the effects of ADHD comorbidities are indicated. P-values in bold are significant at the uncorrected level (P < 0.05), and in bold-italic those that survive multiple testing correction within the particular analysis indicated (see text). 1Thalamus volume was not available from the NIH dataset. subj=subjects; dtst=dataset
P-values (P) and t-values (t) for the effects of ADHD comorbidities are indicated. P-values in bold are significant at the uncorrected level (P < 0.05), and in bold-italic those that survive multiple testing correction within the particular analysis indicated (see text). subj=subjects; dtst=dataset
P-values (P) and t-values (t) for the effects of ADHD comorbidities are indicated. P-values in bold are significant at the uncorrected level (P < 0.05), and in bold-italic those that survive multiple testing correction within the particular analysis indicated (see text). subj=subjects; dtst=dataset.
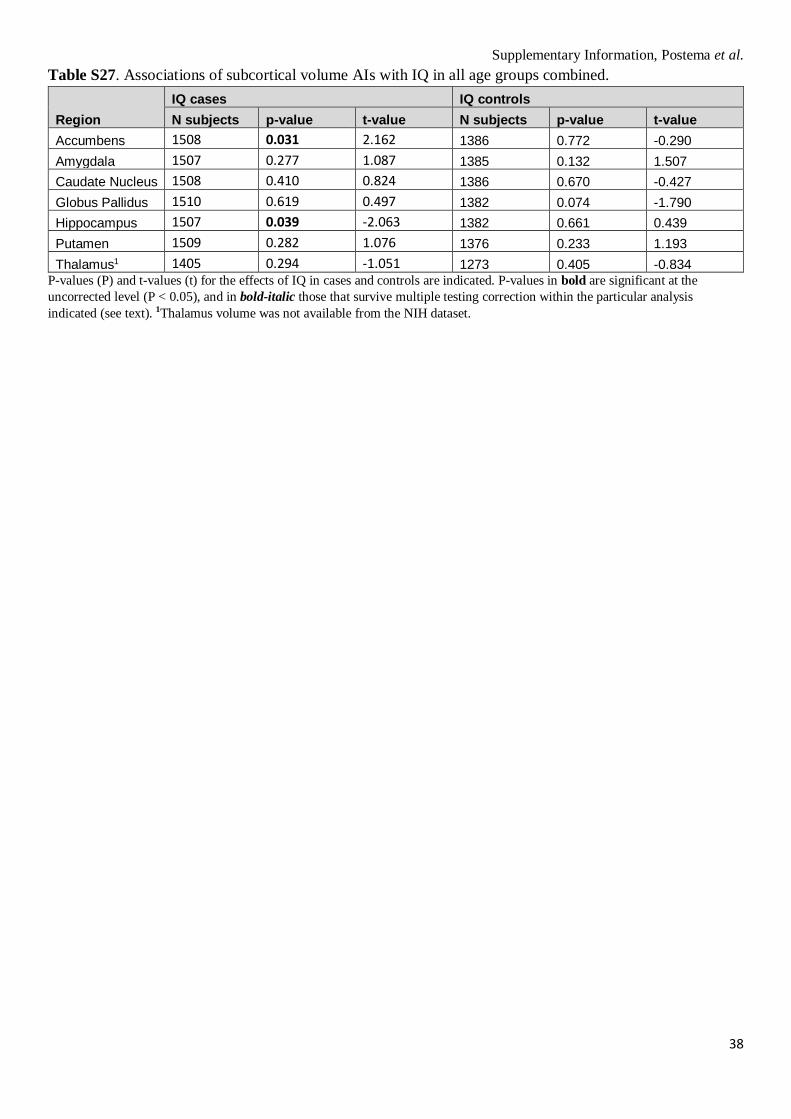
Table S27. Associations of subcortical volume AIs with IQ in all age groups combined.
P-values (P) and t-values (t) for the effects of IQ in cases and controls are indicated. P-values in bold are significant at the uncorrected level (P < 0.05), and in bold-italic those that survive multiple testing correction within the particular analysis indicated (see text). 1Thalamus volume was not available from the NIH dataset.
Region IQ cases IQ controls N subjects p-value t-value N subjects p-value t-value
Table S28. Associations of cortical surface area AIs with IQ in all age groups combined.
P-values (P) and t-values (t) for the effects of IQ in cases and controls are indicated. P-values in bold are significant at the uncorrected level (P < 0.05), and in bold-italic those that survive multiple testing correction within the particular analysis indicated (see text).
Region IQ cases IQ controls N subjects p-value t-value N subjects p-value t-value
Table S29. Associations of cortical thickness AIs with IQ in all age groups combined.
P-values (P) and t-values (t) for the effects of IQ in cases and controls are indicated. P-values in bold are significant at the uncorrected level (P < 0.05), and in bold-italic those that survive multiple testing correction within the particular analysis indicated (see text).
Region IQ cases IQ controls N subjects p-value t-value N subjects p-value t-value
Figure S1. Joyplot of the distributions of AIs in the total study sample (without winsorization), in ADHD cases (right) and controls (left). Shown for subcortical volumes (cyan), cortical surface areas (orange), and cortical thicknesses (red).
Supplementary Information, Postema et al.
42
Figure S2. Correlations between AIs of subcortical volumes in (A) the total study sample, as well as in (B) cases and (C) controls. Correlations ranged from -0.30 (between globus pallidus and thalamus) to 0.17 (between globus pallidus and putamen). Negative correlations are in orange and positive correlations are in purple. Color intensities and circle sizes are proportional to the magnitudes of the correlation coefficients, where the area of the circles scales with the absolute value of the corresponding correlation coefficients.
Supplementary Information, Postema et al.
43
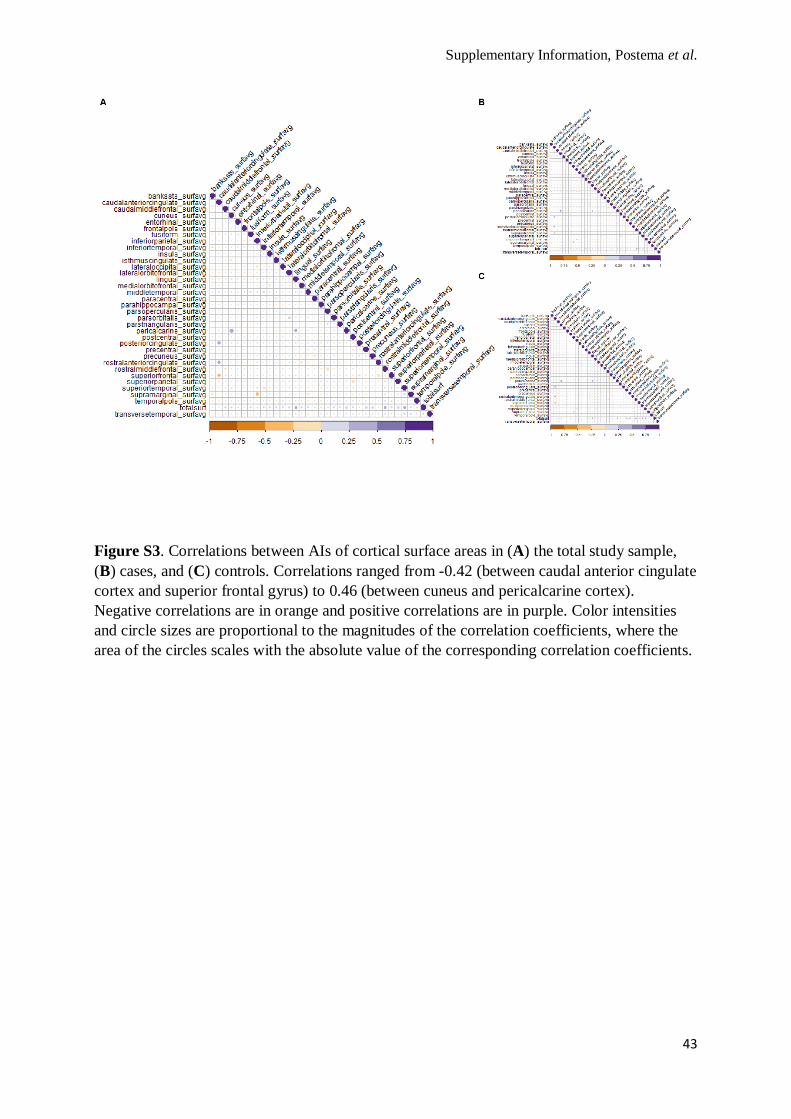
Figure S3. Correlations between AIs of cortical surface areas in (A) the total study sample, (B) cases, and (C) controls. Correlations ranged from -0.42 (between caudal anterior cingulate cortex and superior frontal gyrus) to 0.46 (between cuneus and pericalcarine cortex). Negative correlations are in orange and positive correlations are in purple. Color intensities and circle sizes are proportional to the magnitudes of the correlation coefficients, where the area of the circles scales with the absolute value of the corresponding correlation coefficients.
Supplementary Information, Postema et al.
44
Figure S4. Correlations between AIs of cortical thickness in (A) the total study sample, (B) cases, and (C) controls. Correlations ranged from -0.11 (between lateral occipital cortex and rostral middle frontal cortex) to 0.49 (between rostral middle frontal cortex and total average thickness). Negative correlations are in orange and positive correlations are in purple. Color intensities and circle sizes are proportional to the magnitudes of the correlation coefficients, where the area of the circles scales with the absolute value of the corresponding correlation coefficients.
Supplementary Information, Postema et al.
45
Figure S5. Residual plots of the linear mixed effects model analysis of subcortical volume AIs in the total study sample. The ggplot2 package in R was used to visualize residuals.
Supplementary Information, Postema et al.
46
Figure S6. Residual plots of the linear mixed effects model analysis of cortical surface area AIs and the AI of the total average surface area (totalsurf) in the total study sample. The ggplot2 package in R was used to visualize residuals.
Supplementary Information, Postema et al.
47
Figure S7. Residual plots of the linear mixed effects model analysis of cortical thickness AIs and the AI of the total average thickness (totalthick) in the total study sample. The ggplot2 package in R was used to visualize residuals.
Supplementary Information, Postema et al.
48
Figure S8. Scatter plots of the relationship between age and AIs of the subcortical volumes.
Supplementary Information, Postema et al.
49
Figure S9. Scatter plots of the relationship between age and AIs of the cortical surface areas.
Supplementary Information, Postema et al.
50
Figure S10. Scatter plots of the relationship between age and AIs of the cortical thickness.
Supplementary Information, Postema et al.
51
Figure S11. Distributions of (A) age, (B) sex (C) handedness, (D) IQ and (E) ICV in ADHD and controls, colored by children (orange), adolescents (blue) and adults (green)
Supplementary Information, Postema et al.
52
Figure S12. Distributions within ADHD cases of (A) hyperactivity/impulsivity symptom scores, (B) inattention symptom scores, (C-D) medication status (ever used stimulants (C) and currently using stimulants and (D)), and (E-H) comorbidity status ((E) anxiety disorder, (F) mood disorder, (G) obsessive compulsive disorder, and (H) substance use disorder), colored by children (orange), adolescents (blue) and adults (green)
Supplementary Information, Postema et al.
53
Figure S13. Bar plots of the Cohen’s d effect sizes for diagnosis in the different age groups analyzed. Shown are only those AIs that showed a nominally significant effect of diagnosis in any of the analyses. All Cohen’s d values above zero represent a mean shift towards greater leftward or reduced rightward asymmetry in ADHD compared to controls, and those below zero represent mean shifts towards greater rightward of reduced leftward asymmetry in ADHD compared to controls. The different age groups are shown in different colors: orange = children; blue = adolescents; green = adults; yellow = all age groups combined. The solid vertical lines reflect the error bars, indicating the 95% CI interval around Cohen’s d, and the dotted vertical lines separate the different types of measure (i.e., thickness AIs, surface area AIs, subcortical volume AIs).
Supplementary Information, Postema et al.
54
Supplementary References
1. Spitzer RL, Williams JB, Gibbon M, First MB. The Structured Clinical Interview for DSM-III-R (SCID). I: History, rationale, and description. Arch Gen Psychiatry. 1992;49(8):624-9. 2. Kaufman J, Birmaher B, Brent D, Rao U, Flynn C, Moreci P, et al. Schedule for Affective Disorders and Schizophrenia for School-Age Children-Present and Lifetime Version (K-SADS-PL): initial reliability and validity data. Journal of the American Academy of Child and Adolescent Psychiatry. 1997;36(7):980-8. 3. Conners CK. Rating scales in attention-deficit/hyperactivity disorder: use in assessment and treatment monitoring. J Clin Psychiatry. 1998;59 Suppl 7:24-30. 4. Oldfield RC. The assessment and analysis of handedness: the Edinburgh inventory. Neuropsychologia. 1971;9(1):97-113.