Supplementary InformationIntegrated Immunoisolation and Protein Analysis of Circulating
Exosomes Using Microfluidic TechnologyMei Hea†, Jennifer Crowa, Marc Rotha, Yong Zengb* and Andrew K. Godwinac*
a Department of Pathology and Laboratory Medicine, University of Kansas Medical Center, Kansas City, KS 66160. Fax: (913) 945-6373; Tel: (913) 945-6327; E-mail: [email protected] Department of Chemistry, Ralph N Adams Institute for Bioanalytical Chemistry, and Bioengineering Graduate Program, University of Kansas, Lawrence, KS 66045. Fax: (785) 864-5396; Tel: (785) 864-8105; E-mail: [email protected] University of Kansas Cancer Center, Kansas City, KS 66160. † Current address: Department of Biological and Agricultural Engineering, Kansas State University, Olathe, KS 66061.
Materials and MethodsReagents, chemicals, and antibodies. The stock solution of 10% Triton X-100 was purchased from Roche Diagnostics for making exosome lysis buffer. The fluorogenic substrate DiFMUP (6,8-difluoro-4-methylumbelliferyl phosphate) was purchased from Invitrogen, stored in DMSO solution in dark in a -20 C freezer, and freshly prepared before each use. The recombinant standard human IGF-1R and phosphorylated IGF-1R proteins were purchased from R&D system. The antibodies used in the study have been listed in Table S1. The crossreactivity of antibodies from different vendors against -IGF-1R and phospho-IGF-1R has been tested using a ELISA kit (Insulin Receptor β-subunit KHR9111, Invitrogen) to ensure the antibody specificity to IGF-1R.
Table S1. The list of antibodies used in this studyNo. Target/human Vendor Catalog No Clone1 IGF-1R-biotin Bioss bs-0227R-Biotin/poly rabbit2 Total IGF-1R-biotin R & D DYC305-2/poly rabbit3 IGF-1R β Cell signaling #3027/poly rabbit4 IGF-1R R & D MAB391/mono mouse 332555 IGF-1R(pTyr1165/1166) Enogene E011088-1/poly rabbit6 IGF-1R(pTyr1161) Acris AP01610PU-N/poly rabbit
Microfabrication. The microfluidic exosome profiling device was composed of a poly(dimethylsiloxane) (PDMS) layer sealed with a glass slide. The PDMS device was fabricated using the standard soft lithography. A master was made by patterning SU8 photoresist on a 4-inch silicon wafer and was silanized to facilitate removal of PDMS. Negative PDMS replicas were made by pouring a 10:1 mixture of PDMS base with the curing agent over the wafer, followed by curing at 60 °C overnight. After removing the replicas from the master, the fluidic interfacing holes were punched at desired location. The PDMS layer was bonded to a clean glass substrate to form the enclosed microchannels immediately after exposing to UV Ozone for 3 min. The deactivation of PDMS microfluidic channel was conducted using (3-aminopropyl) trimethoxy silane treatment. Briefly, the PDMS microfluidic channel was continuously flushed with a mixture of H2O/H2O2/HCl (volume ratio of 5:1:1) for 30 min to obtain the hydrophilic silanol-covered surface. After purging the microchannel with deionized water and dry Ar, the neat (3-aminopropyl) trimethoxy silane (Sigma-Aldrich) was pumped into the microchannel at room temperature for 10 min. The unreacted silane was flushed out using deionized water mixed with ethanol (1:1) to generate hydrophilic surface. The non-specific binding was further minimized by employing the blocking buffer (1% BSA containing 0.1 % Tween 20) and washing buffer (1× PBS buffer, 0.01% Tween 20).
Microfluidic exosome analysis protocol. The detailed protocol for on-chip exosome assay is illustrated in Table S2. Reagent delivery was precisely controlled using a 4-syringe programmable pump system (HARVARD Pump11 Elite). Plasma samples (30-150 µL) pre-mixed with immunomagnetic microbeads were introduced through the inlet 1 into the first-stage magnetic capture chamber at a flow rate of 2 µL/min for the immunomagnetic isolation of exosomes (Step 1). A lysis buffer was then flowed into the first-stage magnetic chamber and stopped for incubation with the beads to completely lyze the exosomes (Step 2). The lysate in the first-stage magnetic capture chamber was subsequently flowed into the serpentine mixing microchannels for immunomagnetic capture of released exosomal protein markers (Step 3). Protein capture microbeads were then collected at the second-stage magnetic chamber for sandwich immunodetection using the diluted primary detection antibodies (1:100) (inlet 3, Step 4). The secondary antibody anti-rabbit IgG-AP (1:100 dilution) was introduced (inlet 3, Step 5), followed by the introduction of the fluorogenic substrate DiFMUP for quantitative and sensitive chemifluorescence detection (inlet 4, Step 6).
Flow rate 2 µL/min 1 µL/min 1 µL/min 1 µL/min 1 µL/min 1 µL/minDuration 15 min 5 min 30 min 10 min 10 min 5 min
The washing buffer has been optimized to minimize bead aggregation and non-specific adsorption while maintaining the integrity of captured exosomes. Tween 20 is a commonly used non-ionic surfactant for immunoassays and has been reported as a buffer addictive at low concentrations (0.05%) for exosome processing and analysis1. We have tested 1x PBS buffer with Tween 20 at different concentrations (0, 0.01%, 0.1%, 1%) and observed that 0.01% tween 20 can effectively remove non-specific adsorption (Figure 2 in the main text) and prevent the formation of bead aggreagtion and protein/vesicle clumps which otherwise were often observed
Anti-rabbit IgG-AP A&B T2191
3
during magnetic capture without Tween 20 added. Through TEM examination, it was observed that the captured exosomes remain intact. The washing buffer (1PBS, 0.01% Tween 20) was employed for 5 min between each step. To maximize the recovery of released exosomal proteins, a total volume of 30 µL buffer was continuously infused to wash the exosome-binding beads captured in the first chamber and then mixed with the protein-binding beads, which were finally collected in the second chamber for downstream protein assays (Table S1).
Movie S1. The device architecture and workflow of microfluidic immunomagnetic beads manipulation for exosome profiling. The field of view was highlighted in the movie. The microscope stage was moved to observe in the order of injection channel, the first-stage magnetic capture chamber, serpentine mixing microchannel, and the second magnetic capture chamber. The two cascading magnetic-bead capture chambers are of 4-mm diameter and are capable of capturing up to 109 2.8 µm microbeads each. The length of the serpentine channel is 25 cm.
Immunomagnetic beads and antibody coupling. Streptavidin-coated magnetic microbeads (Dynal beads M-270, 2.8 µm in diameter) were purchased from Invitrogen. Antibodies against α-IGF-1R, EpCAM, CD9, CD81, and CD63 (Table S1) were coupled to the Dynal beads through biotin-streptavidin linkage per the instruction, generating typical binding capacity of ~10 µg biotinylated antibody per 1 mg of beads. We pre-mixed 20 µL of antibody-coated beads (1 mg/mL) with 30-150 µL human plasma for 30 min, and then introduced the mixture into the microfluidic device. A disk magnet (Licensed NdFeB, Grade N40, 2-mm in diameter, poles on flat face) was used to retained the magnetic beads. The IGF-1R capture beads were generated by coupling mouse monoclonal IGF-1R antibody (R&D, MAB391) to surface-activated Dynabeads (M-270 Epoxy, 2.8 µm in diameter) through epoxy-amine covalent bonds. The epoxy coupling reaction was performed at 37˚C overnight with gentle shaking, following the manufactuer’s instruction. The typical binding capacity is ~5-8 µg antibody per 1 mg of beads.
Patient plasma and pissue samples. Human blood samples and tumor tissues were collected from healthy donors, NSCLC and ovarian cancer patients. De-identified samples were obtained from the University of Kansas Cancer Center’s Biospecimen Repository Core Facility after approval from the internal Human Subjects Committee.
Differential ultracentrifugation and Bradford assay. The exosome-like microvesicles were prepared from frozen blood plasma (2 mL) or cell culture media. The plasma was first centrifuged at 10,800 rpm for 45 min at 4C using an ultracentrifuge (Thermo Scientific SORVALL WX ULTRA series centrifuge). Supernatants were then purified by two successive centrifugations for 2 hours, each at 35,800 rpm. Pellets were washed once by ultracentrifugation in 20 µL PBS, and resuspended in 20 µL PBS. The amount of pellets recovered was measured by Bradford assay (BioRad). The Bradford reagent concentrate was diluted at 1:5 ratio and mixed with 10 µL of ultracentrifucation-collected pellets. BSA standards were used to calibrate total exosome protein contents. A UV spectrometer (Beckman DU640) was used to measure the UV absorbance at 595 nm of samples in disposable cuvettes for three times. The purified microvesicles were conserved at -80C until use.
Nanoparticle tracking analysis (NTA). Ultracentrifugation-purified vesicles were diluted in 1:50, 1:125, 1:250, and 1:500 in 1PBS buffer in molecular grade water. NanoSight LM10 with a monochomatic 404 nm (blue) laser (NanoSight) was used to perform size analysis of 300 μL of exosome samples. Video files of 30–60 s duration with a frame rate of 25 frame per second were recorded and analyzed using the Nanoparticle Tracking Analysis software version 2.3. By monitoring the trajectory of microvesicle movement, particle number and size
4
distribution within the range of 0-500 nm were estimated. For consistent reading, the measurement settings were optimized and five replicas were performed to obtain the averaged measurements.Transmission electron microscopy and image analysis. Compared to nanoparticle tracking analysis (NTA) by NanoSight which requires ~1 mL of concentrated vesicles (~109 mL-1) for accurate size determination, TEM provides a robust means for sizing and counting of exosomes in small-volumes collected from microfluidic isolation without significant dilution (~30 µL). A two-step embedding protocol using agar and resin was developed to ensure that exosome morphology was maximally maintained under TEM imaging. The exosome-bead complexes were fixed in 2% (v/v) glutaraldehyde in PBS for 1 h, followed by two 15-min washes in PBS. Beads were re-suspended in 4% agar. After cutting the agar into 1-mm pieces, the specimen was fixed overnight in 2% (w/v) osmium tetroxide in 0.1 M cacodylate buffer kept in refrigerator. The specimen was rinsed 2 times with distilled water for 15 min each. Then the specimen was dehydrated in a graded series of ethanol: 30% for 10 min, 70% for 10 min, 95% for 10 min, 100% for 30 min, 100% for 30 min. Then the specimen was placed into a graded series of mix of pure L.R. white (hard grade) and 100% ethanol: 1:2 for 30 min, 1:1 for 30 min, 2:1 for 30 min. Then three changes of ethanol-free pure L.R. white were conducted for 30 min, and kept overnight. The resin embedded specimen was polymerized at 60 oC for 24 h. Ultra-thin sections (80 nm) were cut on Leica Ultracut-S Ultramicrotome, and counterstained with 4% (w/v) aqueous uranyl acetate for 5 min, followed by 3 min with a solution of lead acetate. The stained sections were viewed in a JEOL JEM-1400 Transmission Electron Microscope (equipped with a Lab6 gun) operated at 80 kV. Micrographs were acquired at a known scale. The size of vesicles bound to the bead surface was measured using JEM-1400 TEM software with ruler function at 20 K magnification and normalized to the scale bar.
For TEM imaging of ultracentrifugation-purified exosomes without two-step embedding, a drop of purified exosome sample, approximately 10 g of the intact exosomes, was placed on a parafilm. A formvar carbon coated nickel grid on top of each drop was positioned gently on top of each drop for 30 minutes. The coating side is faced to the drop containing exosomes. Then the grid was washed by sequentially positioning on top of PBS drops for three times. The prepared sample was fixed by putting the grid on a drop of 2% paraformaldehyde, counterstained in 2% uranyl acetate for 15 minutes, embedded using 0.13% methyl cellulose and 0.4% uranyl acetate for 10- minute incubation, and then imaged by TEM.
Western blot analysis. Western blotting was performed using 4-12% precast polyacrylamide slab mini-gels (Tris-glycine pH 8.3) with Blot Module (BioRad), following the standard protocol. Exosome samples were lysed by adding running buffer (0.1% SDS) and heating at 65C for 5 min. After electrophoresis at 125 V for 2 h, gels were electrotransferred to cellulose membranes (0.2 µm) at 25 V for 2.5 h. After twice washing (1×PBS, 0.5% Tween 20, pH 7.4), the membranes were blocked with 5% dry milk overnight at 4C with shaking. The solution of primary antibody (1:1000) was added into blocking buffer for 2-h incubation with shaking at room temperature. After incubation, the membranes were washed 3 times for 10 min each. The secondary antibody streptavidin-HRP (Invitrogen, ELISA grade, 1.1 mg/mL) diluted 1:2500 in the blocking solution was added for 1-h incubation at room temperature with agitation. After that, the washing step was repeated three times. The membrane was subsequently developed with Chromogenic Substrate Reagent (BioRad) until the desired band intensity was achieved. Imaging was performed by using FluorChem E (ProteinSimple) with a appropriate filter.
Three-color Immunofluorescence histology (IFH) analysis. The three-color immunofluorescence staining was performed following the standard protocol. The fresh frozen lung tumor tissues were embeded in OCT compound in cryomolds and cut into 4 µm thick cryostat sections, and mounted on superfrost plus slides. Before staining, slides were placed at room temperature for 30 min, and fixed in ice cold acetone for 5 min. After 30-min air dry, slides were rinsed with PBS-T buffer for 2 min and repeated once. 1% bovine serum albumin was used to block the tissue sections for 30 min. Lung tumor tissues exhibit strong natural biotin, thus the tissue sections were blocked with avidin and biotin solution sequentially (SP-2001, Vector Laboratories Inc) for 15 min each, and rinsed twice in PBS-T buffer for 2 min each. The primary antibodies (biotinylated mouse monoclonal anti α-IGF-1R, EpCAM, CD9, CD81, CD63) were added at 1:100 dilution. The negative control was the omission of primary antibody. The incubation was conducted overnight at 4C. After washing with PBS-T, 0.4 µM DAPI (sc-3598, Santa Cruz Biotechnology) in PBS, avidin-FITC (1:3000, MBS538905, MyBioSource), and positive control antibody CDK2 (1:50, sc-748 Santa Cruz Biotechnology) were incubated sequentially with the tissue sections.
5
The secondary detection antibody goat anti-rabbit IgG (F(ab’)2-PE-Cy5 (1:100, sc-3844, Santa Cruz Biotechnology) was incubated with sections for 1 hour after washing. After staining, the sections were mounted by coverslips with flourogold G mounting media (0100-01, SouthernBiotech). The stained tissue sections were imaged using an upright epi-fluorescence microscope (Nikon Eclipse 80i) equipped with the CCD camera (oneCLICK, QImaging), 40x objective (N.A. = 0.75), and three color filter sets (blue, green, red). The exposure time was 1000 ms. Images were collected and merged in three-color using Metamorph. Three replicas were performed for each subjects. The fluoresence intensity was measured and normalized to the negative control using ImageJ.
Protein chemifluorescence detection. According to the Michaelis-Menten equation, at the maximum concentration of substrate (saturation), the turn-over rate of an enzymatic reaction is fastest and independent of the substrate concentration. Under the enzyme-limiting conditions, the turn-over rate rises linearly with the increase of enzyme concentration, which is reflected by conveting more DiFMUP substrate to strongly fluorescent DiFMU product. Thus, by applying saturating DiFMUP concentration, a linear relationship between the rates of product conversion and the amount of enzyme presented in the second-stage magnetic chamber can be obtained. To obtain a saturating substrate concentration in the reaction chamber, a 1000 μM DiFMUP solution diluted from 10 mM stock solution of DiFMUP in DMSO was introduced for 5 min and then stopped for enzymatic reaction. Accumulation of fluorescent DiFMU during the assay occurred linearly and then reached amaximum as the equilibrium is achieved (Figure 4E). The incubation time is an important factor for the detection in our system because the second capture chamber is not completely closed after the flow is stopped. We found that the fluorescent signal reaches maximum after 6 min incubation, which may be attributed to the balance between the enzymatic conversion and the diffusion of the fluorescent product out of the chamber. An incubation time of 6 min was applied consistently through out all measurements. Calibration curves were generated for IGF-1R and p-IGF-1R to correlate the fluorescence signals with given protein concentrations.
Data Acquisition and Analysis. Image and video capture was performed by an upright epifluorescence microscope (Nikon Eclipse 80i) equipped with a mechanical shutter and a CCD camera (oneCLICK, QImaging) using a 4x (N.A. = 0.1) or 10x objective (N.A. = 0.3). The camera exposure time was set to 500 ms with a 10 MHz frequency controlled by Metamorph. A filter set (excitation 325-375 nm, emission 435-485) was used for UV illumination by a Xenon Lamp and for fluorescence detection. Image analysis was performed using ImageJ and consistent regions of interest were defined and analysed. The measured fluorescent signal was corrected for the background signal.
Standard ELISA measurement of IGF-1R and p-IGF-1R in ultracentrifugation-purified plasma exosomes. Following the protocols provided by the manufacturers, commercial ELISA kits for human IGF-1R (OK-0226, OmniKine) and IGF-1R[pYpY1135/1136] (KHO0501, Invitrogen) were used to measure the concentration of endogenous IGF-1R and pIGF-1R in human plasma derived exosomes, respectively. The plasma samples from Stage II NSCLC patients empoyed here match with those for the on-chip measurments. The ultracentrifugation purified exosomes were lysed by 5% Triton X-100, consistent with the on-chip lysis protocol. Then the lysates were diluted by 10 or 100 folds to prepare 100 µL standards which were then loaded into 96-well plate pre-coated with the antibody against -IGF-1R. Each concentration was measured three times to obtain the average signal. Absorbance was read out in each well at 450 nm using a TECAN plate reader (infinite V200 pro). The background absorbance was substracted from all data points. The standard calibration curves were established by ploting the absorbance of the sandard IGF-1R and pIGF-1R proteins against the standard concentrations. The concentrations for total IGF-1R and p-IGF-1R from human plasma samples were determined using the standard calibration curves.
Test of crossreactivity of IGF-1R antibodies with insulin receptor (IR). IGF-1R has over 80% homology with insulin receptor (IR) by sharing the conserved tyrosine residues that are phosphorylated2. This homology makes it difficult to differentiate the phosphorylation from total IGF-1R with IR expression level, due to the crossreactivity of many commercial phospho-IGF-1R antibodies with phosphorylated IR3-6. In our approach, p-IGF-1R molecules released from exosomes are captued by the beads coated with the antibody specific for total IGF-1R and washed to remove interfering IR protein if present. Thus it is important to ensure the specificity of the IGF-
6
1R antibody. To this end, the crossreactivity of IGF-1R antibodies from various vendors with IR was evaluated using an Insulin Receptor β ELISA kit (KHR9111, Invitrogen) (Figure S8). The antibodies tested here were listed in Table S1. The monoclonal antibody specific for IR (regardless of phosphorylation state) was pre-coated onto the wells of the microtiter strips. The strips 1, 2 and 3 are the replicas of strips 4, 5 and 6 (left to right). The IR antigen standard (15 ng/mL) was added to strips 1 and 4, but not in strips 2 and 5. Serial dilutions of IR (30, 15, 7.5, 3.75, 1.87, 0.94, and 0 ng/mL) were added to strip 3 and 6 as positive controls. After incubation and washing, the various IGF-1R antibodies (Table S1) were added to strip 1, 2, 4 and 5, in the order indicated in the Figure S8 and Table S1. The antibody specific for IR was added to strip 3 and 6 for detection of standard IR as parallel control. After a second incubation and washing, horseradish peroxidase-labeled anti rabbit IgG was added and bound to the detection antibody (anti-mouse IgG HRP was used for antibody #4). Following the third incubation and washing, the substrate solution was added and the absorbance was read using a TECAN plate reader. As shown in Figure S8, the antibodies to total IGF-1R did not crossreact with IR. As expected, the p-IGF-1R antibodies from four different vendors showed considerable crossreactivity to IR. Thus, we selected the antibody against total IGF-1R for capture, which avoids non-specific interference and improves the specificity for p-IGF-1R detection.
References1. Estelles, A. et al. Exosome nanovesicles displaying G protein-coupled receptors for drug discovery. International journal of nanomedicine 2, 751-760 (2007).2. Adams, T.E., Epa, V.C., Garrett, T.P. & Ward, C.W. Structure and function of the type 1 insulin-like growth factor receptor. Cellular and molecular life sciences : CMLS 57, 1050-1093 (2000).3. Browne, B.C. et al. Evaluation of IGF1R and phosphorylated IGF1R as targets in HER2-positive breast cancer cell lines and tumours. Breast cancer research and treatment 136, 717-727 (2012).4. Gong, Y. et al. High expression levels of total IGF-1R and sensitivity of NSCLC cells in vitro to an anti-IGF-1R antibody (R1507). PloS one 4, e7273 (2009).5. Janeway, K.A. et al. Strong expression of IGF1R in pediatric gastrointestinal stromal tumors without IGF1R genomic amplification. International journal of cancer. Journal international du cancer 127, 2718-2722 (2010).6. Tarn, C. et al. Insulin-like growth factor 1 receptor is a potential therapeutic target for gastrointestinal stromal tumors. Proceedings of the National Academy of Sciences of the United States of America 105, 8387-8392 (2008).
7
Figure S1. The sample preparation approaches significantly affect the exosome morphology and integrity. Representative images were analyzed by transmission electron microscope. (A) The exosomes immune-captured by micro-sized magnetic beads were prepared by two-step embedding protocols prior imaging. The fully intact and regular round shape was observed as the typical appearance of exosomes. (B) Membrane collapse was observed from exosomes prepared without embedding prior imaging. The irregular shape and cup shape were observed due to collapse during sample drying. (C) Collapsed exosomes and membrane fragments were often observed when immunomagnetically capturing the plasma-derived vesicles pre-isolated by differential ultracentrifugation. It may be attributed to the high shear force and mechanical damage that occur during ultracentrifugation. The scale bar is 100 nm.
Figure S2. The beads suspended in a buffer solution were infused into the chamber and retained by the magnet placed underneath the center of the chamber, forming a field-induced aggregate due to the dipolar interactions between the beads. The size of immobilized micro-bead aggregates grows in the chamber near a magnet underneath with the increase of infused sample volume. The bright field images of aggregates in the magnetic capture chamber were acquired and analyzed using ImageJ to calculate the aggregate size relative to the chamber size.
8
Figure S3. Size distributions of exosomes isolated from NSCLC plasma by the microfluidic immunomagnetic capture targeting exosomal surface proteins (A) CD9, (B) α-IGF-1R, and (C) CD81, respectively. 130 captured vesicles were measured for each marker. Insets: representative TEM images of exosomes from each subpopulation. Scale bar is 100 nm. The dotted red lines are Log-normal fitted plots (R2 > 0.98). It was found that the percentages of the vesicles smaller than 150 nm are ~97%, 80%, and 82% for CD9+, α-IGF-1R+, and CD81+ subpopulations, respectively.
Figure S4. Size distribution of circulating exosomes from NSCLC and control subjects tested in Figure 5 (main text) using ultracentrifugation purification and NTA (NanoSight). There is no distinct size profiles between healthy and NSCLC exosomes isolated by ultracentrifugation (fitted using log-normal distribution, R2 > 0.98).
9
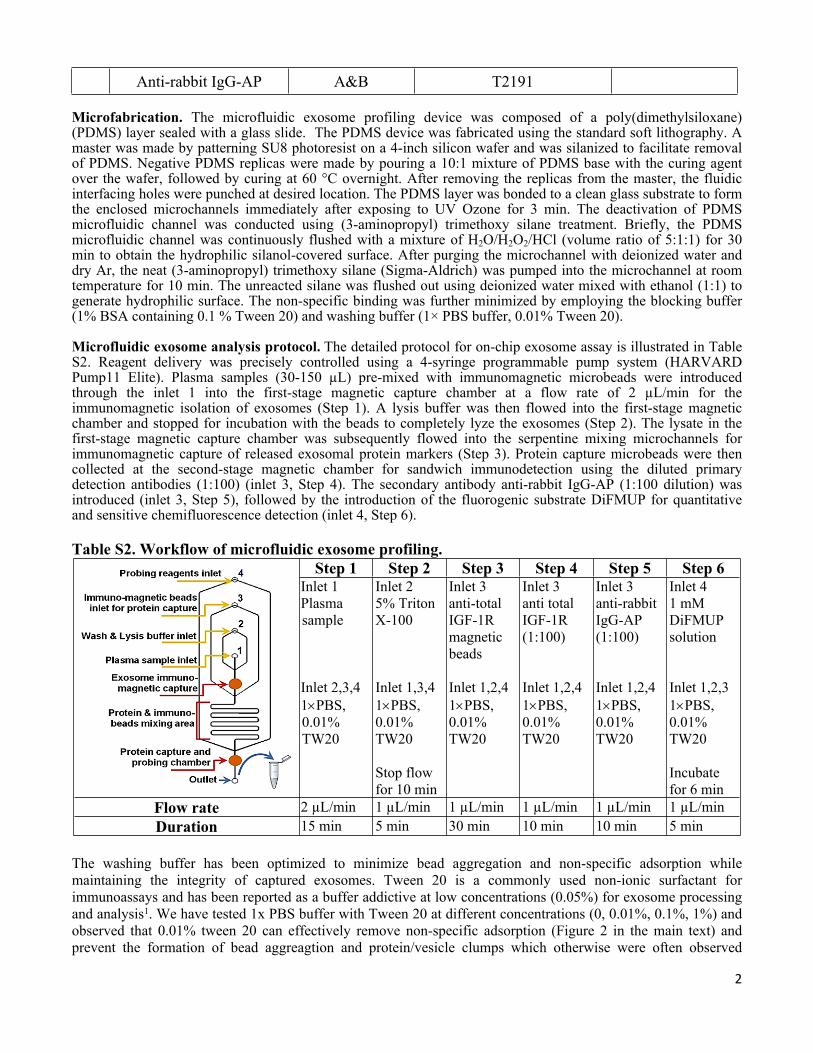
Figure S5. The total circulating exosomes in the plasma of healthy donors (blue) and NSCLC subjects (red) in Figure S4 measured by NTA (NanoSight). The results are presented as the total number of particles per milliliter of plasma. Error bars represent the standard deviations of five measurements. NSCLC patient plasma samples contain significantly higher concentration of exosomes than that of the healthy controls (p = 0.0001).
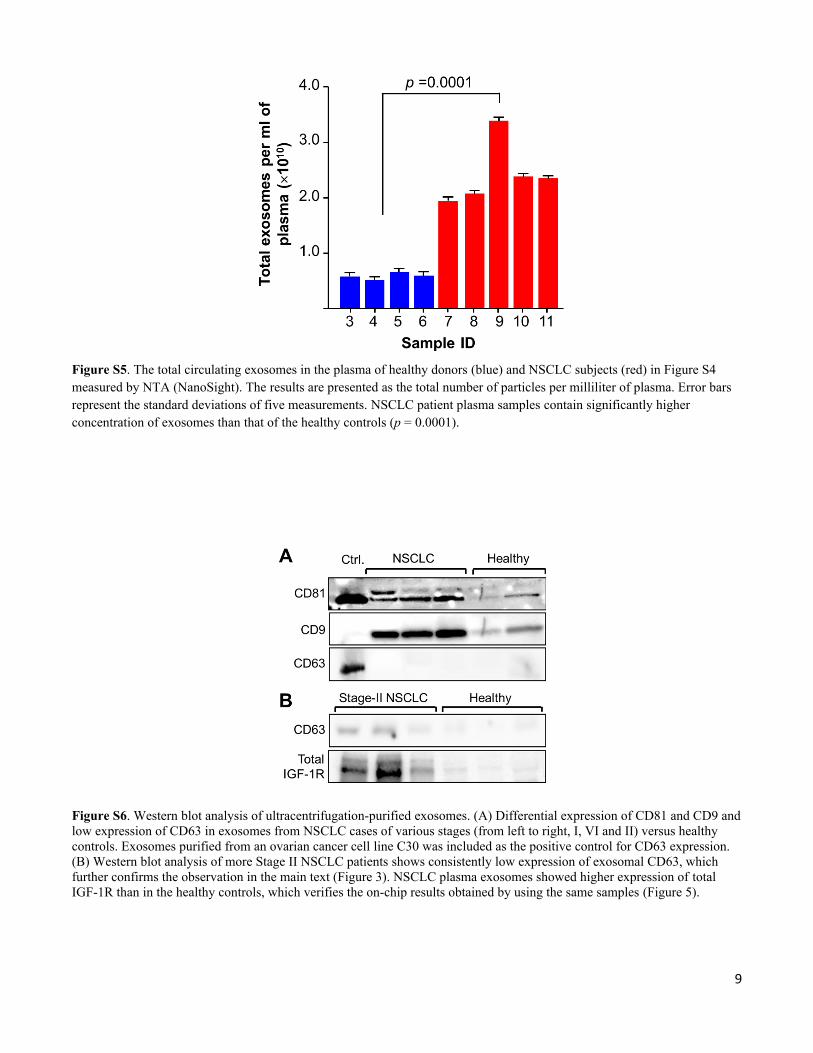
Figure S6. Western blot analysis of ultracentrifugation-purified exosomes. (A) Differential expression of CD81 and CD9 and low expression of CD63 in exosomes from NSCLC cases of various stages (from left to right, I, VI and II) versus healthy controls. Exosomes purified from an ovarian cancer cell line C30 was included as the positive control for CD63 expression. (B) Western blot analysis of more Stage II NSCLC patients shows consistently low expression of exosomal CD63, which further confirms the observation in the main text (Figure 3). NSCLC plasma exosomes showed higher expression of total IGF-1R than in the healthy controls, which verifies the on-chip results obtained by using the same samples (Figure 5).
10
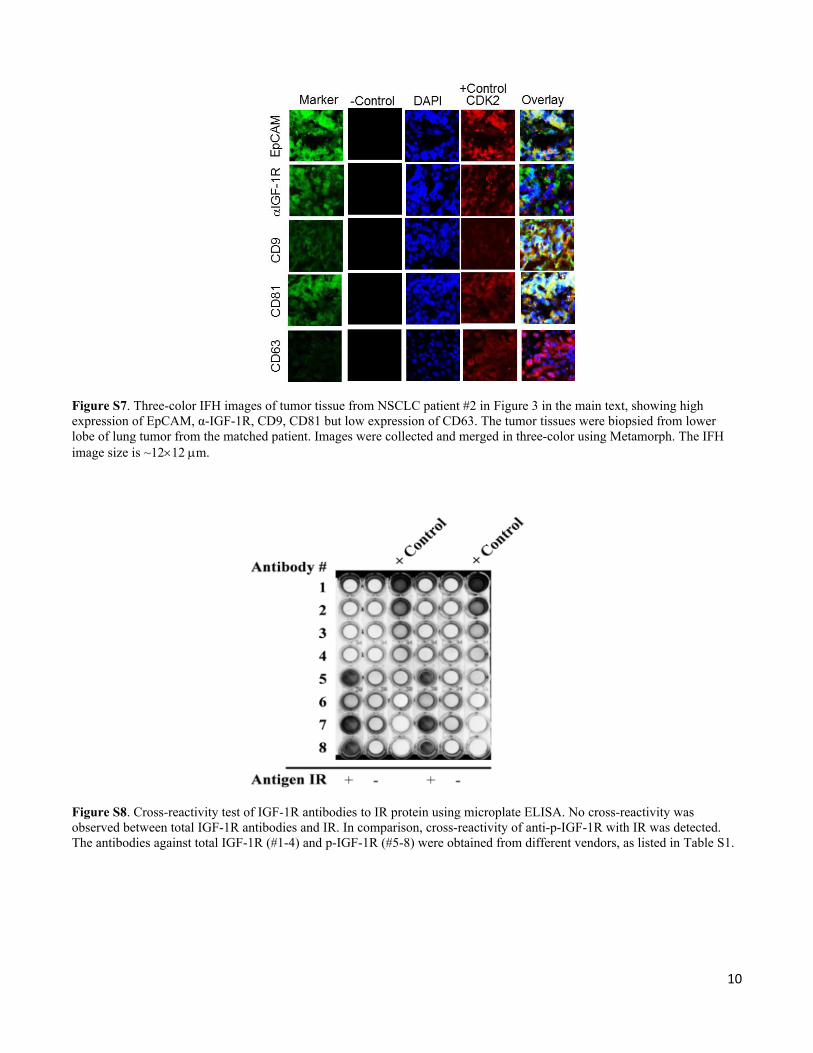
Figure S7. Three-color IFH images of tumor tissue from NSCLC patient #2 in Figure 3 in the main text, showing high expression of EpCAM, α-IGF-1R, CD9, CD81 but low expression of CD63. The tumor tissues were biopsied from lower lobe of lung tumor from the matched patient. Images were collected and merged in three-color using Metamorph. The IFH image size is ~1212 m.
Figure S8. Cross-reactivity test of IGF-1R antibodies to IR protein using microplate ELISA. No cross-reactivity was observed between total IGF-1R antibodies and IR. In comparison, cross-reactivity of anti-p-IGF-1R with IR was detected. The antibodies against total IGF-1R (#1-4) and p-IGF-1R (#5-8) were obtained from different vendors, as listed in Table S1.
11
Figure S9. Calibration of quantitative detection of total IGF-1R and phospho-IGF-1R using the standard 96-well microplate ELISA kit.
Figure S10. Quantitative detection of exosomal IGF-1R as a function of total exosome concentration in plasma. 10-fold dilutions of a NSCLC plasma sample (patient #11) were assayed to obtain the calibration curve (solid triangles). The measurements of the subjects in the main text Figure 5 were superimposed in the plot (inset). Error bars are standard deviations (n = 5 for x axis and n = 3 for y axis).
12
Figure S11. Quantitative analysis of intravesicular p-IGF-1R in circulating exosomes using the same clinical samples as in Fig. 5. (A) Bar (left) and scattered dot (right) plots of the microfluidic results shows no significant difference of the p-IGF-1R level in the EpCAM+ exosomes between NSCLC and healthy subjects (p = 0.46). (B) No correlation between the p-IGF-1R level and the disease state was verified by ELISA analysis (p = 0.31). The error bars are standard deviations (n = 3) in all cases.