+ All Categories
Home > Documents > Supplementary information - Royal Society of Chemistry · Supplementary information ... uranium at...

Supplementary information - Royal Society of Chemistry · Supplementary information ... uranium at...

Date post: 21-Apr-2018
Category:
Upload: vutruc
View: 218 times
Download: 2 times
Share this document with a friend
23
Supplementary information Rational control of interlayer space inside two- dimensional titanium carbides for highly efficient uranium removal and imprisoning Lin Wang, a† Wuqing Tao, a,b† Liyong Yuan, a Zhirong Liu, b Qing Huang, c Zhifang Chai, a John K. Gibson, d and Weiqun Shi* a a Laboratory of Nuclear Energy Chemistry and Key Laboratory for Biomedical Effects of Nanomaterials and Nanosafety, Institute of High Energy Physics, Chinese Academy of Sciences, Beijing 100049, China E-mail: [email protected] b School of Chemistry, Biological and Materials Sciences, East China University of Technology, Nanchang, 330013, China c Ningbo Institute of Material Technology and Engineering, Chinese Academy of Sciences, Ningbo 315201, China d Chemical Sciences Division, Lawrence Berkeley National Laboratory (LBNL), Berkeley, California 94720, United States L. Wang and W. Tao contributed equally to this work. Electronic Supplementary Material (ESI) for ChemComm. This journal is © The Royal Society of Chemistry 2017
Transcript

Supplementary informationRational control of interlayer space inside two-

dimensional titanium carbides for highly efficient

uranium removal and imprisoning

Lin Wang, a† Wuqing Tao, a,b† Liyong Yuan, a Zhirong Liu,b Qing Huang, c

Zhifang Chai, a John K. Gibson,d and Weiqun Shi*a

a Laboratory of Nuclear Energy Chemistry and Key Laboratory for Biomedical Effects of Nanomaterials and Nanosafety, Institute of High Energy Physics, Chinese Academy of Sciences, Beijing 100049, ChinaE-mail: [email protected] School of Chemistry, Biological and Materials Sciences, East China University of Technology, Nanchang, 330013, Chinac Ningbo Institute of Material Technology and Engineering, Chinese Academy of Sciences, Ningbo 315201, Chinad Chemical Sciences Division, Lawrence Berkeley National Laboratory (LBNL), Berkeley, California 94720, United States† L. Wang and W. Tao contributed equally to this work.

Electronic Supplementary Material (ESI) for ChemComm.This journal is © The Royal Society of Chemistry 2017

S-1

Experimental Section

Materials.

Synthesis of pristine and intercalated Ti3C2Tx MXenes. Ti3AlC2 powders with

purity >99 wt % and particle size < 19 μm (i.e., 800 mesh) were purchased from

Beijing Jinhezhi Materials Co,. Ltd. 0.5 g Ti3AlC2 powders were first slowly added in

portions into 10 mL 15 wt % HF (diluted from 40 wt % HF, Sinopharm Chemical

Reagent Co., Ltd.). The mixture was then stirred and held at 40 ºC for 48 h, after

which the product was centrifuged at 5000 rpm and washed with deionized water 6

times to obtain a pristine Ti3C2Tx water suspension (labeled as Ti3C2Tx-hydrated). In

order to prepare intercalated Ti3C2Tx, Ti3C2Tx-hydrated was first filtered and

immediately dispersed in 1 M NaOH (Sinopharm Chemical Reagent Co., Ltd.)

solution at room temperature for 2h, or dispersed in dimethyl sulfoxide (DMSO,

Sinopharm Chemical Reagent Co., Ltd.) at 37 ºC for 48 h. The products were then

centrifuged and washed with deionized water 6 times to obtain the NaOH activated

Ti3C2Tx water suspension (labeled as Ti3C2Tx-NaOH-hydrated) and the DMSO

intercalated Ti3C2Tx water suspension (labeled as Ti3C2Tx-DMSO-hydrated). The

corresponding dry samples (labeled as Ti3C2Tx-dry, Ti3C2Tx-NaOH-dry and Ti3C2Tx-

DMSO-dry, respectively) were prepared by filtering various Ti3C2Tx water

suspensions on 0.45 μm nylon membranes and drying in a vacuum oven at room

temperature for 12 h. Generally, the concentrations of the studied hydrated Ti3C2Tx

samples were in the range of 10-15 mg mL-1. The actual concentrations of the

S-2

hydrated samples were obtained by measuring the mass of the dry sample on the

filtering membrane for a fixed volume of suspension.

Calcination of Ti3C2Tx after uranium sorption. 200 mg of Ti3C2Tx-hydrated was

first used to uptake U(VI) at the condition of pH=5.0, [U]initial=100 mg L-1, m/V=0.4 g

MXene L-1 and t=360 min, and then the sorbent was collected by filtering and was

dried in a vacuum oven. The dry U(VI)-sorbed MXene sample was transferred into a

quartz tube furnace and was calcined at the desired temperature for 10 min, using a

heating rate of 20 °C min–1 to the calcination temperature, under an air or nitrogen

atmosphere.

Characterization.

The morphologies and chemical compositions of the MXene samples were

measured by a Hitachi S-4800 field-emission scanning electron microscope (SEM)

equipped with Horiba 7593-H energy-dispersive X-ray spectroscopy (EDS). A Bruker

D8 Advance diffractometer (Cu Kα radiation, λ = 1.5406 Å) was used to collect

powder X-ray diffraction (XRD) patterns. The step size for XRD pattern scanning was

0.02º. Hydrated samples were obtained by rapidly filtering the MXene suspensions

with 0.45 μm nylon filtration membranes, and then immediately subjected them to

XRD measurements in wet conditions. A Bruker Tensor 27 spectrometer was used to

record the fourier transform infrared (FTIR) spectra of samples by a potassium

bromide pellet method. The residual concentrations of uranium and other metal

S-3

elements were determined by an inductively coupled plasma optical emission

spectrograph (ICP-OES, Horiba JY2000-2, Japan). The low concentrations of

uranium at ppb levels in the uranium-contaminated water treatment test were

measured by a Thermo Fisher Element XR high resolution inductively coupled

plasma mass spectrometer (HR-ICP-MS). UV-vis spectra of solution samples were

measured by a Hitachi U-3900 spectrophotometer to determine the residual

concentrations of methylene blue (MB) in the dye sorption experiments. In order to

predetermine the suitable calcination temperature for dry U(VI) sorbed MXene

samples, a Q500 thermogravimetry (TA Instruments) was used to acquire

thermogravimetric curves over the range of 20 − 1000 °C with a heating rate of 20 °C

min–1 in air. X-ray absorption near edge-structure (XANES) spectra of the U LIII-edge

(17,166 eV) for samples and reference compounds were collected at the beamline

1W1B of the Beijing Synchrotron Radiation Facility (BSRF). The U LIII-edge

XANES spectra of UO2 and UO2(NO3). 6H2O were measured in transmission mode.

The U LIII-edge XANES spectra of U-sorbed Ti3C2Tx was measured in fluorescence

mode using a lytle-type ion chamber detector. The incident X-ray beam was

modulated to desired energies by using a silicon (111) double-crystal monochromator.

Batch sorption experiments.

Removal of U(VI). A series of sorption experiments for U(VI) uptake in aqueous

solution by various Ti3C2Tx MXene samples was carried out as a function of contact

S-4

time, pH, initial U(VI) concentration ([U]initial), ionic strength, other competing metal

cations, solid-liquid ratio and storage time. A proper amount of UO2(NO3)2. 6H2O

(Sinopharm Chemical Reagent Co. Ltd.) was first dissolved in deionized water to

prepare a 400 mg L-1 U(VI) stock solution. The U(VI) stock solution was then diluted

to initial concentrations ranging from 5 to 220 mg L-1 to perform U(VI) uptake

experiments by a batch method. Typically, 4 mg Ti3C2Tx MXene sample was mixed

with an appropriate amount of deionized water to keep the total volume of suspension

as 5 mL in a 20 mL beaker. Then 5 mL of solution containing U(VI) or multi-metal

ions was added such that the concentration of sorbent was 0.4 g L-1. The pH value of

the solution was adjusted with small amounts of 0.1 M NaOH and 0.1 M HNO3, and

then the mixture solution was stirred at room temperature for a specified time. The

solid extractant was removed after U(VI) sorption to obtain the supernatant sample by

using a polyethersulfone syringe filter (0.22 μm, ANPEL Scientific Instrument Co.,

Ltd., Shanghai). The supernatant was diluted with 5 wt% HNO3 before the final

concentration was determined by ICP-OES or HR-ICP-MS. For the ionic strength

tests, NaClO4 (0.1-500 mmol L-1), Ca(NO3)2 (1-200 mmol L-1) and Mg(NO3)2 (1-200

mmol L-1) were selected as representative electrolytes while [U] initial was fixed as 40

mg L-1. In the selective sorption test, all initial concentrations of U(VI) and other

competing metal ions, including Co2+, Ni2+, Zn2+, Sr2+, La3+, Nd3+, Sm3+, Gd3+ and

Yb3+, were 0.5 mmol L-1. In the solid-liquid ratio test, 4 mg Ti3C2Tx-DMSO-hydrated

and 0.6 mg U(VI) were mixed with different volumes of deionzed water to change the

S-5

dosage of sorbents from 0.4 g L-1 to 0.02 g L-1. In the experiment for simulated

uranium-contaminated water treatment, a stock solution of uranium contaminated

water including 1 mg L-1 U(VI), 200 mg L-1 Na(I), 100 mg L-1 Ca(II) and 100 mg L-

1Mg(II) was first prepared. The desired volume of the stock solution from 2.5 mL to

125 mL was mixed with an equal volume of Ti3C2Tx-DMSO-hydrated aqueous

solution which contained 25 mg sorbent to achieve

the treated capacity in the range of 200~10000 kg water per kg sample.

Removal of Cu(II) and Cd(II). A 12 mg sample of Ti3C2Tx-DMSO-dry or Ti3C2Tx-

DMSO-hydrated was mixed with an appropriate amount of water to keep the total

volume of suspension as 15 mL. Then, 15 mL of solution containing 100 mg L-1 Cu(II)

or Cd(II) (as Cu(NO3)2.3H2O or Cd(NO3)2.4H2O, Beijing Chemical Works) was

added and the composite solution was stirred at room temperature. 0.1 mol L-1 NaOH

was then used to adjust the solution pH to about 5. MXene samples were separated at

different intervals from 5 to 360 min. The concentrations of Cu(II) or Cd(II) in the

supernatant solution after the sorption process was determined using ICP-OES.

Removal of MB(Methylene Blue). A 12 mg sample of Ti3C2Tx-dry, Ti3C2Tx-

hydrated or Ti3C2Tx-DMSO-hydrated was mixed with an appropriate amount of water

to keep the total volume of suspension as 15 mL. Then, 15 mL of solution containing

100 mg L-1 MB (C16H18N3ClS, Beijing Chemical Works) was added and the

composite solution was stirred at room temperature. MXene samples were separated

at different intervals from 5 to 360 min. The concentrations of MB in the supernatant

S-6

solution after the sorption process was determined by UV-vis spectroscopy with a

linear calibration curve over the concentration range of 1-50 mg L-1. In addition, MB-

sorbed samples were filtered and dried in a vacuum oven at room temperature for 12 h

to investigate the intercalation behavior of MB molecules inside galleries of various

MXene samples by XRD.

For all batch sorption experiments, the uptake capacity qe (mg g-1) and distribution

coefficient Kd (mL g-1) were calculated using the following equations:

(S1)

( )o ee

C C Vqm

(S2)

o ed

e

C C VKC m

where C0 and Ce are initial and final equilibrium concentration of cations, respectively;

and V and m are the volume of solution and the mass amount of solid sorbent in the

batch sorption tests, respectively.

Desorption and leaching experiments.

Desorption of U(VI) from U-sorbed Ti3C2Tx-DMSO-hydrated sample. U(VI)

sorption onto the Ti3C2Tx-DMSO-hydrated sample was first performed for pH=5.0,

[U]initial=100 mg L-1, m/V=0.4 g L-1 and t=360 min. After sorption, the solution was

centrifuged under 8000 rpm for 30 min to decant the supernatant. Then 0.01, 0.1 and

0.2 mol L-1 HNO3 were used as eluents to treat the sediment for 30 min to evaluate the

desorption efficiency of U(VI) under acidic conditions.

Leaching of uranium from calcined U-sorbed Ti3C2Tx samples. 5 mg of calcined U-

S-7

sorbed Ti3C2Tx samples prepared under different temperatures and atmospheres was

immersed in 15 mL aqueous solutions (deionized water or various concentrations of

Na2CO3 and HNO3) by shaking for 24 h. The supernatants were separated and diluted

with 5 wt% HNO3 for the uranium concentration measurements. The long term test

procedure for leaching of uranium from simulated underground water, which

contained 0.29 mmol L-1 Ca(NO3)2, 0.31 mmol L-1 CaBr2, 0.53 mmol L-1 MgSO4,

0.45 mmol L-1 Na2SO4, 0.60 mmol L-1 NaHCO3, 0.43 mmol L-1 KHCO3 and 0.011

mmol L-1 Na2CO3, was similar, except that supernatant samples were separated at

different intervals from 2 h to 10 days.

Sorption data fitting by kinetics models.

In order to clarify the sorption process of U(VI) by Ti3C2Tx-DMSO-hydrated, the

pseudo-first-order kinetic model and the pseudo-second-order kinetic model were

used to analyze the experimentally observed kinetic data. The linearized form of the

two models are given as follows:

(S3)1log( ) log

2.303e t ekq q q t

(S4)2

2

1

t e e

t tq k q q

where qe (mg/g) and qt (mg/g) are the quantities of the sorbed U(VI) at equilibrium

time and time t respectively, and kl (1/min) and k2 (g/(mg·min)) are the pseudo-first-

order and pseudo-second-order sorption rate constants, respectively. Plots of log(qe−qt)

versus t, and t/qt versus t give straight lines, and k1 and k2 are derived from the

S-8

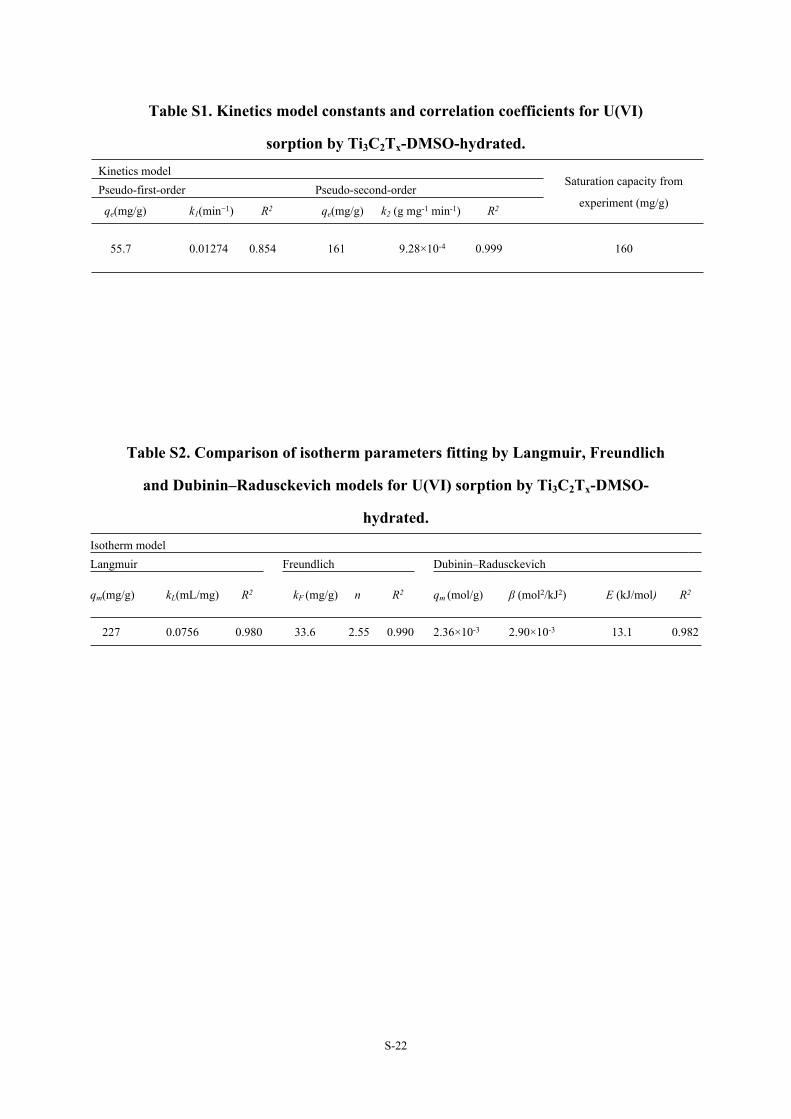
slopes. The model parameters and correlation coefficients obtained by both the

models are listed in Table S1.

Sorption data fitting by isotherm models

The Langmuir model and Freundlich model are two common models to describe

sorption isotherms. The Langmuir model assumes that sorption occurs on a

homogenous surface by a finite monolayer sorption and the sorption energy decreases

as the distance from the surface increases. The Langmuir isotherm model can be

described as follows:

(S5)

1e e

e m L m

C Cq q k q

where qm is the maximum sorption capacity corresponding to a complete monolayer

coverage (mg/g) and kL is a constant indirectly related to the sorption capacity and

energy of sorption (L/mg), which characterizes the affinity of the adsorbate for the

adsorbent. A linearized plot is obtained when Ce/qe is plotted against Ce; qm and kL are

derived from the slope and intercept.

The Freundlich model is basically empirical, and can be applied to non-ideal

sorption on heterogeneous surfaces as well as multilayer sorption, and can be

expressed as:

(S6)

1ln ln ln C e F eq kn

where qe (mg/g) is the equilibrium sorption amount, and kF and n are the Freundlich

S-9

constants related to the sorption capacity and the sorption intensity, respectively. A

linear relationship was obtained by plotting lnqe against lnCe, and the values of kF and

n were calculated from the slope and intercept of the straight line.

Another commonly used isothermal model is that of Dubinin-Radusckevich (D-R).

It was also employed to fit the sorption data of U(VI) on Ti3C2Tx-DMSO-hydrated.

The D-R model describes sorption on a single type of uniform pore. Its linear

expression is expressed as follows:

(S7)2ln ln e mq q

where qm (mol/g) represents theoretical monolayer saturation capacity, β (mol2/kJ2) is

a constant correlated to sorption energy, and ε is the Polanyi potential (kJ/mol) related

to the equilibrium concentration, described as:

(S8)

1RT ln(1 )eC

where R is the universal gas constant (kJ/(mol·K)) and T is the absolute temperature

(K). The mean free energy E (kJ/mol) which is used to estimate the sorption type can

be calculated from the constant β:

(S9)-0.5( 2 ) E

where qm and β for U(VI) sorption on Ti3C2Tx-DMSO-hydrated were obtained from

the linear plot of lnqe against ε2, and accordingly E was calculated.

The model parameters and correlation coefficient obtained by the above three

models are listed in Table S2.

S-10

Fig. S1 Wide angle XRD patterns of pristine and intercalated Ti3C2Tx MXenes under dry and hydrated conditions. The XRD pattern of parent material (Ti3AlC2) before HF etching is also presented for comparison.

Fig. S2 SEM images and EDS analysis results of U(VI) sorbed hydrated MXenes after vacuum drying treatment. (a-c) Ti3C2Tx-DMSO-hydrated, (d-f) Ti3C2Tx-NaOH-hydrated, (g-i) Ti3C2Tx-hydrated.

S-11

Fig. S3 FTIR spectra of Ti3C2Tx-DMSO-hydrated and three U(VI) sorbed hydrated MXenes after vacuum drying treatment. The uranyl asymmetric stretch mode is assigned at 912 cm-1.

Fig. S4 XANES spectra of U LIII-edge for sample of Ti3C2Tx-U and reference compounds.

S-12

Fig. S5 An illustration of enlarged c-LP for U(VI) sorbed MXene in ideal condition, compared with the sample of Ti3C2Tx-dry. The dimension of intercalated hydrated uranyl ion can be estimated by calculating 1/2Δc-LP.

Fig. S6 Zeta potentials of Ti3C2Tx, Ti3C2Tx-NaOH and Ti3C2Tx-DMSO water suspensions dependence on solution pH. The concentration of MXene is 100 mg L-1.

S-13

Fig. S7 (a-c) XRD patterns of dry MXene samples and corresponding wet samples with different immersion times in water. (a) Ti3C2Tx-dry, (b) Ti3C2Tx-NaOH-dry, (c) Ti3C2Tx-DMSO-dry. (d-f) XRD patterns of hydrated MXene samples and corresponding wet samples with different immersion times in 100 mg L-1 U(VI) solution at pH 5.0±0.1. (d) Ti3C2Tx-hydrated, (e) Ti3C2Tx-NaOH-hydrated, (f) Ti3C2Tx-DMSO-hydrated.

S-14

Fig. S8 (a,b) Sorption kinetics of Cu(II) (a) and Cd(II) (b) by hydrated and dry MXenes. (c,d) Sorption kinetics of MB by different MXenes and XRD patterns of MB-uptaked samples after vacuum drying.

Fig. S7a and Fig. S7b displays that the uptake capacities of Cu(II) and Cd(II) by

Ti3C2Tx-DMSO-hydrated have increased 91% and 62% relative to that of Ti3C2Tx-

DMSO-dry. Figure S6c shows that sorption amounts of MB by Ti3C2Tx-dry and

Ti3C2Tx-hydated are 8 mg g-1 and 78 mg g-1, respectively. Ti3C2Tx-DMSO-hydated

exhibited an excellent MB sorption capacity of 125 mg g-1 and a high removal

percentage of 99.8%, suggesting a superior dye removal performance compared to

previously reported results. The featured intercalation peaks of MB are also be

identified for hydrated MXenes, as shown in Fig. S7d. The (002) peak at 2θ of 6.82º

corresponds to a 1/2 Δc-LP of 2.91 Å, which is close to the smallest dimension of the

MB molecule (3.25Å × 7.60Å × 17.0Å). Another broader peak centered at 2θ of 5.91º

S-15

(1/2 Δc-LP = 4.91 Å) was found for Ti3C2Tx-DMSO-hydrated after MB sorption. It

may be that the large interlayer space of Ti3C2Tx-DMSO-hydrated allows the co-

intercalation of MB with two different dimensions (3.25Å and 7.60Å) in a c-LP of

MXene, which would accommodate more guest molecules. On the contrary, no

change in the XRD pattern was observed for Ti3C2Tx-dry, due to only exterior surface

sorption.

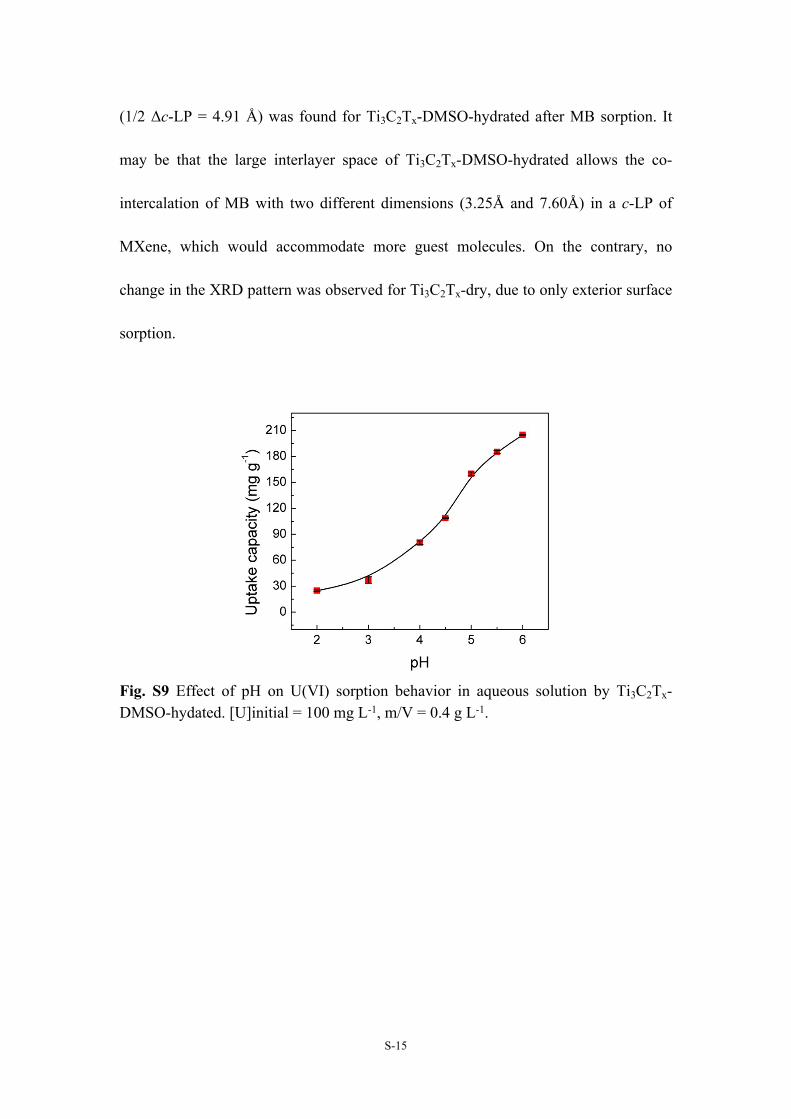
Fig. S9 Effect of pH on U(VI) sorption behavior in aqueous solution by Ti3C2Tx-DMSO-hydated. [U]initial = 100 mg L-1, m/V = 0.4 g L-1.

S-16

Fig. S10 The linear fitting of kinetics data for U(VI) sorption by Ti3C2Tx-DMSO-hydrated with the pseudo-first-order kinetic (a) and the pseudo-second-order kinetic (b) models.

Fig. S11 The linear fitting of sorption isotherm for U(VI) by Ti3C2Tx-DMSO-hydrated with the Langmuir (a), Freundlich (b) and Dubinin–Radusckevich (c) models.

S-17

Fig. S12 Effect of ionic strength U(VI) sorption behavior in aqueous solution by Ti3C2Tx-DMSO-hydated. [U]initial = 40 mg L-1, m/V = 0.4 g L-1, pH = 5.0±0.1.

Fig. S13 Effect of divalent cation on uptake of U(VI) by Ti3C2Tx-DMSO-hydrated. (a) Ca(II), (b) Mg(II). [U]initial = 40 mg L-1, m/V = 0.4 g L-1, pH = 5.0±0.1.

S-18

Fig. S14 Effect of solid-to-liquid ratio on the sorption of U(VI) by Ti3C2Tx-DMSO-hydrated at pH of 5.0±0.1. Total amount of U(VI) is 0.6 mg and amount of sorbent is 4 mg in all solutions.

Fig. S15 The effect of storge time of Ti3C2Tx-DMSO-hydrated in air on U(VI) sorption capacity.

S-19

Fig. S16 Desorption efficiency of U(VI) sorbed Ti3C2Tx-DMSO-hydrated with different concentrations of HNO3 as the eluent.

Fig. S17 XRD patterns of dry sample of U(VI) sorbed Ti3C2Tx- hydrated and corresponding calcined products under various temperatures and atmospheres. (a) U(VI) sorbed Ti3C2Tx- hydrated, (b) calcined at 200 ºC in air, (c) calcined at 400 ºC in air, (d) calcined at 500 ºC in air, (e) calcined at 450 ºC in N2. ● peak position for Ti3C2Tx MXene, ▲ anatase (JCPDF card no. 21-1272 ), ■ rutile (JCPDF card no. 21-1276 ).

S-20

Fig. S18 Thermogravimetric weight-loss curve and its derivative for U(VI) sorbed Ti3C2Tx- hydrated. The sharp increase of sample weight at 450 ºC corresponds to the formation of anatase and rutile.

Fig. S19 SEM images of U(VI) sorbed Ti3C2Tx- hydrated calcined under various temperatures and atmospheres. (a) calcined at 200 ºC in air, (b) calcined at 400 ºC in air, (c) calcined at 500 ºC in air, (d) calcined at 450 ºC in N2.

S-21

Fig. S20 Long term test of U(VI) leaching in simulated underground water by air-400 ºC calcined sample.

S-22

Table S1. Kinetics model constants and correlation coefficients for U(VI)

sorption by Ti3C2Tx-DMSO-hydrated.Kinetics modelPseudo-first-order Pseudo-second-order

qe(mg/g) k1(min−1) R2 qe(mg/g) k2 (g mg-1 min-1) R2

Saturation capacity from

experiment (mg/g)

55.7 0.01274 0.854 161 9.28×10⁻⁴ 0.999 160

Table S2. Comparison of isotherm parameters fitting by Langmuir, Freundlich

and Dubinin–Radusckevich models for U(VI) sorption by Ti3C2Tx-DMSO-

hydrated.Isotherm modelLangmuir Freundlich Dubinin–Radusckevich

qm(mg/g) kL(mL/mg) R2 kF (mg/g) n R2 qm (mol/g) β (mol2/kJ2) E (kJ/mol) R2

227 0.0756 0.980 33.6 2.55 0.990 2.36×10⁻³ 2.90×10⁻³ 13.1 0.982


Recommended