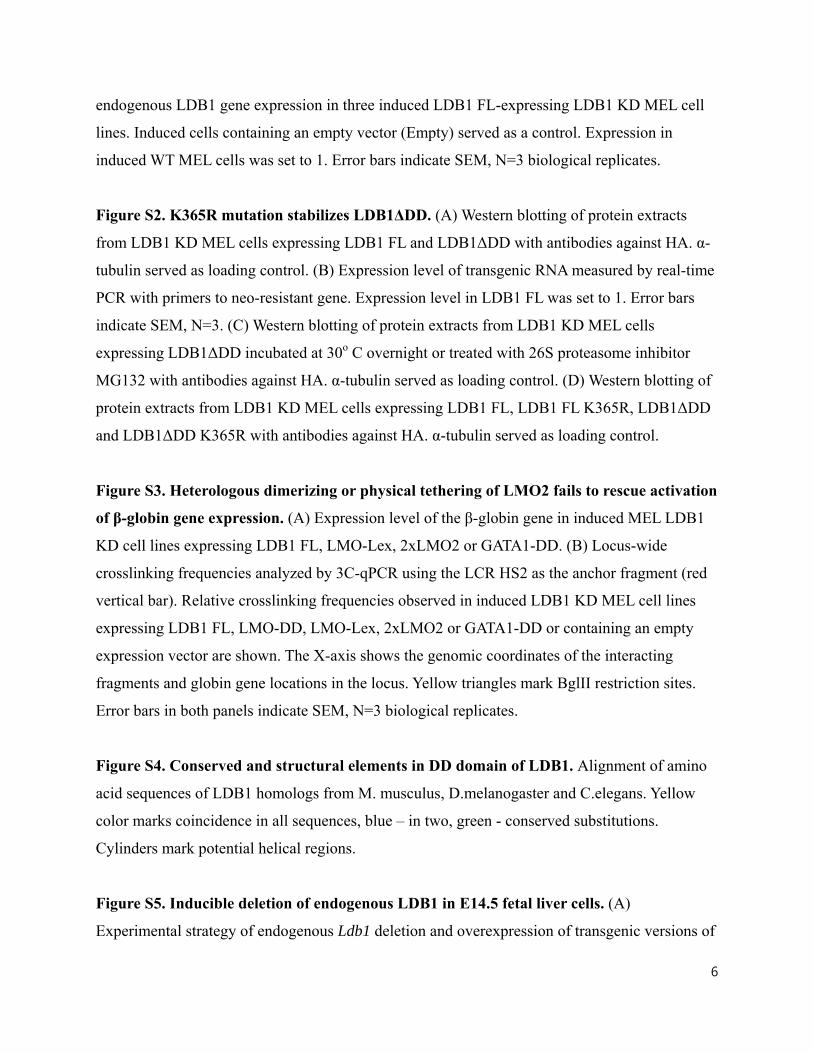
1 Supplementary Material Supplementary Materials and Methods Plasmid construction The HA tagged full length LDB1 cDNA (375 aa) was cloned into the pYM-IRES-Neo vector and various mutations and deletions of LDB1 were created (by site directed mutagenesis) in this background. The shRNA target sequence located in the LID coding sequence of Ldb1 cDNA was altered without changing the amino acid coding sequence of LDB1 protein. The shRNA target sequence is underlined and mutated nucleotides are bolded and underlined: Wild type: cgacgaggacagctttaacaa Mutant: t gat gaa gattca ttc aat aa The dimerization domain of LDB1 (amino acids 1-200) was deleted and the K365R (AAA to CGA) mutation at 3’ end of Ldb1 cDNA was introduced to stabilize the protein thus created. Deletions in the LDB1 DD included sequences encoding amino acids 31 to 43 (Δ1), 58-62 (Δ2), 86 to 97 (Δ3) or 173 to 192 (Δ4/5). DD-only proteins were created by deletion of LDB1 C- terminal sequences encoding amino acids 201-375. Further details of cloning are available upon request. For the LMO2 fusion (2xLMO2), LMO2 cDNAs were tethered in the sense orientation through a flexible linker (22-aa polypeptide [GT(GGGS)4GGGT]) (Wang et al., 2008). Co-immunoprecipitation Protein complexes were precipitated with anti-HA agarose (Sigma, A2095) overnight at 4 o C. Agarose was washed 3 times with IP100 buffer (Brand et al., 2004). Bound proteins were eluted with HA peptides (Sigma) and analyzed by western blot. For LDB1/FOG1 experiments, the protein complexes were precipitated overnight at 4 o C by antibodies against LDB1 or FOG1 and Dynabeads® Protein G (Life Technologies, 10004D), then washed once with IP500 and two times with IP100 and eluted as described (Brand et al., 2004).
Transcript
1
Supplementary Material Supplementary Materials and Methods
Plasmid construction
The HA tagged full length LDB1 cDNA (375 aa) was cloned into the pYM-IRES-Neo vector and
various mutations and deletions of LDB1 were created (by site directed mutagenesis) in this
background. The shRNA target sequence located in the LID coding sequence of Ldb1 cDNA was
altered without changing the amino acid coding sequence of LDB1 protein. The shRNA target
sequence is underlined and mutated nucleotides are bolded and underlined:
Wild type: cgacgaggacagctttaacaa
Mutant: tgatgaagattcattcaataa
The dimerization domain of LDB1 (amino acids 1-200) was deleted and the K365R (AAA to
CGA) mutation at 3’ end of Ldb1 cDNA was introduced to stabilize the protein thus created.
Deletions in the LDB1 DD included sequences encoding amino acids 31 to 43 (Δ1), 58-62 (Δ2),
86 to 97 (Δ3) or 173 to 192 (Δ4/5). DD-only proteins were created by deletion of LDB1 C-
terminal sequences encoding amino acids 201-375. Further details of cloning are available upon
request. For the LMO2 fusion (2xLMO2), LMO2 cDNAs were tethered in the sense orientation
through a flexible linker (22-aa polypeptide [GT(GGGS)4GGGT]) (Wang et al., 2008).
Co-immunoprecipitation
Protein complexes were precipitated with anti-HA agarose (Sigma, A2095) overnight at 4oC.
Agarose was washed 3 times with IP100 buffer (Brand et al., 2004). Bound proteins were eluted
with HA peptides (Sigma) and analyzed by western blot. For LDB1/FOG1 experiments, the
protein complexes were precipitated overnight at 4oC by antibodies against LDB1 or FOG1 and
Dynabeads® Protein G (Life Technologies, 10004D), then washed once with IP500 and two
times with IP100 and eluted as described (Brand et al., 2004).
2
RNA-seq library construction, sequencing and computational analysis
RNA-seq libraries were constructed for induced MEL WT cells, LDB1 KD cells and LDB1 KD
cells expressing either LDB1 FL or LDB1Δ4/5 using TruSeq RNA Sample Prep Kit V2
(Illumina) according to the manufacturers protocol. Three biological replicates of each cell type
were sequenced on a HiSeq 2000. Illumina TruSeq adapters from the 51-bp single-end reads
were clipped using cutadapt v.1.1 with default parameters (Martin, 2011). Clipped reads were
then mapped to the UCSC mm9 assembly with TopHat v1.4.1 (Trapnell et al., 2009) using
default parameters with the additional parameter--butterfly-search. The number of uniquely
mapped reads for each library ranged from 13 to 55M, with a median of 24M. Reads mapping to
repetitive regions defined by the UCSC RepeatMasker track were removed from further analysis.
Reads were counted in exons of the Ensembl release 67 GTF for mm9, using HTSeq 0.5.3p9.
Differential expression of genes for all pairwise comparisons was assessed with DESeq v1.10.1
(Anders and Huber, 2010).
We defined genes repressed by LDB1 KD as those that, in the DESeq analysis, had an adjusted
P value < 0.05 and a log2 fold change < -1 in gene expression between LDB1 KD cells and WT.
To define rescued genes, we first used the variance-stabilized transformation (VST) in the
DESeq package to obtain comparable scaled counts for all experiments. VST-scaled counts for
replicates were averaged to obtain per-treatment values. Then, rescued genes were defined as
those LDB1 KD repressed genes with equal or greater expression in LDB1 KD cells expressing
LDB1 FL than WT, or, if genes have lower expression in LDB1 KD cells expressing LDB1 FL
than WT, whose expression difference between WT and LDB1 FL expressing cells was less than
half the expression difference between WT and LDB1 KD cells. More precisely, a gene was
defined as rescued if it was an LDB1 KD repressed gene and satisfied the condition: