Supplementary Material Wei-An Lin* 1 Haofu Liao* 2 Cheng Peng 1 Xiaohang Sun 3 Jingdan Zhang 4 Jiebo Luo 2 Rama Chellappa 1 Shaohua Kevin Zhou 5,6 1 University of Maryland, College Park 2 University of Rochester 3 Princeton University 4 Z2W Corporation 5 Chinese Academy of Sciences 6 Peng Cheng Laboratory, Shenzhen 1. Fanbeam CT Geometry Figure 1 illustrates the general fanbeam CT geometry. The X-ray source and the arc detector rotate with respect to the origin. The distance between the X-ray source and the origin is D. For each projection angle β, the arc detector receives the X-rays transmitted from the object. The inten- sity values received by the detector is represented as a 1D signal with independent variable γ . As shown in the top of Figure 1, the sinogram data Y fan (β,γ ) consists of the 1D signals received in different projection angles β. D (, ) Detector X-ray source object Figure 1: Fanbeam CT geometry. 2. Implementation Details 2.1. Network Architecture The proposed DuDoNet consists of SE-Net and IE-Net. The architecture of SE-Net is presented in Table 1. The ar- chitecture of IE-Net is identical to U-Net [4]. N c denotes the number of output channels. M t ↓ k represents the sino- gram mask down-sized to 1/k. All downsampling convo- lution layers except for the first layer use leaky ReLU acti- vation function with α =0.2. All upsampling convolution layers except for the last layer use ReLU activation func- tion. We use ‘K#-C#-S#-P#’ to denote the configuration of the convolution layers, where ‘K’, ‘C’, ‘S’ and ‘P’ stand for the kernel, channel, stride and padding size, respectively. Name N c Description INPUT 2 Input sinogram and M t DOWN CONV0 64 K4-C64-S2-P1 CONCAT0 65 Concatenate M t ↓ 2 DOWN CONV1 128 K4-C128-S2-P1 CONCAT1 129 Concatenate M t ↓ 4 DOWN CONV2 256 K4-C256-S2-P1 CONCAT2 257 Concatenate M t ↓ 8 DOWN CONV3 512 K4-C512-S2-P1 CONCAT3 513 Concatenate M t ↓ 16 DOWN CONV4 512 K4-C512-S2-P1 CONCAT4 513 Concatenate M t ↓ 32 UPSAMPLE5 513 UP CONV5 512 K3-C512-S1-P1 CONCAT5 (512 + 513) Concatenate CONCAT3 UPSAMPLE6 (512 + 513) UP CONV6 256 K3-C256-S1-P1 CONCAT6 (256 + 257) Concatenate CONCAT2 UPSAMPLE7 (256 + 257) UP CONV7 128 K3-C128-S1-P1 CONCAT7 (128 + 129) Concatenate CONCAT1 UPSAMPLE8 (128 + 129) UP CONV8 64 K3-C64-S1-P1 CONCAT8 (64 + 65) Concatenate CONCAT0 UPSAMPLE9 (64 + 65) UP CONV9 1 K3-C1-S1-P1 Table 1: Network architecture of SE-Net. 2.2. Radon Inversion Layer We implement our Radon Inversion Layer (RIL) in Py- Torch [3] and CUDA. In the following, we detail our imple-
1University of Maryland, College Park 2University of Rochester 3Princeton University4Z2W Corporation 5Chinese Academy of Sciences 6Peng Cheng Laboratory, Shenzhen
1. Fanbeam CT GeometryFigure 1 illustrates the general fanbeam CT geometry.
The X-ray source and the arc detector rotate with respect tothe origin. The distance between the X-ray source and theorigin is D. For each projection angle β, the arc detectorreceives the X-rays transmitted from the object. The inten-sity values received by the detector is represented as a 1Dsignal with independent variable γ. As shown in the top ofFigure 1, the sinogram data Yfan(β, γ) consists of the 1Dsignals received in different projection angles β.
The proposed DuDoNet consists of SE-Net and IE-Net.The architecture of SE-Net is presented in Table 1. The ar-chitecture of IE-Net is identical to U-Net [4]. Nc denotesthe number of output channels.Mt ↓ k represents the sino-gram mask down-sized to 1/k. All downsampling convo-
lution layers except for the first layer use leaky ReLU acti-vation function with α = 0.2. All upsampling convolutionlayers except for the last layer use ReLU activation func-tion. We use ‘K#-C#-S#-P#’ to denote the configuration ofthe convolution layers, where ‘K’, ‘C’, ‘S’ and ‘P’ stand forthe kernel, channel, stride and padding size, respectively.
We implement our Radon Inversion Layer (RIL) in Py-Torch [3] and CUDA. In the following, we detail our imple-
mentation.
𝜽
𝒕
𝑢
𝑣
Figure 2: Parallel-beam CT geometry.
RIL consists of three modules: (1) parallel-beam conver-sion module, (2) Ram-Lak filtering module and (3) back-projection module. Given a fanbeam sinogram Yfan(β, γ),we first convert it to a parallel beam sinogram Ypara(t, θ)using the fan-to-parallel beam conversion. Then, we canreconstruct the CT image X(u, v) using the Ram-Lak fil-tering and backprojection. The parallel-beam conversion isimplemented according to the following relation
θ = γ + β, (1)t = D sin γ, (2)
where t is the projection location on the parallel beam de-tector and θ is the projection angle in the parallel-beam ge-ometry as shown in Figure 2. For efficiency, we implementthe change of variable using two 1D interpolations, one forθ in (1) and the other for t in (2).
The Ram-Lak filtering for Ypara(t, θ) is implemented by
Q(t, θ) = F−1t {|ω| · Ft {Ypara(t, θ)}} , (3)
where Ft and F−1t are the Discrete Fourier Transform
(DFT) and inverse Discrete Fourier Transform (iDFT) withrespect to the detector dimension. The filtering module isimplemented using the operations torch.fft and torch.ifft inPyTorch.
The backprojection module takes the filtered projectionQ(t, θ) as input, and reconstructs X(u, v) via
X(u, v) =
∫ π
0
Q(u cos θ + v sin θ, θ)dθ
≈ ∆θ∑i
Q(u cos θi + v sin θi, θi)
≈ ∆θ∑i
(dtie − ti)Q(btic, θi)
+ (ti − btic)Q(dtie, θi), (4)
where ti = u cos θi + v sin θi is a function of u, v, and i.The forward-pass of (4) is parallelizable in θi. During back-propagation, the gradients of the CT image with respect tothe sinogram are given by
∂X(u, v)
∂Q(t, θ)=
∆θ(dtie − ti), if t = btic,∆θ(ti − btic), if t = dtie,0, otherwise.
(5)
The backprojection module is implemented as a CUDA ex-tension of PyTorch.
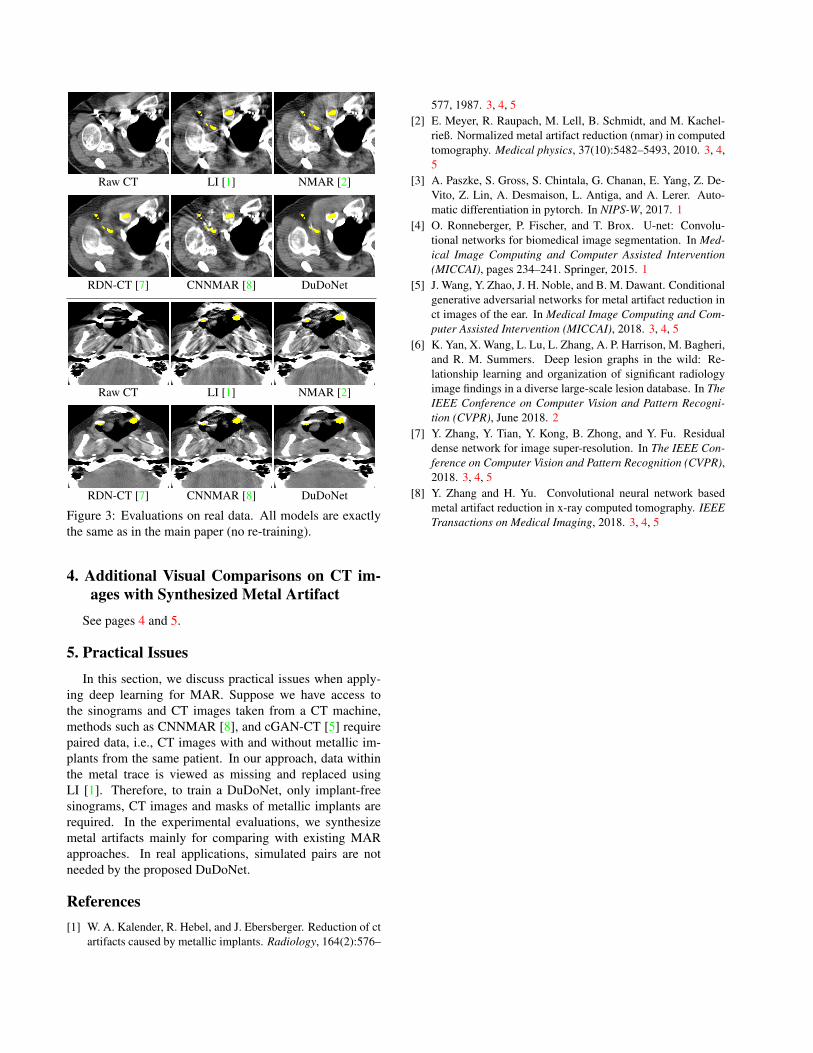
3. Evaluation on CT Images with Real MetalArtifact
Evaluating MAR methods on CT images of patients car-rying metal implants is challenging for two reasons: 1)Modern clinical CT machines have certain build-in MARalgorithms. Evaluations on CT images after MAR wouldnot be meaningful; 2) Sinogram data with metal artifactsare difficult to access, except perhaps from machine manu-facturers. To the best of our knowledge, there is no existingsinogram database which targets MAR.
In order to compare different MAR methods, we man-ually collect CT images with metal artifact from DeepLe-sion [6] and apply the following steps to obtain the metaltrace Mt and the LI sinogram YLI . DuDoNet can be ap-plied by taking Mt and YLI as inputs. Conceptually, thesteps can be understood as projecting the input CT imagewith unknown imaging geometry to the source domain1
with known geometry.(i)Mt: We first segment out the metal mask by applying
a threshold of 2,000 HU to the metal-corrupted CT image.Mt can be obtained by forward projection with the imaginggeometry presented in Section 4 in the manuscript.
(ii) YLI : We adopt the same simulation procedures andimaging geometry as in the manuscript to synthesize metal-corrupted sinogram Y . YLI can be generated from Y andMt by linear interpolation.
Figure 3 presents visual comparisons of different MARalgorithms. Metal masks obtained by step (i) are colored inyellow. We would like to emphasize that the true sinogramof a given CT image cannot be inferred without informationabout the actual imaging geometry (e.g. source to detectordistance, and number of projection views). Therefore, inFigure 3, due to inconsistent imaging geometry, sinogram-based MAR approaches (e.g. LI) may lead to an even worsevisual quality than raw CT. In contrast, DuDoNet effectivelyreduces metal artifacts in real CT images.
1The domain of CT images with simulated metal artifacts.
Raw CT LI [1] NMAR [2]
RDN-CT [7] CNNMAR [8] DuDoNet
Raw CT LI [1] NMAR [2]
RDN-CT [7] CNNMAR [8] DuDoNet
Figure 3: Evaluations on real data. All models are exactlythe same as in the main paper (no re-training).
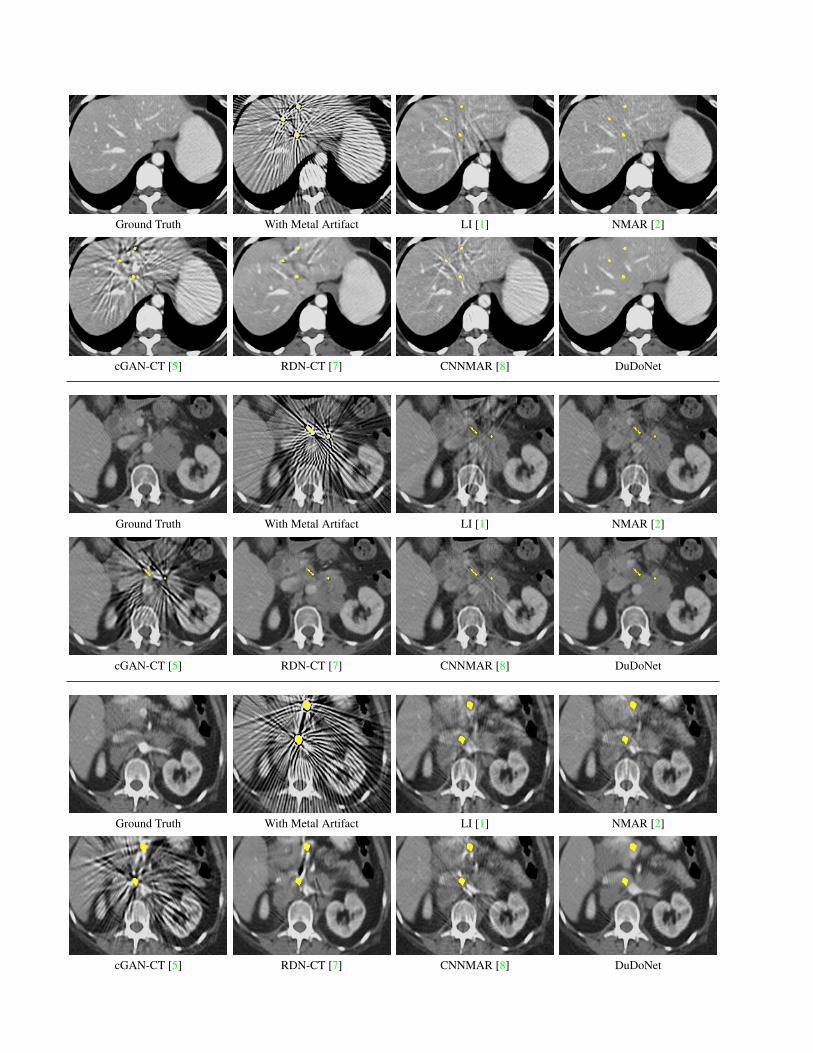
4. Additional Visual Comparisons on CT im-ages with Synthesized Metal Artifact
See pages 4 and 5.
5. Practical IssuesIn this section, we discuss practical issues when apply-
ing deep learning for MAR. Suppose we have access tothe sinograms and CT images taken from a CT machine,methods such as CNNMAR [8], and cGAN-CT [5] requirepaired data, i.e., CT images with and without metallic im-plants from the same patient. In our approach, data withinthe metal trace is viewed as missing and replaced usingLI [1]. Therefore, to train a DuDoNet, only implant-freesinograms, CT images and masks of metallic implants arerequired. In the experimental evaluations, we synthesizemetal artifacts mainly for comparing with existing MARapproaches. In real applications, simulated pairs are notneeded by the proposed DuDoNet.
References[1] W. A. Kalender, R. Hebel, and J. Ebersberger. Reduction of ct
artifacts caused by metallic implants. Radiology, 164(2):576–
577, 1987. 3, 4, 5[2] E. Meyer, R. Raupach, M. Lell, B. Schmidt, and M. Kachel-
rieß. Normalized metal artifact reduction (nmar) in computedtomography. Medical physics, 37(10):5482–5493, 2010. 3, 4,5
[3] A. Paszke, S. Gross, S. Chintala, G. Chanan, E. Yang, Z. De-Vito, Z. Lin, A. Desmaison, L. Antiga, and A. Lerer. Auto-matic differentiation in pytorch. In NIPS-W, 2017. 1
[4] O. Ronneberger, P. Fischer, and T. Brox. U-net: Convolu-tional networks for biomedical image segmentation. In Med-ical Image Computing and Computer Assisted Intervention(MICCAI), pages 234–241. Springer, 2015. 1
[5] J. Wang, Y. Zhao, J. H. Noble, and B. M. Dawant. Conditionalgenerative adversarial networks for metal artifact reduction inct images of the ear. In Medical Image Computing and Com-puter Assisted Intervention (MICCAI), 2018. 3, 4, 5
[6] K. Yan, X. Wang, L. Lu, L. Zhang, A. P. Harrison, M. Bagheri,and R. M. Summers. Deep lesion graphs in the wild: Re-lationship learning and organization of significant radiologyimage findings in a diverse large-scale lesion database. In TheIEEE Conference on Computer Vision and Pattern Recogni-tion (CVPR), June 2018. 2
[7] Y. Zhang, Y. Tian, Y. Kong, B. Zhong, and Y. Fu. Residualdense network for image super-resolution. In The IEEE Con-ference on Computer Vision and Pattern Recognition (CVPR),2018. 3, 4, 5
[8] Y. Zhang and H. Yu. Convolutional neural network basedmetal artifact reduction in x-ray computed tomography. IEEETransactions on Medical Imaging, 2018. 3, 4, 5