* corresponding author 35 36 1: Department of Civil Engineering, University of Toronto, 35 St. George Street, 37 Toronto, Ontario. CANADA. M4J 3K1. Tel: +1 416 978 5978 38 2: Enel Foundation, 00198, Viale Regina Margherita n. 137, Rome, Italy 39 3: School of Environment, Beijing Normal University, China, 北京市海淀区新街口外40 大街19号 邮政编码: 100875 41 4: Department of Energy and Environment, TERI University, 10 Institutional Area, 42 Vasant Kunj, New Delhi, DL 110070, India 43 5: Department of Industrial Engineering, De La Salle University, 2401 Taft Ave, Malate, 44 Manila, 1004 Metro Manila, Philippines 45
2
6: Department of Landscape and Ecological Planning, Seoul National University, 1 46 Gwanak-ro, Gwanak-gu, Seoul, South Korea 47 7: COPPE, Federal University of Rio de Janeiro, Av. Pedro Calmon, 550 - Cidade 48 Universitária, Rio de Janeiro - RJ, 21941-901, Brazil 49 8: UCLA Institute of the Environment and Sustainability, La Kretz Hall, Suite 300, Los 50 Angeles, CA 90095-1496. USA 51 9: Dept. of Civil and Environmental Engineering, Laing O'Rourke Centre for Systems 52 Engineering and Innovation, 407 Skempton Building, Imperial College, South 53 Kensington, London, SW7 2AZ. UK 54 10: Institut de géographie, Université Paris 1 Panthéon Sorbonne 191 rue saint-Jacques 55 75005 Paris, France 56 11: Department of Accounting, Trisakti University, Jl. Kyai Tapa No.1, Grogol, Jakarta 57 Barat, DKI Jakarta 11440, Indonesia 58 12: Department of Architecture, University of Lagos, Dan Fodio Blvd, Lagos 23401, 59 Nigeria 60 13: Department of Environmental Engineering, College of Engineering, University of 61 Tehran, Enghelab Ave. Tehran, Iran. P.O.Box: 11365-4563 62 14: Department of Civil Engineering, Bangladesh University of Engineering & 63 Technology, Dhaka-1000, Bangladesh 64 15: Department of Geography, 1003E Hunter North, Hunter College, 695 Park Ave.,New 65 York, NY 10065. USA 66 16: Gerenta Operativa de Cambio Climático y Energía, Dirección General de Estrategias 67 Ambientales, Agencia de Protección Ambiental, Gobierno de la Ciudad de Buenos Aires, 68 Argentina 69 17: EcoConServ Environmental Solutions, 12 El-Saleh Ayoub St., Zamalek, Cairo, 70 Egypt 11211 71 18: Department of Civil Engineering, Faculty of Civil Engineering and Architecture, 72 NED University of Engineering & Technology, Karachi 75270, Pakistan 73 19: Department of Civil Engineering, Universidad de Guanajuato, Av. Juárez 77. Col. 74 Centro. CP 36000. Guanajuato, México 75 20: İstanbul Technical University, Uçak ve Uzay Bilimleri Fakültesi, 76 Maslak, 34469, İstanbul, Turkey 77 78 79
80
3
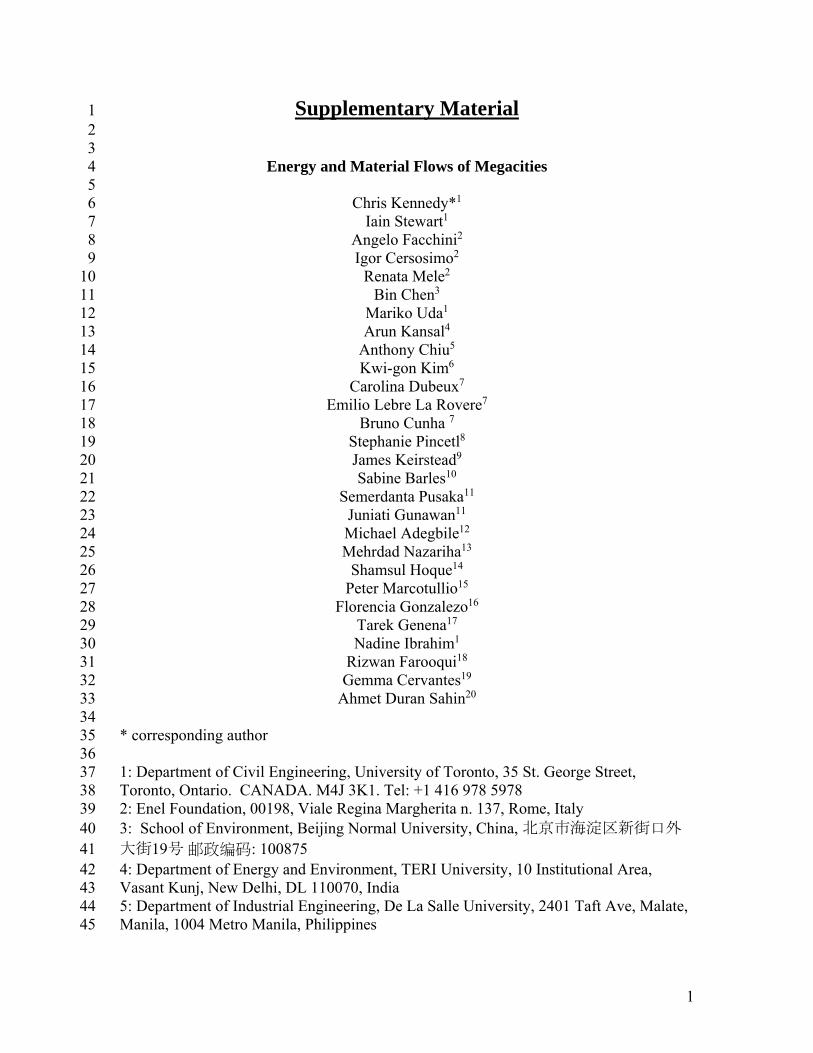
1. Extended Analysis 81 82 Figure S1. The number of megacities at the start of each decade since 1960, with 83 authors’ projection to 2020. (Figure 1 from ref. 1; data source: 84 www.citypopulation.de/world/Agglomerations.html) 85 86
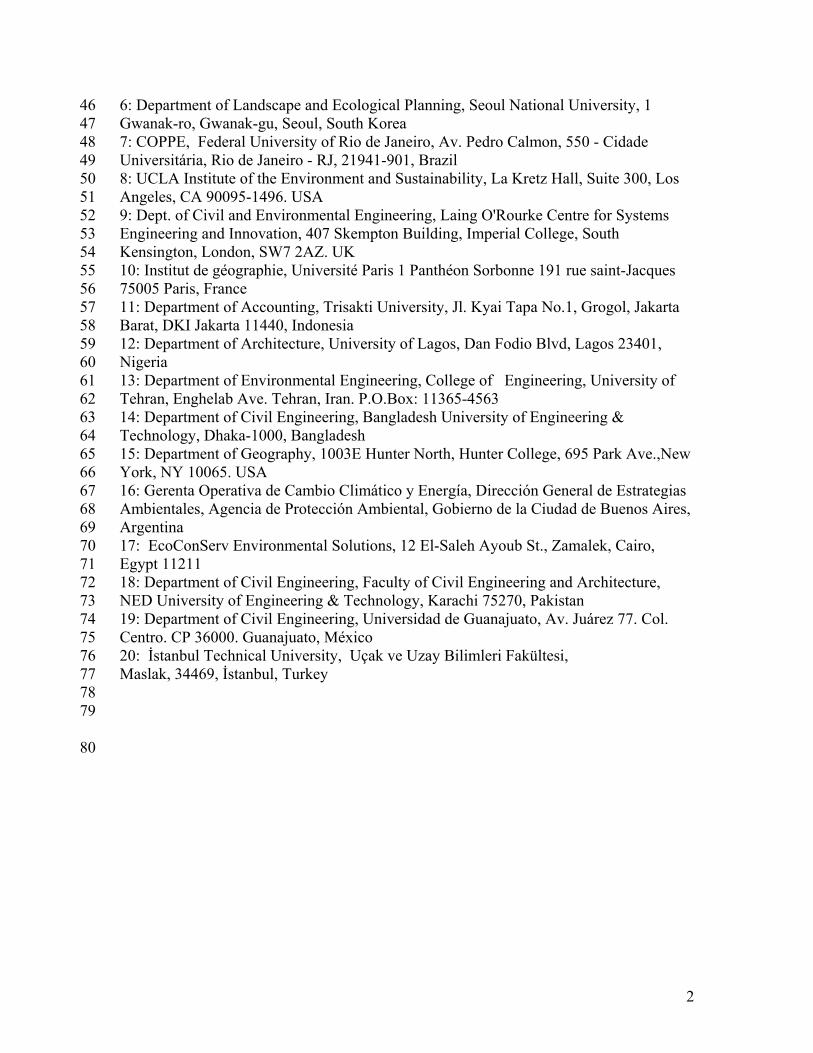
87 88 89 Figure S2. Surveyed megacity population compared with Brinkhoff 2010 values (2). 90 91
92 93
4
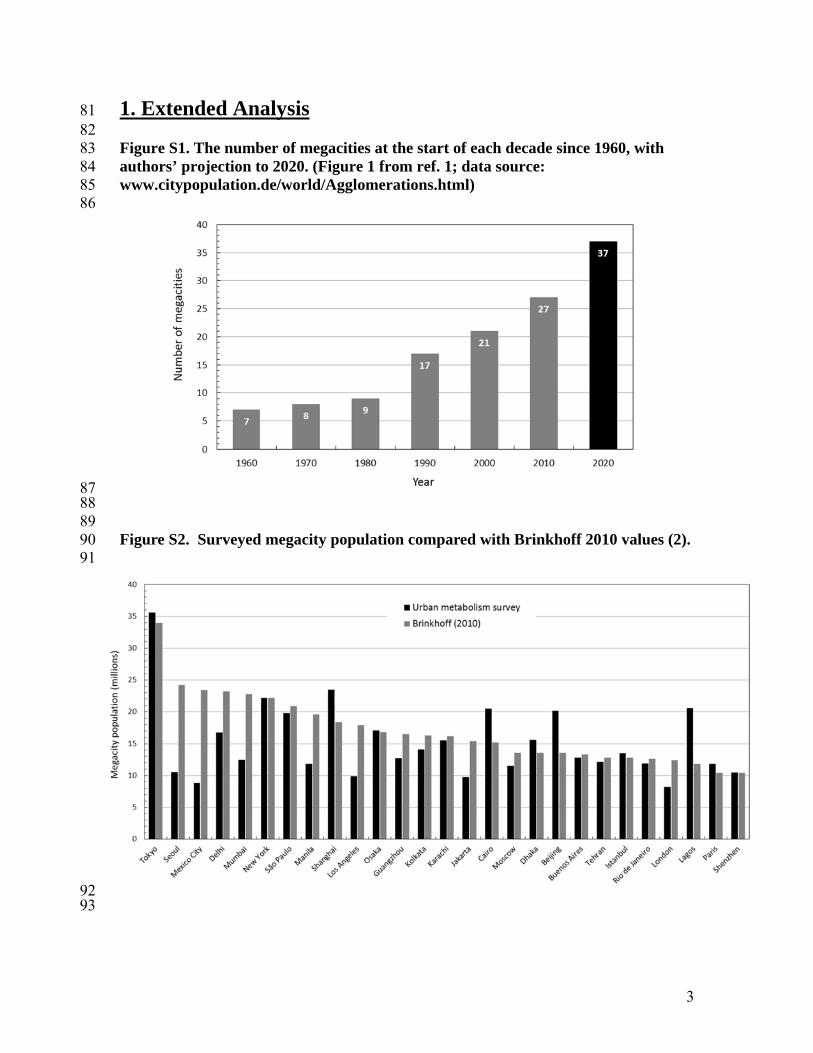
Figure S3. Ground transportation energy use in relation to urbanized area per 94 capita. 95 96
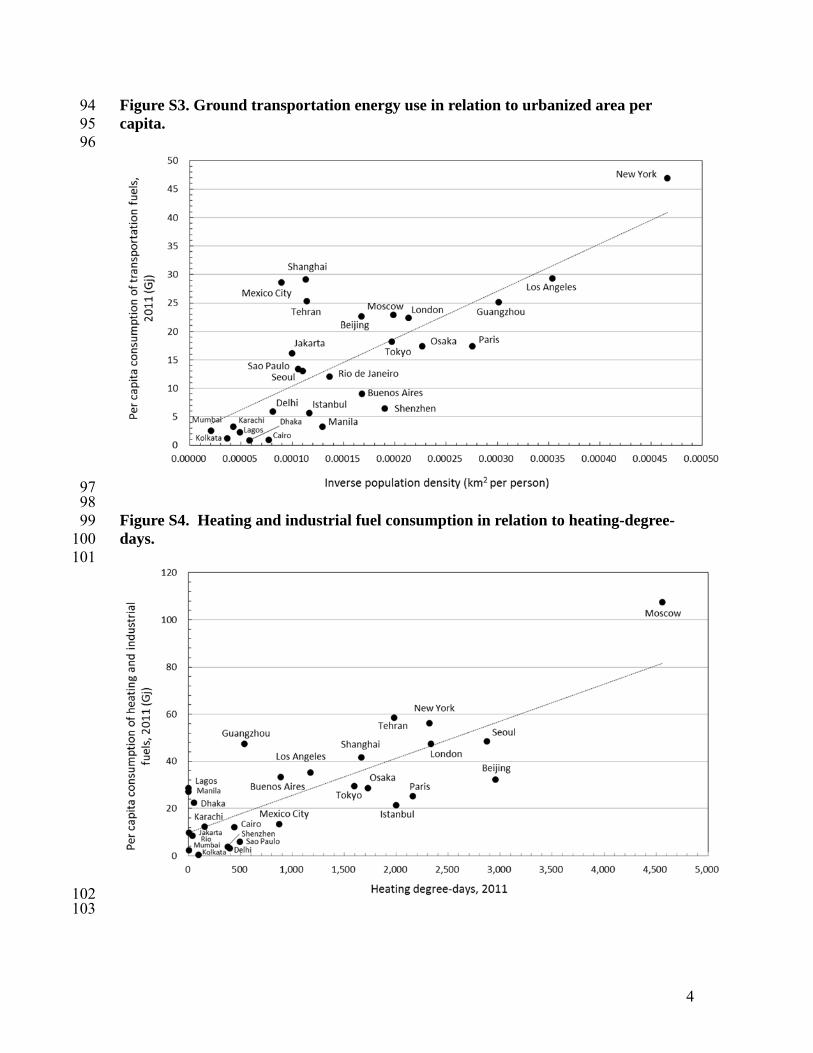
97 98 Figure S4. Heating and industrial fuel consumption in relation to heating-degree-99 days. 100 101
102 103
5
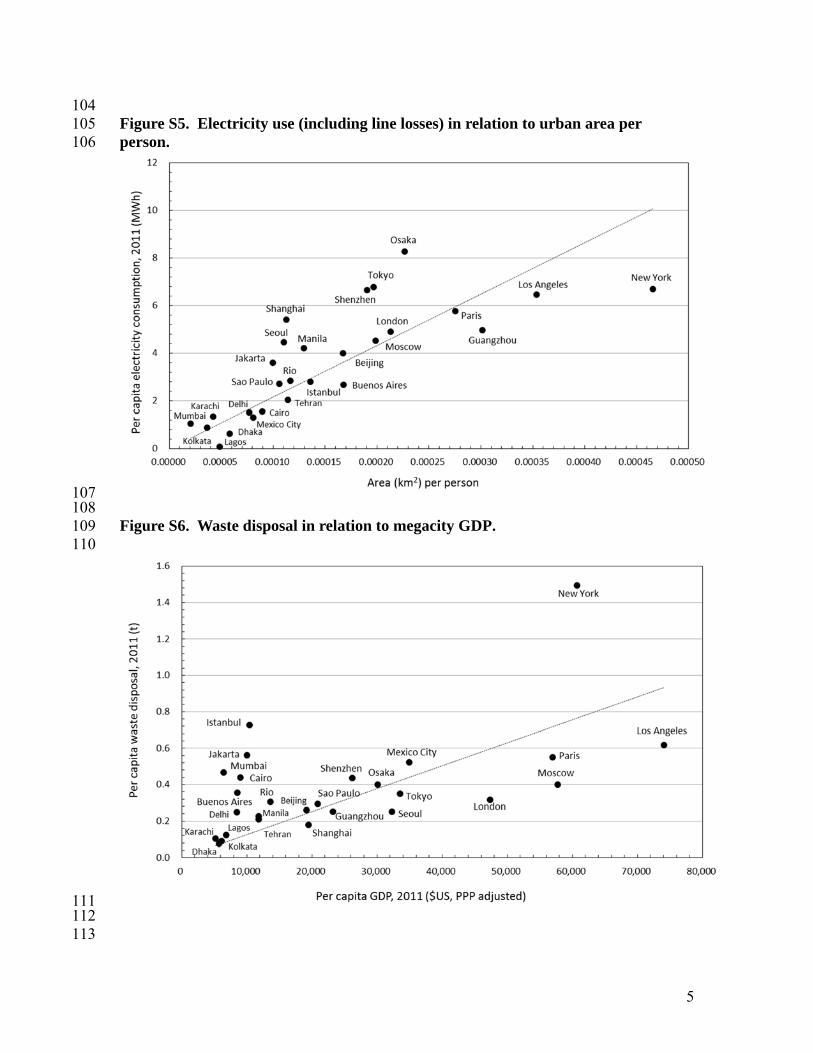
104 Figure S5. Electricity use (including line losses) in relation to urban area per 105 person. 106
107 108 Figure S6. Waste disposal in relation to megacity GDP. 109 110
111 112 113
6
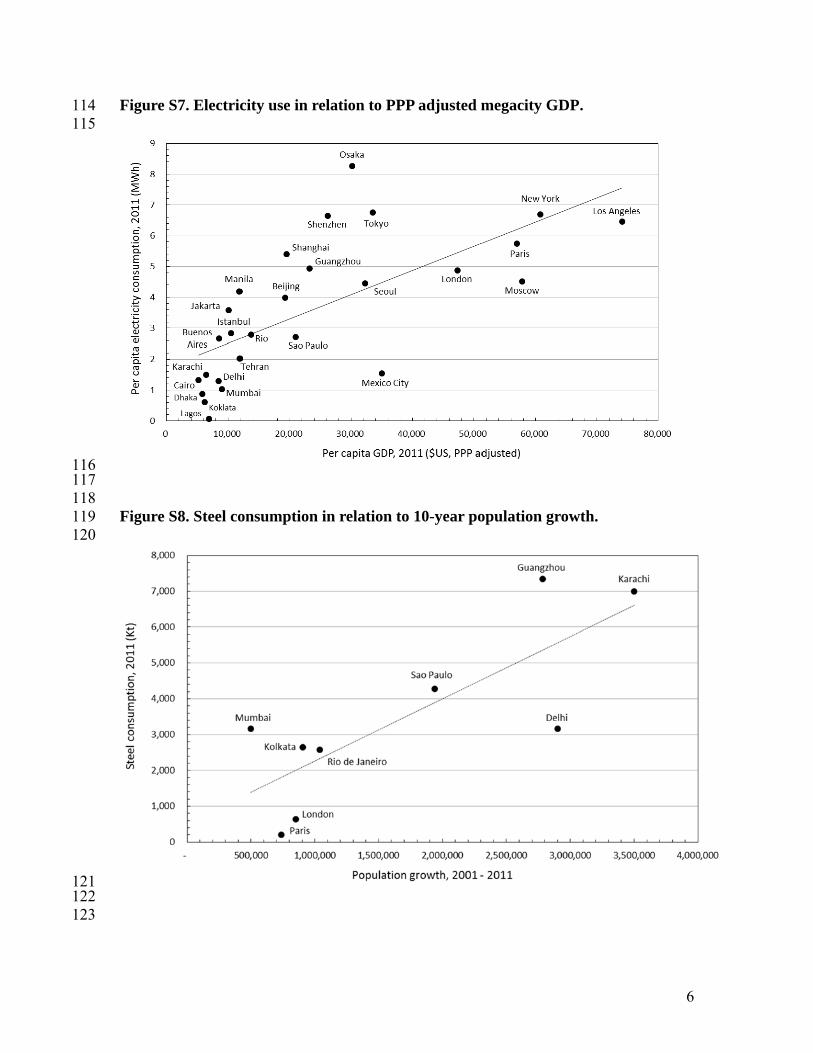
Figure S7. Electricity use in relation to PPP adjusted megacity GDP. 114 115
116 117 118 Figure S8. Steel consumption in relation to 10-year population growth. 119 120
121 122 123
7
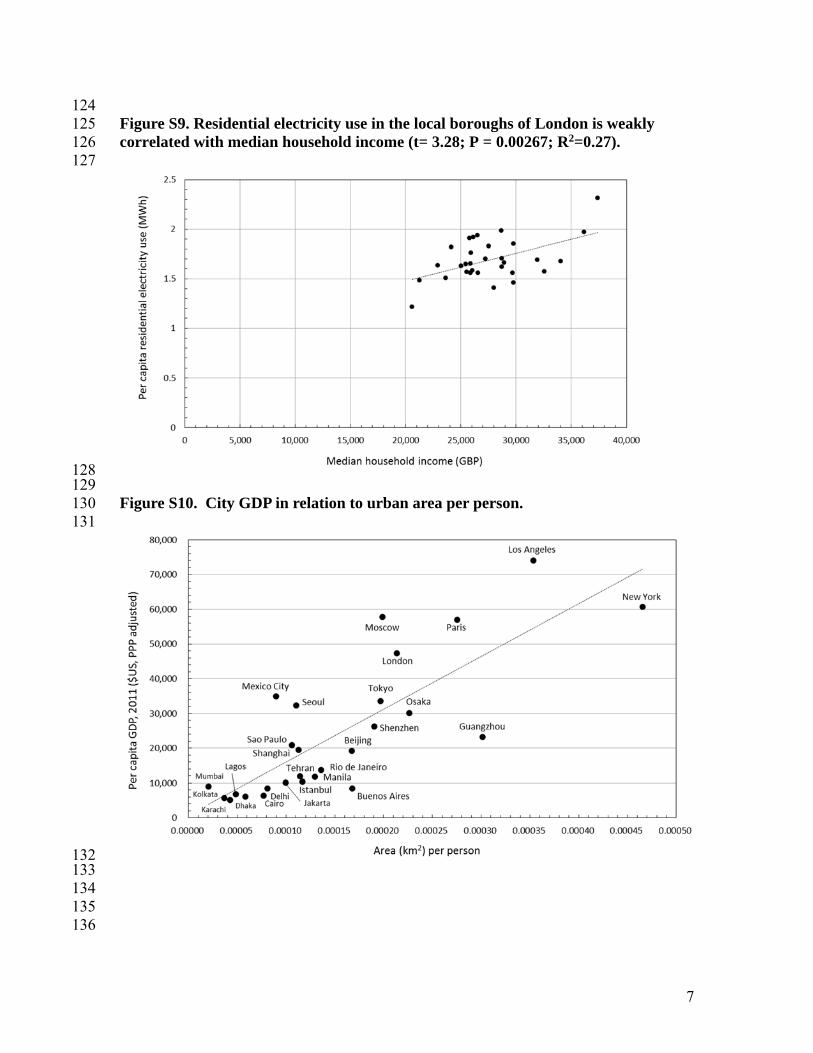
124 Figure S9. Residential electricity use in the local boroughs of London is weakly 125 correlated with median household income (t= 3.28; P = 0.00267; R2=0.27). 126 127
128 129 Figure S10. City GDP in relation to urban area per person. 130 131
132 133 134 135 136
8
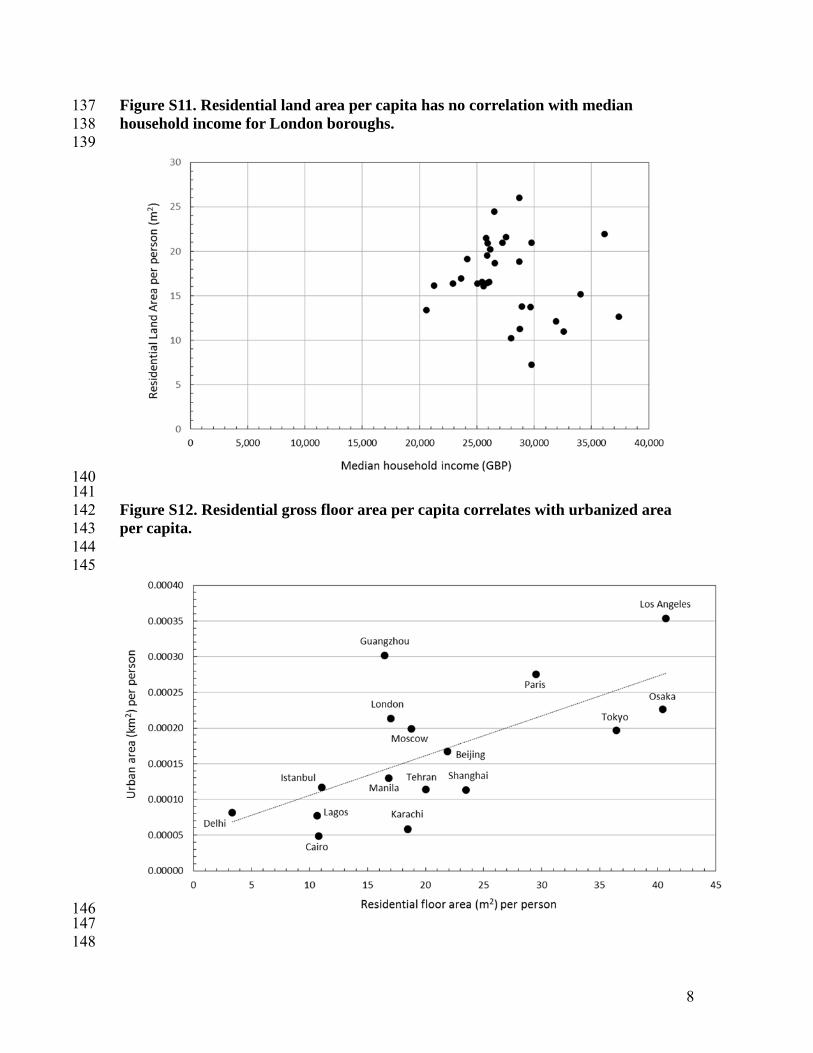
Figure S11. Residential land area per capita has no correlation with median 137 household income for London boroughs. 138 139
140 141 Figure S12. Residential gross floor area per capita correlates with urbanized area 142 per capita. 143 144 145
146 147 148
9
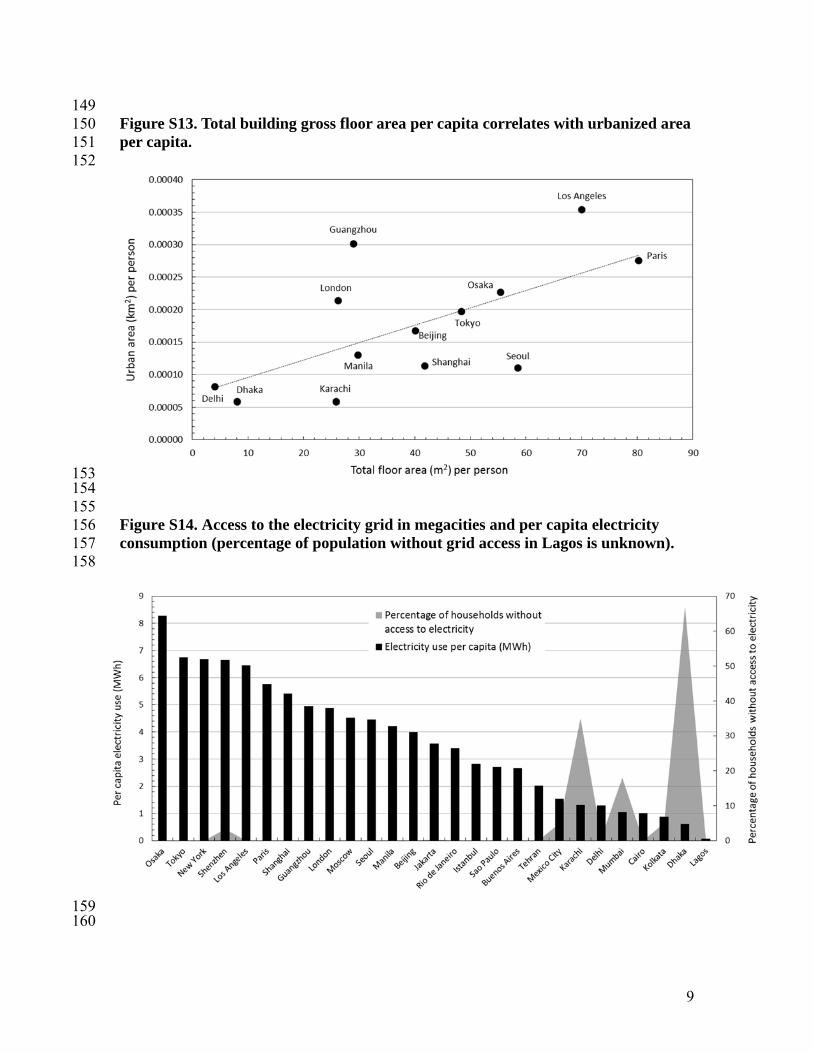
149 Figure S13. Total building gross floor area per capita correlates with urbanized area 150 per capita. 151 152
153 154 155 Figure S14. Access to the electricity grid in megacities and per capita electricity 156 consumption (percentage of population without grid access in Lagos is unknown). 157 158
159 160
10
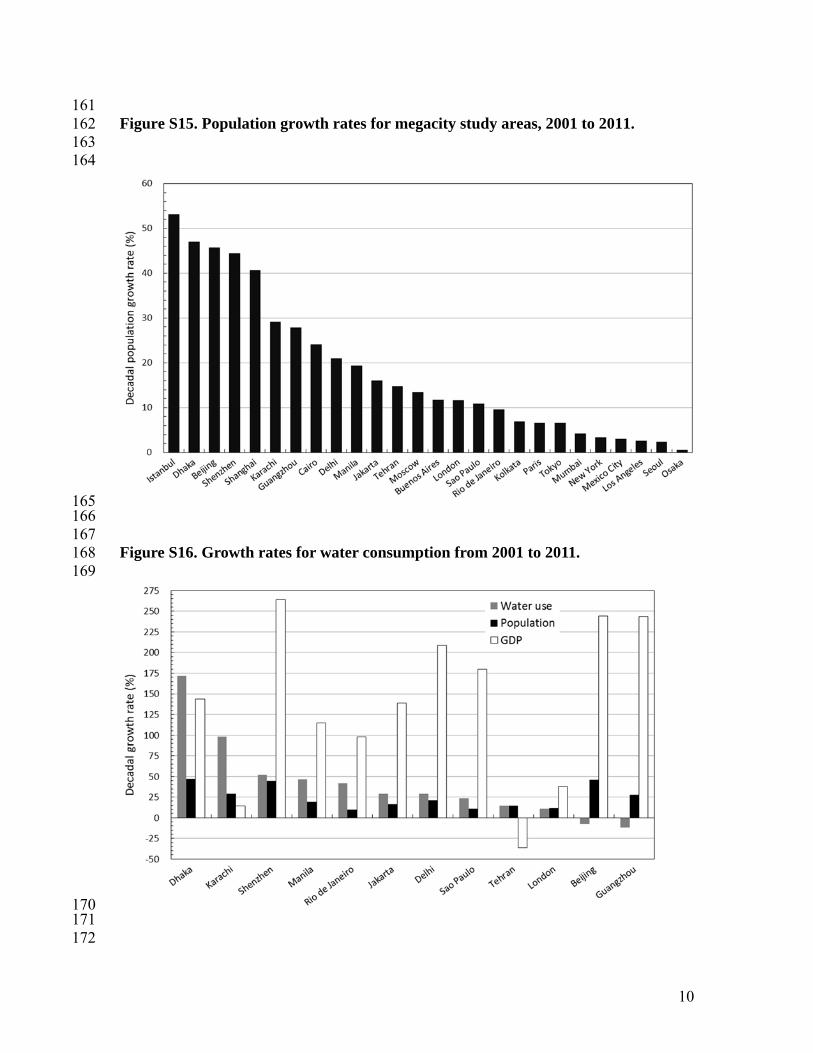
161 Figure S15. Population growth rates for megacity study areas, 2001 to 2011. 162 163 164
165 166 167 Figure S16. Growth rates for water consumption from 2001 to 2011. 168 169
170 171 172
11
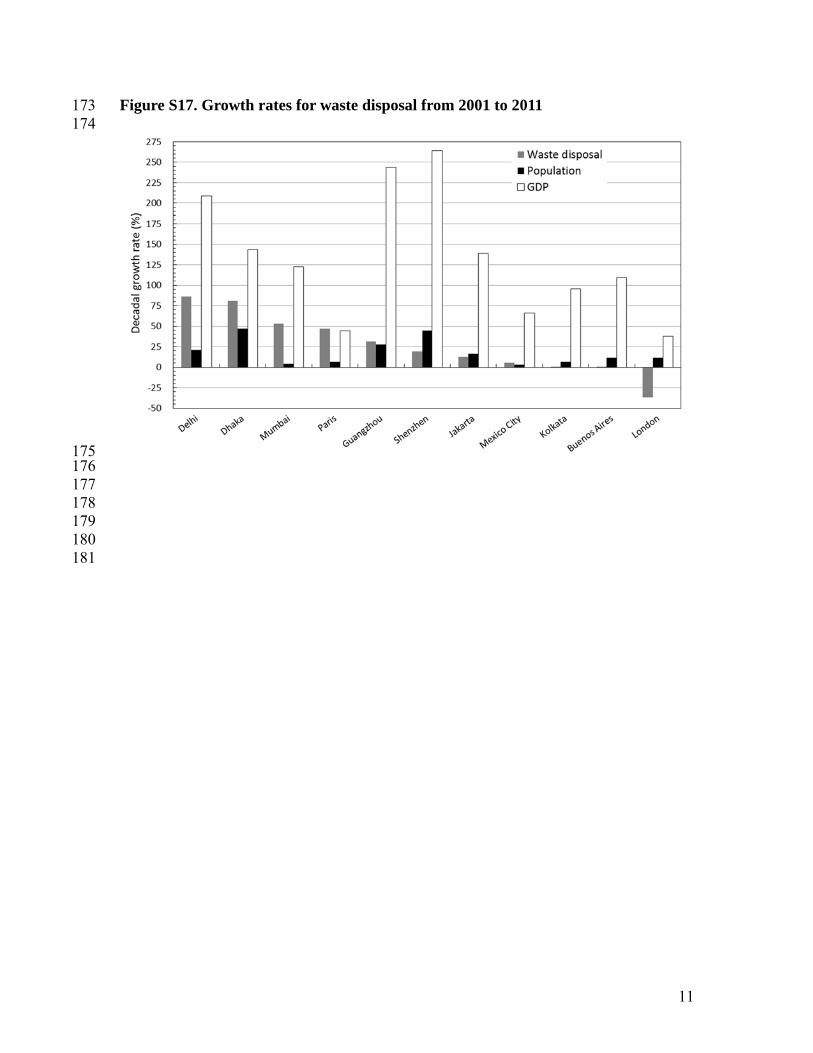
Figure S17. Growth rates for waste disposal from 2001 to 2011 173 174
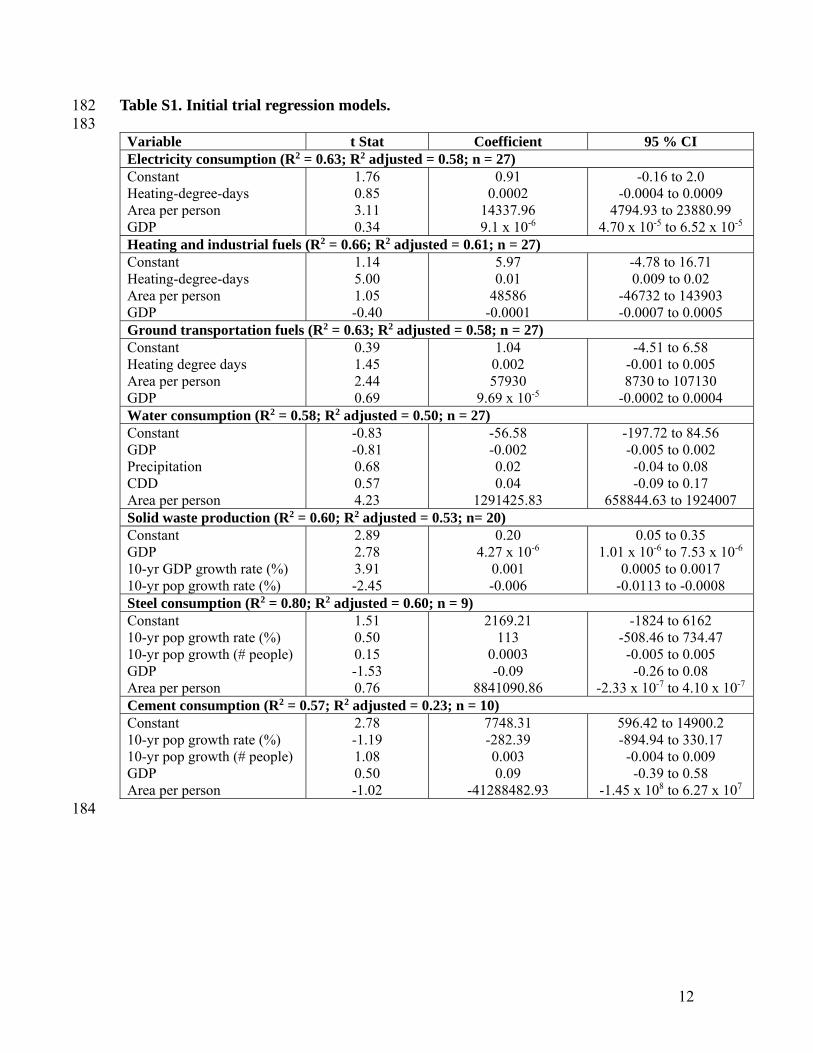
Variable t Stat Coefficient 95 % CI Electricity consumption (R2 = 0.63; R2 adjusted = 0.58; n = 27) Constant Heating-degree-days Area per person GDP
1.76 0.85 3.11 0.34
0.91 0.0002
14337.96 9.1 x 10⁻⁶
-0.16 to 2.0 -0.0004 to 0.0009
4794.93 to 23880.99 4.70 x 10⁻⁵ to 6.52 x 10⁻⁵
Heating and industrial fuels (R2 = 0.66; R2 adjusted = 0.61; n = 27) Constant Heating-degree-days Area per person GDP
1.14 5.00 1.05 -0.40
5.97 0.01
48586 -0.0001
-4.78 to 16.71 0.009 to 0.02
-46732 to 143903 -0.0007 to 0.0005
Ground transportation fuels (R2 = 0.63; R2 adjusted = 0.58; n = 27) Constant Heating degree days Area per person GDP
0.39 1.45 2.44 0.69
1.04 0.002 57930
9.69 x 10⁻⁵
-4.51 to 6.58 -0.001 to 0.005 8730 to 107130
-0.0002 to 0.0004 Water consumption (R2 = 0.58; R2 adjusted = 0.50; n = 27) Constant GDP Precipitation CDD Area per person
-0.83 -0.81 0.68 0.57 4.23
-56.58 -0.002 0.02 0.04
1291425.83
-197.72 to 84.56 -0.005 to 0.002 -0.04 to 0.08 -0.09 to 0.17
658844.63 to 1924007 Solid waste production (R2 = 0.60; R2 adjusted = 0.53; n= 20) Constant GDP 10-yr GDP growth rate (%) 10-yr pop growth rate (%)
2.89 2.78 3.91 -2.45
0.20 4.27 x 10⁻⁶
0.001 -0.006
0.05 to 0.35 1.01 x 10⁻⁶ to 7.53 x 10⁻⁶
0.0005 to 0.0017 -0.0113 to -0.0008
Steel consumption (R2 = 0.80; R2 adjusted = 0.60; n = 9) Constant 10-yr pop growth rate (%) 10-yr pop growth (# people) GDP Area per person
1.51 0.50 0.15 -1.53 0.76
2169.21 113
0.0003 -0.09
8841090.86
-1824 to 6162 -508.46 to 734.47
-0.005 to 0.005 -0.26 to 0.08
-2.33 x 10⁻⁷ to 4.10 x 10⁻⁷ Cement consumption (R2 = 0.57; R2 adjusted = 0.23; n = 10) Constant 10-yr pop growth rate (%) 10-yr pop growth (# people) GDP Area per person
2.78 -1.19 1.08 0.50 -1.02
7748.31 -282.39 0.003 0.09
-41288482.93
596.42 to 14900.2 -894.94 to 330.17
-0.004 to 0.009 -0.39 to 0.58
-1.45 x 10⁸ to 6.27 x 10⁷ 184
13
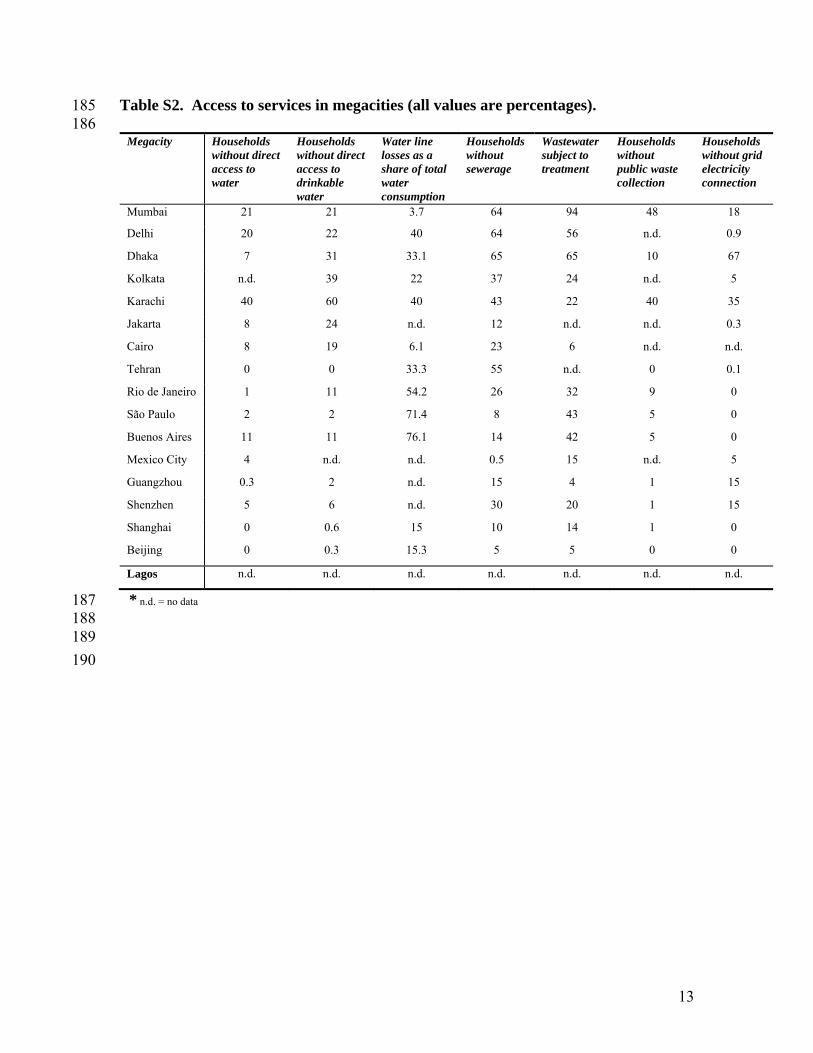
Table S2. Access to services in megacities (all values are percentages). 185 186
Megacity Households without direct access to water
Households without direct access to drinkable water
Water line losses as a share of total water consumption
Households without sewerage
Wastewater subject to treatment
Households without public waste collection
Households without grid electricity connection
Mumbai 21 21 3.7 64 94 48 18
Delhi 20 22 40 64 56 n.d. 0.9
Dhaka 7 31 33.1 65 65 10 67
Kolkata n.d. 39 22 37 24 n.d. 5
Karachi 40 60 40 43 22 40 35
Jakarta 8 24 n.d. 12 n.d. n.d. 0.3
Cairo 8 19 6.1 23 6 n.d. n.d.
Tehran 0 0 33.3 55 n.d. 0 0.1
Rio de Janeiro 1 11 54.2 26 32 9 0
São Paulo 2 2 71.4 8 43 5 0
Buenos Aires 11 11 76.1 14 42 5 0
Mexico City 4 n.d. n.d. 0.5 15 n.d. 5
Guangzhou 0.3 2 n.d. 15 4 1 15
Shenzhen 5 6 n.d. 30 20 1 15
Shanghai 0 0.6 15 10 14 1 0
Beijing 0 0.3 15.3 5 5 0 0
Lagos n.d. n.d. n.d. n.d. n.d. n.d. n.d.
* n.d. = no data 187 188 189
190
14
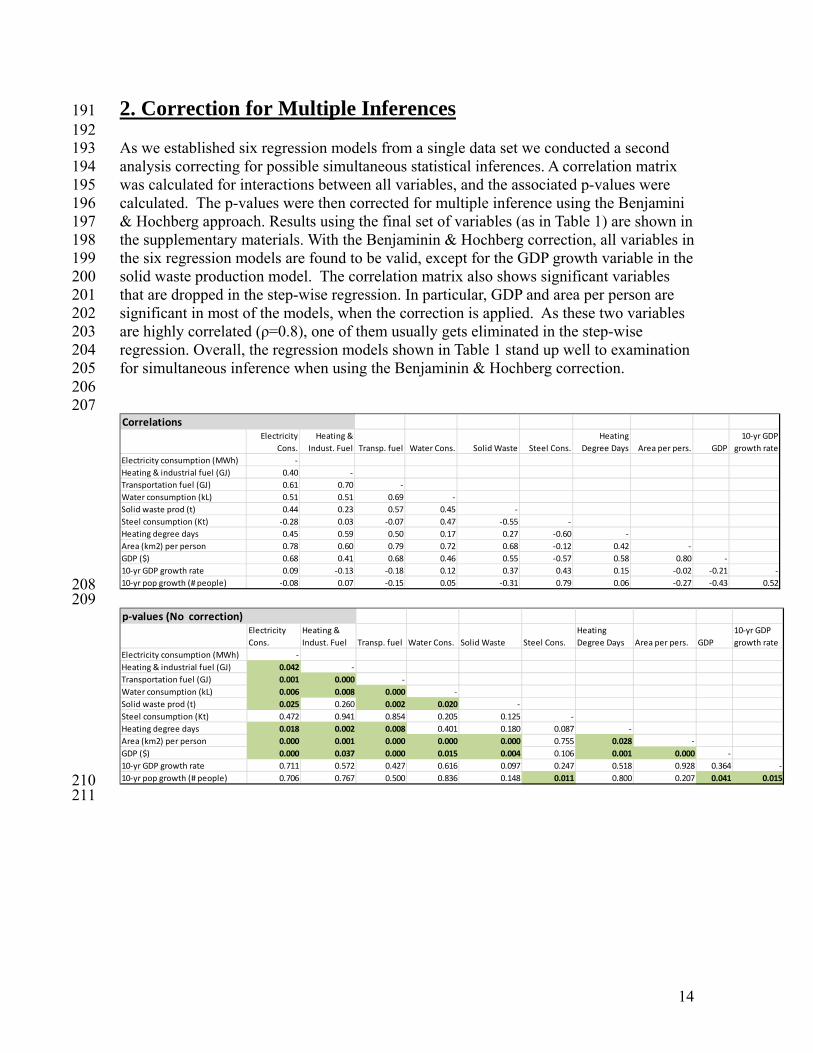
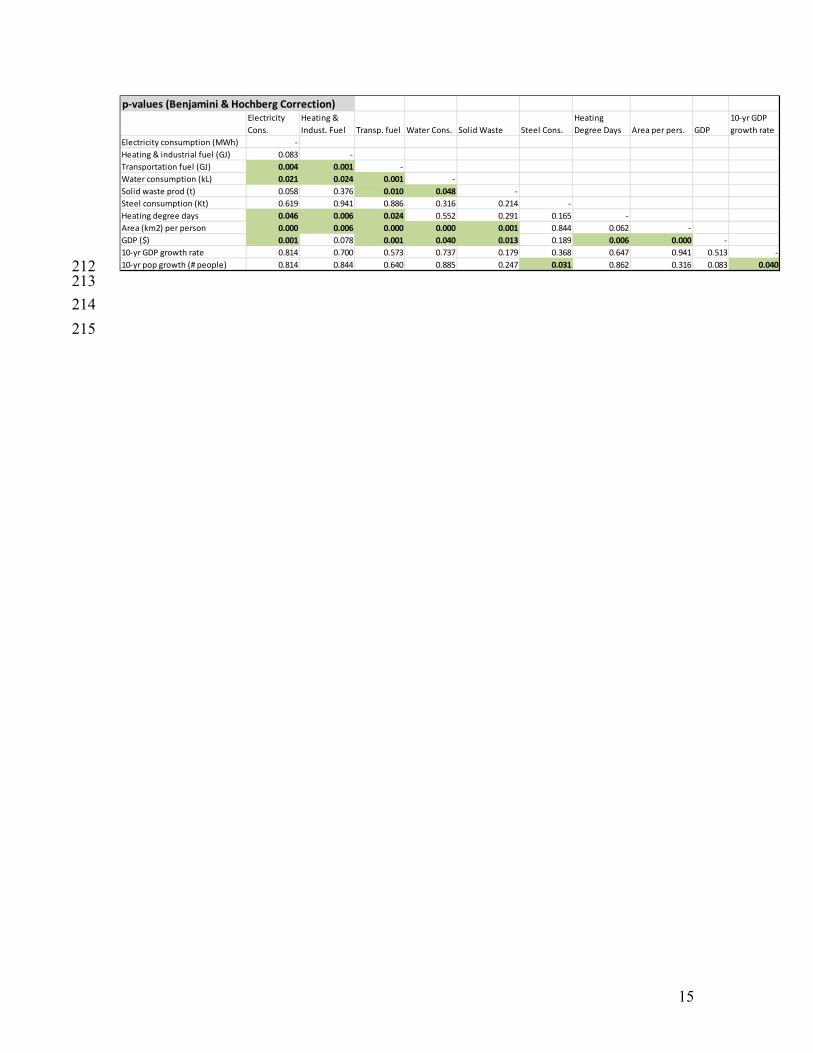
2. Correction for Multiple Inferences 191 192 As we established six regression models from a single data set we conducted a second 193 analysis correcting for possible simultaneous statistical inferences. A correlation matrix 194 was calculated for interactions between all variables, and the associated p-values were 195 calculated. The p-values were then corrected for multiple inference using the Benjamini 196 & Hochberg approach. Results using the final set of variables (as in Table 1) are shown in 197 the supplementary materials. With the Benjaminin & Hochberg correction, all variables in 198 the six regression models are found to be valid, except for the GDP growth variable in the 199 solid waste production model. The correlation matrix also shows significant variables 200 that are dropped in the step-wise regression. In particular, GDP and area per person are 201 significant in most of the models, when the correction is applied. As these two variables 202 are highly correlated (ρ=0.8), one of them usually gets eliminated in the step-wise 203 regression. Overall, the regression models shown in Table 1 stand up well to examination 204 for simultaneous inference when using the Benjaminin & Hochberg correction. 205 206 207
208 209
210 211
CorrelationsElectricity
Cons.
Heating &
Indust. Fuel Transp. fuel Water Cons. Solid Waste Steel Cons.
- Solid waste generation for 2011 is estimated to be 400 kg per person per year, 13 248 percent of which is incinerated and the remainder sent to landfill (Future Watch 249 Report, 2013). 250
- Heating and industrial fuel consumption data were scaled by population from 251 national to megacity level (values represent heating component of combined heat 252 and power system) 253
254 New York City 255 256
- Study area population: 22,214,518 (Megacity: 22,200,000) 257 - Per capita GDP: 60,751 258 - Constituent cities: New York City (Bronx, Brooklyn, Manhattan, Queens and 259
Staten Island); West Connecticut (Fairfield, Litchfield and New Haven counties); 260 North New Jersey (Bergen, Essex, Hudson, Hunterdon, Mercer, Middlesex, 261
17
Monmouth, Morris, Ocean, Passaic, Somerset, Sussex, Union and Warren 262 counties), Long Island (Nassau and Suffolk counties); Mid-Hudson region 263 (Dutchess, Orange, Putnam, Rockland, Sullivan, Ulster and Westchester counties) 264
- Energy consumption data were scaled by population (from 20,314,077 people to 265 22,214,518 people) 266
- New Jersey energy consumption data for 2006 were used in the total energy 267 consumption calculation for New York Metropolitan region for 2011 268
269 Los Angeles 270 271
- Study area population: 9,889,000 (Megacity: 17,900,000) 272 - Per capita GDP: 74,045 273 - Constituent cities: Los Angeles, Pasadena, Santa Monica, Monrovia, Pomona, 274
Long Beach, South Pasadena, Compton, Redondo Beach, Whittier, Azusa, 275 Covina, Alhambra, Arcadia, Vernon, Glendale, Huntington Park, La Verne, 276 Hermosa Beach, Sierra Madre, Claremont, Inglewood, Burbank, San Fernando, 277 Glendora, El Monte, Manhattan Beach, San Gabriel, San Marino, Avalon, 278 Beverly Hills, Monterey Park, El Segundo, Culver City, Montebello, Torrance, 279 Lynwood, Hawthorne, South Gate, West Covina, Signal Hill, Maywood, Bell, 280 Gardena, Palos Verdes Estates, Lakewood, Baldwin Park, Cerritos, La Puente, 281 Downey, Rolling Hills, Paramount, Santa Fe Springs, Industry, Bradbury, 282 Irwindale, Duarte, Norwalk, Bellflower, Rolling Hills Estates, Pico Rivera, South 283 El Monte, Walnut, Artesia, Rosemead, Lawndale, Commerce, La Mirada, Temple 284 City, San Dimas, Cudahy, Bell Gardens, Hidden Hills, Palmdale, Hawaiian 285 Gardens, Lomita, Carson, Rancho Palos Verdes, La Cañada-Flintridge, Lancaster, 286 La Habra Heights, Westlake Village, Agoura Hills, West Hollywood, Santa 287 Clarita, Diamond Bar, Malibu, Calabasas 288
- Stationary energy consumption data (excluding electricity) were scaled by 289 population from state (California) to megacity level 290
- Mobile energy consumption data for diesel and jet fuel were scaled by population 291 from state (California) to megacity level 292
293 Mexico City 294 295
- Study area population: 8,851,080 (Megacity: 23,400,000) 296 - Per capita GDP: 34,973 297 - Constituent cities: Azcapotzalco, Coyoacán, Cuajimalpa de Morelos, Gustavo A. 298
Madero, Iztacalco, Iztapalapa, La Magdalena Contreras, Milpa Alta, Álvaro 299 Obregón, Tláhuac, Tlalpan, Xochimilco, Benito Juárez, Cuauhtémoc, Miguel 300 Hidalgo, Venustiano Carranza, Tizayuca, Acolman, Amecameca, Apaxco, 301 Atenco, Atizapán de Zaragoza, Atlautla, Axapusco, Ayapango, Coacalco de 302 Berriozábal, Cocotitlán, Coyotepec, Cuautitlán, Chalco, Chiautla, Chicoloapan, 303 Chiconcuac, Chimalhuacán, Ecatepec de Morelos, Ecatzingo, Huehuetoca, 304 Hueypoxtla, Huixquilucan, Isidro Fabela, Ixtapaluca, Jaltenco, Jilotzingo, 305 Juchitepec, Melchor Ocampo, Naucalpan de Juárez, Nezahualcóyotl, Nextlalpan, 306 Nicolás Romero, Nopaltepec, Otumba, Ozumba, Papalotla, La Paz, San Martín de 307
18
las Pirámides, Tecámac, Temamatla, Temascalapa, Teotihuacán, Tepetlaoxtoc, 308 Tepetlixpa, Tepotzotlán, Tequixquiac, Texcoco, Tezoyuca, Tlalmanalco, 309 Tlalnepantla de Baz, Tultepec, Tultitlán, Villa del Carbón, Zumpango, Cuautitlán 310 Izcalli, Valle de Chalco, Solidaridad, Tonanitla 311
- Stationary energy consumption data (excluding electricity) were scaled by 312 population from national to megacity level 313
- Jet fuel data were scaled by population from national to megacity level 314 315 Lagos 316 317
- Study area population: 20,546,999 (Megacity: 11,800,000) 318 - Per capita GDP: 6,834 319 - Constituent cities: Agege, Ajeromi-ifelodun, Alimosho, Amuwo Odofin, Apapa 320
Badagry, Epe, Eti-osa 321 - Stationary energy (excluding electricity) and mobile energy consumption data 322
were scaled by population from national to megacity level 323 324 Sao Paulo 325 326
- Study area population: 19,822,559 (Megacity: 20,900,000) 327 - Per capita GDP: 20,916 328 - Constituent cities: Arujá, Barueri, Biritiba Mirim, Caieiras, Cajamar, 329
Carapicuiba, Cotia, Diadema, Embu das Artes, Embu-Guaçu, Ferraz de 330 Vasconcelos, Francisco Morato, Franco da Rocha, Guararema, Guarulhos, 331 Itapevi, Itapecerica da Serra, Itaquaquecetuba, Jandira, Juquitiba, Mairiporã, 332 Mauá, Mogi das Cruzes, Osasco, Pirapora do Bom Jesus, Poá, Ribeirão Pires, Rio 333 Grande da Serra, Salesópolis, Santa Isabel, Santana de Parnaíba, Santo André, 334 São Bernardo do Campo, São Caetano do Sul, São Lourenço da Serra, São Paulo, 335 Suzano, Taboão da Serra, Vargem Grande Paulista 336
337 Rio de Janeiro 338 339
- Study area population: 11,909,897 (Megacity: 12,600,000) 340 - Per capita GDP: 13,653 341 - Constituent cities: Belford Roxo, Duque de Caxias, Guapimirim, Itaboraí, 342
Itaguaí, Japeri, Magé, Maricá, Mesquita, Nilópolis, Niterói, Nova Iguaçu, 343 Paracambi, Queimados, Rio de Janeiro, São Gonçalo, São João de Meriti, 344 Seropédica e Tanguá 345
346 Buenos Aires 347 348
- Study area population: 12,806,866 (Megacity: 13,300,000) 349 - Per capita GDP: 8,503 350 - Constituent cities: Almirante Brown, Avellaneda, Berazategui, Esteban 351
Echeverría, Ezeiza, Florencio Varela, General San Martín, Hurlingham, Ituzaingó, 352 José C. Paz, La Matanza, Lanús, Lomas de Zamora, Malvinas Argentinas, Merlo, 353
19
Moreno, Morón, Quilmes, San Fernando, San Isidro, San Miguel, Tigre, Tres de 354 Febrero, Vicente López 355
356 Cairo 357 358
- Study area population: 20,495,461 (Megacity: 15,200,000) 359 - Per capita GDP: 6,440 360 - Constituent cities: Cairo Governorate, the urban parts of Giza Governorate, and 361
Qaliubia Governorate 362 - Wastewater volumes for 2006 and 2011 include sewerage and industrial waste. 363 - Electricity consumption data were scaled by number of customers from national 364
to megacity level 365 366 Tehran 367 368
- Study area population: 12,183,391 (Megacity: 12,800,000) 369 - Per capita GDP: 11,860 370 - Constituent cities: Boomehen, Pardis, Firuzkooh, Varamin, Shahriar, Islamshahr, 371
Robatkarim, Damavand, Pakdasht, Karaj, Nesa, and Savejbolagh 372 - Water consumption values are based on an estimated consumption rate of 250 373
litres per day 374 - Electricity line losses are estimated to be 15 % of electricity consumption values 375 - Water line losses are estimated to be 25 % of water consumption values 376
377 Istanbul 378 379
- Study area population: 13,483,052 (Megacity: 12,800,000) 380 - Per capita GDP: 10,444 381 - Constituent cities: Adalar, Arnavutköy, Ataşehir, Avcılar, Bakırköy, Beylikdüzü, 382
- Study area population: 11,855,975 (Megacity: 19,600,000) 391 - Per capita GDP: 11,788 392 - Constituent cities: Caloocan, Malabon, Navotas, Valenzuela, Quezon City, 393
Marikina, Pasig, Taguig, Makati, Manila, Mandaluyong, San Juan, Pasay, 394 Parañaque, Las Piñas, Muntinlupa 395
- Mobile energy consumption data were scaled by population from national to 396 megacity level 397
398 Jakarta 399
20
400 - Study area population: 9,786,372 (Megacity: 15,400,000) 401 - Per capita GDP: 10,040 402 - Constituent cities: Central Jakarta (Jakarta Pusat), North Jakarta (Jakarta Utara), 403
East Jakarta (Jakarta Timur), South Jakarta (Jakarta Selatan), West Jakarta 404 (Jakarta Barat), Thousand Islands (Kepulauan Seribu) 405
- When converting solid waste units from volume to mass, one cubic metre of 406 waste is assumed to be equivalent to 600 kg 407
- Fuel oil consumption values for 2006 were substituted for 2011 408 - Mobile energy consumption values (excluding gasoline and diesel) for 2006 were 409
substituted for 2011 410 411 Delhi 412 413
- Study area population: 16,753,235 (Megacity: 23,200,000) 414 - Per capita GDP: 8,443 415 - Constituent cities: Municipal Corporation of Delhi, New Delhi Municipal 416
Corporation, Delhi Cantonment Board 417 - It is estimated that line losses for water are 40 % of water consumption values 418
419 Mumbai 420 421
- Study area population: 12,478,447 (Megacity: 22,800,000) 422 - Per capita GDP: 8,971 423 - Constituent cities: Greater Mumbai, Navi Mumbai, Thane, Kalyan-Dombivali, 424
Vasai-Virar, Mira-Bhayandar, Bhiwandi-Nizampur, Ulhasnagar 425 - Electricity line losses are estimated to be 15 % of electricity consumption values 426 - Water line losses are estimated to be 20 % of water consumption values (Reddy, 427
2013) 428 429 Kolkata 430 431
- Study area population: 14,112,536 (Megacity: 16,300,000) 432 - Per capita GDP: 5,765 433 - Constituent cities: Kolkata Municipal Corporation, Howrah Municipal 434
Corporation, Chandan nagar Municipal Corporation 435 - GDP values for 2011 were scaled by the national cumulative GDP growth rate 436
(2000 to 2009) 437 - Water consumption values include private water tapping (which has no proper 438
accounting) and are therefore said to be unreliable 439 440 Karachi 441 442
- Study area population: 15,500,000 (Megacity: 16,200,000) 443 - Per capita GDP: 5,161 444
21
- Constituent cities: Bin Qaism, Gadap, Malir, Gulberg, Liaquatabad, North 445 Karachi, North Nazimabad, Jamshed, Lyari, Saddar, Baldia, Kemari, Orangi, Site, 446 Gulshan, Korangi, Landhi, Shah Faisal 447
- Stationary energy (excluding electricity) and mobile energy consumption data 448 were scaled by population from national to megacity level 449
450 Dhaka 451 452
- Study area population: 15,616,562 (Megacity: 13,600,000) 453 - Per capita GDP: 6,139 454 - Constituent cities: Dhaka City Corporation (North), Dhaka City Corporation 455
(South), Narayangonj, Savar, Gazipur, Tongi 456 - Stationary energy consumption data (excluding electricity) were scaled by GDP 457
from national to megacity level 458 - Mobile energy consumption data were scaled by population from national to 459
megacity level 460 - Building materials data were scaled by population from national to megacity level 461
462 Seoul 463 464
- Study area population: 10,528,774 (Megacity: 24,200,000) 465 - Per capita GDP: 32,261 466 - Constituent cities: Dobong, Dongdaemun, Dongjak, Eunpyeong, Gangbuk, 467
- Study area population: 35,622,000 (Megacity: 34,000,000) 474 - Per capita GDP: 33,521 475 - Constituent cities: Tokyo, Kanagawa, Chiba and Saitama prefectures 476 - Water consumption data were scaled by population from metropolitan to megacity 477
level 478 - Solid waste data were scaled by population from metropolitan to megacity level 479
480 Osaka 481 482
- Study area population: 17,089,000 (Megacity: 16,800,000) 483 - Per capita GDP: 30,124 484 - Constituent cities: Osaka, Kyoto, and Hyogo prefectures 485 - Water consumption data were scaled by population from metropolitan to megacity 486
level 487 - Solid waste data were scaled by population from metropolitan to megacity level 488 - Solid waste disposal on land includes residue from incineration. 489
490
22
Shenzhen 491 492
- Study are population: 10,467,400 (Megacity: 10,400,000) 493 - Per capita GDP: 26,171 494 - Constituent cities: Futian, Luohu, Nanshan, Yantian, Baoan, and Longgang 495
districts 496 - Heating and industrial fuels, and ground transportation fuels use scaled from 497
provincial values.Mobile energy data for jet fuel include marine fuel 498 499 Guangzhou 500 501
- Study area population: 12,751,400 (Megacity: 16,500,000) 502 - Per capita GDP: 23,197 503 - Constituent cities: Yuexiu Area, Haizhu Area, Liwan Area, Tianhe Area, Baiyun 504
Area, Huangpu Area, Huadu Area, Panyu Area, Luogang Area, Nansha Area, 505 Conghua City, Zengcheng City 506
- All diesel oil is assumed to be used for transportation, although it is possible that 507 some diesel is used for stationary energy 508
509 Shanghai 510 511
- Study area population: 23,474,600 (Megacity 18,400,000) 512 - Per capita GDP: 19,470 513 - Constituent cities: Pudong New District, Xuhui District, Changning District, 514
- All diesel oil is assumed to be used for transportation, although it is possible that 532 some diesel is used for stationary energy 533
- Mobile energy data for gasoline and diesel include jet fuel 534 535
23
4. References 536 537
1. Kennedy CA, Ibrahim N, Stewart I, Facchini A, Mele R (2014) Developing a 538 multi-layered indicator set for urban metabolism studies in megacities, 539 Ecological Indicators, 47, 7-15. 540
2. City Population, http://www.citypopulation.de/world/Agglomerations.html, 541 accessed April 1, 2013 542