1
Supplementary Materials: Clear distinction between CAC and CMC
revealed by high-resolution NMR diffusometry for a series of bis-
imidazolium gemini surfactants in aqueous solutions
Kosma Szutkowski1,*, Żaneta Kołodziejska2, Zuzanna Pietralik2, Igor Zhukov3,
Andrzej Skrzypczak4, Katarzyna Materna4 and Maciej Kozak2
1) NanoBioMedical Centre, Adam Mickiewicz University in Poznań,
Umultowska 85, PL61614 Poznań, Poland
2) Department of Macromolecular Physics, Faculty of Physics, Adam
Mickiewicz University in Poznań, Umultowska 85, PL61614 Poznań, Poland
3) Institute of Biochemistry and Biophysics, Polish Academy of Sciences,
Pawińskiego 5a, PL02106 Warsaw, Poland
4) Institute of Chemical Technology and Engineering, Faculty of Chemical
Technology, Poznań University of Technology, Berdychowo 4, PL60965
Poznań, Poland
Email: [email protected]
Electronic Supplementary Material (ESI) for RSC Advances.This journal is © The Royal Society of Chemistry 2018
2
3.1 Surface tension isotherms
Tab.S1 The summary of the results for C12JC2-C12JC12 gemini surfactants obtained from the
surface tension experiment.
Spacer
length a×105 b
CC
[mM] log(CC)
γCC
[mN/m]
Г×106
[M/m2]
A×1019
[m2]
-ΔGads
[kJ/mol]
C2 4.872 0.181 0.71 3.1 37.0 5.4 3.08 24.2
C4 1.788 0.141 0.62 3.2 38.3 4.2 3.93 26.6
C6 1.517 0.126 0.47 3.3 39.6 3.8 4.42 27.0
C8 1.061 0.130 0.26 3.5 40.1 3.9 4.29 27.9
C10 7.934 0.104 0.24 3.6 45.8 3.1 5.35 28.6
C12 7.351 0.072 0.21 3.7 42.5 2.2 7.73 28.8
CC [mM] – critical concentration (traditionally CMC)
γCC [mN/m] – the value of surface tension at critical concentration (with an accuracy of ± 0.2 mN/m2)
Г×106 [M/m2] – the value of surface excess (with an accuracy of 106 ± 0.2 M/m2)
A×1019 [m2] – a molecular area of a single particle (with an accuracy of 1019 ± 0.08 m2)
ΔGads [kJ/mol] – the free energy of adsorption of the molecule (with an accuracy of ± 0.2 kJ/mol)
3.3 Absorbance of BZA. UV-Vis spectra of gemini surfactants.
UV-Vis absorption curves in the range 200-235 nm are shown in Fig.S1. We observe a
broad absorption maximum for all samples. In this particular case, in the topmost Fig.S1, we
show the results for two surfactants with and without salt (pD 6.8) for the shortest and the
longest spacer: C12JC2 and C12JC12. In the bottommost Fig.S1, we show the dependence of
the frequency shift vs. the spacer length. Two bathochromic shifts of approximately 1 nm are
present. Therefore two different mechanisms of UV absorption can be distinguished. The first
mechanism is related to the spacer length and the second one to the salt concentration (pD). The
pD of the phosphate buffer was 6.8, and since gemini surfactants in the study have no ionizable
groups, the pD without the buffer was neutral. We assign the absorption band at ~214 nm to the
π→π* transition of the imidazole ring, which is the only chromophore group in the studied
3
gemini molecules. We observe the first bathochromic shift, i.e., a change of spectral band
position to longer wavelengths (redshift) due to changes in pD and salt concentration. We assign
this shift to changes in the solvent polarity and screening of the charge.1 Accordingly, the
increased salt concentration will alter an overall dipole moment of the molecule albeit in turn,
an increased spacer will decrease it. The spacer length is responsible for the second observed
shift where a shift towards longer wavelengths pronounces an increase of the number of
methylene groups in the spacer due to increasing distance between two chromophores.
Fig.S1. UV absorption spectra of studied gemini surfactants solutions. Top: selected
absorption peaks. Bottom: the dependence of the maximum absorption on the spacer
length.
3.4 Self-diffusion studied by PGSE NMR. Bayesian DOSY (BDOSY)
4
Fig.S2. Selected BDOSY displays obtained for aqueous solutions of C12JC2-C12JC12
surfactants. 2D BDOSY displays for three different concentrations.
5
3.4.1 Self-diffusion below the critical concentrations. FT-PGSE
Fig.S3 An example of FT-PGSE data analysis. Sample: C12JC2 0.75 mM
Fig.S4 An example of FT-PGSE data analysis. Sample: C12JC2 1.5 mM. We observe a
small deviation from the linear dependence of ln(A) vs. g2.
3.4.1 Self-diffusion below the critical concentrations. Molecular Dynamics
simulations
6
The initial simulation models were built using Abalone software (version 1.8.90, Agile
Molecule). The surfactant molecules were equally spaced by 50 Å in a cubic lattice 3×3×3. The
simulation box was cubic with periodic boundaries 200×200×200 Å3. Molecular Dynamics
simulations were carried out using Yasara Structure 15.9.6 (Elmar Krieger) using HP DL380
gen 8 with dual Xeon E5-2450 CPU supported with Nvidia TESLA K20C GPU. The
simulations were carried out using a modified Yasara macro 'md_run’. The simulation was
initialized by addition of water molecules into the simulation cell and setting up pH to 7 and
supplemented by the addition of Na+ and Cl- ions. Afterward, pKa shifts were predicted,
steepest descent minimization without electrostatics and simulated annealing minimization of
the solvent was run before final simulations. The Amber992 force field was used, the
temperature was kept at 298 K using a rescale velocity algorithm, the simulation step was 1.25
fs and force cut-off was set to 10.5 Å. The total number of atoms varied between 0.3-0.4 ×10⁶;
the simulation trajectories were longer than 20 ns. All necessary calculations, such as the
solvent accessible surface area were calculated using the Particle Mesh Ewald (PME) algorithm
using built-in functions of Yasara software. The solvent accessible surface areas derived from
MD simulations are shown in Fig.S5. Two timescales can be identified. The self-coiling time
scale region is responsible for molecular dynamics of monomeric surfactant molecules without
the creation of aggregates. The second time scale, the initial aggregation, is the time during
which dimers start to appear. For longer time scales some non-linear behavior of the surface
area can be noticed. This is represented by small bumps in the plot as the result of structural
relaxation (energy minimization) within the aggregates, which is manifested by expansion and
contraction and variations of the surface area due to energy minimization.
7
Fig.S5. Surface area per molecule obtained from MD simulations. The simulation time
was long enough to capture the self-coiling behavior and the creation of the small
aggregates is shown.
8
3.4.2 Self-diffusion above the critical concentrations
Fig.S6 An example of FT-PGSE data analysis. Sample: C12JC2 2 mM. We observe a
considerable deviation from the linear dependence of ln(A) vs. g2. This results in semi-
two diffusion coefficients resolved in the DOSY plot.
Fig.S7 An example of FT-PGSE data analysis. Sample: C12JC2 5 mM. We observe a
considerable deviation from the linear dependence of ln(A) vs. g2. In this case, we
observe a continuous and broad distribution of diffusion coefficients resolved in the
DOSY plot.
9
Fig.S8 Left: raw FT-PGSE data before DOSY processing. Right: Processed 2D DOSY
display. Sample: C12JC4 40 mM, Diffusion time =60 ms. Probehead: DOTY DSI-
1374.
3.5 The diffusion transition curve. An impact of the obstruction factor and
aggregation on the self-diffusion coefficients
Fig.S9 The dependence of self-diffusion coefficients versus concentration obtained for
CTAB surfactant. To be published.
-5.5 -5.0 -4.5 -4.0 -3.5 -3.0 -2.5 -2.0 -1.5 -1.00
1
2
3
4
5
CTAB
Dx1
01
0 [m
2/s
]
log C
10
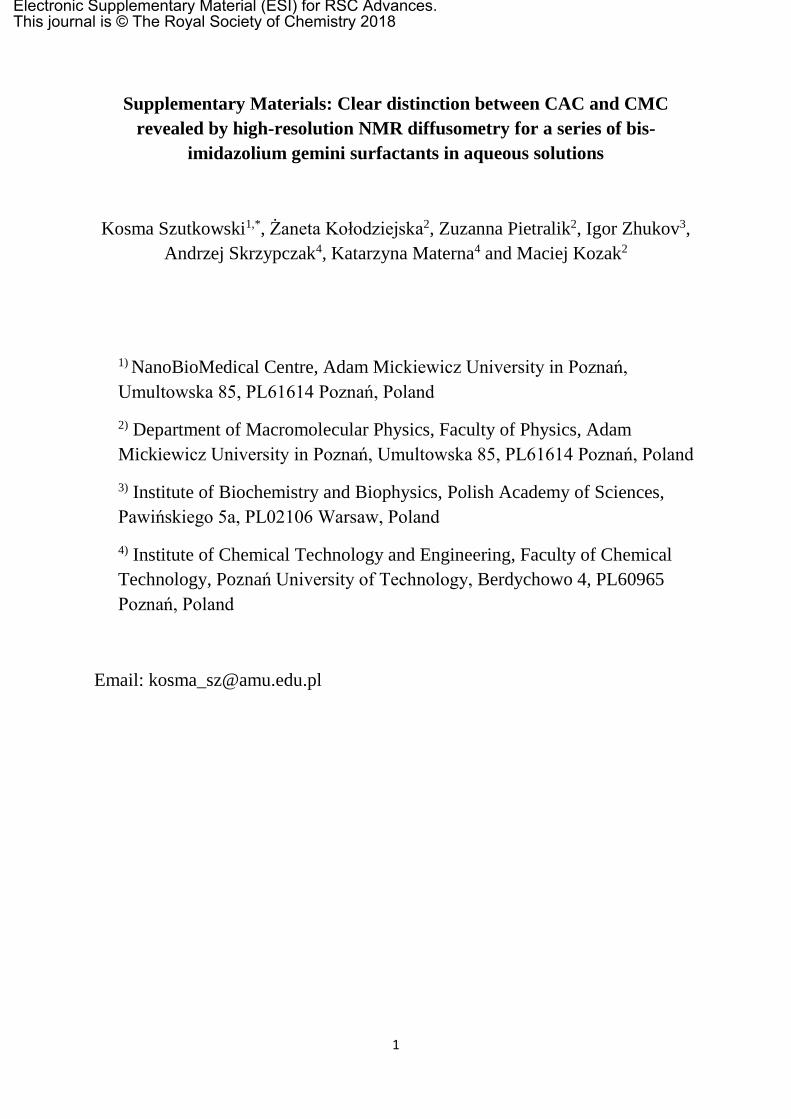
Fig.S10 The dependence of self-diffusion coefficients versus concentration obtained for
1,4-bis(N,N-dimethyl-N-tetradecylammonium) butane dibromide Gemini surfactant. To
be published.
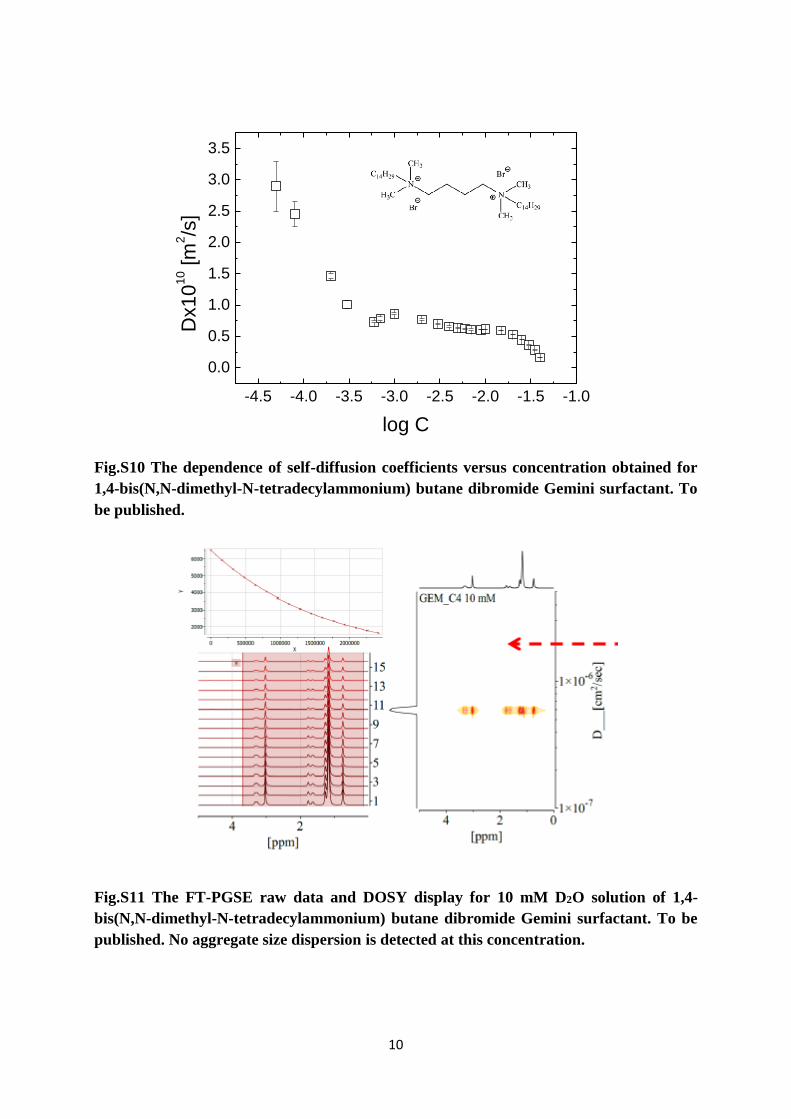
Fig.S11 The FT-PGSE raw data and DOSY display for 10 mM D2O solution of 1,4-
bis(N,N-dimethyl-N-tetradecylammonium) butane dibromide Gemini surfactant. To be
published. No aggregate size dispersion is detected at this concentration.
-4.5 -4.0 -3.5 -3.0 -2.5 -2.0 -1.5 -1.0
0.0
0.5
1.0
1.5
2.0
2.5
3.0
3.5
Dx1
01
0 [m
2/s
]
log C
11
3.6 The slow-exchange and non-averaged dipole–dipole interactions above the
critical concentrations
Fig.S12 1H NMR spectra for C12JC2 surfactant for concentration range from 0.1 mM to
20 mM at 294 K.
12
Fig.S13 Selected NOESY spectra for C12JC2 at 1 and 2 mM and C12JC6 at 10 mM.
3.6 The slow-exchange and non-averaged dipole–dipole interactions above the
critical concentrations. FT-IR.
FT-IR spectra were recorded using attenuated total reflection (ATR) technique with
Tensor 27 spectrometer (Bruker Optic, Ettlingen, Germany), equipped in MCT detector and
triple horizontal reflection PIKE MIRacleTM ATR accessory (Zinc selenide, 45 deg). Samples
of 50 l volume (20 mM) were placed on ZnSe crystal window and incubated at room
temperature for 15 minutes before each measurement. Each spectrum was acquired with 512
scans in the MIR spectral range (4000-400 cm-1). The resolution of the experimental data was
2 cm-1. The data was analyzed using the Opus program (Bruker Optics, Ettlingen, Germany).
We have derived the peak positions of specific bands from the second derivative.
13
FT-IR spectra recorded for 20 mM concentrations of studied surfactants are shown in
Fig.S14. The spectra exhibit a few weak absorption bands which can be assigned and identified.
Methylene groups are present in both hydrophobic side chains and the spacer group of the
surfactant molecule. Accordingly, an overlap of the signal of these two populations takes place,
and it is difficult to separate the part originating from the spacer group oscillations. The most
conservative bands for organic compounds correspond to the stretching vibrations of CH2, and
CH3 groups and are shown in Fig.S14a. Following vibrations have been identified: (1)
asymmetric stretching of –CH3 groups (Fig.S14b), (2) asymmetric stretching of –CH2 groups
(Fig.S14c) and (3) symmetric stretching of –CH2 groups (Fig.S14d). An impact of the buffer
results in a slight frequency shift of vibration modes for spacer lengths from C2 up to C8.
14
Fig.S14 FT-IR spectra obtained for 20 mM solutions of studied gemini surfactants as a
function of the spacer length (number of methylene groups in the hydrophobic part). (a)
The region of the analysis, (b) peak positions for an asymmetric stretching vibration of -
CH3 groups, (c) peak positions for an asymmetric and (d) for symmetric stretching
vibration of –CH2 groups.
15
For dioxydecyl (C12JC10) and dioxydodecyl (C12JC12) spacers, the tendency is
different. A general trend is similar for all analyzed infrared bands, i.e., with an increasing
number of methylene groups in the spacer group; the bands shift towards lower wavenumbers.
The most noticeable change is observed for C12JC10 and C12JC12 samples where the most
intense band, the asymmetric stretching vibrations of CH2 groups (Fig.S14c), has a minimum
at approximately 2924 cm-1 whereas for surfactants with shorter spacers this band appears at
~2926 cm-1. This shift suggests a higher level of the order obtained for longer spacers. Other
authors have shown previously that spacers longer than 12 methylene groups incorporate into
the hydrophobic micellar core formed by the side chains.3 Therefore this band dependence
obtained for asymmetric stretching vibrations (Fig.S14c) may indicate that linker is in the
proximity of alkyl chains. As a result, the CH2 groups from the spacer are closer to each other.
Such situation would allow minimizing the hydrophobic surface of the aggregates and a higher
level of the organization due to more contracted linker where self-assembly is driven by
hydrophobic, electrostatic and van der Waals lipophilic interactions.4
16
3.7 The estimation of aggregation numbers Na. Steady State Fluorescence
Quenching (SSFQ)
Fig.S15 Steady-State Fluorescence Quenching data for 20 mM aqueous solutions for
C12JC2-C12JC12 surfactants.
17
Tab S2 The aggregation numbers Nagg obtained from SSFQ. The CMC values were taken
from Surface Tension experiments.
Surfactant C [mM] CMC [mM] Slope Cmic [M] Nagg
C2 20 0.71 0.00212 471.7 41
C4 20 0.62 0.00644 155.3 125
C6 20 0.47 0.00526 190.1 88
C8 20 0.26 0.00267 374.5 53
C10 20 0.84 0.00211 473.9 40
C12 20 0.21 0.00251 398.4 50
Literature
(1) Esumi, K.; Ueno, M. Structure-performance relationships in surfactants; CRC Press,
2003; Vol. 112.
(2) Case, D. A.; Pearlman, D. A.; Caldwell, J. W.; Cheatham III, T. E.; Ross, W. S.;
Simmerling, C. L.; Darden, T. A.; Merz, K. M.; Stanton, R. V.; Cheng, A. L. Univ.
California: San Francisco 1999.
(3) Badea, I.; Verrall, R.; Baca-Estrada, M.; Tikoo, S.; Rosenberg, A.; Kumar, P.;
Foldvari, M. J. gene Med. 2005, 7, 1200–1214.
(4) Zana, R. J. Colloid Interface Sci. 2002, 248, 203–220.