advances.sciencemag.org/cgi/content/full/3/12/e1701629/DC1
Supplementary Materials for
Skin-like biosensor system via electrochemical channels for noninvasive
blood glucose monitoring
Yihao Chen, Siyuan Lu, Shasha Zhang, Yan Li, Zhe Qu, Ying Chen, Bingwei Lu, Xinyan Wang, Xue Feng
Published 20 December 2017, Sci. Adv. 3, e1701629 (2017)
DOI: 10.1126/sciadv.1701629
The PDF file includes:
Supplementary Text
fig. S1. Advantage of CGM over prevalent glucose monitoring and treatment.
fig. S2. Thin and flexible biocompatible paper battery.
fig. S3. Schematic of high-density HA penetration promoting filtration of glucose
in the blood.
fig. S4. Glucose biosensing principle.
fig. S5. Different patterns for glucose biosensing dual electrode.
fig. S6. Bending stiffness (that is, flexibility) as a function of device thickness.
fig. S7. SEM micrographs of electrochemical deposited PB on different gold
electrodes.
fig. S8. PB sediments after the ECD of O-PB that are not attached to the
electrodes.
fig. S9. PB thickness measurement.
fig. S10. Twenty times of CV scan (−0.05 to 0.35 V versus reference electrode at
a scan rate of 50 mV/s).
fig. S11. Bode plot of O-Au, N-Au, O-PB, and N-PB scan frequency of 1 × 10⁻²
to 1 × 10⁻⁴
Hz.
fig. S12. Electrochemical characterization of the N-PB after 2 months’ storage.
fig. S13. Mechanical property measurement of O-PB and N-PB.
fig. S14. Biosensing device calibration experiment of high-density glucose.
fig. S15. CV scan (−0.05 to 0.35 V versus reference electrode at a scan rate of 50
mV/s) of the device in four-time repeated glucose calibration experiments.
fig. S16. Influence of pH value and temperature change on device’s performance.
fig. S17. Skin surface temperature measurement in 20 min at room temperature
with a Pt temperature sensor.
fig. S18. Skin surface condition.
Legend for movie S1
Other Supplementary Material for this manuscript includes the following:
(available at advances.sciencemag.org/cgi/content/full/3/12/e1701629/DC1)
movie S1 (.mp4 format). ROSE transfer printing.
Supplementary Text
Theoretical analysis of the HA’s effect in the ETC
In the reverse iontophoresis, two major transport mechanisms are involved:
electromigration and electroosmosis.
Electromigration is the movement of small ions across the skin under the direct influence
of an electric filed. Electron fluxes are transformed into ionic fluxes by the electrode
reactions, and ionic transport proceeds through the skin to maintain electroneutrality. The
total charge transported depends on the strength of the electric filed and the duration of
application. Iontophoresis sets in motion several ions across the skin, and all of them
compete to carry a fraction of the current. The contribution of each ion to charge
transport is called the transport number, the sum of which equals 1. According to
Faraday’s law, the flux of each ion in the iontophoretic circuit is given by
𝐽𝑖 =𝑡𝑖 × 𝐼
𝐹 × 𝑧𝑖 (1)
where 𝐽𝑖 is the flux of the ith ion, 𝑡𝑖 is its transport number, and 𝑧𝑖 is the valence; 𝐹 is
Faraday’s constant; and 𝐼 is the total current. Transport numbers depend on the relative
mobilities and concentrations of all mobile ions in the iontophoretic system and, given
that NaCl is the principal extracellular electrolyte in the body, 𝑁𝑎+ and 𝐶𝑙− carry a major
fraction of the current in iontophoresis and reverse iontophoresis.
Electroosmosis is the principal transport mechanism of uncharged molecules (such as
glucose) and of high-molecular-weight cations. The electroosmosis dominates the
transport of the glucose through the skin. The skin is negatively charged at physiologic
pH and acts, therefore, as a permselective membrane to cations. This preferential passage
of counterions induces an electroosmotic solvent flow that may carry neutral molecules in
the anode-to-cathode direction. The volume flow, 𝐽𝑣 [volume/(time·area)] is predicted to
be proportional to the potential gradient ( ) established by the electric filed
(2)
where 𝐿𝑣𝑒 is the electroosmotic flow coefficient describing the direction and the
magnitude of the volume flow. The molar flux of a solute j present at a molar
concentration 𝑐𝑗 is then
(3)
Combine equation (2) and equation (3) we can get the computational formula of the
molar flux of a solute such as glucose as
(4)
According to equation (4), the molar flux of the solute (in this case, glucose) is not only
determined by the potential gradient across the skin but also the molar concentration of
the initial solute (i.e. the glucose density in the ISF).
In our experiments, when the HA is penetrated into the subcutaneous tissue, the HA also
acts as the moisturizer. The HA’s ability to hold water increases the water content of the
skin. According to the previous research [8], the skin water content is proportional to 1
𝑅
where R is the skin impedance. According to experiment result of the HA’s influence on
the skin water content, after spraying HA (concentration 0.1%) for 1h, the skin water
content rises from ~30% to ~43% so the water content rising ratio WCRR is
WCRR =43%
30%= 1.43(for young people)
Based on the proportional relationship between skin impedance and skin water content,
the skin impedance after spraying HA will decrease.
In the electrochemical twin channels system, the total skin impendences of the anode
channel 𝑅𝑎 and the cathode channel 𝑅𝑐 can be simplified as series connection of two
equal impendences. So, the total skin impedance before spraying HA is
𝑅𝑏𝑒𝑓𝑜𝑟𝑒 = 𝑅𝑎 + 𝑅𝑐 = 2𝑅
The HA decreases the 𝑅𝑎 so that the after-HA-spray total impedance is
𝑅𝑎𝑓𝑡𝑒𝑟 = 𝑅𝑎′ + 𝑅𝑐′ =1
𝑊𝐶𝑅𝑅𝑅𝑎 + 𝑅𝑐 = 1.7𝑅 = 0.85𝑅𝑏𝑒𝑓𝑜𝑟𝑒
The solute flux outward the skin exists through the cathode channel so the potential
gradient from the ISF to the cathode is responsible for the flux. As the 𝑅𝑎 and 𝑅𝑐 are
series-connected, the potential gradient of the cathode channel after spraying HA is
where is the potential gradient of the cathode channel before spraying HA.
In Fig. 4C, the device response of the reverse iontophoresis without HA penetration is
about 6.35 nA/cm2, and the response with HA penetration is about 107.05 nA/cm
2, which
is 16.86 times higher. The moisturizer-induced potential gradient rise (1.18 times) is not
enough to yield such response increase. According to equation (4), the molar
concentration of the glucose in the ISF must have increased because of the ETC-induced
intravascular glucose re-filtration. The estimated molar concentration rise is
𝑐𝑎𝑓𝑡𝑒𝑟
𝑐𝑏𝑒𝑓𝑜𝑟𝑒=
16.86
1.18= 14.30
In summary, the theoretical analysis proves that the ETC induces more glucose from the
blood re-filtrating into the ISF, resulting in more glucose to be extracted to the skin and
higher device response.
fig. S1. Advantage of CGM over prevalent glucose monitoring and treatment. (A)
Comparison between CGM and limited times monitoring with finger-pricking
glucometer. (B) Comparison between CGM with micro insulin pump and common
glucose monitoring with insulin treatment
fig. S2. Thin and flexible biocompatible paper battery. (A) Paper battery wrapped
around a glass rod. (B) Paper battery attached to the skin surface. (C) The cathode of the
paper battery being bended on the skin. (D) The paper battery keeping conformal to the
skin while being compressed and twisted. (E) The paper battery conforms to the face
surface, potential for ocular blood glucose measuring. (F) Thickness measuring result of
the paper battery.
fig. S3. Schematic of high-density HA penetration promoting filtration of glucose in
the blood.
fig. S4. Glucose biosensing principle.
fig. S5. Different patterns for glucose biosensing dual electrode. (A) Rectangle
electrode. (B) Interdigital electrode. (C) Serpentine electrode.
fig. S6. Bending stiffness (that is, flexibility) as a function of device thickness.
fig. S7. SEM micrographs of electrochemical deposited PB on different gold
electrodes. SEM micrographs of (A) complete N-PB and (B) cracked O-PB.
fig. S8. PB sediments after the ECD of O-PB that are not attached to the electrodes.
(A) Before ECD. (B) After ECD (PB sediments shown in red circle)
fig. S9. PB thickness measurement. (A) Schematic of thickness measurement of N-PB.
(B) Thickness measuring result.
fig. S10. Twenty times of CV scan (−0.05 to 0.35 V versus reference electrode at a
scan rate of 50 mV/s).
fig. S11. Bode plot of O-Au, N-Au, O-PB, and N-PB scan frequency of 1 × 10⁻²
to 1 ×
10−4
Hz. (A) Impedance and (B) phase of O-Au and N-Au. (C) Impedance and (D) phase
of O-PB and N-PB.
fig. S12. Electrochemical characterization of the N-PB after 2 months’ storage. (A)
CV redox peak voltage and (B) current change of N-PB after two months’ storage.
fig. S13. Mechanical property measurement of O-PB and N-PB. (A) Schematic of
nano indenter measuring process. (B) Load-depth curve during loading and removing
load.
fig. S14. Biosensing device calibration experiment of high-density glucose. (A) I-t
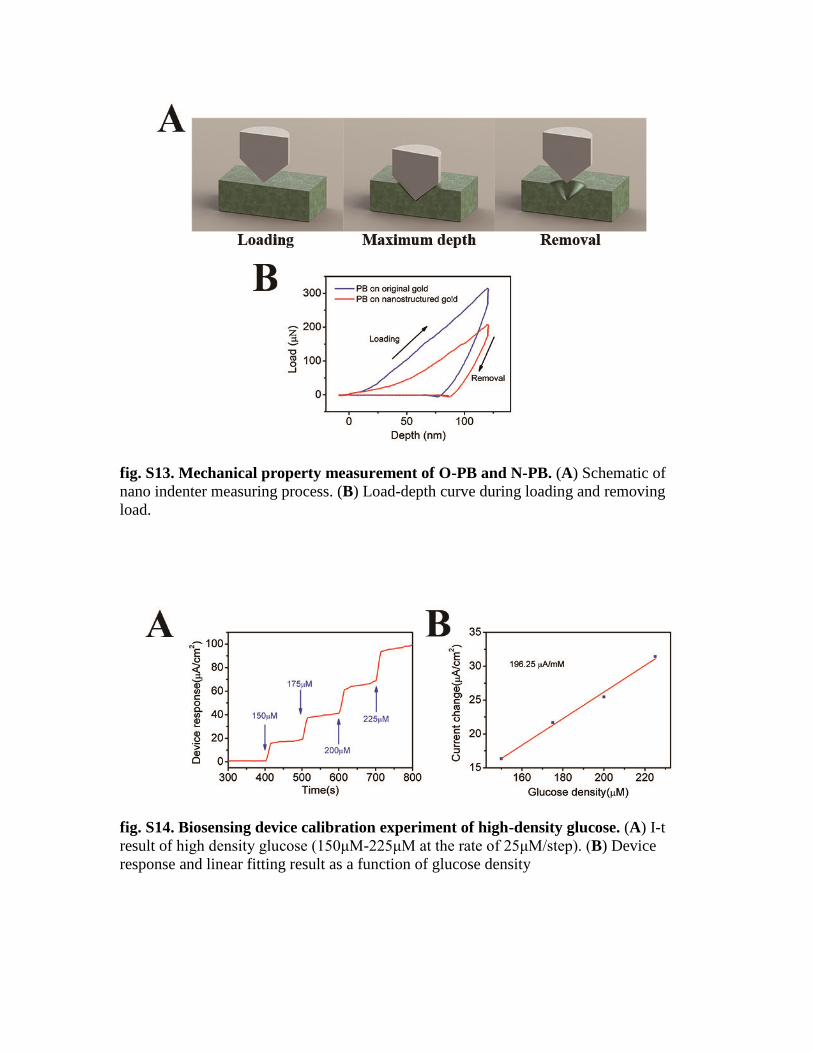
result of high density glucose (150μM-225μM at the rate of 25μM/step). (B) Device
response and linear fitting result as a function of glucose density
fig. S15. CV scan (−0.05 to 0.35 V versus reference electrode at a scan rate of 50
mV/s) of the device in four-time repeated glucose calibration experiments.
fig. S16. Influence of pH value and temperature change on device’s performance. (A) Device’s response to glucose at the different density (30μM -40μM at the rate of
5μM /step) in different pH value. (B) CV scan (-0.05V~0.35V v.s. reference electrode
scan rate 50mV/s) in buffer solutions of different pH value. (C) Device response to the
same density glucose under different solution temperatures.
fig. S17. Skin surface temperature measurement in 20 min at room temperature
with a Pt temperature sensor.
fig. S18. Skin surface condition. Skin surface condition after: (A) attaching paper
battery for 20 min and (B) 4 times’ electrochemical twin channel glucose measurements.
movie S1. ROSE transfer printing.