Page 1
© 2012 American Medical Association. All rights reserved.
Supplementary Online Content The National Heart, Lung, and Blood Institute Acute Respiratory Distress Syndrome (ARDS) Clinical Trials Network. Initial trophic vs full enteral feeding in patients with acute lung injury: the EDEN randomized trial. JAMA. doi:10.1001/jama.2012.137. eMethods eResults eTable. Ventilator-Free Days and 60-Day Mortality by Subgroups eFigure 1. Specific Gastrointestinal Intolerances by Group eFigure 2. Daily Fluid Intake and Output by Group eFigure 3. Daily Circulatory Physiology eFigure 4. Daily Respiratory Physiology and Support eFigure 5. Daily Laboratory Values This supplementary material has been provided by the authors to give readers additional information about their work.
Downloaded From: https://jama.jamanetwork.com/ by a Non-Human Traffic (NHT) User on 04/24/2019
Page 2
© 2012 American Medical Association. All rights reserved.
eMethods • Inclusion Criteria
Patients were eligible for inclusion if they met all of the below criteria. Criteria 1-3 must have
been present within a 24-hour time period:
Acute onset (defined below) of:
1. PaO2 / FiO2 ≤ 300. If altitude > 1000m, then PaO2 / FiO2 ≤ 300 x (PB/760)
2. Bilateral infiltrates consistent with pulmonary edema on frontal chest radiograph. The
infiltrates could be patchy, diffuse, homogeneous, or asymmetric
3. Requirement for positive pressure ventilation via endotracheal tube, and
4. No clinical evidence of left -sided cardiac failure to account for bilateral pulmonary
infiltrates.
5. Intention of primary medical team to provide enteral nutrition to the patient
The 48-hour enrollment time window began when criteria 1-3 were met. If a patient met
the first three inclusion criteria but had a PAOP (Pulmonary Arterial Wedge Pressure)
greater than 18 mmHg, then the first four criteria had to persist for more than 12 hours
after the PAOP had declined to ≤ 18 mmHg, and still be within the 48-hour enrollment
window.
“Acute onset” was defined as the duration of the hypoxemia criterion (#1) and the chest
radiograph criterion (#2) must have been present for ≤ 28 days at the time of
randomization. Opacities considered “consistent with pulmonary edema” included any
opacities not fully explained by mass, atelectasis, or effusion or opacities known to be
chronic (greater than 28 days). Vascular redistribution, indistinct vessels, and indistinct
Downloaded From: https://jama.jamanetwork.com/ by a Non-Human Traffic (NHT) User on 04/24/2019
Page 3
© 2012 American Medical Association. All rights reserved.
heart borders alone were not considered “consistent with pulmonary edema” and thus
did not count as qualifying opacities for this study.
• Exclusion Criteria
1. Age < 13 years
2. Greater than 48 hours since all inclusion criteria met
3. Neuromuscular disease that impairs ability to ventilate without assistance, such as:
a. cervical spinal cord injury at level C5 or higher
b. amyotrophic lateral sclerosis
c. Guillain-Barré Syndrome
d. myasthenia gravis
e. Kyphoscoliosis or chest wall deformity resulting in severe exercise restriction, secondary
polycythemia, or respirator dependence
4. Pregnant or breast-feeding
5. Severe chronic respiratory disease, demonstrated by any of:
a. FEV1 < 20 ml/kg PBW
b. FEV1/VC < 50% predicted
c. Chronic hypercapnea with PaCO2 > 45 mm Hg
d. Chronic hypoxemia with PaO2 < 55 mm Hg on FiO2 = 0.21
e. Radiographic x-ray evidence of any chronic over-inflation or chronic interstitial infiltration
f. Hospitalization within the past 6 months for respiratory failure
g. Chronic restrictive, obstructive, neuromuscular, chest wall, or pulmonary vascular disease
resulting in severe exercise restriction, secondary polycythemia, severe pulmonary
hypertension with mean PAP > 40 mm Hg, or respirator dependency
6. Burns greater than 40% total body surface area
Downloaded From: https://jama.jamanetwork.com/ by a Non-Human Traffic (NHT) User on 04/24/2019
Page 4
© 2012 American Medical Association. All rights reserved.
7. Malignancy or other irreversible disease or condition for which 6-month mortality is estimated to
be greater than 50%:
a. Poorly controlled neoplasms
b. Known HIV positive with known end stage process and known CD4 count < 50 / mm3
c. Prior cardiac arrest requiring cardiopulmonary resuscitation without fully demonstrated
neurologic recovery
d. New York Heart Association Class IV exercise restriction
e. Chronic condition making patient respirator dependent
8. Allogeneic bone marrow transplant in the last 5 years
9. Patient, surrogate, or physician not committed to full support (Exception: a patient was not
excluded if he/she would receive all supportive care except for attempts at resuscitation from
cardiac arrest).
10. Severe chronic liver disease (Child-Pugh Score of 11-15) E1
11. Diffuse alveolar hemorrhage from vasculitis.
12. Morbid obesity (> 1kg/cm body weight)
13. No consent/inability to obtain consent
14. Unwillingness or inability to utilize the ARDS network 6 ml / kg PBW lung protective ventilation
protocol
15. Moribund patient not expected to survive 24 hours
16. No intent to obtain central venous access for monitoring intravascular pressures.
17. Greater than 72 hours since initiation of mechanical ventilation
18. Refractory shock, defined by any of the following:
a. Dopamine infusion at rate > 15 mcg / kg / min
b. Dobutamine infusion at rate > 15 mcg / kg / min
c. Epinephrine or Norepinephrine infusion at rate > 30 mcg / min
d. Phenylephrine infusion at rate > 50 mcg / min
e. Milrinone infusion at rate > 0.5 mcg / kg / min
Downloaded From: https://jama.jamanetwork.com/ by a Non-Human Traffic (NHT) User on 04/24/2019
Page 5
© 2012 American Medical Association. All rights reserved.
f. Vasopressin infusion at rate > 0.04 U / min
g. Intra-aortic Balloon Pump
19. Unable to obtain enteral access
20. Presence of partial or complete mechanical bowel obstruction, or ischemia, or infarction
21. Current TPN use or intent to use TPN within 7 days
22. Severe malnutrition with BMI < 18.5 or loss of > 30% total body weight in the previous 6
months
23. Laparotomy expected within 7 days
24. Unable to raise head of bed 30 degrees
25. Short-bowel syndrome or absence of gastrointestinal tract
26. Presence of high-output (> 500 cc/day) enterocutaneous fistula
27. INR > 5.0 or platelet count < 30,000 / mm3 or history of bleeding disorder
28. Intracranial hemorrhage within the previous month
29. Allergy to enteral formula, n-3 fatty acids, gamma-linolenic acid, vitamin E, vitamin C, beta-
carotene, taurine, or L-carnitine
30. Requirement for, or physician insistence on, enteral formula supplemented with n-3 fatty acids
(ex: Oxepa®, Impact®) or providing n-3 fatty acid, GLA, or anti-oxidant supplementation
Conservative Fluid Management Protocol
This fluid protocol was initiated within four hours of randomization and continued until the earlier of
UAB or study day 7.
1. Discontinue maintenance intravenous fluids.
2. Manage electrolytes and blood products per usual practice.
3. For shock, use any combination of fluid boluses# and vasopressor(s) to achieve MAP ≥ 60
mmHg as fast as possible. Wean vasopressors as quickly as tolerated beginning four hours
after blood pressure has stabilized.
Downloaded From: https://jama.jamanetwork.com/ by a Non-Human Traffic (NHT) User on 04/24/2019
Page 6
© 2012 American Medical Association. All rights reserved.
4. Withhold diuretic therapy in renal failure § and until 12 hours after last fluid bolus or
vasopressor given.
MAP > 60 mm Hg AND off vasopressors for > 12 hours
CVP (recommen
ded)
PAOP (optional)
Average urine output < 0.5
ml/kg/hr Average urine output > 0.5
ml/kg/hr
>8 > 12
Furosemide*
Reassess in 1 hour
4-8 8-12
Furosemide*
Reassess in 4 hours
< 4
< 8
Give fluid bolus as fast as possible#
Reassess in 1 hour
No intervention
Reassess in 4 hours
§ Renal failure is defined as dialysis dependence, oliguria with serum creatinine > 3.0 mg/dL, or oliguria with serum creatinine 0.1-3.0 mg/dL with urinary indices indicative of acute renal failure.
# Recommended fluid bolus= 15 mL / kg crystalloid (round to nearest 250 mL) or 1 Unit packed red cells or 25 grams albumin
* Recommended Furosemide dosing = begin with 20 mg bolus or 3 mg / hr infusion or last known effective dose. Double each subsequent dose until goal achieved (oliguria reversal or intravascular pressure target) or maximum infusion rate of 24 mg / hr or 160 mg bolus reached. Do not exceed 620 mg / day. Also, if patient has heart failure, consider treatment with dobutamine.
Downloaded From: https://jama.jamanetwork.com/ by a Non-Human Traffic (NHT) User on 04/24/2019
Page 7
© 2012 American Medical Association. All rights reserved.
Data Collection
All baseline assessments were obtained after obtaining informed consent from the
participant or their legally authorized representative, but prior to initiation of study procedures.
Baseline assessments were recorded from the 24 hour interval prior to randomization. If more than
one value was available for this period, the value closest to the time of enrollment was utilized. If
no values were available from the 12 hours prior to randomization, then values were measured
during the 12 hours post randomization but prior to initiation of enteral feeds. Baseline
assessments included demographics, co-morbidities, height, measured weight, weight loss in the
previous 6 months, vital signs, location of the feeding tube (i.e. gastric vs. post-pyloric), Acute
Physiology, and Chronic Health Evaluation (APACHE) III scores, FiO2, Positive End-Expiratory
Pressure (PEEP), and ventilator mode. Type of ICU and etiology of ALI was also collected at
baseline. Serum electrolytes, blood urea nitrogen, creatinine, glucose, complete blood count, total
protein, albumin, total bilirubin and arterial PaO2, pH, and PaCO2 were collected at baseline and
daily through day 12 when available. Number and type of gastrointestinal intolerances were
collected daily on patients mechanically ventilated to the earlier of extubation or day 12.
Administration of sedatives, narcotics, vasopressors, pro-kinetic agents, anti-diarrheal agents,
laxatives, and anti-emetics were recorded daily until the earlier of study day 12, death, or
extubation. Enteral feeding volume and calories, morning blood glucose levels, and 8AM insulin
infusion rates were recorded daily for the same time period. Assessments for cardiovascular,
pulmonary, coagulation, renal, hepatic, and central nervous system dysfunction, and mortality,
ventilator, and ICU requirements were collected daily through Day 28. Number of quadrants with
infiltrates was collected from chest X-rays when available until extubation. Development and site
of new infections, defined by the primary medical team, including ventilator-associated pneumonia,
bacteremia, and Clostridum dificile-associated diarrhea, were collected from days 3 through 28.
Enteral Feeding Procedures
Downloaded From: https://jama.jamanetwork.com/ by a Non-Human Traffic (NHT) User on 04/24/2019
Page 8
© 2012 American Medical Association. All rights reserved.
In conjunction with the primary team, dietary specialists completed an evaluation within 24
hours of mechanical ventilation, and selected the enteral formula to be used. Full-feeding rates
were determined using 25-30 kcal/kg ideal body weight/day of non-protein energy and 1.2-1.6 g/kg
ideal body weight/day of protein as targets. All patients received a commercially available
standard formula chosen by the primary team except formulas enriched with omega-3 fatty acids
were not allowed. The type of enteral feeding tube (nasogastric, nasoenteric, orogastric,
oroenteric, percutaneous endoscopic gastrostomy tube, etc) was determined by the patient’s
primary medical team. The decision to use prokinetic agents and/or change gastric to post-pyloric
feeding tubes in patients who experienced elevated gastric residuals, vomiting, aspiration, or
regurgitation was left to the discretion of the primary team. Patients randomzed to trophic feeding
who were extubated and re-intubated prior to 144 hours were restarted on trophic feeds and
advanced to full-feeding rates per protocol at 144 hours from study entry.
Gastric Residual Volumes (GRV)
GRV were checked every 6 hours while feeding rates were being increased to full-feeding
rates and every 12 hours if the patient was receiving trophic rates or once full-feeding rate was
achieved. Elevated gastric residual volumes (GRV) were defined as greater than 400 cc of tube-
feed containing gastric contents withdrawn from the gastric tube during any one check. Gastric
residuals were only measured in patients with post-pyloric feeding tubes if a separate gastric port
on the feeding tube or separate gastric tube was in place. After the first episode of elevated GRV,
400 cc of the residual was returned to the patient via the feeding tube and the feeding rate was
maintained for an additional two hours. GRV was then rechecked, and if also above 400 cc, 400
cc were returned to the patient and enteral feeds were held. GRV were checked every 2 hours
until levels were below 400 cc. Once GRV levels were below 400 cc, enteral feeding was restarted
at a rate 25 cc/hr less than the previous rate in the full-feeding group and at 10cc/hr in the trophic
group.
Downloaded From: https://jama.jamanetwork.com/ by a Non-Human Traffic (NHT) User on 04/24/2019
Page 9
© 2012 American Medical Association. All rights reserved.
Other Gastrointestinal Intolerances
Patients were evaluated for other GI intolerances, including abdominal distention or
cramping, nausea, vomiting, diarrhea, aspiration, and regurgitation, by the bedside nurse or
primary team at least every 6 hours as feeding rates were being increased and every 12 hours
when rates were stable. Standardized criteria for and actions in response to each gastrointestional
intolerance were defined a priori. The bedside nurse or primary team could evaluate patients for
feeding complications more frequently if warranted by the clinical condition. Abdominal distention
was defined as the presence of a tense or rigid abdomen with guarding or rebound on exam. In
cases of abdominal distention, enteral feeding rate was decreased by 25 cc/hr and the patient re-
evaluated every 6 hours until distention improved at which time rates were increased to previous
rates. Aspiration, defined as the presence of food in the lungs either visually or in material
suctioned from the endotracheal tube resulted in holding of enteral feeds for 6 hours. Feeds could
be restarted after the later of 6 hours or GRV less than 400 cc. Regurgitation was defined as
enteral feeds visualized in the oropharynx or nasopharynx. When regurgitation was discovered,
the location of the feeding tube was checked and repositioned if it ended in the esophagus. If it
was in the stomach or post-pyloric, feeds were held and restarted at 25 cc/hr below the previous
rate as long as the GRV was less than 400cc after 6 hours. Vomiting was defined as expulsion of
gastric contents from the oro- or nasopharynx. When vomiting occurred, feeds were held for 6
hours. After 6 hours and confirmation of correct tube position, feeds were restarted at a rate 25
cc/hr slower than previous. Diarrhea was defined as more than 3 liquid bowel movements in 24
hours and constipation was defined as the absence of a bowel movement requiring intervention.
For either diarrhea or constipation, the primary team was encouraged to minimize offending
medications and initiate pharmacologic treatments. Although discouraged, the primary team could
interrupt or halt enteral feeding for diarrhea or constipation if it was thought necessary for the
patient’s health.
Endpoints
Downloaded From: https://jama.jamanetwork.com/ by a Non-Human Traffic (NHT) User on 04/24/2019
Page 10
© 2012 American Medical Association. All rights reserved.
VFDs were defined as the number of days alive and on unassisted breathing. In patients
who required more than one episode of assisted breathing through day 28, only the final period of
unassisted breathing was included in VFDs. Any level of Continuous Positive Airway Pressure
(CPAP) was considered unassisted breathing, but non-invasive positive pressure ventilation
(NIPPV) with separate inspiratory and expiratory pressures was considered assisted breathing,
regardless of its indication. Patients receiving assisted breathing on day 28 or who died before day
28 were assigned zero VFDs. Patients discharged home alive prior to day 28 were assumed alive
at day 28. ICU-free and all other organ failure-free endpoints were calculated similarly to VFDs.
Patients were considered free of cardiovascular failure if blood pressure was maintained without
use of vasopressor agents, free of hematologic system failure if platelet counts were greater than
80,000/microliter and free of hepatic or renal failure if the bilirubin or creatinine remained < 2.0
mg/dL, respectively.
The secondary endpoint of GI intolerances was analyzed both daily and overall through day
12. Daily GI intolerances were recorded through day 12 as ever occurring on that day or not
occurring on that day, reported as a percentage of patients experiencing the intolerance each day,
and compared using chi-square tests. Overall GI intolerance is reported as percent of days fed
with intolerance for both all GI intolerances cumulatively and each specific intolerance. For both,
number of days with an intolerance was computed and divided by number of days fed through day
12 for each patient. Differences in mean percentages of fed-days with an intolerance were then
compared between groups using a t-test.
Statistical Analysis
The two-sided P-value for determining significance of VFD at the final analysis was
0.0429. Alpha and beta spending boundaries were used for interim analyses as described
by DeMets and Ware ( zl=2.277,delta=1.663,zu=2.025,m=4, mu=3.3837) E2. P-values ≤ 0.05 were
considered significant for other analyses. Post-hoc subgroup analyses were undertaken
separately for patients with shock, ARDS (i.e. P/F≤ 200), and BMI <18.5, 18.5-25, 25-30, and ≥ 30.
Downloaded From: https://jama.jamanetwork.com/ by a Non-Human Traffic (NHT) User on 04/24/2019
Page 11
© 2012 American Medical Association. All rights reserved.
Efficacy and Futility Stopping Rules
The maximum sample size was planned to be 1000 patients. The study was monitored
using a flexible group sequential design with stopping rules for both efficacy and futility. The
reported confidence intervals on the treatment difference were adjusted for the group sequential
design using the method of Jennison & Turnbull.e4
In order to allow flexibility we used alpha and beta spending boundaries as described by
DeMets and Ware (zl=2.277,delta=1.663,zu=2.025,m=4, mu=3.3837).e5 Factors were considered
as one sided with a separate upper efficacy boundary and lower futility boundary.
In this method of interim monitoring we specified a function a(t) and b(t) called the alpha
and beta spending functions. The function a(t) gave the amount of the p-value that was “spent” by
a given time “t” in the study, where time runs from 0 at study start to 1 when all patients have been
entered. It represented the probability under the null hypothesis that the trial would stop for
efficacy at or before time t. The function b(t) was the type II error that was “spent” by the interim
monitoring plan to allow futility stopping. It represented the probability under the alternative
hypothesis that the study would stop for futility at or before time t or that at the last look, the
efficacy boundary would not be exceeded.
The table below shows the alpha-spending boundary a(t) where t is the proportion of
patients accrued at that DSMB meeting. In the table we assumed 5 meetings at t= 0.10, 0.25,
0.50, 0.75 and 1.0. This function a(t) was extended to a smooth function of t using a cubic splinee6
and at each DSMB meeting the actual stopping boundary was calculated so that the probability of
stopping at or before that meeting was a(t). Similarly the futility boundary was defined by the beta-
spending function b(t). The number b(t) represented the cumulative probability that the results
would be below the futility stopping boundary given the alternative hypothesis of a 2.25 day
increase in VFD with a standard deviation of 10.5. At each DSMB meeting a futility stopping
boundary was calculated so that the probability of futility stopping at or before that meeting was b(t)
at this alternative hypothesis.
Downloaded From: https://jama.jamanetwork.com/ by a Non-Human Traffic (NHT) User on 04/24/2019
Page 12
© 2012 American Medical Association. All rights reserved.
The overall one-sided significance level of the study was 0.025 which is equivalent to a two
sided p=0.05 significance level. Five analyses were planned after 100, 250, 500, 750, and 1000
patients. Under the assumption that there were five equally spaced interim analyses the power of
the study was 90·7%. Changes in the number or spacing of the interim analyses would have a
minor effect on the power. With this design, assuming that the pattern of deaths and extubations
was similar to the FACTT fluid study, there was an 82% chance that the study would show both a
significant effect of VFD and a nominally positive benefit in mortality.
The DSMB was advised to consider mortality differences in deciding whether to stop the
trial. They might decline to stop the trial for efficacy if the mortality difference would make the
positive benefit in VFDs difficult to interpret and they might decline to stop the trial for futility if there
is a positive mortality benefit. For example, if there was no difference in VFDs but a trend towards
a survival benefit the DSMB might continue past a futility boundary. The stopping rules were set up
so that this would not invalidate the trial if such judgments were made. The efficacy boundary was
developed without regard to the futility boundary. Thus if the futility boundary was crossed but the
trial was not stopped, the trial can still achieve a 0.025 one-sided significance level.
Difference Error Spending Probability of Stopping
No. of Patients
P Value for Efficacy, 2-sided
Efficacy Futility Type I, 1-Sided
Type II
Futility Efficacy CI When No Difference
100 1.5 E-6 9·5 7.6E-11 0 0 5E-8 9.3-17.6 250 5 E-5 3·8 -0.50 2.56 E-5 0.0128 0.30 0.009 2.8-8.0 500 0.0042 1·9 0.14 0.0021 0.0232 0.31 0.31 0.8-4.5 750 0.0194 1·3 0.35 0.0104 0.0287 0.17 0.41 0.3-3.2
1000 0.0429 0.95 0.46 0.0250 0.0923 0.09 0.18 0.0-2.6 Table Legend: Stopping Boundaries: The table shows the characteristics of this boundary if we had the interim reports described above. The second column is the nominal p-value to stop for efficacy; the third and fourth columns are the difference in VFD to stop for efficacy and futility. The next columns are the error spending functions. The type I error spending function is the probability that the upper boundary will be exceeded under the null hypothesis. The type II error spending function is the probability that the statistic will be below the lower boundary at an interim analysis or under the upper boundary at the final analysis under the alternative hypothesis. The probability of stopping for futility is given in the seventh column and the probability of stopping for efficacy in the eighth column. The final column shows the confidence interval for the difference in VFD if the trial stopped for efficacy at that look and the treatment effect just exceeded the stopping boundary.
Downloaded From: https://jama.jamanetwork.com/ by a Non-Human Traffic (NHT) User on 04/24/2019
Page 13
© 2012 American Medical Association. All rights reserved.
eReferences
E1. Pugh RN, Murray-Lyon IM, Dawson JL, Pietroni MC, Williams R. Transection of the
oesophagus for bleeding oesophageal varices. Br J Surg. 1973; 60(8):646-649.
E2. DeMets DL, Ware JH. Asymmetric group sequential boundaries for monitoring clinical trials.
Biometrika. 1982; 69:661-663.
Downloaded From: https://jama.jamanetwork.com/ by a Non-Human Traffic (NHT) User on 04/24/2019
Page 14
© 2012 American Medical Association. All rights reserved.
eTable. Ventilator-Free Days and 60-Day Mortality by Subgroups
Trophic Feeding Full Feeding Outcome No. Mean (95% CI) No. Mean (95% CI) P Value Ventilator-free days Entry in shock 210 12.5 (11.0-14.0) 204 13.5 (11.9-15.0) .36 Entry not in shock 298 16.6 (15.3-17.8) 288 16.1 (14.9-17.3) .58 PaO2/FIO2 <200 356 13.9 (12.8-15.0) 351 13.3 (12.2-14.4) .48 BMI category, kg/m2‡ <18.5 15 17.4 (11.2-23.6) 10 12.7 (5.5-19.9) .29 18.5 to <25 144 15.6 (13.8-17.4) 142 15.2 (13.4-17.0) .75 25 to <30 131 14.5 (12.6-16.4) 117 16.3 (14.3-18.2) .20 ≥30 217 14.4 (12.9-15.8) 221 14.4 (13.0-15.8) .98 60-d mortality No. No. (%) [95% CI] No. No. (%) [95% CI] Entry in shock 210 65 (31.0) [24.7-37.2] 204 56 (27.5) [21.3-33.6] .43 PaO2/FIO2 <200 356 93 (26.1) [21.6-30.7] 351 89 (25.4) [20.8-29.9] .82 BMI category, kg/m2‡ <18.5 15 3 (20.0) [4.3-48.1] 10 3 (30.0) [6.7-65.3] .57 18.5 to <25 144 32 (22.2) [15.4-29.0] 142 31 (21.8) [15.0-28.6] .94 25 to <30 131 38 (29.0) [21.2-36.8] 142 29 (24.8) [17.0-32.6] .46 ≥30 217 45 (20.7) [15.3-26.1] 221 44 (19.9) [14.6-25.2] .83
Ventilator-free days and 60-day all-cause mortality for subgroups of patients entering the study in shock, entering with P/F ratio ≤ 200, and patients by BMI category. ‡ BMI was unknown in one patient in the trophic group and two in the full-feeding group. Values are mean with 95% CI or Number (%) (95% CI).
Downloaded From: https://jama.jamanetwork.com/ by a Non-Human Traffic (NHT) User on 04/24/2019
Page 15
© 2012 American Medical Association. All rights reserved.
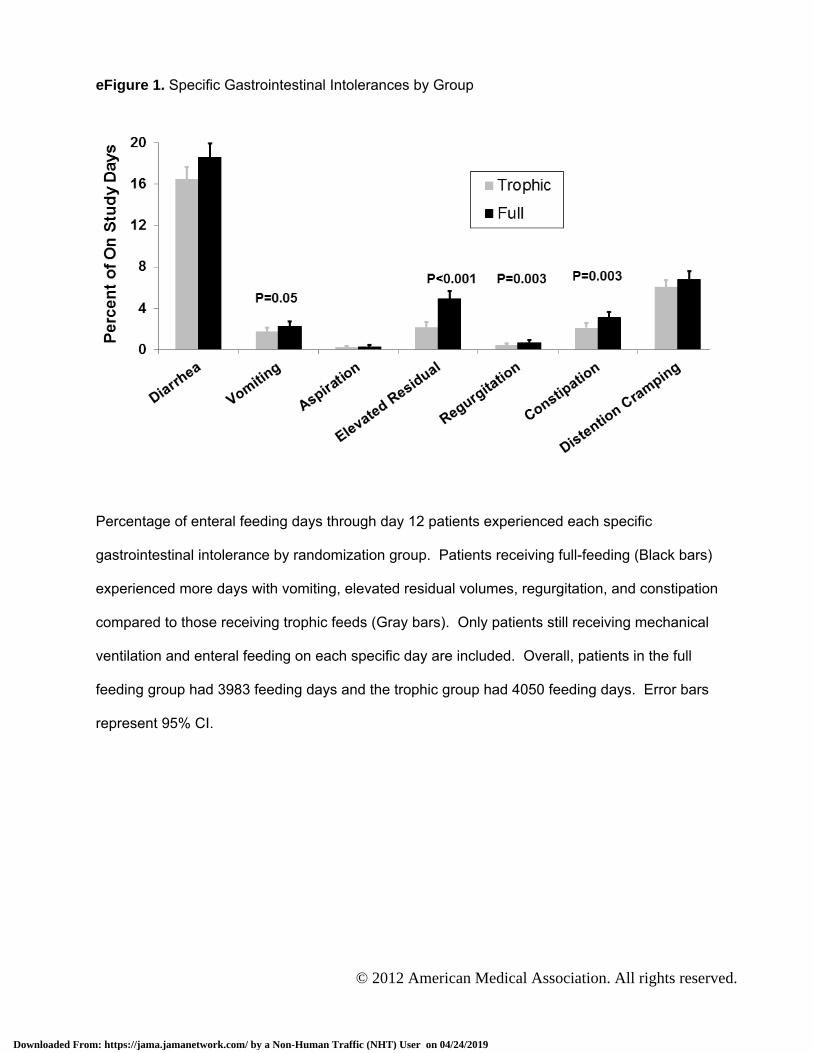
eFigure 1. Specific Gastrointestinal Intolerances by Group
Percentage of enteral feeding days through day 12 patients experienced each specific
gastrointestinal intolerance by randomization group. Patients receiving full-feeding (Black bars)
experienced more days with vomiting, elevated residual volumes, regurgitation, and constipation
compared to those receiving trophic feeds (Gray bars). Only patients still receiving mechanical
ventilation and enteral feeding on each specific day are included. Overall, patients in the full
feeding group had 3983 feeding days and the trophic group had 4050 feeding days. Error bars
represent 95% CI.
Downloaded From: https://jama.jamanetwork.com/ by a Non-Human Traffic (NHT) User on 04/24/2019
Page 16
© 2012 American Medical Association. All rights reserved.
eFigure 2. Daily Fluid Intake and Output by Group eFigure2A. Daily Fluid Intake by Group
The full-feeding group (Black bars) had significantly more daily total fluid intake for days 2 through
7 compared to the trophic feeding group (Gray bars). Day 0 represents time from randomization to
7AM the next morning. Only patients still receiving mechanical ventilation on each specific day are
included. Values represent means and error bars represent 95% CI. *P<0.001; †P=0.01
Downloaded From: https://jama.jamanetwork.com/ by a Non-Human Traffic (NHT) User on 04/24/2019
Page 17
© 2012 American Medical Association. All rights reserved.
eFigure2B. Daily Fluid Output by Group
The full-feeding group (Black bars) had significantly more daily total fluid output for days 2 through 7 compared to the trophic feeding group (Gray bars). Day 0 represents time from randomization to 7AM the next morning. Values represent means and error bars represent 95% CI. *P<0.001; ‡P=0.02
Downloaded From: https://jama.jamanetwork.com/ by a Non-Human Traffic (NHT) User on 04/24/2019
Page 18
© 2012 American Medical Association. All rights reserved.
eFigure 3. Daily Circulatory Physiology eFigure3A. Daily Heart Rate by Group
Heart rates were similar between trophic and full-feeding groups through day 7. Values represent means with error bars as 95% CI. Day 0 represents the day of randomization.
Downloaded From: https://jama.jamanetwork.com/ by a Non-Human Traffic (NHT) User on 04/24/2019
Page 19
© 2012 American Medical Association. All rights reserved.
eFigure3B. Daily Systolic Blood Pressure by Group
Both groups had similar systolic blood pressures through day 7. Values represent means with error bars as 95% CI.
Downloaded From: https://jama.jamanetwork.com/ by a Non-Human Traffic (NHT) User on 04/24/2019
Page 20
© 2012 American Medical Association. All rights reserved.
eFigure3C. Daily Central Venous Pressure by Group
Central Venous Pressures were similar in both groups through day 7 except day 1 where the full-feeding group had a higher CVP. Values represent means with error bars as 95% CI. *P=0.03
Downloaded From: https://jama.jamanetwork.com/ by a Non-Human Traffic (NHT) User on 04/24/2019
Page 21
© 2012 American Medical Association. All rights reserved.
eFigure3D. Daily Vasopressor Use by Group
Vasopressor use was similar and decreased in both groups over the first 7 days. Values represent percentage of patients receiving vasopressors that day.
Downloaded From: https://jama.jamanetwork.com/ by a Non-Human Traffic (NHT) User on 04/24/2019
Page 22
© 2012 American Medical Association. All rights reserved.
eFigure 4. Daily Respiratory Physiology and Support eFigure4A. Daily Tidal Volume by Group
Tidal volumes were similar between groups over the first 7 days. Values represent means with error bars as 95% CI. Day 0 represents the day of randomization.
Downloaded From: https://jama.jamanetwork.com/ by a Non-Human Traffic (NHT) User on 04/24/2019
Page 23
© 2012 American Medical Association. All rights reserved.
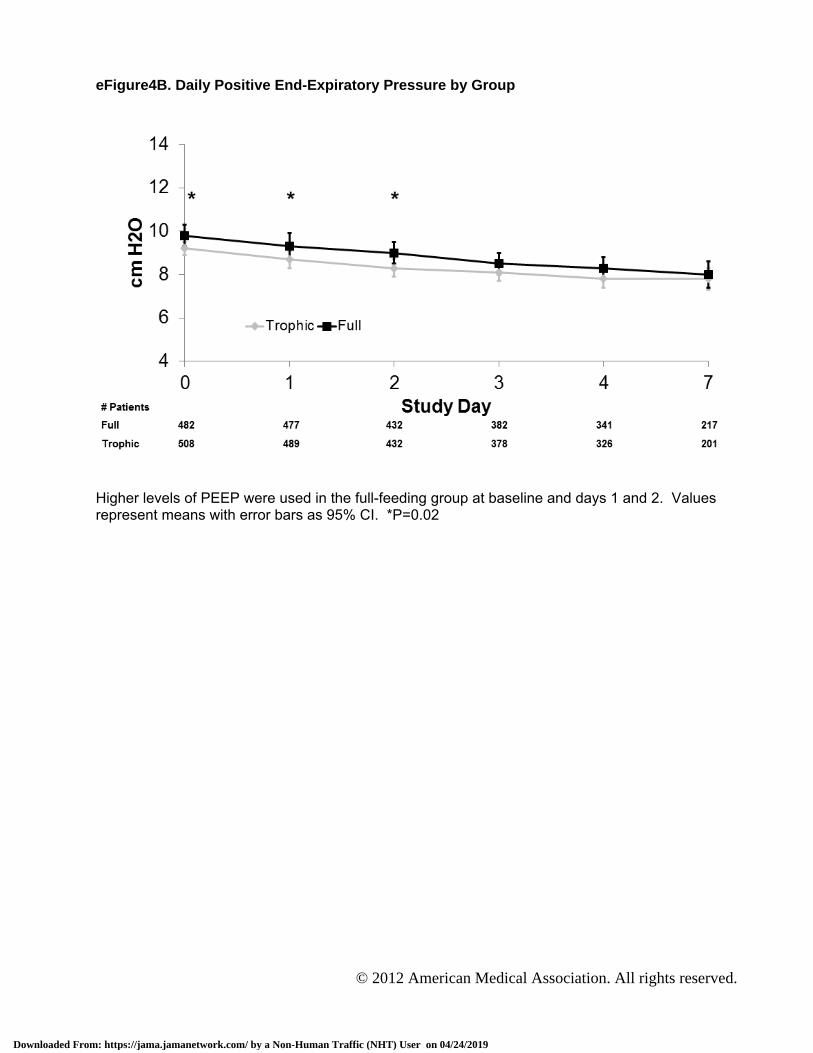
eFigure4B. Daily Positive End-Expiratory Pressure by Group
Higher levels of PEEP were used in the full-feeding group at baseline and days 1 and 2. Values represent means with error bars as 95% CI. *P=0.02
Downloaded From: https://jama.jamanetwork.com/ by a Non-Human Traffic (NHT) User on 04/24/2019
Page 24
© 2012 American Medical Association. All rights reserved.
eFigure4C. Daily Plateau Pressure by Group
Plateau pressures were similar between groups for the first 7 days. Values represent means with error bars as 95% CI.
Downloaded From: https://jama.jamanetwork.com/ by a Non-Human Traffic (NHT) User on 04/24/2019
Page 25
© 2012 American Medical Association. All rights reserved.
eFigure4D. Daily P/F Ratio by Group
P/F ratios were similar between groups for the first 7 days. Values represent means with error bars as 95% CI.
Downloaded From: https://jama.jamanetwork.com/ by a Non-Human Traffic (NHT) User on 04/24/2019
Page 26
© 2012 American Medical Association. All rights reserved.
eFigure4E. Daily Oxygenation Index by Group
Oxygenation index did not differ between groups over the first 7 days. Values represent means with error bars as 95% CI.
Downloaded From: https://jama.jamanetwork.com/ by a Non-Human Traffic (NHT) User on 04/24/2019
Page 27
© 2012 American Medical Association. All rights reserved.
eFigure4F. Daily Minute Ventilation by Group
Minute ventilation was similar between groups over the first 7 days. Values represent means with error bars as 95% CI.
Downloaded From: https://jama.jamanetwork.com/ by a Non-Human Traffic (NHT) User on 04/24/2019
Page 28
© 2012 American Medical Association. All rights reserved.
eFigure4G. Daily PaCO2 by Group
The full-feeding group had higher PaCO2 values on days 1, 2, and 3. Values represent means with error bars as 95% CI. †P=0.01; ‡P=0.02; *P=0.05
Downloaded From: https://jama.jamanetwork.com/ by a Non-Human Traffic (NHT) User on 04/24/2019
Page 29
© 2012 American Medical Association. All rights reserved.
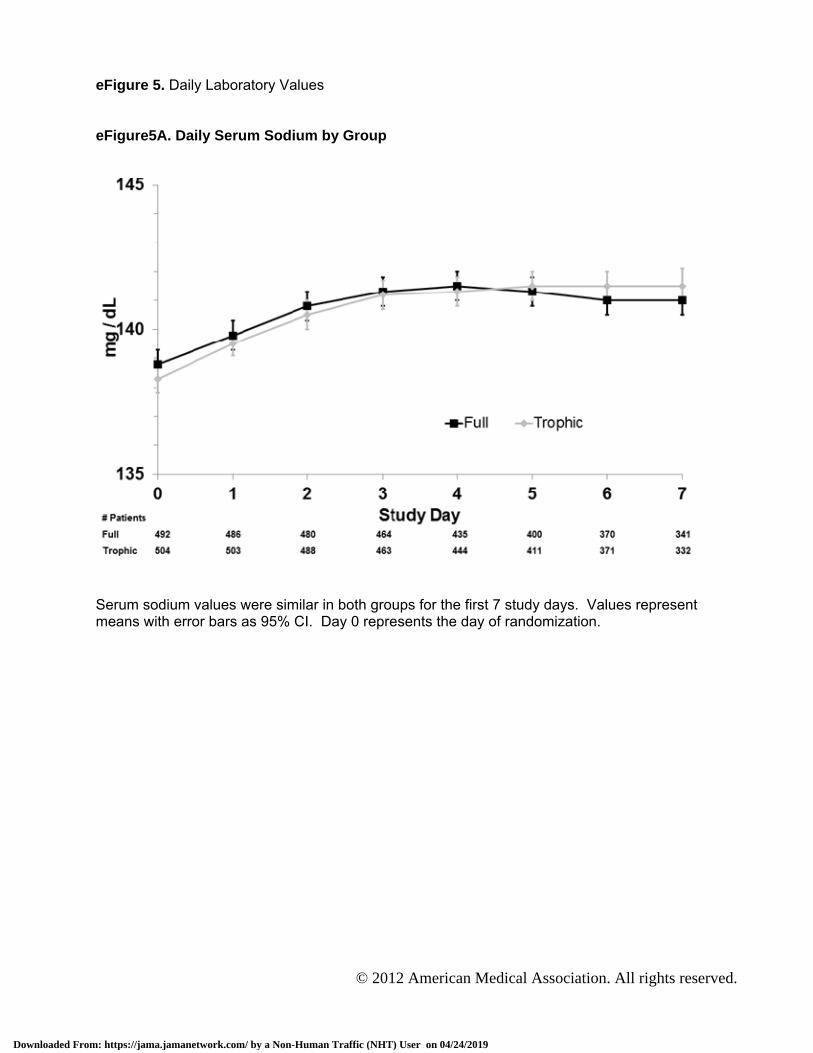
eFigure 5. Daily Laboratory Values eFigure5A. Daily Serum Sodium by Group
Serum sodium values were similar in both groups for the first 7 study days. Values represent means with error bars as 95% CI. Day 0 represents the day of randomization.
Downloaded From: https://jama.jamanetwork.com/ by a Non-Human Traffic (NHT) User on 04/24/2019
Page 30
© 2012 American Medical Association. All rights reserved.
eFigure5B. Daily Serum Potassium by Group
The trophic group had lower serum potassium levels on days 4 through 7. Values represent means with error bars as 95% CI. *P<0.001; ‡P=0.01
Downloaded From: https://jama.jamanetwork.com/ by a Non-Human Traffic (NHT) User on 04/24/2019
Page 31
© 2012 American Medical Association. All rights reserved.
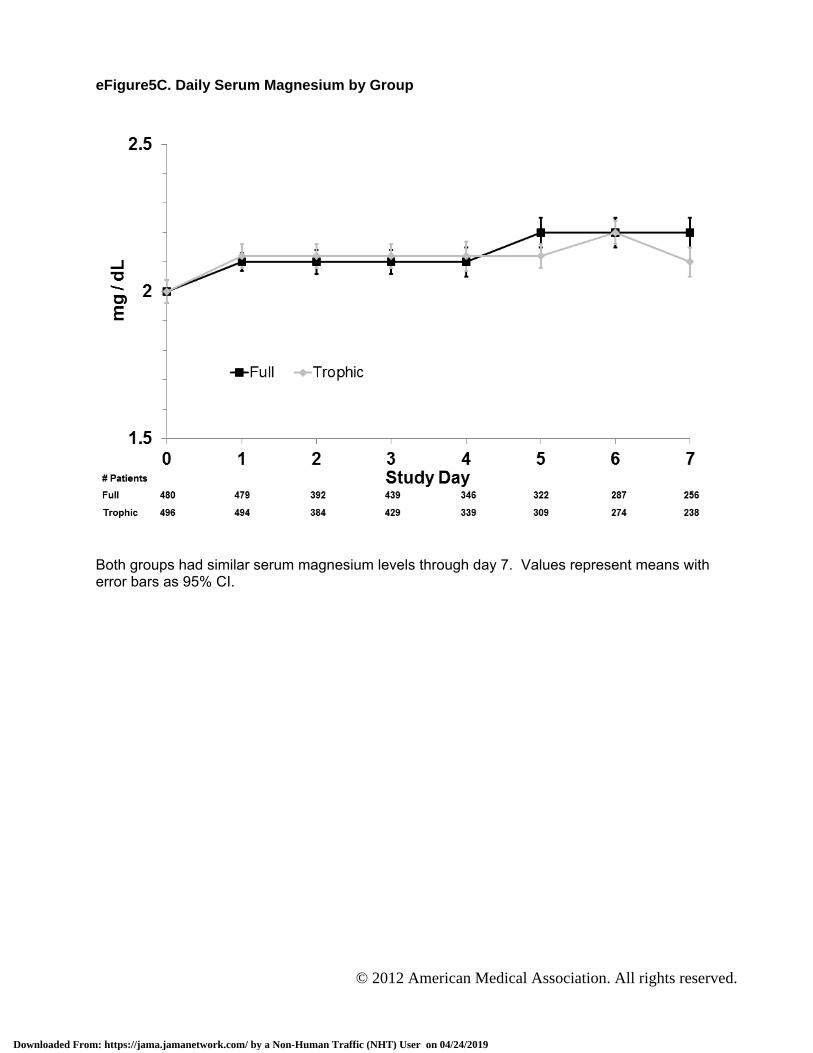
eFigure5C. Daily Serum Magnesium by Group
Both groups had similar serum magnesium levels through day 7. Values represent means with error bars as 95% CI.
Downloaded From: https://jama.jamanetwork.com/ by a Non-Human Traffic (NHT) User on 04/24/2019
Page 32
© 2012 American Medical Association. All rights reserved.
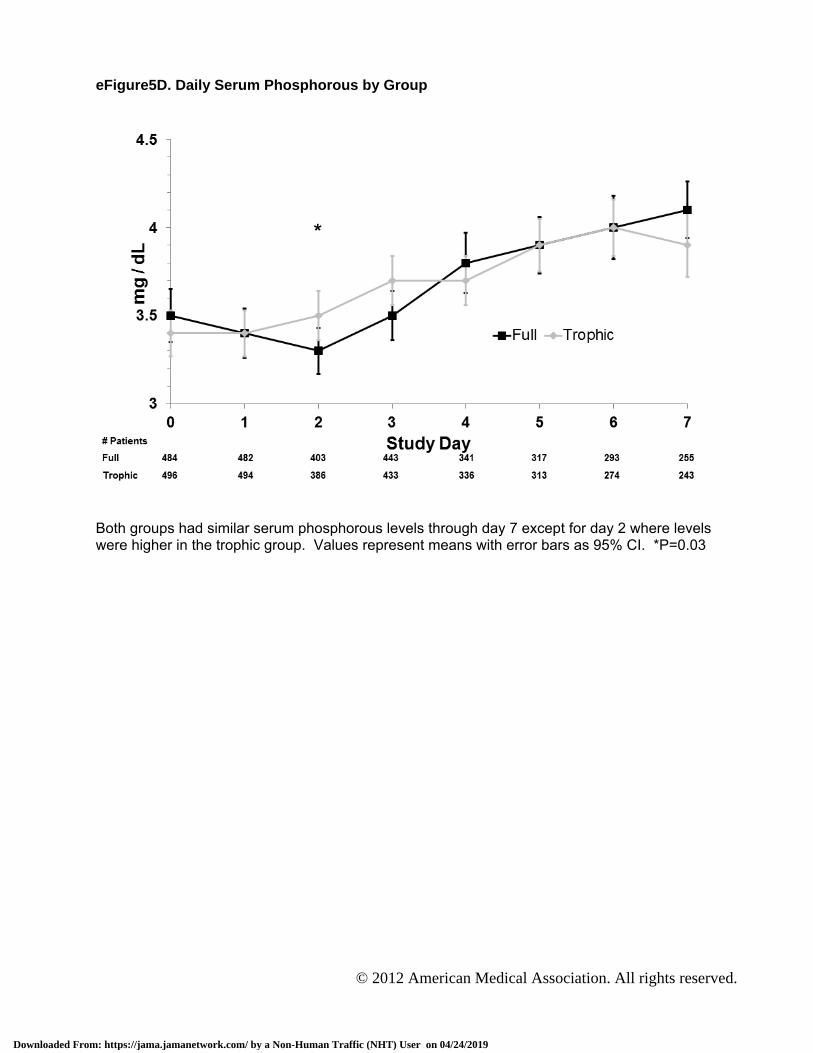
eFigure5D. Daily Serum Phosphorous by Group
Both groups had similar serum phosphorous levels through day 7 except for day 2 where levels were higher in the trophic group. Values represent means with error bars as 95% CI. *P=0.03
Downloaded From: https://jama.jamanetwork.com/ by a Non-Human Traffic (NHT) User on 04/24/2019
Page 33
© 2012 American Medical Association. All rights reserved.
eFigure5E. Daily Serum Bicarbonate by Group
The full-feeding group had slightly higher serum bicarbonate on study day 3. Values represent means with error bars as 95% CI. *P=0.04.
Downloaded From: https://jama.jamanetwork.com/ by a Non-Human Traffic (NHT) User on 04/24/2019
Page 34
© 2012 American Medical Association. All rights reserved.
eFigure5F. Daily Serum Total Protein by Group
Serum Total Protein increases slightly over the 7 days in both groups, but does not differ between trophic and full-feeding groups. Values represent means with error bars as 95% CI.
Downloaded From: https://jama.jamanetwork.com/ by a Non-Human Traffic (NHT) User on 04/24/2019
Page 35
© 2012 American Medical Association. All rights reserved.
eFigure5G. Daily Serum Albumin by Group
Serum albumin does not change or differ by group over the first 7 study days. Values represent means with error bars as 95% CI.
Downloaded From: https://jama.jamanetwork.com/ by a Non-Human Traffic (NHT) User on 04/24/2019