Jaber S, Lescot T, Futier E, et al; NIVAS Study Group. Effect of noninvasive ventilation on tracheal reintubation among patients with hypoxemic respiratory failure following abdominal surgery: a randomized clinical trial. JAMA. doi:10.1001/jama.2016.2706
eAppendix 1. List of NIVAS Trial Investigators eAppendix 2. Supplemental Methods eFigure. Absolute Difference of Intubation at 30 Days eTable 1. Gas Exchange According to Study Group eTable 2. Settings, Monitored Parameters, Tolerance and Side Effects of Noninvasive Ventilation eTable 3. Bivariate and Multivariable Analysis of Factors Associated With the Primary Outcome eTable 4. Reasons for Re-intubation, as Defined in the Protocol Guidelines, According to Study Group eTable 5. Primary and Secondary Outcomes According to Study Group eTable 6. Clinical Pulmonary Infection Score (CPIS) and Microorganisms Causing Pneumonia According to Study Group
This supplementary material has been provided by the authors to give readers additional information about their work.
eAppendix 1. List of NIVAS Trial Investigators Independent Data and Safety Monitoring Committee: K. Asehnoune, CHU Nantes, France; X. Capdevila, CHU Montpellier, France; E. Marret, Tenon Hospital, Paris, France. Participating sites and investigators: Saint Eloi Hospital, Montpellier, France: Samir Jaber, Fouad Belafia, Daniel Verzilli, Audrey De Jong, Gerald Chanques, Boris Jung, Noemie Clavieras, Dave Gleeton
Lapeyronie Hospital, Montpellier, France. Nicolas Molinari
Saint Antoine Hospital, AP-HP, Paris, France: Thomas Lescot, Marc Beaussier
and vasoactive drugs. After re-intubation, all patients were ventilated with the same
ventilation protocol, according to the low-tidal-volume protective ventilatory strategy.
Data collection and definitions Causes of acute respiratory failure (ARF) We assigned causes of ARF following extubation, with adapted published definitions:
upper-airway obstruction; aspiration or excess respiratory secretions; severe
encephalopathy; congestive heart failure; pneumonia and atelectasis. Severe
encephalopathy was defined by Glasgow coma scale of 12 points or less (on a scale from
3 to 15, with lower scores indicating reduced levels of consciousness).
Atelectasis was defined as lung opacification with shift of the mediastinum, hilum or
hemi-diaphragm towards the affected area and compensatory overinflation in the adjacent
non-atelectatic lung.
Health-Care associated infections
Diagnostic criteria for health-care associated infections were adapted from CDC criteria.
The sites and dates of diagnosis of all healthcare associated infections were recorded as
well as antibiotic regimens given during the ICU stay within 30 days after inclusion in
the study.
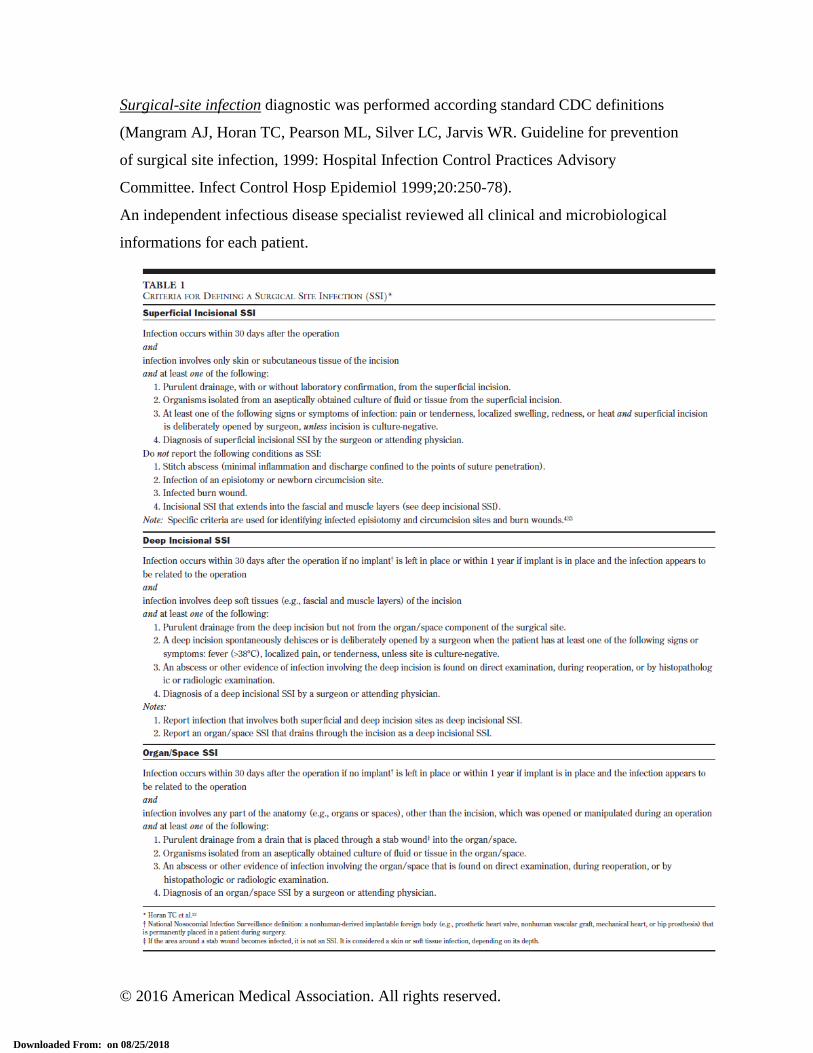
Pneumonia, urinary tract infection, central venous catheter-related infection, bacteremia
and surgical-site infection, occurring both at least 48 hours after ICU admission and after
inclusion in the study were collected according to the following definitions.
Pneumonia was suspected in patients with a combination of new and persistent lung
infiltrates on chest X-ray, a temperature greater than 38°C, and macroscopically purulent
tracheal secretions while receiving either standard oxygen therapy, noninvasive
ventilation or invasive mechanical ventilation. Pneumonia was ascertained by the
positivity of a quantitative respiratory culture, defined as at least 1 microorganism
recovered at concentration of at least 1000 colony forming units per mL for blinded
protected telescoping catheter, of at least 10000 colony forming units per mL for
broncho-alveolar lavage and of at least 1000000 colony forming units per mL for tracheal
aspirates. In patients clinically suspected of having pneumonia but treated with
noninvasive ventilation, the positivity of a blinded protected telescoping catheter culture
at the same significant threshold, when available, or the sole administration of new
eFigure. Absolute Difference of Intubation at 30 Days
The eFigure shows the absolute difference (black boxes) with 95% confidence intervals (horizontal lines) for the primary outcome measure of intubation by day 7 in the noninvasive ventilation group, as compared with the oxygen standard therapy group, among all the patients and in the predefined subgroups according the stratification variables (age less or more than 60 years, site of surgery upper or lower abdominal and use or not of postoperative epidural analgesia).
SubgroupNoninvasiveVentilation
Standard OxygenTherapy Absolute Difference in % (95% CI)
P Value for heterogeneity
no. of event/ no. of patients in subgroup (%)
Age 0.93<60 y 17/56 (30) 23/56 (41) -10.7 (-30.1; 8.7)≥ 60 y 32/92 (35) 43/89 (48) -13.5 (-28.9; 1.8)
Site of surgery 0.20Upper abdominal 35/93 (38) 41/91(45) -7.4 (-22,7; 7,9)Lower abdominal 14/55 (25) 25/54 (46) -20.8 (-40.3; -1.4)
Day 1 99 24.7±3.9 90 24.9±3.9 .66 Values are displayed as mean±SD. FiO2 denotes fraction of inspired oxygen, Partial pressure of arterial oxygen (PaO2) and partial pressure of arterial carbon dioxide (PaCO2) were measured in millimeters of mercury. To estimated FiO2, for spontaneously breathing non-intubated patients, each liter of oxygen was assumed to add 3% oxygen to room air.
eTable 2. Settings, Monitored Parameters, Tolerance and Side Effects of Noninvasive Ventilation Noninvasive Ventilation (N = 148)
Variable All (N = 148)
Success NIV (N=99)
Failure NIV (N=49)
P value
NIV parameters Type of ventilator used ICU ventilator without NIV-option (double-line) ICU ventilator with NIV-option (double-line) Dedicated NIV ventilator (single-line)
8 (6%)
100 (74%) 27 (20%)
6 (7%)
63 (70%) 21 (23%)
2 (5%)
37 (82%) 6 (13%)
.31
Gas conditioning device Heated humidifier Heated and Moisture Exchanger (Filter) None
Global evaluation by nurse of tolerance and side effects (Numeric Rating Scale: 0= no or minimal to 10= maximal) median (IQR)
Leaks around the mask Category 0-2 – no (%)
2 (0-4) 78 (64)
1.5 (0-3) (N=82) 55 (67)
2 (0-4) (N=40) 23 (58) .13
Dry mouth and/or nasal congestion Category 0-2 – no (%)
0 (0-2) 94 (78)
0 (0-2) (N=80) 64 (80)
0 (0-2.3) (N=40) 30 (75) .69
Copious bronchial secretions Category 0-2 – no (%)
0 (0-3) 94 (78)
0 (0-2) (N=81) 64 (80)
0 (0-4.3) (N=40) 30 (75) .07
Irritation ocular / conjunctivitis Category 0-2 – no (%)
0 (0-0) 86 (71)
0 (0-0) (N=81) 62 (76)
0 (0-0) (N=40) 24 (60) .15
Skin ulcerations Category 0-2 – no (%)
0 (0-0) 115 (95)
0 (0-0) (N=82) 78 (95)
0 (0-0) (N=39) 37 (95) .92
Gastric distension Category 0-2 – no (%)
0 (0-0) 110 (91)
0 (0-0) (N=81) 74 (91)
0 (0-0) (N=40) 36 (90) .78
Anxiety Category 0-2 – no (%)
0 (0-5) 80 (66)
0 (0-4) (N=82) 57 (70)
2 (0-5.3) (N=40) 23 (58) .15
Bronchial secretions No Moderate Excessive
92 (74%) 24 (19%) 8 (7%)
64 (77%) 13 (16%)
6 (7%)
28 (68%) 11 (27%)
2 (5%)
.33
Duration of NIV delivered during the first 24h after inclusion, hours 7.4 ± 4.9 7.6 ± 4.8 7.2 ± 5.1 .72
Total duration of NIV use during ICU stay-days, median (IQR), d 4 (1-5) 4 (1-5) 1 (1-7) .22
Number of patients who received at least 6h of NIV during the first 24h after inclusion, no. (%) 102 (68.9) 70 (70.7) 32 (65.3) .50
Number of patients who received NIV during the entire period prior to primary outcome assessment, no. (%) 36 (24%) 20 (20%) 16 (33%) .10
Data are displayed as number of patients or mean±SD. IQR, interquartile range Data are obtained after the first session of NIV. "Success NIV" was defined as clinical improvement leading to discharge to regular ward, while exitus or need for endotracheal reintubation was considered "failure NIV".
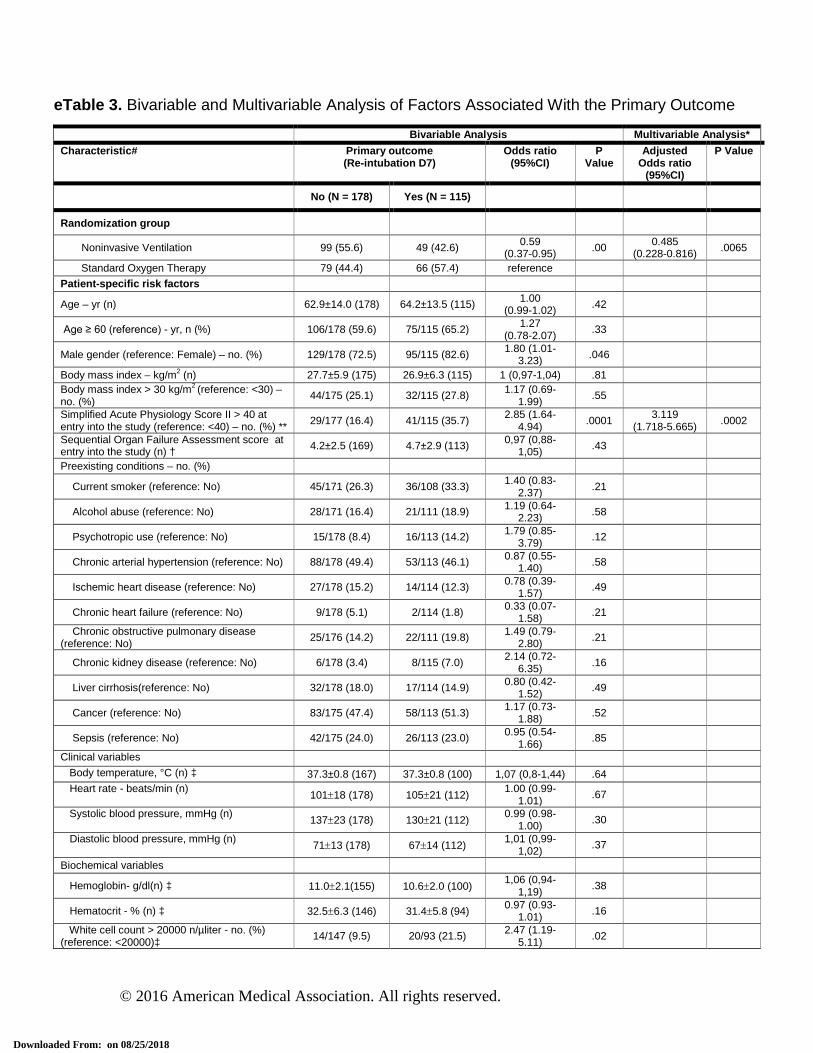
Body mass index – kg/m2 (n) 27.7±5.9 (175) 26.9±6.3 (115) 1 (0,97-1,04) .81 Body mass index > 30 kg/m2 (reference: <30) – no. (%) 44/175 (25.1) 32/115 (27.8) 1.17 (0.69-
1.99) .55
Simplified Acute Physiology Score II > 40 at entry into the study (reference: <40) – no. (%) ** 29/177 (16.4) 41/115 (35.7) 2.85 (1.64-
4.94) .0001 3.119 (1.718-5.665) .0002
Sequential Organ Failure Assessment score at entry into the study (n) † 4.2±2.5 (169) 4.7±2.9 (113) 0,97 (0,88-
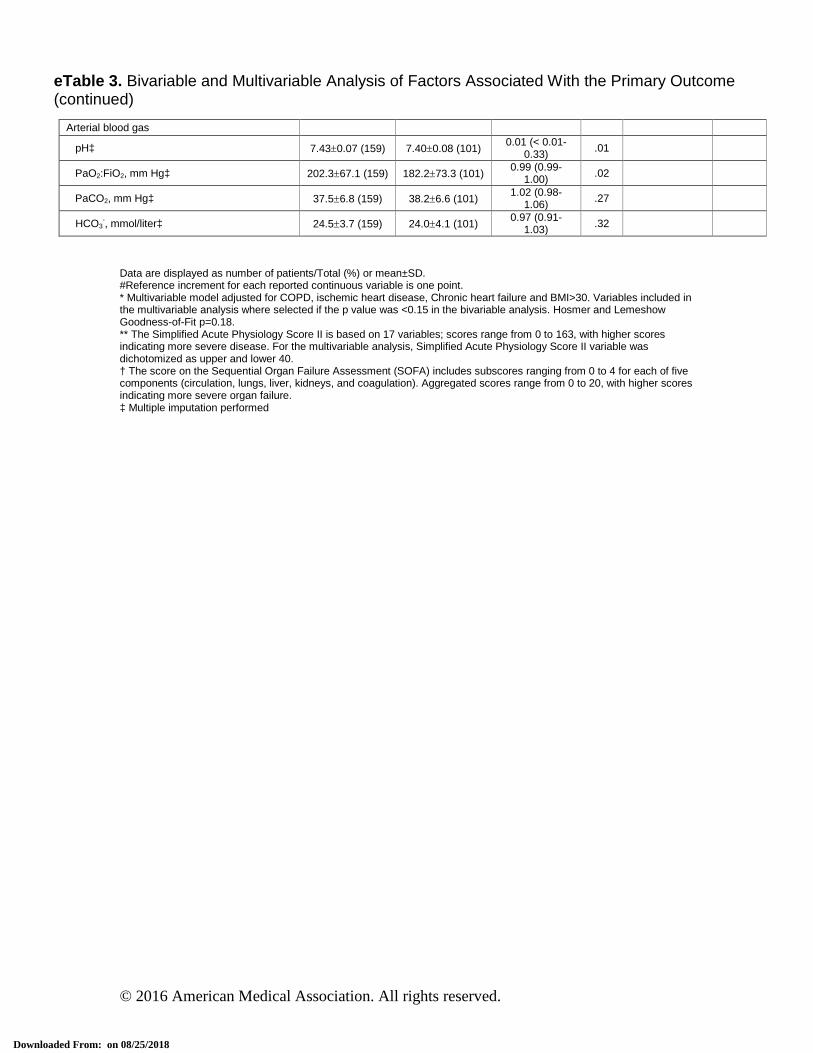
eTable 3. Bivariable and Multivariable Analysis of Factors Associated With the Primary Outcome (continued)
Data are displayed as number of patients/Total (%) or mean±SD. #Reference increment for each reported continuous variable is one point. * Multivariable model adjusted for COPD, ischemic heart disease, Chronic heart failure and BMI>30. Variables included in the multivariable analysis where selected if the p value was <0.15 in the bivariable analysis. Hosmer and Lemeshow Goodness-of-Fit p=0.18. ** The Simplified Acute Physiology Score II is based on 17 variables; scores range from 0 to 163, with higher scores indicating more severe disease. For the multivariable analysis, Simplified Acute Physiology Score II variable was dichotomized as upper and lower 40. † The score on the Sequential Organ Failure Assessment (SOFA) includes subscores ranging from 0 to 4 for each of five components (circulation, lungs, liver, kidneys, and coagulation). Aggregated scores range from 0 to 20, with higher scores indicating more severe organ failure. ‡ Multiple imputation performed
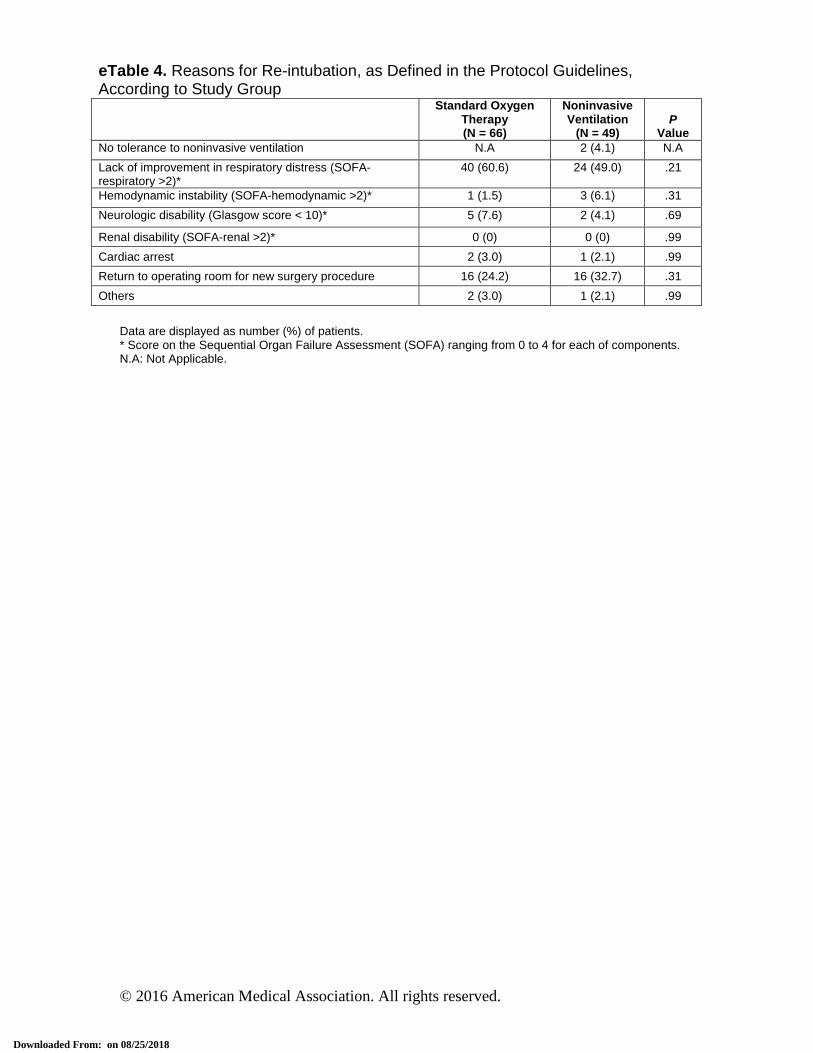
Renal disability (SOFA-renal >2)* 0 (0) 0 (0) .99 Cardiac arrest 2 (3.0) 1 (2.1) .99 Return to operating room for new surgery procedure 16 (24.2) 16 (32.7) .31 Others 2 (3.0) 1 (2.1) .99
Data are displayed as number (%) of patients. * Score on the Sequential Organ Failure Assessment (SOFA) ranging from 0 to 4 for each of components. N.A: Not Applicable.
*Missing data for healthcare associated infections at D14 in Standard Oxygen Therapy n=11 and NIV n=7. **Missing data for healthcare associated infections at D30 in Standard Oxygen Therapy n=17 and NIV n=11.
Values are displayed as number (%) or mean±SD. The Clinical Pulmonary Infection Score (CPIS) was calculated from the first five variables (see table CPIS). The CPIS gram/culture was calculated from the CPIS score by adding two more points when gram stains or culture were positive. A score of more than six at baseline or after incorporating the gram stains (CPIS gram) or culture (CPIS culture) results was considered suggestive of pneumonia. Pneumonia can have been caused by more than one species of gram-negative or gram-positive microorganisms and/or of Candida.