SUPPLEMENTARY TUITION IN MATHEMATICS: EXPLORING THE INDUSTRY IN THE EASTERN CAPE by J. COETZEE submitted in part fulfilment of the requirements for the degree of MASTER OF SCIENCE IN MATHEMATICS, SCIENCE AND TECHNOLOGY EDUCATION in the subject MATHEMATICS EDUCATION at the UNIVERSITY OF SOUTH AFRICA SUPERVISOR: DR. R. MARITZ JOINT SUPERVISOR: PROF. L.D. MOGARI NOVEMBER 2008
Transcript
SUPPLEMENTARY TUITION IN MATHEMATICS: EXPLORING THE INDUSTRY IN THE EASTERN CAPE
by
J. COETZEE
submitted in part fulfilment of the requirements for the degree of
MASTER OF SCIENCE IN MATHEMATICS, SCIENCE AND TECHNOLOGY EDUCATION
in the subject
MATHEMATICS EDUCATION
at the
UNIVERSITY OF SOUTH AFRICA
SUPERVISOR: DR. R. MARITZ
JOINT SUPERVISOR: PROF. L.D. MOGARI
NOVEMBER 2008
ii
Abstract
This study explored and evaluated the prevalence of supplementary tuition in the
teaching and learning of Mathematics/Mathematical Literacy in some high-
performing schools of the East London district in the Eastern Cape. The study
followed a descriptive survey design to address the research problem. Data were
gathered using questionnaires for grade 11 learners and high school
Mathematics/Mathematical Literacy teachers. The learners were the first group to be
taught the Mathematics/Mathematical Literacy learning programme of the new
National Curriculum Statement (NCS).
The results showed that a fair number of learners (about 48%) were not satisfied with
their performance in Mathematics/Mathematical Literacy and a large number of the
learners (about 90%) considered a good pass in Mathematics/Mathematical Literacy
as important, particularly for their future careers. A substantial proportion of learners
(42%) expressed concern about the amount of school time allocated to
Mathematics/Mathematical Literacy, and thought that this factor hampered the
successful completion of the syllabus. Teachers who happened to be adequately
qualified and experienced enough, struggled to complete the Grade 11 Mathematics
syllabus in time and were concerned about misconceptions carried from lower classes.
Teachers also expressed some concern about learners’ lack of commitment to
Mathematics/Mathematical Literacy. Learners seemingly took supplementary tuition
as a way of overcoming their learning challenges. Of the three forms of
supplementary tuition (i.e. private tuition, vacation classes and revising model/former
examination papers) commonly available in the district, revising examination papers
was preferred (about 83%) followed by private tuition at 81% and lastly vacation
iii
school. Learners spent 1.67 hours per week on average on supplementary tuition.
More Mathematics learners (about 34%) than Mathematical Literacy learners (about
6%) make use of supplementary tuition. Based on these findings, it was concluded
that supplementary tuition is not unique to schools that perform poorly, and even at
high performing schools, factors exist which influence learners to take supplementary
tuition.
Key terms:
supplementary tuition, shadow system of education, extra classes, tutoring, extra
tuition, past examination papers, vacation tuition, holiday tuition, study support, extra
help, performance in mathematics
iv
DECLARATION
I declare that SUPPLEMENTARY TUITION IN MATHEMATICS: EXPLORING THE INDUSTRY IN THE EASTERN CAPE is my own work and that all the sources that I have used or quoted have been indicated and acknowledged by means of complete references.
…………..............................
……………………..
SIGNATURE
DATE
(MRS J. COETZEE)
v
ACKNOWLEDGEMENTS
I would like to extend my sincere gratitude to Dr. Maritz for being willing to become
my supervisor at a very late stage. She was accommodating and supportive, yet utterly
professional.
Professor Mogari came on board at an even later stage and his assistance proved to be
invaluable. His experience showed in the advice that he gave, the insight that he
displayed and his pertinent recommendations. I came to appreciate his attention to
detail, his work-ethic and his teaching skills. I am indebted to Professor Mogari for
his significant contribution to the completion of this study.
I would like to thank Professor A. Mji for his initial input.
I am grateful to Danie Visser and Nelia van Velden who did the statistical processing,
and the copy editing, respectively. Both were meticulous and painstakingly checked
every detail.
I would like to acknowledge the staff and learners from the nine high-performing
schools in East London for completing the questionnaires, and the headmasters of
these schools for their cooperation.
Some people touch our lives in profound ways. One such person is my sister, Dr.
Susan van Rensburg, who taught me most of what I know about mathematics
teaching.
vi
My grateful thanks go to my husband Kobus and our children for their steadfast
encouragement.
Finally, “Human wisdom, brilliance, insight – they are of no help if the Lord is
against you. You can get horses ready for the battle, but it is the Lord who gives
Figure 2: The importance of a good pass in Mathematics/Mathematical Literacy . . . . . . . . 41
Figure 3: More school time for Mathematics? . . . . . . . . . . . . . . . . . . . . . . . . . . 42
1
CHAPTER 1
RATIONALE FOR THE STUDY
1.1 Supplementary tuition defined
Instruction is defined as the teaching of a school subject or a skill. Tutoring is usually
regarded as the private teaching or instruction of a single pupil or a very small class.
In the South African context the term ”supplementary instruction”, or “SI” has
become synonymous with formal tertiary support given by peers who have already
passed the course. Under “supplementary tuition”, we understand extra tuition at a
fee, given to one or small groups of primary or secondary school learners by a
provider outside the normal school hours. Supplementary tuition excludes
extracurricular subjects like art, music, sport, or lessons given by teachers after hours
to complete the syllabus on time. However, it includes paid supplementary tuition,
given by teachers or independent providers during term time and during the vacations,
and the use of commercially available material such as former/model examination
papers and worked answers. Although the TIMMS study reports that more than 75%
of grade eight learners in South Africa receive supplementary tuition in mathematics
(Baker et al, 2001), this may include lessons given by the teachers to cover the syllabi
in time. It could also include help given by family members, which would then fall
outside the definition of supplementary tuition in this study.
1.2 Introduction
Educators worldwide are impressed with the good performance of many of the Asian
countries in international comparison studies, such as TIMMS (Howie, 1999), PISA
(OECD, 2001) and SACMEQ II (Moloi, 2000). The performance of the Japanese
2
learners in the TIMMS study, impressed educators from the United Kingdom to such
an extent that efforts have been made to emulate aspects of the Japanese school
system in order for learners to become more competitive. The effort to rank schools
on examination scores (Waldorf, 1996) is an example. This decision was taken after
the results of the TIMMS-R study were published. Ironically, the Japanese Ministry of
Education has since recognised school ranking as a serious problem that contributes to
unhealthy levels of competition (Japan, Ministry of Education, Science and Culture,
1995).
Supplementary tuition could be a contributory factor to the significant differences in
performance levels between Asian countries, such as Japan, and other countries. One
notable thing about the Japanese school system is the extent to which supplementary
tuition is used. Normal teacher-oriented lessons that focus on imparting the
mathematical content knowledge are given during day and in the afternoon learners
are subjected to supplementary tuition that is dominated by problem solving (Howie,
1999). It is for this reason that young Asian children performed very well in the
TIMMS study, possibly because they have had so much practice at, and have spent so
much time on mathematics, both during and after school hours. Learners attend extra
classes from a young age, with vast sums of money and resources invested in
supplementary tuition. Lee (2002) has reported that in Korea, more money is spent by
parents on supplementary tuition than what the government spends on formal
education. Increasingly, attention is given to the possible contribution of
supplementary tuition to a country’s national achievement (Ireson, 2004).
A typical day in the life of a Korean child for instance, starts with an hour of studying
before normal school day that takes up 10 hours, while in the evenings another 4 to 6
3
hours of supplementary tuition follow (Lee, 2002). With such dedication, it is not
surprising that out of all the TIMSS studies so far, young Koreans are ranked among
the top five countries. Similar levels of dedication have been reported in Sri Lanka
(De Silva, 1994), Mauritius (Foondun, 2002) and other countries.
In contrast, South African learners continue to perform poorly in mathematics and
science, and no significant improvement has been noticed despite various projects
launched by commerce and government alike (CDE, 2004). However developing
countries with similar social problems, such as the Philippines and Indonesia, do not
perform as poorly as South Africa, while young learners from most Asian countries
perform exceptionally well in mathematics and science (Howie, 1999). Many reasons
have been advanced for South Africa’s poor performance, one of which is that
insufficient time is spent on mathematics in many South African schools (CDE, 2004:
p163). Another problem is the shortage of qualified mathematics teachers in the
country. This problem has recently been exacerbated by the introduction of
Mathematical Literacy as a compulsory subject for learners who do not take
Mathematics as a subject. The first of these learners will be in Grade 12 in 2008. The
idea here seems to try and make South Africa a nation that is mathematically literate.
Lack of access to mathematics is regarded by some as a social and economic barrier
that leaves people disenfranchised (Schoenfeld, 2004; Scanlon & Buckingham, 2004).
In order to offer mathematics/mathematical literacy to more learners, many more
teachers are required, and the Department of Education has started a drive to recruit
more mathematics and science teachers. The national and cross-border advertising
campaign aims to identify teachers who seek employment in public schools in South
Africa (Newman, 2007). It is hoped that the more mathematics teachers we have, the
4
easier it may be to offer supplementary tuition. Based on these premises,
supplementary tuition in South African schools needs to be investigated.
1.3 Background of the study
Use of supplementary tuition seems to be a common practice amongst more
privileged learners in South Africa. It seems that not much research has been done on
the South African situation, but the TIMMS study reported that more than 75% of
grade eight learners in South Africa have received extra tuition in mathematics (Baker
et al, 2001). Apart from supplementary tuition given after hours at school, a
substantial number of learners in privileged communities receive additional extra-
curricular tuition (personal communication).
The mathematics supplementary tuition industry has grown substantially in recent
years. Studies (Russell, 2002: p10; Canada, 2000) report a steady growth in the
industry in the United Kingdom and Canada. Russell goes so far as to call it a
“revolution”. Mischo and Haag (2002: p264) report similar trends in Germany. In
many countries like Cambodia, Egypt, India, Japan, Kenya, Malta, Romania, Taiwan
and Mauritius, the prevalence of supplementary tuition is high, and it is expected to
increase even further (Bray, 2003). The industry comprises for instance, the private
teacher earning an extra income from home, official businesses making use of
computers and custom designed software to assist students in mathematics, and
stationers offering study guides and worked examination papers for sale.
There has to be a good reason for the obvious growth in the mathematics
supplementary tuition industry: the industry must have a measure of success in
improving learners' performance in mathematics. There might also be underlying
5
reasons for the need for supplementary tuition, even in communities where additional
classes are already offered by the school. Why are so many extra hours spent at
mathematics after school? Does the enrichment strategy or remedial strategy (Baker et
al, 2001, see section 3.5.1 and section 2.3) play a role in learners’ decision to seek
supplementary instruction?
1.4 Supplementary tuition in South Africa
It would seem there has been a sudden deluge of supplementary tuition in South
Africa. Of interest in this regard is to understand the possible reasons for this sudden
spread of supplementary tuition. One possible reason for the proliferation of
supplementary tuition is that learners may be receiving extra tuition because of the
shortage of qualified mathematics teachers in the country. Of the 27 000 mathematics
teachers in service in 2005, 18 000 (66.7%) had proper qualifications (Pandor, 2005).
These numbers suggest that about a third of the teachers were not suitably qualified to
teach mathematics. This is consistent with a finding in 1999, that 27% of pupils were
taught mathematics by teachers without formal qualifications in the subject (Howie,
1999).
In an article in Business Day (Blain, 2007), Sue Blain asserts that too few
mathematics teachers in South Africa and elsewhere, know enough about
mathematics, or have been trained properly, in order for them to show learners how
and why their methods are wrong.
Another possible reason for the proliferation of supplementary tuition in South Africa
may be that the syllabi are too long. Assessment standards are defined as ‘the
knowledge, skills and values that learners need to show to achieve the Learning
6
Outcomes in each grade’ (Department of Education, 2002). According to Moloi
(2000), these also suggest minimum mathematics content that learners must command
to show that they have achieved the learning outcome. It takes time to learn
mathematical skills and especially how to transfer these skills from familiar to
unfamiliar situations (ibid.). Would it not therefore benefit everyone if the time spent
on mathematics during school hours, is increased? Hence there is a need to explore
the state of supplementary tuition in mathematics education in South Africa.
1.5 Research questions
The study explores the status of supplementary tuition in the East London district in
the Eastern Cape and attempts to answer the following questions:
• Why do learners take or not take supplementary tuition?
• What is the nature of the supplementary tuition offered?
• Who takes supplementary tuition?
1.6 Significance of the study
We attempt to assess the demand for supplementary tuition in mathematics in the East
London district in the Eastern Cape. In doing so, this study undertakes to contribute to
the body of knowledge on supplementary tuition in South Africa. It would appear
little research has been done on this topic in South Africa, especially from the
consumer’s point of view. Only recently, has supplementary tuition received a
measure of attention from the point of view of the deliverer of the service: the South
African Department of Science and Technology (DST) commissioned the Human
Sciences Research Council (HSRC) to investigate supplementary tuition service
7
deliverers. The Department wants to gain understanding and/or control of this sector,
and in the past this was impossible because of the lack of information available.
However, it would appear in South Africa the “shadow system of education” has not
been studied from the consumer’s point of view. It is not known how prevalent the
practice is. Although the TIMMS study indicated that more than 75% of Grade 8
learners in South Africa make use of supplementary tuition, it seems as if few studies
have been done here on other Grades. According to Baker et al (2001), supplementary
tuition might be more prevalent at later stages, such as at the end of secondary
schooling.
It is also not known which factors drive the system in South Africa. The reasons for
the apparent need for supplementary tuition by South African learners and teachers,
are not clear. The shadow system has economic implications and possibly affects the
educational system to some degree (Ireson, 2004; Bray, 1999). According to Bray
(1999, 65), it appears as if the shadow education system in Japan plays a major role in
Japan’s remarkable economic success in that the system encourages a disciplined
work ethic. In some societies supplementary tuition has a type of child-minding
function by which both parents are enabled to take up employment (ibid.). An
important implication for South Africa with its high unemployment rate, is that
supplementary tuition could provide an additional avenue for employment. If learners
gain knowledge, it could in turn benefit their communities, and subsequently the
country at large.
In some countries undesirable practices exist, e.g. in Cyprus, Russia, Indonesia,
Lebanon and Russia, where teachers are also the tutors in the shadow system, and
8
justify charging their pupils for supplementary tuition on the grounds that they are
poorly paid and/or that they are unable to cover the syllabus in the allocated class time
(Bray, 1999; Foondun, 2002). In some instances, elements of blackmail may even be
involved. In many countries, the occurrence of supplementary tuition has reached
unhealthy levels as learners spend an inordinate amount of time and money on this
type of learning (Lee, 2002; De Silva, 1994; Foondun, 2002). The research base in
South Africa appears to be limited, and not much is known locally about these
practices.
Furthermore, according to a report from the Centre for Development and Enterprise
(CDE, 2004), there are some schools, called high performing schools, which are
regarded as a significant national resource, producing a disproportionate number of
mathematics and physical science passes among African candidates. It is therefore
important to know what practises with regards to supplementary tuition are prevalent
in these schools and whether these practices play a role in the success of the learning
and teaching.
1.7 Contents of the different chapters
Chapter 1 provides an introductory orientation to this study. Chapter 2 deals with the
rationale for the study, as well as an overview of studies conducted on supplementary
tuition, both locally and internationally. The shadow system of education is a vast,
global enterprise and could have social, economic and educational ramifications. To
come to a better understanding of this system, the following factors were examined in
detail in Chapter 2: the reasons for the existence of supplementary tuition, the scale
and importance of the system, popular subjects, the nature of the service providers
and the consumers, as well as the impact of supplementary tuition on the learners and
9
the main education system alike. In Chapter 3 the research design is described.
Following a pilot study in 2005, two questionnaires were compiled and distributed in
2007: the first was a Questionnaire for Mathematics/Mathematical Literacy Learners
and the second a Questionnaire for Teachers of Mathematics/Mathematical Literacy.
A stratified cluster sample was taken of 10 urban high schools in the East London
district. One school declined to take part in the study and eventually 364 Grade 11
learners from 9 schools completed the learner questionnaire and 47 teachers of Grades
10-12 completed the teacher questionnaire.
In Chapter 4, the data is analysed. An attempt is made to answer the research
questions:
• Why do learners take or not take supplementary tuition? It is assumed that
most of the learners who take supplementary tuition, are dissatisfied with their
performance in mathematics. The presumed dissatisfaction could have many
causes, e.g. ineffective or sub-standard teaching, big classes, learners who are
over-committed in other areas, long syllabi, lack of resources, etc. It is also
assumed that learners have high expectations of their performance in
mathematics, possibly because of the enrichment strategy. Another possibility
is that some learners and/or teachers may view the formal allocation of school
time for mathematics as inadequate.
• What is the nature of the supplementary tuition offered? Here the focus is on
the forms of supplementary tuition learners take. Which of the identified forms
are popular? Why is the identified form popular?
• Who takes supplementary tuition? Is a certain gender or age group
predominant? Do more Mathematics than Mathematical Literacy learners take
supplementary tuition?
10
Chapter 5 gives an overview of the study, the conclusions reached and the impact that
the study could have on the supplementary “industry”. Finally, recommendations are
made for further studies on supplementary tuition in South Africa.
11
CHAPTER 2
LITERATURE REVIEW
2.1 Introduction
The body of research available on supplementary tuition internationally, is not
substantial. Two important studies are drawn on; one international study and one
South African study. The international study was conducted in 1999 by Bray for
UNESCO. The local study, commissioned by the South African Department of
Science and Technology (DST), was conducted by the Human Sciences Research
Council (HSRC). A follow up study by the HSRC has been reported too. The HSRC
researchers studied supplementary tuition in South Africa mainly from the perspective
of service providers (Reddy, Lebani, & Davidson, 2003; Reddy, Berkowitz, & Mji,
2005).
2.2 Supplementary tuition as a shadow education system
Bray defines this shadow education system as a “… mechanism through which pupils
extend their learning and gain additional human capital, which benefits not only
themselves but also the wider societies of which they are part” (Bray, 1999: p18).
Supplementary tuition is referred to as ‘The shadow education system’ (Bray, 1999;
Stevenson & Baker, 1992), because it exists alongside the main education system, but
has no interaction with the main system; it changes as mainstream education changes,
but is more vague and ill-defined than the main system.
Various terms are used worldwide for supplementary tuition. In England, the term
“tuition” is used for different forms of tutoring. In the UK, the government refers to
“study support” as “learning activity outside normal lessons in which young people
12
take part voluntarily” (Ireson, 2004: p110). In the USA, the term “extra help” is used
by Balfanz et al (2002). In the South African context the term ‘supplementary
instruction or SI’ has become synonymous with formal tertiary support. Tutors
sometimes attend classes with the students and assist them with study skills and
academic input. The tutors are usually remunerated by the Universities at an hourly
rate. There may also be a shadow education system for tertiary education, but for the
purposes of this study the focus will be on secondary education. Also, the term
‘supplementary tuition’ will be used in the context explained above, and
‘supplementary tuition’ will be used when the context is that of extra tuition, given at
a fee, to primary or secondary learners, by any providers, outside the normal school
hours. The same terminology is also used by Reddy et al (2003).
2.3 Why does this shadow education system exist?
An important reason advanced for the existence of this shadow system, is that parents
regard it as necessary for socio-economic advancement (Baker et al, 2001; Bray,
1999). This mindset is more prevalent in some countries than in others, and is
aggravated if there is a perceived or real difference in the standard of living of the
qualified versus the unqualified (Lee, 2002). In fact, studies (e.g. Bray, 1999; Reddy,
et al, 2003, 2005) have shown that while supplementary tuition can be expected to be
a highly uncomfortable economic drain on household income for poorer households,
parents accorded it such importance that they were prepared to make sacrifices. Many
parents are prepared to pay huge sums of money to give their children a competitive
edge (Bray, 1999). The latter could be used to enter the job market, to gain entry into
tertiary institutions or, more specifically, into certain courses offered at tertiary
institutions. Kwan-Terry (1991) indicated that in Singapore earnings of males could
rise from S$583 per month for males with no education, to S$3000 for males with
13
tertiary education. Clearly, supplementary tuition will be less common in countries
where differentials aren’t as marked (Bray, 2003). In an article in the Cape Argus
(May, 2007), economist Servaas van der Berg asserts that approximately 15 000
learners from the Eastern Cape flock to the Western Cape in search of quality
education at the start of each school year. This happens because of the large
differential that exists between these two provinces in terms of matriculation pass
rates and quality education. The proportion of learners in the Western Cape, who
obtained a Higher Grade D or a Standard Grade C in mathematics, was twice the
national average at 8.8% (Van der Berg, 2007). These symbols represent the
minimum entrance requirement of most technical fields of study at universities.
In Singapore parents also recognise the value of English as an essential tool in the
economic sector and in financial dealings. It is common practice to see parents send
their children to supplementary tuition to help them with proficiency in English (Bray,
1999).
Montgomery et al (2000) state that the occupation and qualifications of the mother are
strong bivariate predictors of supplementary instruction. He adds that children of
better-educated mothers are much more likely to receive extra instruction at least at
the primary level and perhaps at the junior secondary level as well. Many researchers
allude to the strong connection between childrens’ opportunity to participate in the
shadow education system and their socio-economic and cultural background (Ireson,
2004 & Paviot et al (2007)). According to Smyth (2008), participation in the shadow
education system is disproportionally concentrated among students from the middle-
class, those with higher prior performance and those with greater involvement in the
14
schooling process. It also stands to reason that parents with higher qualifications are
likely to earn higher salaries and have the resources to employ private tutors.
In South Africa, it is becoming increasingly difficult to get into medical school, or
related medical fields of study, like physiotherapy. To qualify for admittance, learners
must show a high level of competency by getting top symbols. In order to achieve
these top symbols, supplementary tuition in mathematics and science are commonly
utilised to increase or maintain the acquisition of good grades.
Educational factors play a role in the prevalence of the shadow system. Parents and
their children may take the decision to use the shadow system if they regard the
service delivery at school or in a certain region as poor – the teacher may be viewed
as inexperienced or inadequate to convey important concepts. Being well trained in
mathematics does not necessarily guarantee the makings of a good mathematics
teacher. Prof Mamokgethi Setati (Blaine, 2007) states that “There is a big difference
between being able to do mathematics for yourself and being able to teach it”. Parker
(2004) sees practising mathematics teaching and practising mathematics, as two
distinctly different discourses that should not be learnt at the same time, since they
work in opposite directions. She argues for a third discourse, namely a study of
mathematics education.
It has already been mentioned that South Africa has an acute shortage of qualified
mathematics and science teachers. Poor matriculation results in turn, lead to a
shortage of candidate teachers in the Further Education and Training (FET, Grades 10
to 12) band, where a university qualification is required. In 2006, only 2.7% of South
Africa’s matriculants passed mathematics at the higher grade. This figure increased
15
slightly in 2007, from 25 217 passes in 2006 to 25 415 in 2007 (Pandor, 2007). These
candidates had to be shared amongst all the university courses that require HG
mathematics as an entrance criterion. It therefore stands to reason that only a very
small percentage of these candidates will study to become mathematics teachers in the
FET band. According to statistics of the Department of Education (2005), only three
percent of all students enrolled in institutions of higher learning in the year 2003,
were in mathematical sciences as an area of specialization.
Cultural views of effort versus ability likewise affect the prevalence of the shadow
system. Although 71-96% of students in all countries agreed that hard work is
required to do well, effort is rated higher in the Asian countries (Ireson, 2004) and this
partly explains the higher prevalence of supplementary tuition in the Asian block.
Another reason for the prevalence of supplementary tuition advanced by Baker et al
(2001, 3), is what is termed by them as the remedial strategy. According to this
theory, it has become essential to complete a minimum level of schooling, since more
often than not, schooling has become the only avenue to acceptable adult status in
modern society. Ending one’s schooling prematurely, could have severe social
consequences for both individual and society. Therefore, individuals make use of
supplementary tuition as a remedial measure to ensure successful completion of a
minimum level of schooling. The remedial strategy may be more dominant amongst
Mathematical Literacy learners.
2.4 The scale of the supplementary tuition system
The scale of supplementary tuition varies considerably from one country to another,
but it is often underestimated. In many Asian countries supplementary tuition starts at
a young age and continues for many years (Lee, 2002). In Korea a child in the latter
16
years of primary school, typically has a tutor or attends preparatory schools (or both)
for at least two subjects. It is also common for Korean parents to supply their children
with supplementary educational material (ibid.) and they spend a large portion of their
income on the latter. While the Korean government spends about 4% of its gross
domestic product (GDP) on education, the private sector spends about seven percent
of the GDP on education. In other words, parents with school-going children spend
almost 25% of their income on education. This translated to US$ 25 000 million in
1996 or 150% of the government’s educational budget (Bray, 1999). South Africa, on
the other hand, spends approximately 5.5% of the gross domestic product on
education (SA Yearbook, 2006/7). Although this is one of the highest rates of
government investment in education in the world (SA Yearbook, 2006/7), the matric
pass rate declined for the second year in succession to 68.3 per cent for the class of
2005, compared with 70.7 percent in 2004, and 73.3 percent in 2003. Of the 347 184
who passed in 2005, only 17% did so with a university entrance endorsement (Pandor,
2005).
Japanese families in 1988, paid an average of $240 per month per child for
supplementary tuition five and a half days per week (Petterson, 1993). Some
preparatory schools (jobiko or juko) exist purely to prepare students to get into
(better) preparatory schools. Clearly supplementary tuition has become a “… huge
business, mobilising extensive resources and employing many people.” (Bray, 1999:
p9). The tuition seems to be effective, considering the vast resources spent by the
parents.
Across the world, the popularity of supplementary tuition has increased at an
unprecedented rate. In Japan, the demand for supplementary tuition has more than
17
doubled in the 20 years from the seventies to the nineties, and approximately 70% of
all senior secondary school students receive after-hours tutoring in school subjects. In
Malaysia, the comparable figure is 83%. In Egypt, 74% of grade 8 pupils receive
tutoring. In Mauritius 100% of learners in form five and six were receiving extramural
tutoring in the nineties. In Hong Kong, an investigation by the government’s
ombudsman revealed that unregistered schools had probably increased five-fold in
five years (Bray, 2003: p45). Studies by Baker et al (2001) showed that more than
50% of Grade 7 pupils in the Czech Republic, Hong Kong, Japan, Latvia, the Russian
Federation, Slovakia and Slovenia received supplementary tuition, with more than
70% having received supplementary tuition at some point in their schooling career
(Bray & Kwok, 2003).
The collapse of communism in Europe, the reunification of West Germany and East
Germany, the economic transitions of China and Vietnam, and the collapse of
apartheid in South Africa, all played a role in the increasing demand for
supplementary tuition (Reddy et al, 2003). People, who were previously
disadvantaged, suddenly had access to the open market system and found themselves
competing with more privileged peers for resources. As mentioned before, parents are
prepared to sacrifice considerably to give their children an edge in the open market.
This is regarded as a strategic long-term resolve to increase family income and
standing.
The value that a community attaches to specific subjects plays a major role in the
decision to make use of supplementary tuition. Asian children in South Africa often
take extra practical classical music lessons outside of school hours. Classical music is
held in high esteem in their community, both for its artistic value and as an
18
educational tool to teach children the value of hard work and repetition. It is no
wonder that more often than not, Asian children make up an unusually high
proportion amongst the prize winners in local eisteddfods.
Some children have more than one private tutor. It has been shown, for example, that
in Sri Lanka, it is not uncommon to have even four or more tutors per subject (Bray,
1999).
As to the scale of supplementary tuition in South Africa, no contemporary and
empirical investigation has contextualised this yet. In fact, the present study aims to
provide some baseline information on the extent of the shadow education system in
the FET phase in the Eastern Cape.
2.4.1 Subjects
Based on the preferences of the Asian countries especially, it appears that the subjects
regarded as most important, are those that have a direct bearing on socio-economic
advancement. Supplementary tuition in mathematics, science and English, seems to
be the most popular internationally. Among these subjects, it appears that a higher
premium is placed on mathematics than on any other subject. Even in European
countries like Germany, where the prevalence of supplementary tuition is relatively
low, extra tuition in mathematics seems to be the most sought after, and between 16%
and 20% of children receive extra tuition (Mischo & Haag, 2002). In South Africa, it
appears that supplementary tuition is not confined to the subjects favoured
internationally. For example, there is a growing demand for supplementary tuition in
subjects like science and accountancy. For various reasons, perhaps tied to this
country’s past, supplementary tuition seems to be thriving in indigenous language
learning e.g., Zulu and Xhosa (personal communication).
19
2.5 The effectiveness of tutoring
Reasonably, one would expect tutoring to have a positive effect on the learners’
performance, but research has not yet been able to demonstrate a definite, positive
correlation. Studies conducted in France, Greece and Egypt (e.g., Polydorides, 1986;
Fergany, 1994) could not make conclusive findings about the effect of private
supplementary tuition on academic achievement. Bloom however reported in 1984
that tutoring gave students a two standard deviation gain above the average of
students in the control group. Put differently, the average tutored student
outperformed 98% of the students in the control group. Walberg (1984), in a follow-
up study, identified tutorial instruction as having the greatest influence on attainment
when compared to factors like time-on-task and study skills, the latter having an effect
of one standard deviation.
Jacob & Lefgren (2002) found evidence of substantial positive effects of summer
school on academic achievement in reading and mathematics which remained
considerable two years after completing the program. Studies conducted by Posner &
Vandell (1999) and MacBeath et al (2001) have found structured after-school
programs in Great Britian to be particularly beneficial to learners from disadvantaged
backgrounds. In a meta-analysis of findings from 65 independent evaluations of
school tutoring programs, Cohen et al. (1982: p241) found that these programs have a
positive effect on the academic performance and attitudes of the participants. The
average child in the tutored group scored at the 66th percentile of the students in the
untutored or control group, and the tutoring of mathematics was even more effective
than tutoring of reading. Although the meta-analysis was done on in-school tutoring,
the results have to be considered.
20
In Israel, a supplementary high school intervention targeted ten to twelfth graders who
needed additional help to pass the matriculation examinations. Lavy & Schlosser
(2004) found that the program increased the mean matriculation rate by 3.3
percentage points and increased the participating learner’s probability of earning a
matriculation certificate by 12 percentage points, which amounted to an improvement
of 22%. This program was rapidly expanded, and in 2004 it was being conducted in
approximately one-third of all schools countrywide in Israel.
2.6 The importance of the shadow educational system
The mere size of this enormous enterprise demands attention. Huge sums of money
are spent all over the world, and yet little is known about the system. Supplementary
tuition is costly and therefore generally accessible only to those who can afford it
(Reddy et al, 2005). Bray (1999) has also alluded to the fact that supplementary
tuition commonly creates and perpetuates social inequalities. In fact, it has been
reported that in general, the majority of learners taking supplementary tuition, are
those who are already doing well at school and who want to maintain their
competitive edge. Studies conducted in Hong Kong, Taiwan and Germany indicated
that students receiving tutoring come from elite academic schools and backgrounds
(ibid.). It is therefore critical to understand supplementary tuition’s implications for
and effects on the main education systems.
Also, it is important to find out what its effects are on social change. In South Africa,
we are already plagued with an excess of historical inequalities, and do not need these
perpetuated. According to Ireson (2004: p120), the shadow system has the potential to
distort the education system by “conferring significant disadvantages on those who
are unable to afford the cost of tutors”. It might, however be important to educational
21
planners and other stakeholders in South Africa, to take note of studies that have
revealed that structured supplementary tuition is particularly beneficial for children
from disadvantaged backgrounds, having positive effects on both their academic
achievement, as well as their social adjustment (Posner & Vandell, 1999; Macbeath et
al, 2001). Furthermore, supplementary tuition has also been shown to have a positive
influence on attitudes and self-concept, even at low participation levels (Camp, 1990).
Regarding the importance of supplementary tuition, Bray (1999: p19) has pointed out
that “… much can be learned from cross-national comparisons regarding the nature of
private supplementary tuition and about appropriate responses from planners and
policy-makers”. It is noticeable that countries where supplementary tuition is
prevalent, have shown considerable technological advancement accompanied by
economic growth. Typically, countries like Japan, Singapore and Korea have not only
shown their learners performing well in cross-national and comparative studies such
as the TIMSS study, but these countries are also rapidly progressing technologically.
While supplementary tuition has significant benefits in that it helps improve the
academic attainment in a subject, it is not without disadvantages. The shadow system
has an effect on the learners involved. Bray refers to the negative effect as the
‘opportunity cost’ that arises from over-commitment in terms of time and effort on the
part of the learners. As an example he mentions Malaysia, where 70% of the students
who receive tutoring have to travel to their classes for up to 3 hours per week. He also
points to the fact that about 20% of these students have to travel a staggering 6 hours
per week (Bray, 1999).
The shadow education system in South Africa seems to be a fast-growing one. The
middle class in South Africa is expanding and so are the aspirations of the people. Its
22
importance notwithstanding, supplementary tuition is a difficult enterprise to
investigate. For example, tutors are unwilling to declare their income and researchers
do not have the authority to demand information. As it is aptly called ‘a shadow’
system, revenue created from the system is mostly disguised from income tax
authorities (Bray, 1999).
2.7 The service providers
The characteristics of tutors in the shadow education system vary even more widely
than in the mainstream system. Variations exist in age, qualifications and employment
status. In some societies, tutors are mainly university students working to support
their studies. In other societies, secondary school children tutor primary school
children and retired teachers are also popular tutors (Bray, 1999: p39). In South
Africa, unemployed youths often help their peers, sometimes charging a small fee. In
some countries like Russia, Egypt and Nigeria the teachers in the mainstream system
also tutor their charges after hours. This situation leads to serious problems, since
teachers could theoretically manipulate the situation to their own advantage, by
teaching ‘slowly’ and therefore creating more tutoring opportunities for themselves
(Foondun, 2002). An element of blackmail may even be involved (Bray, 1999: p38).
Fierce global economic competition has emphasised the need to develop a workforce
that is competitive. The South African Government has a responsibility to support the
economy by improving the level of the education and the skills of its workforce.
According to Kahn (2006: p20), Government “has lagged behind in investing in high-
level skills production and its associated research”, and this may affect economic
growth negatively. Reddy et al (2003, p9) asserts that “… the low number of
matriculants, especially the low number of African matriculants with the requisite
23
scores to enter tertiary institutions, is a serious concern for the country”, and points to
the importance of this form of tuition and the significant role it may play in improving
the current situation.
In 2003, the Department of Science and Technology commissioned the Human
Sciences Research Council to conduct a study on supplementary tuition in South
Africa in order to determine a strategy to support the education sector. Reddy et al,
(2003, 2005) reported that their task was to (a) assess the extent, nature and cost of
supplementary tuition in mathematics, science and computer studies for secondary
school learners; (b) evaluate the usefulness of the interventions; (c) develop models of
school programmes; and (d) make recommendations to the DST on the massification
of the programmes. The study was conducted from the perspective of the service
providers, with the purpose of developing a typology for the initiatives that provide
supplementary tuition to secondary learners. A diverse number of service providers –
18 000 in total - were identified. The service providers varied from universities and
non-governmental organisations to private businesses, franchises, and retired teachers.
The researchers reported that most service providers concentrated on the school
curriculum and assisted the learners with learning support materials (LSM), e.g. the
provision of past examination papers. They also found that classes were mostly
conducted after school hours during the week, or on Saturdays (ibid.).
2.8 The consumer
With respect to participation in supplementary tuition, learners get involved for a
variety of reasons. It may be for remedial purposes (Baker, 2001), it may be a
reflection of the social desirability of tutoring in a specific country (Ireson, 2004), of
parental ambitions, or of unrealistic comparisons with peers. A surprising aspect of
24
the supplementary tuition industry, is the fact that gender is not an issue. In fact, Bray
(1999) found that in countries like Egypt, Malaysia, Malta, Taiwan and Japan as many
girls as boys received tutoring.
Regarding the numbers of participants in South Africa, no definitive statistics are
available. To this effect, Reddy et al (2003) alluded to the difficulty of determining
the exact numbers of learners involved in the shadow education sector. However, they
indicated that the difficulty was because of the different modes of teaching involved
in the sector. However they estimated that at least 70 000 learners were involved
nationally in supplementary tuition at the time. These researchers also pointed to the
fact that the sector was ever expanding, with most programs operating in urban, high
population zones. They found that the majority of initiatives focused on Grade 12
learners (ibid.).
2.9 The impact of supplementary tuition on learners’ academic performance
Bray (1999) asserts that this is the one area that is in particular need of further
research, but concedes that it is not an easy topic to research. Because of the nature of
the shadow system, many stakeholders do not readily divulge information. One has no
control over the point in time when learners decide to commence supplementary
tuition and it is therefore difficult, if not impossible, to identify control groups.
Considering that the skill, experience and style of the tutor might be an important
factor in the outcome of the tutoring process, researchers will also have to consider
the role of the tutor as a complicating variable. It would be extremely difficult to find
homogeneous groups who make use of the same tutor (ibid.). Furthermore,
researchers need to allow for factors such as the urban and rural divide and socio-
economic differences. A majority of those who receive private tutoring, already
25
perform well at the particular subjects anyway (ibid.). Other compounding factors
include the learners involved in the system, the motivation of the tutors and the tutees
and the frequency, duration and timing of the tutoring.
Studies, (Polydorides, 1986; Fergany 1994) conducted in France, Greece and Egypt
could not make conclusive findings about the effect of private supplementary tuition
on academic achievement. It would be reasonable to expect tutoring to have a positive
effect on the learners’ performance, but research has not yet been able to demonstrate
a definite, positive correlation.
2.10 The impact of supplementary tuition on learners and mainstream schooling
Supplementary tuition is beneficial when it helps a learner to overcome a knowledge
or skills deficiency. This could in turn build the learner’s confidence and create more
positive learning experiences for the learner. However, supplementary tuition could
also create or increase disparities among learners, especially if some of the learners
are not able to afford supplementary tuition. An example would be the differences
between urban and rural learners. Bray (1999) warned that racial inequalities might be
exacerbated in some societies.
Furthermore, supplementary tuition could have a negative influence. A negative
influence could be the result of marked differences in quality between the mainstream
teaching and the supplementary tuition. In such a case, learners might decide not to
attend the mainstream lessons. The mainstream education system might lose some of
its best mathematics teachers to the shadow system. This phenomenon occurred in
countries such as Costa Rica and Lithuania (Bray, 1999). When teacher retrenchments
and redeployments started in 1995 in South Africa, many well qualified and
26
experienced teachers left the teaching profession (Howie, 1999: p5). Some of these
teachers got involved in the shadow education system.
Supplementary tuition might also lead to fatigue, for both learners and teachers who
tutor after hours. Children involved in supplementary tuition often feel tremendous
pressure, spend hours travelling to classes, work long hours and risk burnout.
Researchers have reported that sporting, leisure and even religious activities get
crowded out by extra classes and that less family time remains. In some cases this has
led to depression and even suicides (Bray, 1999; Petterson, 1993: p58). Concern about
excessive extra lesson attendance and its negative effect on learners, has led to a
gradual change from a standard six-day school week in Japan to a five-day week from
1995 (Bray, 1999). Lee (2002: p15) asserts that increasingly more children are
revolting against the excessive educational demands in Korea, and are turning into
“problem children”.
A possible negative effect that supplementary tuition could have on the mainstream
school system, is when the teachers tutor their own learners after hours and charge a
fee. A number of undesirable practices could result, e.g., where teachers omit certain
sections of the syllabus or teach slowly or poorly in order to create a market for
themselves. Such cases have been reported in Egypt and Cambodia (ibid.). These
practices would lead to teachers abusing the system by ensuring that their learners
participate in supplementary tuition where there is promise of money while classroom
tuition may be sacrificed.
On the other hand, supplementary tuition might also have unexpected advantages:
young people are kept busy in a constructive way and free parents to either take up
employment or take part in leisure activities. Research studies have found that apart
27
from an increase in academic attainment, supplementary tuition can have a beneficial
impact on learners in the form of more positive self-image, attitudes and attendance
(Ireson, 2004: p118).
2.11 Summary
It seems as if the shadow education system exists because parents regard it as
necessary for social-economic advancement, and mathematics is regarded as one of
the most important subjects. The scale of supplementary tuition varies considerably
worldwide, but it is often underestimated. Vast sums of money are spent on
supplementary tuition globally. The popularity of supplementary tuition has increased
at an unprecedented rate world-wide and could be causing, or at least perpetuating,
social inequalities.
It is noticeable that countries where supplementary tuition is prevalent, have shown
significant technological advancement accompanied by economic growth. It is
therefore critical to understand the impact of supplementary tuition on and the
implications for the main education systems.
The theoretical framework presented here has provided a context in which
supplementary tuition takes place. The framework provides a basis on which an
investigation of the industry in mathematics supplementary tuition could be explored
in the Eastern Cape and perhaps countrywide.
28
CHAPTER 3
METHODOLOGY
3.1 by followed,(the )
3.2 Research Design
A descriptive survey design was used to attempt to address the research questions.
The design was selected because it enables the researcher to describe systematically,
factually and accurately the characteristics of an existing phenomenon (Isaac &
Michael, 1981). In this study the phenomenon is supplementary tuition in
Mathematics and Mathematical Literacy offered to secondary school learners. Eribo
and Tanjong (2002) assert that the descriptive survey design is typically concerned
with determining the frequency with which something occurs. Hence a descriptive
survey design was selected to attempt to determine the proportion of secondary school
learners who receive supplementary tuition in Mathematics/Mathematical Literacy.
3.3 Population
According to the Education Management Information System (EMIS) statistics, the
Eastern Cape is the largest Provincial Education Department in terms of the number
of schools, and the second largest in terms of the number of educators and learners
involved. In 2005, there were approximately 500 000 learners in the 880 High
Schools in the Eastern Cape (Matomela, 2006). These schools are organised into 30
districts. Approximately 56 985 of the 654 004 learners in the Eastern Cape were in
the East London school district in 2005 (EMIS). This district comprises urban as well
as rural schools. In 2005 the pass rate in the matriculation examinations in the Eastern
29
Cape (56.7%), was well below the national average (68.3%) (ibid., SA Yearbook,
2006/7).
According to Gay and Airasian (1996: p111-112), a population is defined as follows:
‘The population is the group of interest to the researcher, the group
to which she or he would like the results of the study to be
generalizable”.
In this study, the population would therefore be high-performing schools in the East
London School District in the Eastern Cape Province. In 2004, the CDE defined a
high performing school as one with Higher Grade (HG) mathematics and science
classes, and a pass rate of 80% or more in these subjects. This definition will have to
be adapted, since 2007 was the last year that we had HG learners. The new NCS does
not make provision for streaming learners. For the purposes of this study, we will
regard a school as high-performing if the school has Mathematics learners (as
opposed to only Mathematical Literacy learners) and a pass rate of above 80%. A
report by the CDE (2004) advised that all high performing schools be identified and
that ways are investigated in which they could play an even bigger role in
mathematics and science education in the country. The CDE report refers to these
schools as “pockets of excellence” (CDE, 2004: p142).
30
3.4 Sample
In this study, we decided to focus on Grade 11 learners, the first group of Further
Education and Training (FET) Mathematics and Mathematical Literacy learners
studying the new NCS (National Curriculum Statement) syllabus. The National
Senior certificate NATED 550 syllabi were being phased out and the last group of
learners studying this syllabus was in Grade 12. Mathematical Literacy was
introduced as a compulsory subject for learners who do not take Mathematics as a
subject.
A purposive sample of ten schools in the East London School District, Eastern Cape
Province, was identified on the basis of their performance. These were high
performing schools according to the definition of CDE (see section 3.3). It was
therefore appropriate to the researcher to investigate these specific schools. All ten
schools offered Mathematics as a subject (as opposed to only Mathematical Literacy)
and their class sizes in Mathematics and Mathematical Literacy were below the
national average (49: p1) (Howie, 2001) and the schools’ pass rates close to 100%.
3.5 Instrumentation 3.5.1 Development of the Instruments According to Roberts (2004), an existing validated instrument may be modified or a
new one created if the researcher is unable to locate a satisfactory instrument that
adequately measures the study’s variables. Questionnaires were hence adapted from a
study “Improving the Teaching of Science and Technology in the New South Africa”
(Rochford, Sokopo & Kleinsmith, 1997). This questionnaire was selected as the
research was conducted in science education in Cape Town, South Africa, and was
31
the most appropriate the researcher could locate. Changes were made to satisfy the
aims of the current research.
The researcher chose to insert questions on base data of learners surveyed. This
would enable comparisons between subjects surveyed in the current study and any
future studies done in this or other areas of the country and improve the research base
on supplementary instruction in Mathematics/Mathematical Literacy in South Africa.
A study done by the Human Sciences Research Council (HSRC) in 2004 pointed out
vast differences amongst groups of learners in the educational landscape of South
Africa, e.g. with respect to mean age of learners, gender division and performance.
Statistically significant differences in achievement levels between groups were also
found in a study done by Rochford, Baxen & Gilmour (2001) in the Western Cape.
The researcher therefore included questions on age, gender and performance to
identify and categorise the population in this particular study.
A couple of factors were identified that possibly motivate learners to seek
supplementary tuition in Mathematics/Mathematical Literacy. These were: the
satisfaction level of the learners and their perceptions of the importance of a good
pass in the subject. If a learner is dissatisfied with his/her current mark in
Mathematics/ Mathematical Literacy, then it stands to reason that such a learner might
seek supplementary tuition in the subject, especially if the subject is regarded as
important for future opportunities. Baker et al (2001: p3) argues that the enrichment
strategy dominates in systems where there is intense competition for future
educational opportunities accompanied by what he calls “tight linkages” between
academic performance and later life opportunities. The two questions on satisfaction
32
levels and the importance of a good pass in Mathematics/Mathematical Literacy were
inserted in order to probe the learners’ perceptions of these “tight linkages”.
Furthermore, the researcher attempted to establish whether any differences existed
between Mathematics and Mathematical Literacy with regards to seeking
supplementary tuition in these subjects. It was assumed that the two groups of
learners possibly differed in some respects and a question was therefore included to
establish the proportion of learners taking the respective subjects, and the analysis of
data was based on these two groups.
Two questionnaires were prepared on supplementary tuition in
Mathematics/Mathematical Literacy, one for learners and the other for teachers. The
section on vacation tuition was added since the researcher is aware that private and
public initiatives are run during the school holidays and over the weekends. Some of
these programs are extensive, and involve learners for more hours than a well
functioning school would per annum (CDE, 2004: p156).
The questionnaires were in English, the medium of instruction at all the targeted
schools. The first questionnaire was a learner questionnaire consisting of two parts.
The first part had three sections: section one was for the base data of the learners and
had to be completed by all the learners surveyed. The second section was to be
completed by learners who had either received supplementary tuition in Mathematics
or Mathematical Literacy during 2007, or attended vacation school in Mathematics or
Mathematical Literacy during 2007. The third section was to be completed by learners
who had not received supplementary tuition in 2007. The second part of the learner
questionnaire elicited reasons for unsatisfactory performance in Mathematics or
33
Mathematical Literacy, and had to be completed by all learners who were dissatisfied
with their performance in Mathematics or Mathematical Literacy. Fifteen possible
causes of unsatisfactory performance were listed and space was provided for reasons
other than those mentioned (see Appendix A).
The second questionnaire was a teacher questionnaire for teachers of Grades 10, 11
and 12 Mathematics and/or Mathematical Literacy. This questionnaire also had two
parts. The first part consisted of two sections, the first being the base data of the
teachers and the second explored the problem that some teachers apparently struggle
to complete the syllabus in the allocated class time. An attempt was made to elicit
teachers’ views on the length of the various mathematics syllabi that they teach, the
steps that they take to overcome possible time-constraints and their perspectives on
the different forms of supplementary tuition. One of the questions was whether it is
possible to effectively cover the respective mathematics syllabi within the allocated
school hours, or whether lessons had to be scheduled after hours with or without
compensation to the teacher.
Part two of the questionnaire drew the teachers’ opinion on possible reasons for
unsatisfactory performance in Mathematics and Mathematical Literacy. Open-ended
questions made provision for teachers to provide other reasons than the ones
mentioned in the questionnaire (see Appendix B)
Both these questionnaires were revised by mathematics teachers and lecturers before
they were distributed. They were used in the initial pilot study, and thereafter changes
were made to improve the questionnaires.
34
3.5.2 Pilot study
A pilot study conducted in 2005 at a high performing, urban secondary school in the
East London school district, revealed that a proportion of the learners did receive
supplementary tuition in Mathematics. From the approximately one hundred Grade 12
learners surveyed, almost two-thirds of the learners were receiving, or had at one
stage received, supplementary tuition in Mathematics. However, the subjects surveyed
in the pilot study took Mathematics at the Higher Grade or at the Standard Grade, and
Mathematical Literacy was not yet introduced as a subject. Grade 12 learners were
used in the pilot study for the following reasons:
i) If Grade 11 users were used, it may happen that some learners have to repeat
the class and this may lead to such learners taking part in both the main and
pilot studies.
ii) The study was more concerned with exploring and evaluating supplementary
tuition rather than dealing with cognitive or other similar factors that
somehow can be influenced by the grade of the learners.
3.5.3 Validity and reliability of instruments Since the teachers at the school surveyed indicated that time was at a premium, an
attempt was made by the researcher to improve and shorten the subsequent
questionnaires by grouping together questions. Davis and Venkatesh (1996) have
suggested that grouping together questions may improve the quality of the measures
and Budd (1987) asserts that it increases reliability. Another factor that increases the
validity of the instrument used is the pilot study that was conducted prior to the
research.
35
3.5.3.1 Validity
In addition to piloting the questionnaires, face validity was used to determine their
appropriateness for the purpose of the study. They were given to other mathematics
teachers in the district to comment on. They suggested the following changes on the
questionnaires for them to be appropriate for the purpose of the study:
i. Many questions were initially open-ended. The teachers advised to change
these and offered options to include in the questions. The questions were
then grouped together and the questionnaires divided up into sections in
order to shorten the time required to complete the questionnaires. Learners
had to choose between sections, depending on whether they were currently
taking supplementary tuition or not.
ii. It was also decided, for a variety of reasons, to limit the research to
supplementary tuition taken in 2007. A question on the cost of
supplementary tuition was discarded, when teachers pointed out that some
learners might give unreliable information.
3.5.3.2 Reliability
The reliability of the questionnaires was determined by comparing the results yielded
in both the pilot and main studies to establish any consistency. It turned out that the
respective responses of learners and teachers in the two studies were comparable.
Hence it was concluded that the questionnaires were reliable.
3.5.3.3 Conclusion on the instruments
To ensure that the questionnaires would provide required data, they were first piloted
and then had their validity and reliability determined as in 3.5.3.2 and 3.5.3.3. Based
36
on the outcomes of the process, it was felt that the questionnaires were suitable for the
study.
3.6 Data collection
The schools were asked to provide the numbers of learners and classes in
Mathematics/ Mathematical Literacy in Grade 11. It is interesting to note that the ratio
of Mathematical Literacy learners (49.5%) almost equalled that of the Mathematics
learners (50.5%). The numbers were summarised as follows:
Mathematical Literacy
Mathematics
Totals
No of classes
27 (45%) 33 (55%) 60
Total number of Learners
674 (49.5%)
688 (50.5%)
1362
Hence a sample of 430 learners was drawn, taking into account the ratio of
Mathematics to Mathematical Literacy learners in the population. From each school, 2
classes were identified to be included in the study, one of Mathematics learners and
one of Mathematical Literacy learners. The ratios were as follows:
Mathematical
Literacy Mathematics
Totals
No of classes
9
10
19
Total number of Learners
211 (49.1%)
219 (50.9%)
430
One school was a Technical High School and did not offer Mathematical Literacy,
hence the slight deviation in the number of classes for Mathematical Literacy.
Another school eventually declined to take part in the study, citing a demanding
37
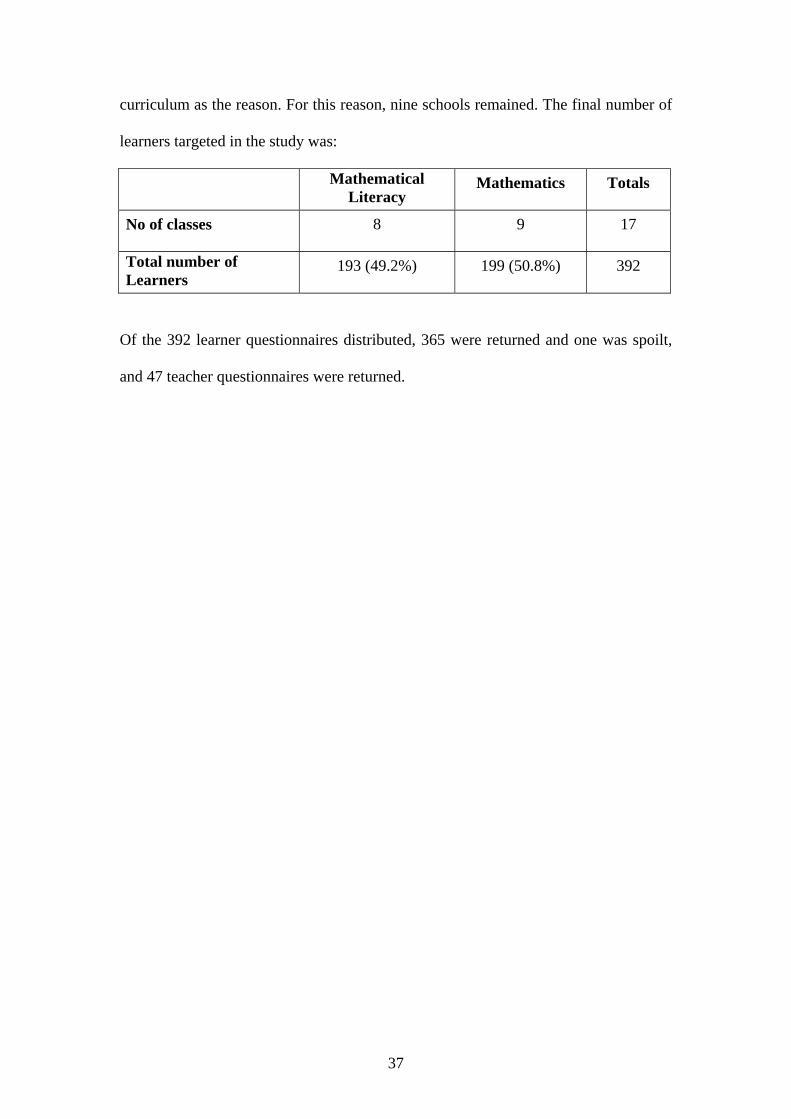
curriculum as the reason. For this reason, nine schools remained. The final number of
learners targeted in the study was:
Mathematical
Literacy Mathematics
Totals
No of classes
8
9
17
Total number of Learners
193 (49.2%)
199 (50.8%)
392
Of the 392 learner questionnaires distributed, 365 were returned and one was spoilt,
and 47 teacher questionnaires were returned.
38
CHAPTER 4
DATA ANALYSIS
The chapter presents the analysis of data from the learner and teacher questionnaires.
Data from each questionnaire is analysed first separately and then the overview of the
emerging data is provided.
4.1 The learners
In this section, the data is analysed in an attempt to answer the research questions.
Before that is done, assumptions, linked to each research question, are discussed as
well as focus on in order to seek answers to the research questions.
i) Why do learners take or not take supplementary tuition?
Three assumptions were made. Firstly, it was assumed that most of the learners who
take supplementary tuition, are dissatisfied with their performance in mathematics.
The presumed dissatisfaction could have many causes, e.g. ineffective or sub-standard
teaching, big classes, learners who are over-committed in other areas, long syllabi,
lack of resources, etc. These avenues were explored. Secondly, it was also assumed
that learners have high expectations of their performance in mathematics, possibly
because of the enrichment strategy. Thirdly, it was assumed that some learners and/or
teachers may view the formal allocation of school time for mathematics as
inadequate. Data on these problems were gathered and analysed.
ii) What is the nature of the supplementary tuition offered?
Here we investigated the amount of time spent on supplementary tuition, and whether
it was term time or holiday time too. We also probed the prevalence of model exam
papers in supplementary tuition.
iii) Who takes supplementary tuition?
39
Here we looked at gender and age, and attempted to compare the Mathematics
learners to those who take Mathematical Literacy as a subject.
4.1.1 Gender, age and performance
A total of 364 learners completed the questionnaires. More than half (53%) of the
learners took Mathematics as a subject, whereas 47% took Mathematical Literacy as a
subject. The gender division was almost even: 47% of the learners were male and
53% were female. Of the 194 learners who took Mathematical Literacy as a subject,
97 (50%) were male and 97 were female. Of the 170 learners who took Mathematics
as a subject, 75 (44%) were male and 95 (56%) were female. The majority (93%) of
the learners were in the 16 to 17 year age group. The Mathematics learners’ ages
ranged from 15 to 18 whereas those in the Mathematical Literacy group ranged from
16 to 19. The mean age of the learners who took Mathematics as a subject, was
significantly lower than the mean age of the Mathematical Literacy learners (t = -2.87,
d.f. = 360, p = 0.004, d = 0.30). The proportion of learners who indicated that they
achieved more than 40% for Mathematics/Mathematical Literacy, dropped from 92%
in December 2006, to 82% in June 2007.
4.1.2 Satisfaction levels Baker et al (2001: p9) identified the remedial strategy as the dominant reason for
taking supplementary tuition in South Africa. Learners’ satisfaction levels with their
current performance and their perceptions of the importance of the subject for their
future, were therefore under the spotlight. More learners (48%) were dissatisfied or
very dissatisfied with their Mathematics/Mathematical Literacy marks than those
satisfied or very satisfied (31%). There was no significant difference in satisfaction
levels of Mathematics and Mathematical Literacy learners (t = -0.84, d.f. = 359, p =
40
0.399). The vast majority of learners (90%) regard a good pass in Mathematics
/Mathematical Literacy as important for their future. It was noted that a slightly bigger
proportion of Mathematical Literacy learners regard the subject as more important for
their future (91% compare to 90% of Mathematics learners), but the difference was
not significant (t = -0.84, d.f. = 359, p = 0.399).
Learners in general were not satisfied with their current mark in Mathematics - only
30% indicated that they were satisfied with their current mark (with almost no
difference between Mathematics and Mathematical Literacy), while 48% indicated
that they were not satisfied. The level of dissatisfaction was slightly higher amongst
Mathematics learners of whom 51% were dissatisfied with their mark as opposed to
45% of Mathematical Literacy learners. One apparent reason related to the
dissatisfaction, was the aspiration to meet entrance requirements for university
courses such as engineering and medicine (see section 4.2.3). Figure 1 below provides
a graphical summary of the satisfaction level of the learners.
Figure 1: Satisfaction levels
Satisfaction Levels for Mathematics & Mathematical Literacy
0%10% 20% 30% 40% 50% 60%
MATHEMATICS MATHEMATICAL LITERACY
Total
Satisfied Not satisfiedUnsure
41
In summary, the data show that in total there is a fair number (about 48%) of learners
who are not satisfied with their performance in Mathematics/Mathematical Literacy as
compared to 30% of learners who are satisfied.
4.1.3 The importance of a good pass in Mathematics/Mathematical Literacy The majority (90%) of learners regarded their Mathematics/Mathematical Literacy
mark as extremely important for their future. Only 3% regarded the subject as not
important for their future. A slightly higher proportion of Mathematical Literacy
learners regarded the subject as important for their future, although this difference
was not significant.
Figure 2: The importance of a good Mathematics/Mathematical Literacy pass
From the data it is clear that a large number (about 90%) of learners consider a good
pass in Mathematics/Mathematical Literacy important.
4.1.4 More school time for Mathematics/Mathematical Literacy
A total of 42% of the learners wanted more school time allocated to the subject and
38% of the learners who were dissatisfied with their marks, indicated that the syllabus
Importance of a good pass inMathematics/Mathematical Literacy
0 20406080
100
MATHEMATICS MATHEMATICAL LITERACY
Total
ImportantNot importantNot sure
42
was too long. A substantial number of the learners who were dissatisfied with their
marks (36% of Mathematics and 38% of Mathematical Literacy learners), were
neutral or undecided about both issues. There was a significant difference between
Mathematics and Mathematical Literacy learners regarding school time. Almost half
(49%) of Mathematics learners wanted more school time for Mathematics, whereas
only 32% of Mathematical Literacy learners indicated the same need. Only 21% of
the learners did not want more school time devoted to Mathematics/Mathematical
Literacy. One apparent reason why learners were unsure about this issue is the
question about how extra time for the subject would be afforded: would this lead to a
longer school day or would it be detrimental to their other subjects? Learners who feel
over-committed may be experiencing much pressure already, and would not want it to
increase. More time spent on Mathematics/Mathematical Literacy could be seen as
time taken away from other, equally demanding and important subjects.
Figure 3: More school time for Mathematics?
More school time for Mathematics/Mathematical Literacy
0%10%20%30%40%50%60%
Mathematics Mathematical Literacy
Total
YesNoUnsure
It is evident from the data that 42% of learners are not happy with the amount of time
allocated to Mathematics/Mathematical Literacy as compared to 20% who seem
43
happy with the time spent on mathematics. It is also interesting to note that 38% of
learners were unsure regarding the adequacy of time spent on mathematics.
4.1.5 Supplementary tuition
i) Which proportion of learners receives supplementary tuition?
Supplementary tuition is mostly taken by Mathematics learners. Of the 21% (76)
respondents who indicated that they received supplementary tuition in 2007, only 11
of the 159 Mathematical Literacy learners (6%) had supplementary tuition, compared
to 65 of the 129 Mathematics learners (34%). Only 1% of the learners who completed
this section attended vacation school.
ii) The length of time spent on supplementary tuition
Learners took supplementary tuition for 1.67 hours per week, for an average of 12.9
weeks. The mean number of hours spent on supplementary tuition from the beginning
of the year up to mid-September, when the survey was done, was 18.23 hours.
iii) Model/former examination papers
Although the syllabi are new, and previous examination papers are therefore not
available, Mathematics learners should be able to study certain sections from previous
papers of the former syllabus. The Department of Education has also made model
examination papers and memoranda for Mathematics and Mathematical Literacy
available on their website. The majority of the 21% of learners who took
supplementary tuition in 2007 studied previous examination papers during
supplementary tuition (64%). However, the number of papers that these learners will
have studied before the end of the year, is surprisingly low (mean of 0.59 papers).
Almost half of the learners who received supplementary tuition indicated that they
will have studied between 2 and 9 papers before the end of this year.
44
iv) Perceptions about different forms of supplementary tuition
In a study on academic achievement in reading and mathematics, Jacob & Lefgren
(2002) found evidence of substantial positive effects of summer school that remained
considerable two years after completing the program. In a study on computer
software, Hartrum, Mallary and Foley (1989) stated that when one is dealing with
human perceptions, there is no substitute for asking the user how he or she likes the
software. The same could be said of supplementary tuition, since it is assumed that
learners would not receive supplementary tuition if they thought it had no value. All
three different types of supplementary tuition, namely private tuition (81%), vacation
school (54%) and model/former examination papers (83%), were judged by the
respondents who completed this section, as valuable tools to obtain or maintain good
marks in the subject. Of the three forms of supplementary tuition mentioned, learners
valued private tuition and examination papers the highest – 81% and 83% of the
learners rated their respective effects as positive. The idea of attending vacation
school was not as popular. Very few vacation schools were being offered in the area
and this could be the reason why a proportion of the learners (38%) were unsure about
the effects that vacation school would have on their marks. Some learners also
indicated that they would not attend because they needed a break during the holidays.
Very few of the learners viewed the respective forms of supplementary tuition in a
negative light (2%, 8% and 3% for private tuition, vacation school and previous
examination papers respectively). Mathematics learners were significantly more
positive about all three forms of supplementary tuition than the Mathematical Literacy
learners. For private tuition, the statistics were: (t = 5.27, d.f. = 288, p < 0.0005;
,31.292 =χ d.f. = 2, p < 0.0005, V = 0.32); for vacation school: (t = 2.12, d.f. = 270,
45
p = 0.035; 81.112 =χ d.f. = 2, p =0.003, V = 0.21 ) and for examination papers (t =
5.31, d.f. = 320, p < 0.0005; ,55.152 =χ d.f. = 2, p < 0.0005, V = 0.22).
v) Reasons given by learners who have not received private tuition in 2007
Most (55% or 148 of the 269) of the learners who did not receive private tuition in
2007, indicated that they did not need it. This number seems to correspond with the
satisfaction levels tested in part one of the questionnaire, with 31% of the learners
indicating that they were satisfied or very satisfied, and 21% choosing the neutral
option. Therefore, the main reason amongst the learners for not having taken private
tuition in Mathematics/Mathematical Literacy in 2007, seems to be that the learners
coped without these, which supports the remedial theory put forward by Baker et al
(see section 3.5.1). Fewer Mathematics (45%) than Mathematical Literacy learners
(64%) indicated that they did not need private tuition. Of the learners who do not get
private tuition, 56 (21%) indicated that they could not afford private tuition, with
more Mathematical Literacy (24%) than Mathematics learners (17%) indicating that
finances were a problem. Other reasons listed for not taking private tuition were;
being too busy (42%), transport problems (19%), inability to find a private tutor
(16%) and having an excellent, experienced teacher at school (5.6%). Learners
provided the following reasons for not receiving private tuition:
• Many of the private tutors are full
• Too much homework in other subjects
• A family member is a maths teacher and helps me
• I don't want supplementary tuition
• I did take extra lessons but the teacher left
• I get help from teachers before examinations
• Most extra maths teachers don't want to teach Maths Literacy
46
• I have never been motivated or encouraged to attend extra maths or vacation
school
• It never crossed my mind
• It is the same as school
Each reason was mentioned by less than one percent of the learners who completed
this section.
In summary, the data show that supplementary tuition is much more popular amongst
Mathematics learners (about 34%) than Mathematical Literacy learners (about 6%).
Of the three forms of supplementary tuition (i.e. private tuition, vacation school and
revision of model or former examination question papers), revision of examination
papers was most preferred (about 83%) followed by private tuition at 81% and lastly
vacation school. Regardless of the high preference for supplementary tuition there
were reasons advanced by some learners who could not participate in this form of
supplementary tuition.
4.1.6 Reasons for unsatisfactory performance
i) The nature of the subject
A small proportion of the learners indicated that the subject was too difficult for them
(11% in total, 14% of Mathematics learners and only 7% of Mathematical Literacy
learners). The difference between the two groups is significant (t = 4.41, d.f. = 282, p
< 0.0005, d = 0.52; ,41.192 =χ d.f. = 2, p < 0.0005, V = 0.26). The accumulative
nature of the subject seems to cause problems, more so for Mathematics learners:
although 42% of the learners had problems in previous years, 47% of Mathematics
learners had difficulties compared to 38% of Mathematical Literacy learners. The
difference is notable (t = 2.74, d.f. = 281, p = 0.007, d = 0.33; ,31.292 =χ d.f. = 2, p
47
< 0.0005, V = 0.32). More than half of the learners, who completed this section,
acknowledged that they did not work hard enough at the subject (51%). There was no
significant difference between the two groups.
ii) The time spent on the subject
There was a significant difference in how the two groups viewed the length of the
respective syllabi. Almost half (47%) of the Mathematics learners indicated that the
syllabus was too long, whereas less than a third (27%) of the Mathematical Literacy
learners showed a similar opinion (t = 4.04, d.f. = 280, p < 0.0005, d = 0.48;
,21.152 =χ d.f. = 2, p < 0.0005, V = 0.23).
Almost a quarter of the learners (23%) who completed this section, indicated that the
school time was insufficient. Of these, more Mathematics learners (28%) were
dissatisfied with the amount of school time than Mathematical Literacy learners
(17%). Again, this difference was significant (t = 2.54, d.f. = 278, p = 0.011, d =
0.31).
A third (33%) of the learners, 37% of the Mathematics group versus 29% of the
Mathematical Literacy group, acknowledged that extra-mural activities had a negative
impact on their performance in Mathematics/Mathematical Literacy. There was a
marked difference between the two groups (t = 2.54, d.f. = 278, p = 0.011, d =
0.31; ,41.62 =χ d.f. = 2, p < 0.040, V = 0.15). More than a third of the learners (36%)
who answered this section, indicated that responsibilities at home affected their
performance.
48
iii) Factors related to the teaching – learners’ perspective
Only 11% of learners indicated that their teacher did not explain clearly and that they
did not receive individual help from the teacher in class. An even smaller proportion
(7%) complained that their teacher was often away, or out of class.
iv) The need for individual attention
A substantial proportion (42%) of the learners (48% of Mathematical Literacy and
38% of Mathematics learners) who were dissatisfied with their marks, indicated that
the fact that they do not get help after school hours, played a role in their
unsatisfactory performance. The difference was however not significant (t = -1.30, d.f.
= 277, p = 0.196). Only 11% of learners indicated that they did not receive individual
help from the teacher in class but many others (29%) indicated that they do not know
where they go wrong when solving the problems; they only know that the answer is
wrong. Self-consciousness/shyness was problematic for 20% of the learners who did
not want to ask questions in the class.
v) Lack of resources
These high-performing schools do not have a problem with resources, according to
the learners. Only 11% of learners indicated that their classes were too big and even
fewer (9%) did not have a text book. In a pilot study done at one of these schools two
years ago, the average Mathematics grade 12 class size was 27, the average
Mathematics grade 11 class size was 30 and the average grade 10 class size was 29.
The national average class size for Grade 8 Mathematics was measured by the
TIMMS-R study to be 50 (Howie, 1999, p19). Although the average class size quoted
by government was 38, Howie et al (2001) found that the average class size for
mathematics was 49 in 2001.
49
There is clearly a need amongst learners for previous examination papers with
solutions (30%). This need was more pronounced amongst the Mathematical Literacy
group (38%), presumably because it is a new subject.
From the above data it is clear that there were reasons why learners were performing
poorly in Mathematics/Mathematical Literacy; hence they felt that there was a need to
take supplementary tuition.
4.2 The teachers Here we attempted to probe the teachers’ contribution to the problem at hand: Why do
learners take or not take supplementary tuition? Data were gathered in an attempt to
examine a few theories, namely that learners seek supplementary tuition because
• the teaching is inadequate, for a variety of reasons
• teachers struggle to complete the syllabi in the allocated class time
• of other reasons, e.g. the nature of the subject, socially overcommitted
learners, lack of resources, etc.
4.2.1 Gender, age, qualifications and experience
Of the 47 teachers who completed questionnaires, 17 (36%) were male and 30 (64%)
were female. The average age of the teachers was 42.2 years (SD = 10.3) which is
higher than the national average. According to the TIMMS-R report, pupils taught by
mathematics and science teachers older than 40 years, achieved better scores in these
subjects (Howie, 1999).
The teachers, who took part in this study, were exceptionally well qualified in
Mathematics compared to the national average. The majority (91%) had taken
50
Mathematics at university level (Mathematics I, II or III) or had a diploma in
Mathematics. No less than 18% had a post-graduate qualification in Mathematics.
In addition to their excellent qualifications, most were also experienced: 44% had
been teaching for longer than 20 years and 79% for 9 years or longer. Only 21% had
fewer than 9 years experience. Only 36% of the teachers were male. This is a
significant deviation from the national figure of 61% measured a few years ago
(Howie, 1999: p19). The data show that learners, regardless of their poor performance
in Mathematics/Mathematical Literacy (see section 4.1.6), were taught by qualified
and experienced teachers.
4.2.2 Completing the syllabus in time
According to the National Curriculum Statement (2005), five hours per week is
allocated to Mathematics and Mathematical Literacy. The number of school weeks
available for contact time, is estimated at 33 to 35, which allows approximately 150
hours per grade per school year for each of these subjects. The teaching time per
school week is set at 29.5 hours (ibid.).
It seems as if teachers struggle with the length of the new Mathematics syllabus in
Grades 10 and 11. A total of 92% of those teaching Grade 10 Mathematics, had
problems completing the syllabus on time. These problems were regarded as moderate
to severe by 50% of the teachers. Although a smaller proportion (83%) indicated
having problems with the Grade 11 syllabus, the problems seemed to be more
pronounced, with 67% indicating that their problems were moderate to severe.
Compared to the new syllabus, teachers seem to have had fewer problems with the old
syllabus in Grade 12. Only 29% indicated having any difficulties with the length of
the syllabus, and only 10% indicated that these problems were moderate. Fewer
51
problems were experienced with the Mathematical Literacy syllabus. Only 6% of the
Grade 10 and Grade 11 teachers indicated that they experienced moderate problems
completing the syllabus, and none had serious problems. From the data it is clear that
completing the new Mathematics syllabus in time is generally a problem.
4.2.3 Strategies followed in order to complete the syllabus in time
Most teachers (87%) experienced difficulties completing the new Grade 10 and Grade
11 Mathematics syllabi despite their qualifications and experience. A substantial
portion of teachers (43%) felt compelled to work fast despite the fact that some of the
learners could not keep up. About the same number of teachers (47%) used school
time allocated to other activities for Mathematics, e.g. assembly time. A pilot study
done 2 years prior, revealed that as many as 25% of the teachers had extra
Mathematics periods scheduled on the timetable. The responsibility of completing the
syllabus rests squarely on the shoulders of the teachers, as not a single teacher
expected learners to do any of the work as self-study.
A majority (91%) of teachers surveyed, gave extra help to learners after school hours,
40% on a regular basis, and 51% according to the learners’ needs. Only 24% received
any remuneration for their efforts. These lessons are taught to catch up in some cases,
but are also taught in an effort to improve learners’ understanding of the work and
hence also their performance. Some of these lessons are taught during the afternoons
and some in the evenings. Some are even taught on Sunday afternoons from 2 to 5.
One school has a Mathematics study weekend. The learners and teachers spend a
weekend at a resort, studying Mathematics (personal communication). The data reveal
that teachers devise means to catch up by arranging extra help for learners.
52
4.2.4 Reasons for unsatisfactory performance
i) The nature of the subject
Most teachers (93%) feel that learners lacking the necessary ability, should not take
Mathematics as a subject. The majority of teachers (66%) indicated that learners who
lack the ability, should not be forced to take Mathematical Literacy as a subject.
Misconceptions carried over from previous years, contributed to difficulties
experienced in the senior years: 86% of the teachers thought that this was a problem
for Mathematics learners (45% of learners who were dissatisfied with their marks,
agreed) and 66% of the teachers thought that it played a role in the unsatisfactory
performance of learners in Mathematical Literacy (38% of the learners who were
dissatisfied with their marks, agreed). The teachers obviously feel much stronger
about these issues than the learners.
ii) The time spent on the subject
Teachers (73%) were of the opinion that learners were over-committed socially and
academically in general and hence regarded the learners’ commitment to mathematics
as insufficient (87%). A notably smaller proportion of learners were of the same
opinion; 34% and 36% regarded themselves as over-committed at school and at home
respectively, but seemed to agree that they did not work hard enough at the subject
(53%). This supports the finding by the TIMMS study that 71-96% of students in all
countries agree that hard work is required to do well in Mathematics (Ireson, 2004).
iii) Factors related to the teaching – teachers’ perspective
As mentioned before, the teachers surveyed, were exceptionally well-qualified and
experienced, and older than the national average. A commendable work ethic existed
in all the schools surveyed. Few teachers were guilty of not being in class when they
53
should be – only 5% of teachers indicated that they had too many other
responsibilities at school and that they were often out of class. None were neutral
about this issue. The learners confirmed the view: only 4% of the learners indicated
that their teacher was often away or out of class. The teachers were also generally
satisfied with their teaching methods. Only 10% expressed frustration with their
inability to explain the work to the learners. Not surprisingly, none of the teachers
indicated that they were not qualified enough and only 5% indicated that they were
not experienced enough.
iv) Lack of resources
The teachers were obviously more concerned with class size than the learners: a
substantial proportion (29%) of the teachers expressed frustration with big classes,
compared to the learners (11%). Of the teachers, 24% indicated that they did not have
enough class time to assist learners individually, compared to 11% of the learners who
indicated that they did not get individual help. It is interesting that 25% of the teachers
indicated lack of a text book as a contributory factor to unsatisfactory performance,
whereas only 9% of the learners agreed. Perhaps learners used it as a convenient
excuse to procrastinate.
Other reasons for poor performance that teachers added to the list provided, were: • Learners struggle with self-motivation.
• I have a class who have switched from Maths to Maths Literacy after the June
examination, so I only have 6 months to complete the syllabus.
• Parents force children to take Maths.
• Pupils have unrealistically high expectations, e.g. all want to be doctors,
engineers, etc.
• Unsatisfactory marks are condoned in previous grades. Learners have not
mastered basic skills, but passed the subject.
54
• Learners do not prioritise.
• Learners do not realise the importance of Maths.
• There is too much emphasis on projects, investigations and group work in early
grades up to grade 9. Pupils are not being drilled in basic operations and
principles. This is especially problematic in grade 9 where learners have 9
demanding subjects.
• The pupils have poorly developed skills to reason logically when they start high
school.
• Outcomes Based Education (OBE) has taught pupils that they can pass with very
little Maths knowledge. OBE develops short term memory but does nothing to
develop long term knowledge and skills. It has also taught them how to 'beat the
system' and it does not really educate them. It encourages laziness.
Each of these reasons was mentioned by fewer than 2% of the respondents.
It is evident from the data that teachers doubted the ability of their learners to study
Mathematics/Mathematical Literacy, and also felt that learners carried over
misconceptions from the lower classes. There was also the issue of lack of
commitment by learners which the teachers expressed some concern about. All these
factors appear to be adversely affecting the performance of the learners. Otherwise
teaching and learning resources and the competency of teachers were not thought to
have any negative effect on learner performance.
4.3 Summary of the data
This section provides a summary of the data derived from the learners and the
teachers, respectively. The summary will hopefully help draw an overall picture of
what has emerged from the data with respect to the problem being investigated.
55
4.3.1 Summary of the data from the learners
More than 50% of the learners surveyed, took Mathematics as a subject, and the rest
took Mathematical Literacy. Less than a third of the learners were satisfied with their
marks in the respective subject. More than 90% of learners regarded the subject as
very important for their future. No significant difference between the two groups
(Mathematics and Mathematical Literacy) was reported regarding this issue.
More than half of the learners, who were dissatisfied with their marks, acknowledged
that they did not work hard enough at the subject (51%). Almost half (47%) of the
learners indicated that their syllabus was too long, whereas less than a third (27%) of
the Mathematical Literacy learners held the same point of view. Although almost 50%
of the learners who were dissatisfied with their marks thought that the syllabus was
too long, only about half of these wanted more school time for the subject.
Significantly, more Mathematics learners required more school time than
Mathematical Literacy learners.
A third of the group of learners who were dissatisfied with their marks, acknowledged
that extra-mural activities had a negative impact on their performance in
Mathematics/Mathematical Literacy, and more than a third of these learners indicated
that responsibilities at home affected their performance. Only 11% of learners
indicated that their teacher did not explain clearly and that they did not receive
individual help from the teacher in class. An even smaller proportion (7%)
complained that their teacher was often away or out of class.
A substantial proportion (42%) of the group of learners who were dissatisfied with
their marks, indicated that the lack of help after school hours, played a role. Only 11%
56
of learners indicated that their classes were too big and even fewer (9%) did not have
a text book. There was, however a need amongst learners for previous examination
papers with solutions (30%). This need was more pronounced amongst the
Mathematical Literacy group (38%) (see section 4.1.6 (v) “Lack of resources”).
A total of 21% of learners, the majority of whom were Mathematics learners, received
private tuition in 2007 and only 1% attended vacation school. These figures are lower
than expected. There are a number of possible reasons for this discrepancy; a few
learners surveyed in this study, had received private tuition in the past and stopped
because one of the major service providers left town (personal communication).
A total of 55% of the 269 learners who did not receive private tuition in 2007,
indicated that they did not need it and 21% indicated that they could not afford private
tuition. More Mathematical Literacy than Mathematics learners pointed out that
finances were a problem.
The learners would like more school time allocated to mathematics. Almost half
(49%) of Mathematics learners wanted more school time for the subject, whereas only
about a third of Mathematical Literacy learners indicated the same desire.
4.3.2 Summary of the data from the teachers
The teachers in this study were older than the national average age, well-qualified and
experienced. A commendable work ethic exists in all the schools surveyed. In
addition to their considerable qualifications, most were also very experienced.
Nevertheless, more than 80% of teachers teaching Grade 10 and 11 Mathematics, had
problems completing the syllabus on time. In contrast, only 6% of the Grade 10 and
Grade 11 Mathematical Literacy teachers indicated that they experienced problems
57
completing the syllabus. About half of the teachers (47%) used school time allocated
to other activities for Mathematics. The teachers are solely responsible for completing
the syllabus and not one teacher considered self-study as a part or possible solution.
The majority of teachers (91%) surveyed, gave extra help to learners after school
hours. Only 24% received any remuneration for their efforts.
Most teachers (93%) felt that learners who lack the necessary aptitude should not take
Mathematics as a subject. The majority of teachers (66%) indicated that learners who
lack this ability should not be forced to take Mathematical Literacy as a subject.
Misconceptions carried over from previous years contributed to difficulties
experienced in the senior years, and 86% of the teachers thought that this was a
problem for Mathematics learners.
Notably more teachers (73%) than learners (34%) were of the opinion that learners
are over-committed socially and academically, resulting in lack of commitment to
Mathematics (see section 2.4.2 (ii) “Time spent on the subject”).
4.4 Final remarks
Having analysed the data and seen what has emerged from the results, the focus now
turns to discussing the implications of these results and then drawing the related
conclusions with a view to presenting the impact of the study. All these are done in
the next chapter.
58
CHAPTER 5
SUMMARY, CONCLUSIONS AND RECOMMENDATIONS
5.1 Summary of the study This study explored and evaluated the prevalence of supplementary tuition in the East
London district in the Eastern Cape and attempted to answer the following questions:
• Why do learners take or not take supplementary tuition?
• What is the nature of the supplementary tuition offered?
• Who takes supplementary tuition?
A descriptive survey design was used to meet the research objectives. The population
targeted was 1 362 mathematics learners from 10 high-performing schools in the East
London School District in the Eastern Cape Province. The focus of the study was on
the first group of Grade 11 Mathematics and Mathematical Literacy learners, studying
the new NCS (National Curriculum Statement) syllabus.
Questionnaires were distributed to a sample of 392 learners and 47 teacher
questionnaires were returned. The questionnaires were made available in English
which is the medium of instruction at all the targeted schools.
5.1.1 Why do learners take supplementary tuition in mathematics?
The assumption was made that learners who take supplementary tuition in
mathematics, are dissatisfied with their performance in the subject. This assumption
seems to be supported by the data. The data showed that a fair number (about 48%) of
learners were not satisfied with their performance in Mathematics/Mathematical
Literacy as compared to 30% of learners who were. It was also assumed that learners
59
have high expectations of their performance in mathematics. The data seemed to
support this assumption, since a large number (about 90%) of learners considered a
good pass in Mathematics/Mathematical Literacy as important. A third assumption,
that some learners and/or teachers may view the formal allocation of school time to
mathematics as inadequate, was also supported by the data. A substantial number of
learners (42%) were not happy with the amount of school time allocated to
Mathematics/Mathematical Literacy as compared to 20% who seemed happy with the
time spent on mathematics. The data revealed that completing the new syllabus in
time was generally a problem, and that teachers devised means to catch up by
arranging extra help for learners.
It was also clear that there were reasons why learners were performing poorly in
Mathematics/Mathematical Literacy; hence they felt that there was a need to take
supplementary tuition. It was evident that teachers doubted the ability of their learners
to study Mathematics/Mathematical Literacy, and felt that learners carried over
misconceptions from the lower classes. Teachers also expressed some concern about
learners’ lack of commitment to mathematics. All these factors appear to be adversely
affecting the performance of the learners. Teaching and learning resources and the
competency of teachers were not considered to have any negative effect on learner
performance. The data showed that learners were taught by qualified and experienced
teachers.
60
5.1.2 What is the nature of the supplementary tuition offered?
Learners took supplementary tuition on average 1.67 hours per week. The mean
number of hours spent on supplementary tuition from the beginning of the year up to
mid-September, when the survey was done, was 18.23 hours.
Of the three forms of supplementary tuition (i.e. private tuition, vacation school and
revision of model or former examination question papers), revision of examination
papers was preferred (about 83%) followed by private tuition at 81% and lastly
vacation school.
5.1.3 Who takes supplementary tuition?
The data shows that supplementary tuition is much more popular amongst
Mathematics learners (about 34%) compared to Mathematical Literacy learners (about
6%). Furthermore supplementary tuition is preferred by poorly performing learners
and those who were not happy about the time allocated for
Mathematics/Mathematical Literacy in the school time-table.
5.2 Discussions
The study revealed that even though learners were taught by adequately qualified and
experienced teachers, they still saw a need to take supplementary tuition. This might
imply that the tuition given by the teachers during school hours is regarded as
inadequate for various reasons. The learners may need more time on task, as indicated
by the high proportion (50%) of Mathematics learners who wanted more school time
allocated to the subject. Already a substantial number of learners (34%) feel that they
are over-committed at school, but seemed to agree that they did not work hard enough
at Mathematics (53%). More learners might demand that extra time be allocated to
61
Mathematics if they knew it would not lead to further demands on their program in
general. One way of allocating more school time to Mathematics, is to reduce the
number of subjects in the scientific stream. This arrangement could also attract more
learners to the mathematics and science stream.
The need for supplementary tuition by learners, as evident in the study, vindicates an
argument presented in section 2.8, where it is mentioned that ‘learners get involved
[in supplementary tuition] for a variety of reasons’ (ibid.: p26). Furthermore, the
study has made an attempt to provide an idea of the percentage of participants in a
particular area of South Africa and this in a way makes a contribution towards
addressing the problem of quantifying supplementary tuition participation that Reddy
et al (2003) alluded to in section 2.8.
What also emerged from the study is that a significant percentage of learners (90%)
consider Mathematics/Mathematical Literacy important for their future careers. This
revelation implies that there are learners who are aware of the significant role of
Mathematics/Mathematical Literacy in certain careers and a good pass in one of these
areas is of utmost importance. Hence learners opt for supplementary tuition to help
them improve their performance. Perhaps, it is for this reason that Baker et al (2001)
argue that the need for supplementary tuition is informed by the importance that
learners attach to mathematics to gain access to a specific career (see section 2.6). On
the other hand, Smyth (2008) argues that participation in private tuition must be seen
in the context of the competitive examination system in operation. It is often difficult
to separate the two issues, and more research is required to determine the difference in
level of significance.
62
There were a high number of learners who felt that they needed supplementary tuition
but there were factors that impeded them (see section 4.1.6). This vindicates the point
that social, economic and other related issues will always have an impact on education
as discussed in sections 2.3 and 2.6. In addition it implies that the need for
supplementary tuition cannot be determined in isolation of non-educational factors.
This study seems to support the need for individual attention in Mathematics, since
42% of learners who were dissatisfied with their performance in the subject, blamed it
on lack of individual attention. According to Ireson (2004), learners value the one-on-
one attention that they get in supplementary tuition and see it as an opportunity to
increase understanding. This supports the argument presented in sections 2.6, 2.9 and
2.10. The implication of this point is that supplementary tuition affords learners
special attention.
It is also evident from the study that misconceptions carried over from previous years
were identified as problematic by learners and teachers alike. A high proportion of
teachers (86%) were of the opinion that misconceptions caused problems for senior
learners (see section 4.2.4). This supports the finding that South African learners
taking part in the TIMMS-R study were successfully distracted by questions testing
misconceptions (Howie, 1999: p11). It seems as if some learners seek one-on-one
tutoring in an attempt to address the problems caused by misconceptions, as discussed
in section 2.5. This implies that supplementary tuition is an option that could be taken
to deal with the misconceptions.
Revision of examination papers is preferred and closely followed by private tuition
with vacation tuition being the least popular. Of the learners who did not get private
tuition, 21% indicated that they could not afford it. It stands to reason that revision of
63
examination papers is popular because of its easy availability and the low cost
involved. Furthermore, most stationery stores in South Africa offer former
examination papers with worked solutions for sale at a reasonable price, and this type
of supplementary tuition is therefore within reach of more learners than the more
costly private tuition. The Department of Education has also made model exam papers
available through the media, e.g. the internet and newspapers, and this source is even
less expensive. Although most learners regarded vacation school as an effective
learning tool, few wished to attend. Learners perceived themselves to be
overcommitted academically (see section 4.1.6), and this may explain the negative
attitudes to vacation tuition. Learners clearly are of the opinion that they need a break
in their busy programme. The implication here is that learners would rather have a
type of supplementary tuition that does not encroach on their private time, hence the
more flexible option of working on model/former examination papers is highly
preferred.
Supplementary tuition is not only unique to learners in low performing schools, as
evident from this study. In section 2.3, it was argued that middle-class learners seek
supplementary tuition and in section 2.9 it was asserted that a majority of those who
receive private tutoring already perform well at the particular subjects. This study
seems to support both these notions. The schools sampled, are located in urban,
middle class areas, and the schools were all high-performing schools. Even so, a
substantial proportion of learners indicated a perceived need for supplementary
tuition. This contradicts the findings of studies by (Posner & Vandell, 1999; Macbeath
et al, 2001) that structured supplementary tuition is particularly beneficial for children
from disadvantaged backgrounds, having positive effects on their academic
64
achievement. It therefore implies that learners, regardless of the type of school they
attend, still see a need for supplementary tuition.
5.3 Conclusions
It is clear from this study that a proportion of learners seek supplementary tuition,
even though they attend high-performing schools and are taught by well-qualified and
committed teachers. The findings suggest that a few factors account for this need,
namely a perceived lack of sufficient school time for mathematics and learners’ desire
for more individual attention in the subject, possibly to overcome misconceptions.
Furthermore, the study showed that most learners regarded mathematics as important
for their future career and had a desire to improve their performance in the subject.
Frustration levels of learners and teachers alike should be viewed against this
background, since a high level of social and academic over-commitment of learners
was reported by both groups. This may also play a role in learners preferring revision
of examination papers to the two other forms of supplementary tuition investigated,
because of the more flexible nature of the former. Furthermore, revision of
examination papers is by far the cheapest option of the three, and will be the obvious
choice of the substantial proportion of learners who indicated that they could not
afford private tuition. These findings are indicative for the hypothesis that the number
of subjects in the scientific stream should be reduced.
It is evident from the study that supplementary tuition is not only confined to low
performing schools and schools with poorly qualified and/or inexperienced
mathematics teachers. Schools that took part in the study are high performing and also
have plausibly experienced and adequately qualified teachers. Yet some learners from
these schools still opted for supplementary tuition. It is therefore concluded that there
65
will always be other factors, besides the teacher factor, that make learners seek
supplementary tuition to enhance their performance.
5.4 Recommendations i) Institutionalisation of supplementary tuition
The study shows that supplementary tuition in mathematics is popular among learners
in high performing schools as they realise its importance for their future careers.
Given the fact that a pass in mathematics is an admission criterion for engineering,
medicine, technology, accounting, economics, actuarial science, and so forth, maybe
there is a need to institutionalise supplementary tuition as in Japan: Here they have
two sessions of mathematics daily. In the morning learners are taught new content and
later in the day the focus is on conceptual understanding, of what was taught earlier,
through much problem solving (Howie, 1999). It is therefore recommended that there
are supplementary tuition periods in the school time-table that afford learners to
improve on their conceptual understanding through problem solving and tutors should
be employed to facilitate these sessions. This recommendation will also address the
concern raised about the need for more mathematics time in the school time-table.
ii) Learning Support Materials (LSM) As mentioned in section 5.3, learners preferred revision of examination papers to the
other forms of supplementary tuition (i.e. private tuition and vacation classes). This is
not only the cheapest option, but was also recognised by the CDE as a vital factor in
improving mathematics education in South Africa (CDE, 2004: p18). It is therefore
recommended that former/model examination papers be made available to all
learners. The White Paper on the Organisation, Governance and Funding of Education
66
makes provision for the distribution of resources across disparate schools (Howie,
1999: p5). Although the Department of Education has made model examination
papers and memorandums available on their website, it is debatable whether all
learners have equal access to these.
iii) Financial aid for supplementary tuition
Financial aid can be used as a tool to fight inequity, as was done in Korea. In the early
1960s, Korean society consisted of a small minority of very rich people and a
majority of very poor people. Promising pupils were identified at an early stage and
granted support (Lee, 2002: p17). Financial aid for recipients from the rural areas was
more substantial than those allocated to learners from the urban areas. Thus education
played a major role in decreasing the gap in income between the poor and the rich
(ibid.). In similar vain, the CDE report recommends that all Grade 9 learners in South
Africa write an aptitude test and that financial aid be granted to deserving learners in
the scientific field of study. This grant could be used to seek supplementary tuition in
mathematics and/or science, or to attend a high-performing school.
5.5 Limitations of this study, validity and reliability
This particular study focused on learners from high-performing schools in the East
London district of the Eastern Cape. The findings can therefore only be generalised to
similar high-performing schools. In a CDE study of 13 high-performing schools in 6
provinces, it was found that these schools displayed similar characteristics (CDE,
2004: p142). It would therefore seem possible, and likely, that similar results would
be found when the study is replicated at other high-performing schools, which
supports its external validity.
67
There are many disadvantages associated with investigations which utilise
questionnaires; for example, do the respondents answer truthfully? Although the
questionnaires were completed anonymously, learners may have felt reluctant to
divulge the fact that they attend supplementary tuition in mathematics, in case it is
seen as a negative reflection on the teacher’s teaching ability. According to Ireson
(2004: p112) learners fear that teachers would regard it as criticism of their teaching
if learners admit to making use of supplementary tuition. Graham & Baker (1990)
assert that learners might be worried being labelled as “swots” or “nerds”, or that
their peers might interpret it as a sign of inferior ability if they admit to receiving
supplementary tuition.
Learners might also have supplied unreliable information with regard to their marks in
December 2006, because of the time period which had elapsed since then. No control
measures were in place to check the learners’ current marks with the school records,
and these marks could very well be disputed, although the learners had nothing to
gain by supplying incorrect information.
Only learners who received supplementary tuition during 2007 completed section B
of the learner questionnaire. Question 4 of this section attempted to elicit information
on worked examination papers. In retrospect, it would have been more informative
had all learners answered this particular question.
Moloi (2000) found that learners from high socio-economic strata achieved higher
levels of competence in mathematics than their counterparts with low socio-economic
status. If socio-economic factors substantially influence learners’ decision to arrange
privation tuition, it could have a negative influence on the external validity of this
study. If the socio-economic conditions in another part of the country differ from
68
those in East London, the same study repeated in that region, may yield different
results, e.g. in more affluent regions, more learners may be able to afford
supplementary tuition.
5.6 Further possible study 5.6.1 The prevalence of supplementary tuition in Grade 12
This study found that the proportion of Grade 11 learners who received
supplementary tuition in mathematics, was unexpectedly low, compared to the results
of previous studies Further studies should look into what proportion of learners
receives supplementary tuition in Grade 12, since Baker alluded to the fact more
learners may get tutored in their last school year (see section 1.3).
5.6.2 Reduction of the number of subjects in the scientific stream
Since 80% of teachers surveyed struggled to complete the new NCS Grade 10 & 11
Mathematics curriculum in the allocated school time and learners and teachers
complained about a perceived general over-commitment of learners, researchers
should investigate the viability of reducing the number of subjects in the scientific
stream.
5.6.3 Investigate the effects of model/former examination papers on
performance
According to this study, both teachers and learners consider revision of examination
papers as an important tool to learn mathematics. Research should be conducted to
determine whether there is a significant difference in performance between learners
who have access to model/former examination papers with worked answers, and
learners who do not. This is by far the cheapest form of supplementary tuition and if
found to be effective, could be widely distributed.
69
5.6.4 Where have all the teachers gone?
Research should also be utilised to determine why such a small proportion (16%) of
mathematics teachers in South Africa is over the age of 40 (Howie, 1999: p19). Many
of these teachers could be active in the shadow education system and may be
persuaded to return to the profession.
5.6.5 Investigate the effects of supplementary tuition
More research is needed on the effects of supplementary tuition on the learners’
academic achievements and on the impact of the shadow system on the mainstream
system (Bray, 1999: p87). The shadow system, because of its very nature, is a
notoriously difficult system to research. Numerous variables may affect learners’
performance, and these are difficult to isolate from supplementary tuition. Reasonably
one would expect supplementary tuition to have a positive effect on the learners’
performance, but research has not yet been able to demonstrate a definite, positive
correlation.
70
Appendices
PAGE
1. Appendix A: Questionnaire for Grade 11 Learners:
Supplementary Tuition and/or vacation school in Mathematics or
Mathematical Literacy 71
2. Appendix B: Questionnaire for Teachers of Grade 10 or Grade
11 Mathematics or Mathematics Literacy 76
71
Instructions: The Questionnaire on Mathematics and Mathematics Literacy consists of: 1. A Questionnaire for Grade 11 Learners: Supplementary tuition and/or vacation school in Mathematics or Mathematics Literacy
Part One:
Section A: To be completed by all learners
Section B: To be completed by learners who have received supplementary tuition
(during term time or during the vacation) in Mathematics or Mathematics
Literacy during 2007,
Section C: To be completed by learners who have not received supplementary tuition
in 2007 in Mathematics or Mathematics Literacy.
Part Two:
Reasons for unsatisfactory performance in Mathematics or Mathematics Literacy: To be
completed by all learners who are dissatisfied with their performance in Mathematics or
Mathematics Literacy.
Most learners who are currently receiving supplementary tuition will complete sections A and B. If the
learner is dissatisfied with his/her performance in the subject, then the learner will also complete Part
Two (Reasons for unsatisfactory performance in Mathematics or Mathematics Literacy).
2. A Questionnaire for Teachers of Grade 10 or Grade 11 Mathematics or Mathematics Literacy. Part One:
Section A: Base data of teachers of Grade 10 or Grade 11 Mathematics or Mathematics Literacy.
Section B: Many teachers apparently struggle to complete the syllabi in the allocated class
time. Section B explores this problem.
Part Two: Section A: Reasons advanced for unsatisfactory performance in Mathematics. Section B: Reasons advanced for unsatisfactory performance in Mathematics Literacy.
Definition of Supplementary Tuition:
Additional tuition conducted after school hours with the aim of sustaining or improving the learner’s
performance in the subject. These lessons are usually taught by someone other than the learner’s
regular teacher and the private tutor usually charges a fee. Lessons conducted after school hours with
the aim of completing the subject syllabus in time, are therefore not regarded as supplementary
tuition.
72
Appendix A: Questionnaire for Grade 11 learners: Supplementary tuition in Mathematics or Mathematics Literacy Part one Section A: To be completed by all learners Please answer the following questions to the best of your ability. Tick the correct box where applicable.
1. Name of School:
2. Gender: 3. Age (Years):
4. Are you taking Mathematics or Mathematics Literacy?
Mathematics Mathematics Literacy
5. What were your marks in Mathematics/Mathematics Literacy in:
0-19% 20-29% 30-39% 40-49% 50-59% 60-69% 70-79% 80-100%5.1 December 2006
5.2 June 2007
6. Please indicate to what extent you agree with the following statements:
Strongly
disagree
Disagree Neutral Agree Strongly
agree
6.1 I am satisfied with my June 2007 Mathematics/Mathematics Literacy mark
6.2 A good pass in Mathematics/Mathematics Literacy is important for my future
6.3 It would benefit me to have more/longer Mathematics/Mathematics Literacy lessons during school
7. Please rate the effect privatethat tuition, during term time or during the vacation, and
model/former examination papers with solutions have on obtaining or maintaining good marks in
Mathematics/ Mathematics Literacy.
Very Negative effect
Negative effect
No effect
Positive effect
Very positive effect
7.1 Private tuition during term time
7.2 Private tuition during vacation
Male Female
73
7.3Model/former examination papers
74
Section B
Complete this section if you have received supplementary tuition in Mathematics/Mathematics
Literacy during 2007.
1. Did you receive private tuition during term time or during the vacation?
During term time
During the Official
vvacation
2. How many hours of private tuition have you received thus far this year? (E.g. 2 hours per week
for 3 weeks = 2 X 3 = 6 hours)
No of hours per week No of weeks Total Hours
During term
timelessons for =
During the vacation
for =
3. Did you study previous examination papers during private tuition?
Yes
No
4. How many model/former examination papers will you have studied before this year’s final
examination? Try to be realistic. Include papers done on your own, at school and during private
tuition and vacation school.
Number of exam papers:
75
Section C
Answer this section only if you have not had private tuition in Mathematics or Mathematics Literacy
during 2007.
1. Why have you not had private tuition in Mathematics/ Mathematics Literacy?
1.1 I never needed private tuition in term time.
1.2 I never needed to attend private tuition during the vacation.
1.3 I could not fit private tuition into my schedule in term time.
1.4 I could not fit private tuition into my schedule during the vacation.
1.5 I could not afford private tuition in term time.
1.6 I could not afford private tuition during the vacation.
1.7 I have transport problems.
1.8 I could not find a tutor who was prepared to teach me privately.
1.9 I was unaware of any vacation schools offered in our vicinity.
1.10 Other reasons: (please specify)
a)
b)
c)
d)
76
Part two: Reasons for unsatisfactory performance in Mathematics or Mathematics Literacy Only complete this section if you are dissatisfied with your current mark in Mathematics or Mathematics Literacy. This is not a test, but a questionnaire to determine why learners do not achieve as they should. A list of statements is provided below. Please rate how strongly you agree or disagree with each of the statements by placing a cross in the appropriate box. If there are other reasons why you do not do well in Mathematics/Mathematics Literacy, please add them at the bottom of the list.
Reason for unsatisfactory performance
Strongly Disagree
Disagree Neutral Agree Strongly Agree
1. The subject is too difficult for me.
2. The time allocated to the subject in school is insufficient.
3. I do not work hard enough at the subject.
4. I do not have enough time to work at the subject outside of class time because I am involved in extra-mural activities.
5. I do not have enough time to work at the subject outside of class time because I have other responsibilities, e.g. at home.
6. My teacher does not explain clearly.
7. I did not understand certain sections in the subject in previous years, and now it is causing problems for me.
8. The syllabus is too long.
9. My teacher is often away or out of class.
10. My class is too big.
11. I do not receive individual help from the teacher in class.
12. I do not get extra help after school.
13. I am too shy/self-conscious to ask questions in class.
14. I do not have a text book.
15. I do not have access to model/former examination papers with solutions.
16. I do not know what I do wrong when solving problems; I only know that the answers are wrong.
17. Our school does not have enough resources, e.g.
18. Other (Please specify) Agree Strongly Agree
18.1
18.2
Thank you for completing the questionnaire.
77
Appendix B: Questionnaire for Teachers of Mathematics or Mathematics Literacy This questionnaire forms part of a research project to explore reasons why some learners don’t achieve as they should in Mathematics or Mathematics Literacy. Please assist us by answering the following questions. If there are any questions that you prefer not to answer, leave the space blank. Part one: Section A
1. Name of School:
2. Gender: 3. Age (Years):
4. What is your highest academic qualification? 5. What is your highest Mathematics
qualification?
4.1 Grade 12 or lower 5.1 Grade 12 or lower 4.2 Certificate 5.2 Mathematics diploma 4.3 Two year Diploma 5.3 Mathematics I 4.4 Three year Diploma 5.4 Mathematics II 4.5 Degree 5.5 Mathematics III 4.6 Post-graduate 5.6 Post-graduate
6. What is your highest qualification in the educational field?
6.1 Post-graduate Diploma in Education
6.2 Other (Please specify):
7. How many years have you taught senior Mathematics and Mathematics Literacy?
It seems as if many teachers struggle to complete the Mathematics/Mathematics Literacy
syllabus in the allocated class time. Section B explores this problem:
1. Are you experiencing problems in completing the syllabus in the allocated class time?
Grade
Strongly disagree
Disagree Neutral Agree Not applicable,
don’t teach
1.1 Mathematics 10
1.2 Mathematics 11
1.3 Mathematics 12
1.4 Mathematical Literacy 10
1.5 Mathematical Literacy 11
2. Please indicate to what extent you utilise the following strategies to enable you to complete the syllabus in time.
Strongly disagree
Disagree Neutral Agree Strongly Agree
2.1 I am experienced and can therefore pace myself well.
2.2 I work quite fast and some of the learners cannot keep up.
2.3 I use school time normally allocated to.……
2.4 I give extra help (individual or in groups) to learners after school hours.
2.5 The learners have to do some chapters as self-study.
2.6 Other (please specify)…. Agree Strongly Agree
2.6.1
2.6.2
3. Do you give extra help (individual or in groups) to learners after school hours?
Never Seldom Regularly Weekly Daily
79
4. If you do give extra help to learners after school hours, do you receive remuneration?
Never Seldom Usually Always
5. Please rate the effect of the following on learners for obtaining and maintaining good marks in Mathematics/ Mathematics Literacy.
Very negative Negative No effect Positive
effect Very positive
effect
5.1 Private tuition during term time
5.2 Private tuition during vacation time
5.3 Model/former examination papers
80
Part Two:
Section A
The following statements have been advanced as reasons for learners not doing well in Mathematics. (See next page for Mathematics Literacy). Please rate how strongly you agree or disagree with each of the statements by placing a cross in the appropriate box. If you regard the list as incomplete, please add other reasons at the bottom.
Reasons for learners' unsatisfactory performance in Mathematics
Strongly Disagree Disagree Neutral Agree
Strongly Agree
1. Learners do not work hard enough at Mathematics because they are over- committed in other areas.
2. The Mathematics syllabus is too long.
3. Learners who do not have the (necessary) ability take Mathematics as a subject.
4. The teaching time allocated to Mathematics in school is not sufficient.
5. Learners lack commitment to the subject.
6. Learners struggle with misconceptions carried over from previous years.
7. The Mathematics classes are too big.
8. Learners do not have text books.
9. I have too many other responsibilities at school and am often absent from class.
10. I don’t have enough class time to assist learners individually with their problems.
11. Learners should work through previous examination papers.
12. I explain the work, but learners still do not understand. I do not know how else to explain the work so that they will understand.
13. The learners do not ask questions when they don’t understand.
14. I do not have enough teaching experience.
15. I am not well qualified in Mathematics.
16. We lack resources at our school (please specify)
17. Other (please specify)
Agree Strongly Agree
17.1.
17.2
81
Section B
The following statements have been advanced as reasons for learners not doing well in Mathematics Literacy. (See previous page for Mathematics). Please rate how strongly you agree or disagree with each of the statements by placing a cross in the appropriate box. If you regard the list as incomplete, please add other reasons at the bottom.
Reasons for learners' unsatisfactory performance in Mathematics Literacy
Strongly Disagree
Disagree Neutral Agree Strongly Agree
1. Learners do not work hard enough at Mathematics Literacy because they are overcommitted in other areas.
2. The Mathematics Literacy syllabus is too long.
3. Learners who lack ability should not be forced to take Mathematics Literacy as a subject.
4. The teaching time allocated to Mathematics Literacy in school is not sufficient.
5. Learners lack commitment to the subject.
6. Learners struggle with misconceptions carried over from previous years.
7. The Mathematics Literacy classes are too big.
8. Learners do not have text books.
9. I have too many other responsibilities at school and am often absent from class.
10. I don’t have enough class time to assist learners individually with their problems.
11. Learners should work through previous examination papers.
12. I explain the work, but learners still do not understand. I do not know how else to explain the work so that they will understand.
13. The learners do not ask questions when they don’t understand.
14. I do not have enough teaching experience.
15. I am not well qualified in the subject and am often unsure of myself.
16. We lack resources at our school (pleasespecify).
17. Other (please specify)
Agree Strongly Agree
17.1
17.2
82
Thank you for completing the Questionnaire!
83
REFERENCES [1] Balfanz, R., McPartland, J. & Shaw, A. (2002). Re-conceptualising Extra Help
for High School Students in a High Standards Era. Center for Social