Fa Supplier performance dashboard At Volvo Logistics Master of Science Thesis in the Master Degree Programme Supply Chain Management JEANETTE GUSTAFSSON ERIKA KARLSSON Department of Technology Management and Economics Division of Logistics and Transportation CHALMERS UNIVERSITY OF TECHNOLOGY Göteborg, Sweden, 2012 Report No. E2012:025 Här finns utrymme att lägga in en bild. Tänk bara på att anpassa så att nedersta
Transcript
Fa
Supplier performance dashboard At Volvo Logistics
Master of Science Thesis in the Master Degree Programme Supply Chain
2.1 QUALITATIVE RESEARCH APPROACH ....................................................................................................................... 6
2.2 THE RESEARCH PROCESS ...................................................................................................................................... 7
2.3 EXPLORATORY, DESCRIPTIVE OR EXPLANATORY APPROACH .......................................................................................... 7
2.4 RESEARCH STRATEGY .......................................................................................................................................... 8
2.5 DATA COLLECTION AND DATA ANALYSIS .................................................................................................................. 8
2.5.1 Literature review ................................................................................................................................. 10
3.3.2 Motives for performance measurements ............................................................................................ 22
3.3.3 Characteristics of performance measurements ................................................................................... 22 3.3.3.1 Hard and soft measurements ........................................................................................................................ 23 3.3.3.2 Financial and non-financial measurements ................................................................................................... 23 3.3.3.3 Leading and lagging measurements ............................................................................................................... 24
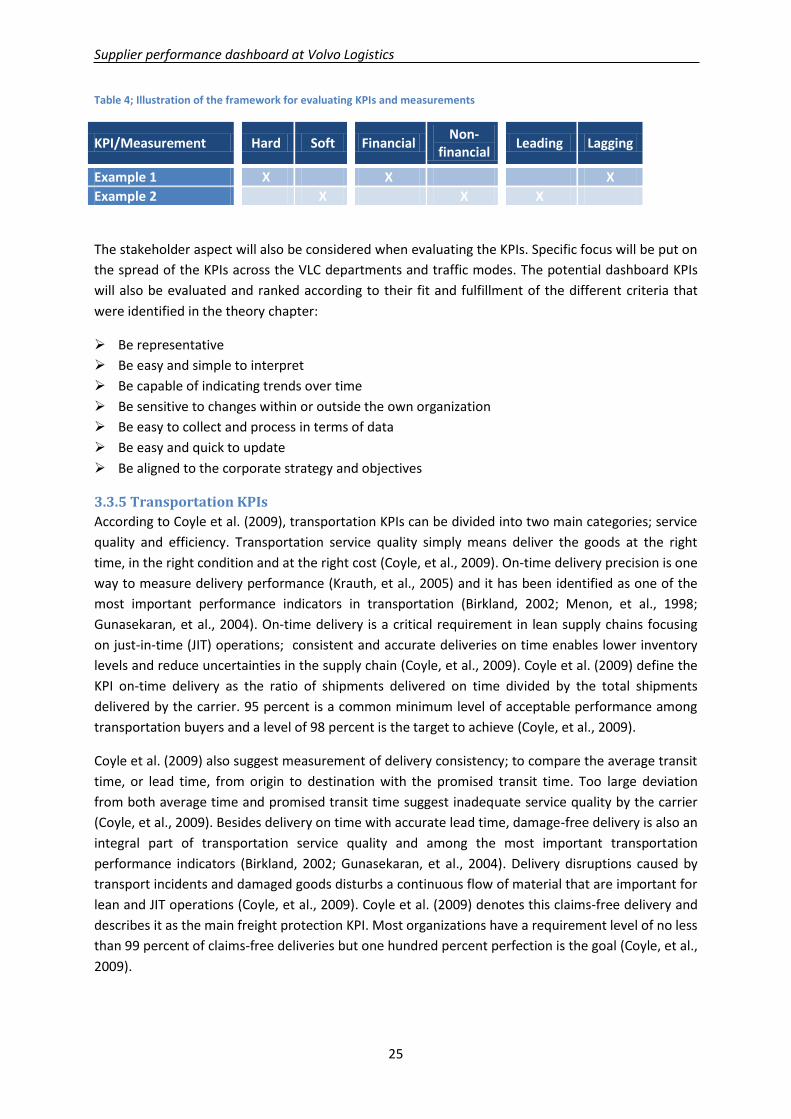
3.3.4 Framework for evaluating KPIs............................................................................................................ 24
3.4 BUSINESS INTELLIGENCE .................................................................................................................................... 26
4.1 THE SUPPLIER PERFORMANCE DASHBOARD AT VLC ................................................................................................. 34
4.1.1 Areas of application ............................................................................................................................. 34
4.1.2 Purchasers view on measurements for the dashboard ....................................................................... 35
Supplier performance dashboard at Volvo Logistics
vi
4.2 THE SUPPLIER BASE ........................................................................................................................................... 35
4.3 SUPPLIER MEASUREMENTS WITHIN VLC ............................................................................................................... 38
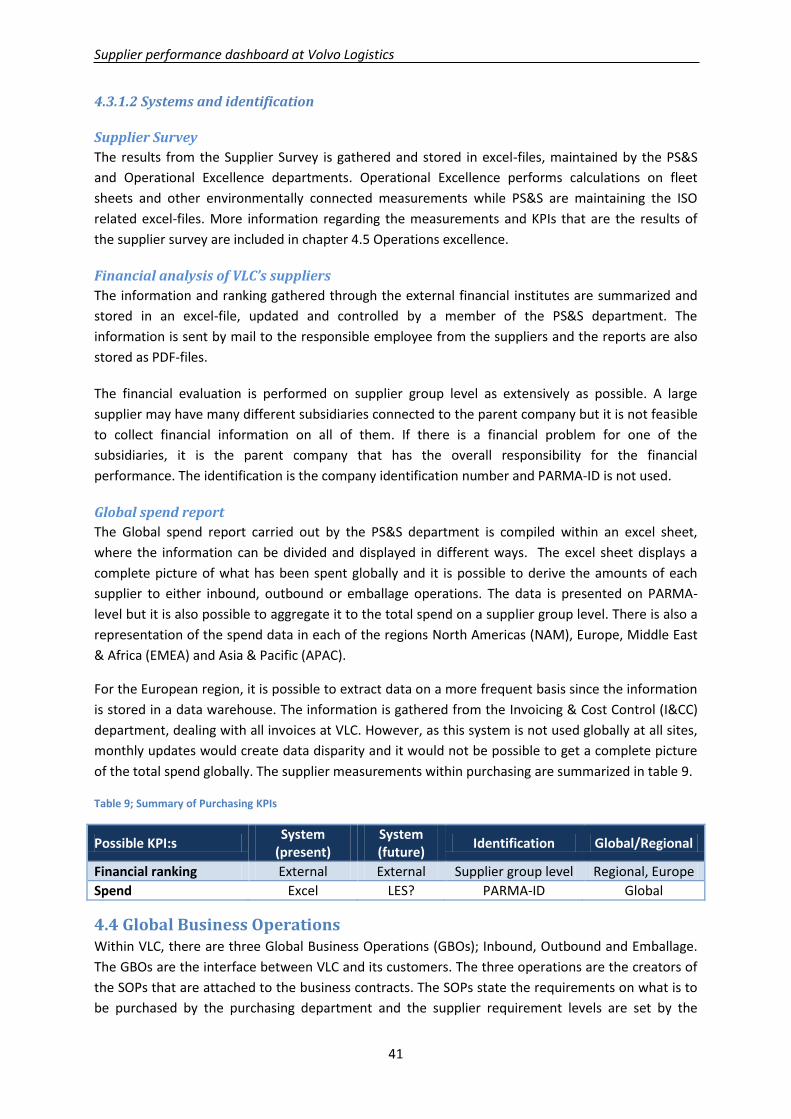
4.3.1 Global Purchasing ................................................................................................................................ 39 4.3.1.1 Measurements ............................................................................................................................................... 39 4.3.1.2 Systems and identification ............................................................................................................................. 41
4.4 GLOBAL BUSINESS OPERATIONS .......................................................................................................................... 41
4.4.1 Inbound................................................................................................................................................ 42 4.4.1.1 Measurements ............................................................................................................................................... 42 4.4.1.2 Systems and identification ............................................................................................................................. 43
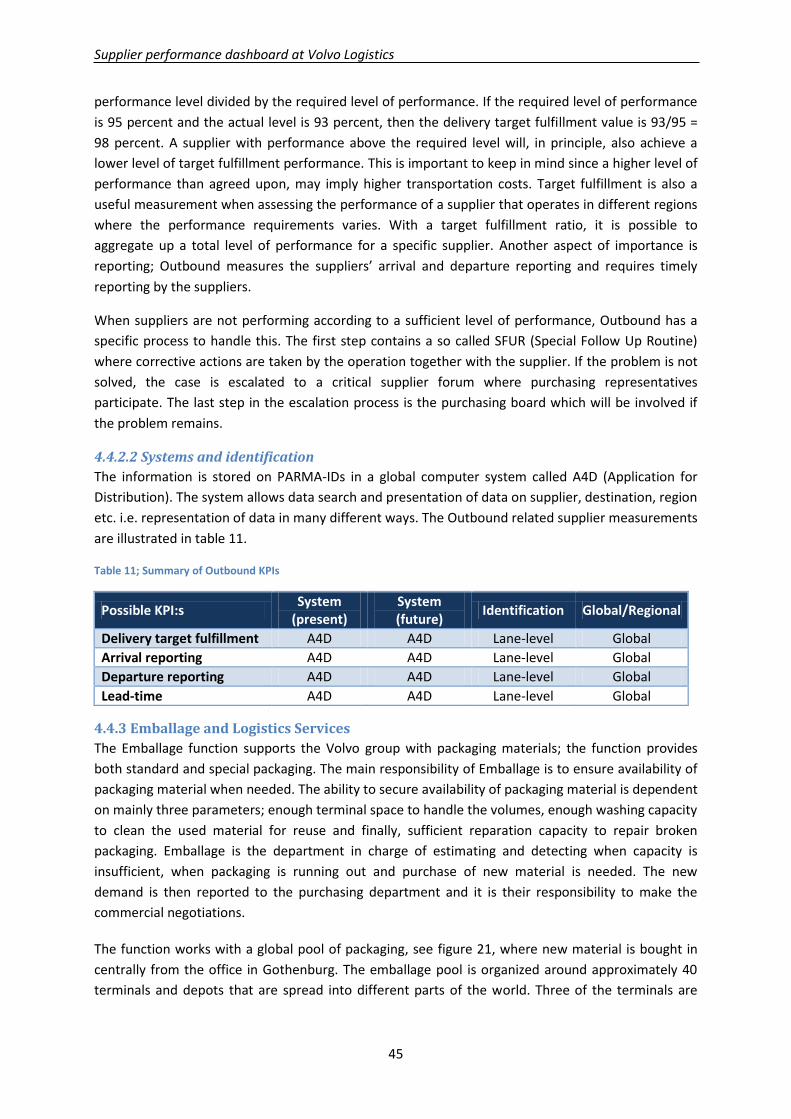
4.4.2 Outbound ............................................................................................................................................. 44 4.4.2.1 Measurements ............................................................................................................................................... 44 4.4.2.2 Systems and identification ............................................................................................................................. 45
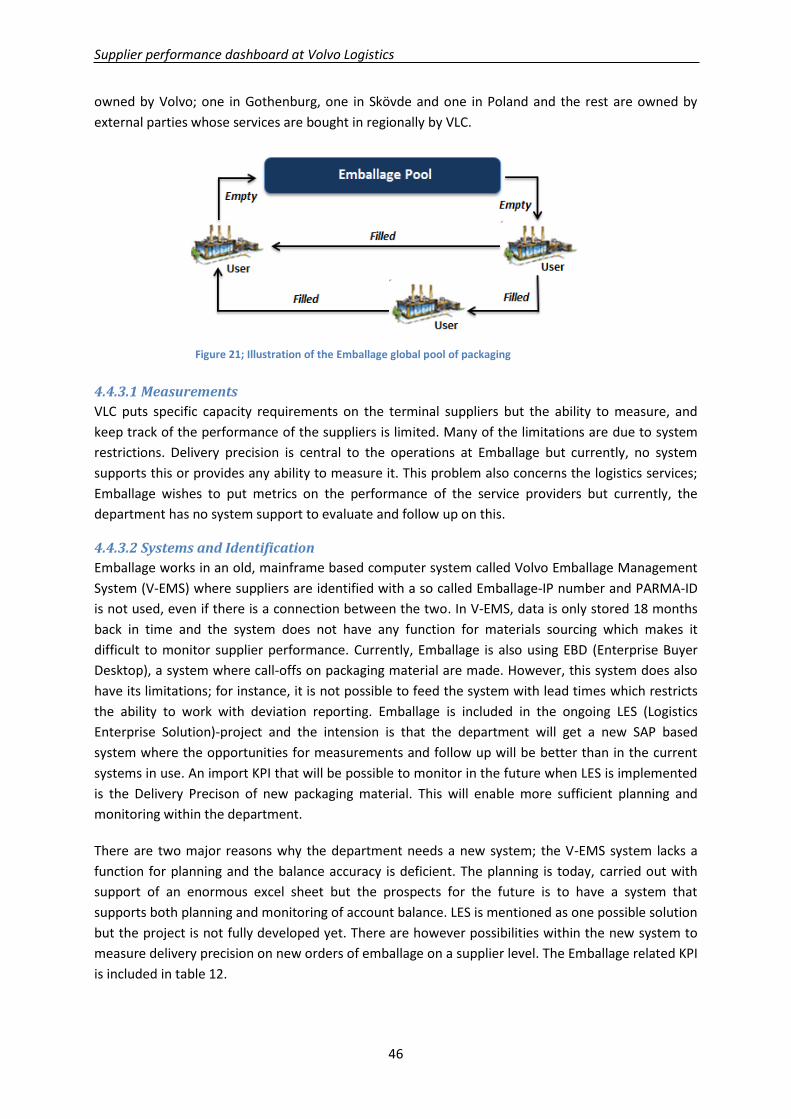
4.4.3 Emballage and Logistics Services ......................................................................................................... 45 4.4.3.1 Measurements ............................................................................................................................................... 46 4.4.3.2 Systems and Identification ............................................................................................................................. 46
4.4.4 Emballage transportations .................................................................................................................. 47 4.4.4.1 Measurements ............................................................................................................................................... 47 4.4.4.2 Systems and identification ............................................................................................................................. 48
4.5.2 Systems and identification ................................................................................................................... 51
4.6.2 Systems and identification ................................................................................................................... 54
4.7 INVOICING & COST CONTROL ............................................................................................................................. 54
4.7.2 Systems and identification ................................................................................................................... 56
4.8 SUMMARY OF THE EMPIRICAL FINDINGS ................................................................................................................ 58
5.1 DASHBOARD FOR PURCHASING ........................................................................................................................... 61
5.1.1 Areas of dashboard application at VLC purchasing ............................................................................. 62
5.2 ASSESSMENT OF POTENTIAL KPIS ........................................................................................................................ 64
5.2.1 Ranking of KPIs .................................................................................................................................... 79
5.2.1 Summary of the assessment of potential KPIs ..................................................................................... 81
5.3 CHARACTERISTICS OF KPIS ................................................................................................................................. 82
5.4 ORGANIZATIONAL REPRESENTATION OF KPIS ......................................................................................................... 86
5.5 EVALUATION OF KPIS AND MEASUREMENTS PER TRAFFIC MODE ................................................................................ 89
5.6 SUMMARIZING DISCUSSION OF KPI EVALUATION .................................................................................................... 91
5.6.1 Critical discussion about the dashboard .............................................................................................. 95
5.7 EVALUATION OF SYSTEMS AND TECHNICAL SOLUTIONS ............................................................................................. 96
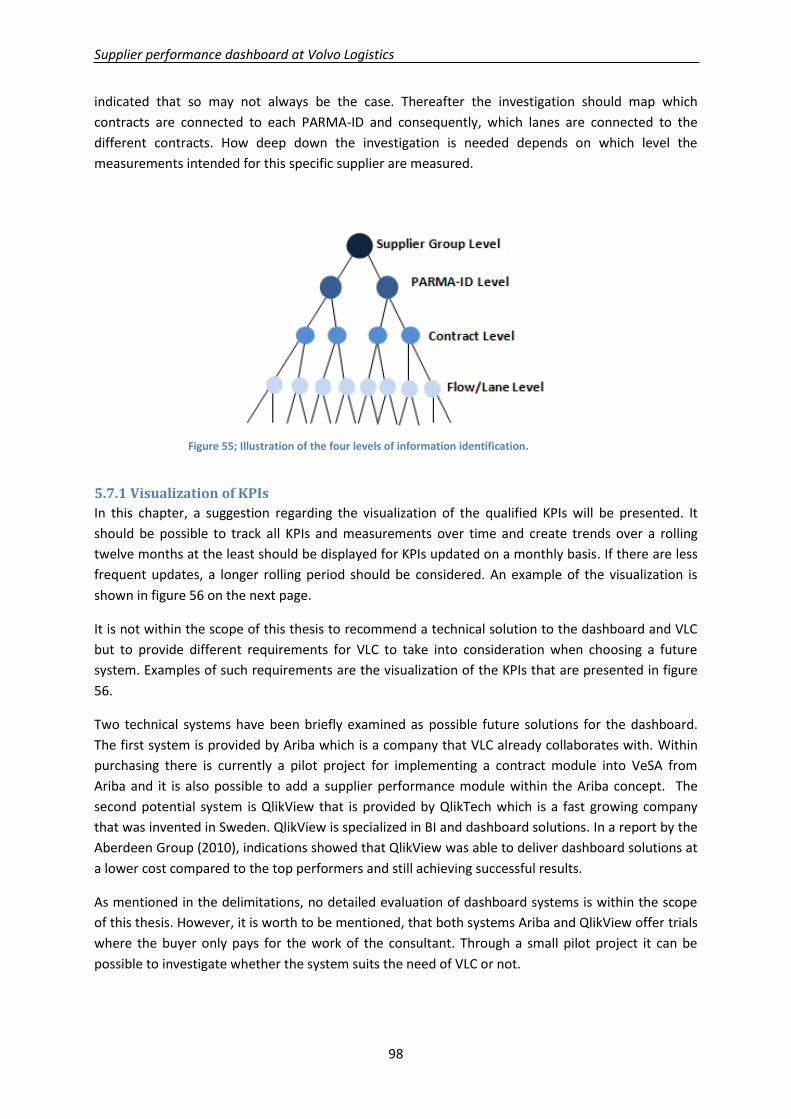
5.7.1 Visualization of KPIs............................................................................................................................. 98
8 FUTURE RESEARCH .................................................................................................................................... 108
APPENDIX 3 – INTERVIEW WITH SUPPLIERS ................................................................................................. 117
APPENDIX 4 – INTERVIEW GUIDE FOR PURCHASERS .................................................................................... 118
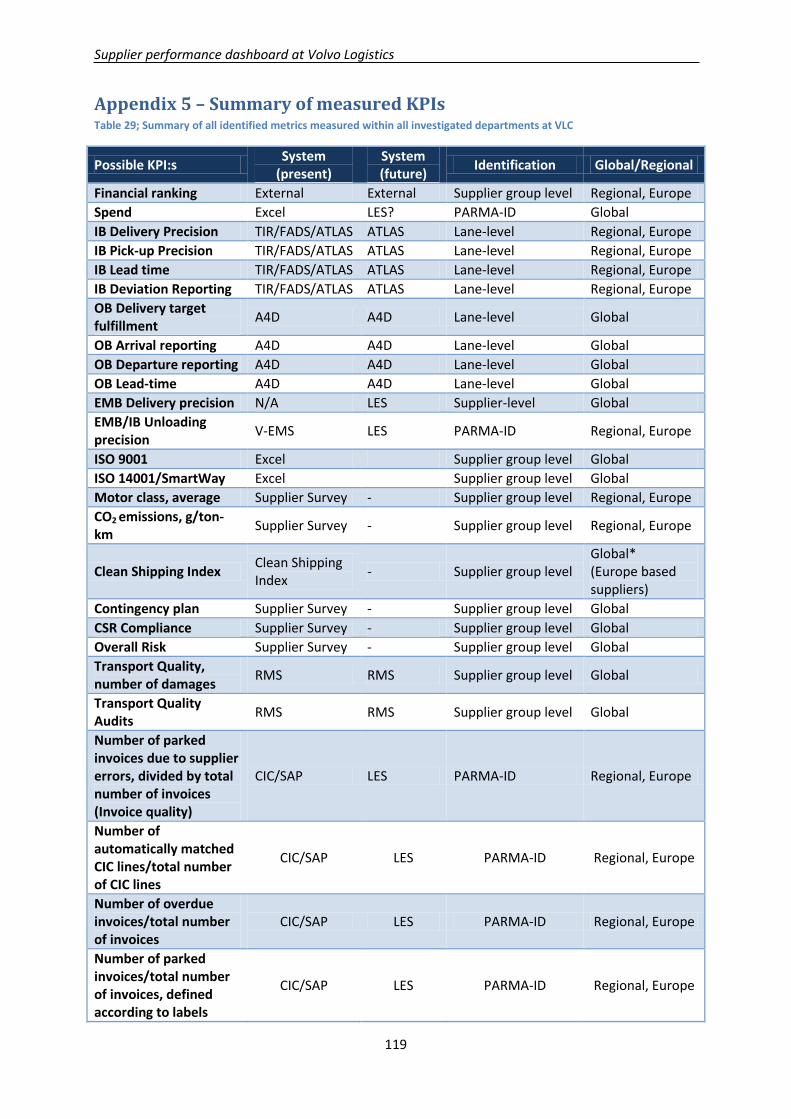
APPENDIX 5 – SUMMARY OF MEASURED KPIS ............................................................................................. 119
APPENDIX 6 – BACKGROUND INFORMATION ON ATLAS AND LES ................................................................ 120
Supplier performance dashboard at Volvo Logistics
viii
List of figures FIGURE 1; ORGANIZATIONAL CHART, THE VOLVO GROUP ..................................................................................................... 2
FIGURE 2; ORGANIZATIONAL CHART OF THE GLOBAL PURCHASING DEPARTMENT AT VOLVO LOGISTICS ......................................... 3
FIGURE 3; THE THREE BUSINESS AREAS OF VOLVO LOGISTICS; INBOUND, OUTBOUND AND EMBALLAGE ........................................ 3
FIGURE 4; ILLUSTRATION OF THE RESEARCH PROCESS. .......................................................................................................... 7
FIGURE 5; SUMMARY OF THE STRUCTURE OF THE THEORY CHAPTER. ..................................................................................... 13
FIGURE 6; TWO DIFFERENT INTERACTION MODELS BETWEEN THE SUPPLYING AND BUYING FIRM. ................................................ 16
FIGURE 7; ILLUSTRATION OF THE PROCESS OF PURCHASING. SOURCE: VAN WEELE (2010). ...................................................... 16
FIGURE 8; INTERPRETATION OF KRALJIC’S PORTFOLIO MODEL. SOURCE: KRALJIC (1983), GADDE ET AL. (2010). ......................... 17
FIGURE 9; SUPPLIER PERFORMANCE EXPECTATIONS DEVELOPMENT HIERARCHY, SOURCE GORDON (2008).................................. 19
FIGURE 10; RELATIONSHIP BETWEEN ALL METRICS AND THE KPIS OF AN ORGANIZATION. SOURCE: RASMUSSEN ET AL., 2009 ......... 21
FIGURE 11; SCHEMATIC PICTURE OF MEASURING A KPI BASED ON TIME. ............................................................................... 22
FIGURE 12; ILLUSTRATION OF AN AUTOMOTIVE DASHBOARD. SOURCE: (CAR LOVERS MAGAZINE, 2010) .................................... 27
FIGURE 13; THE TOP FIVE REASONS THAT DRIVE DASHBOARD INITIATIVES, BASED ON ANSWERS FROM 285 FIRMS. SOURCE: ABERDEEN
GROUP (2009)................................................................................................................................................. 27
FIGURE 14; ILLUSTRATION OF AN EXECUTIVE DASHBOARD. SOURCE: (ANALYTICS IN MOTION, 2012). ........................................ 28
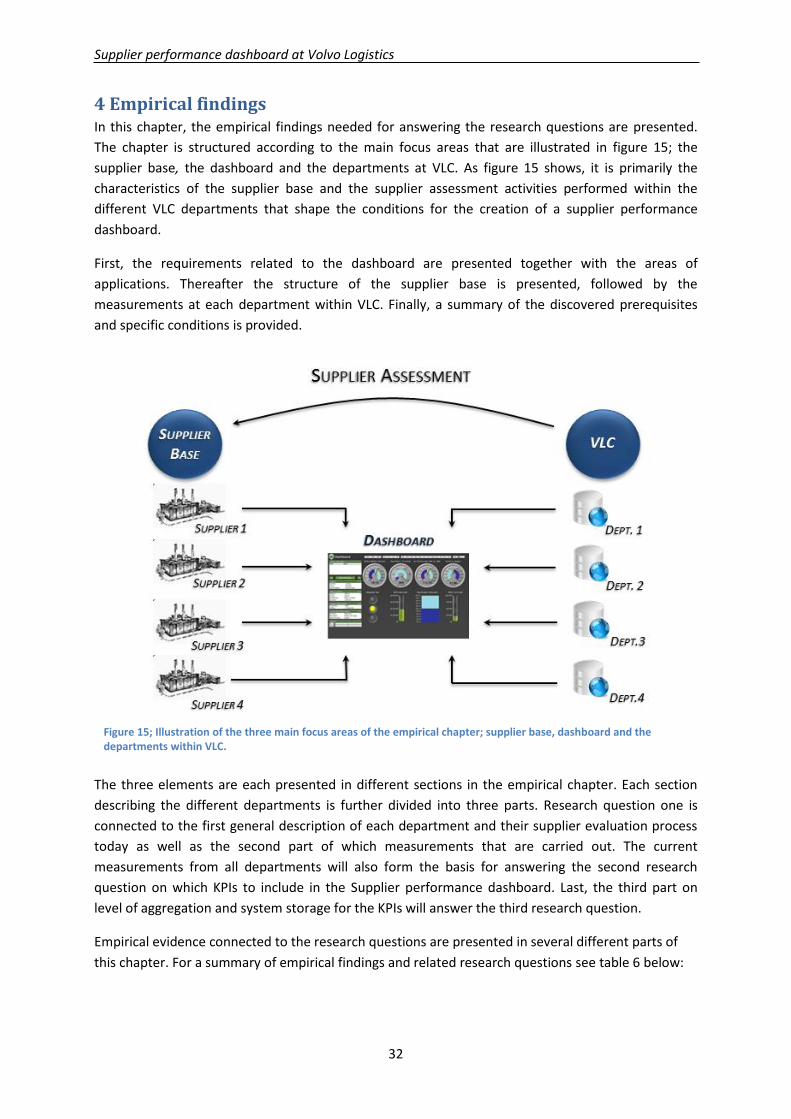
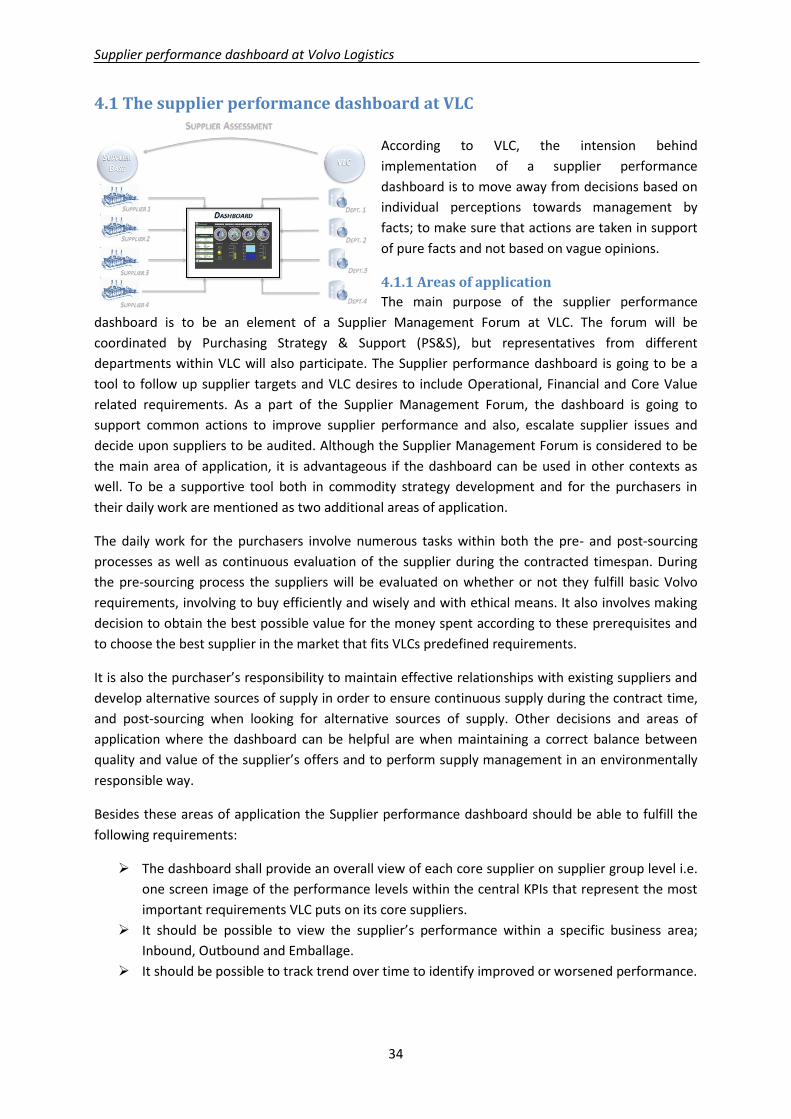
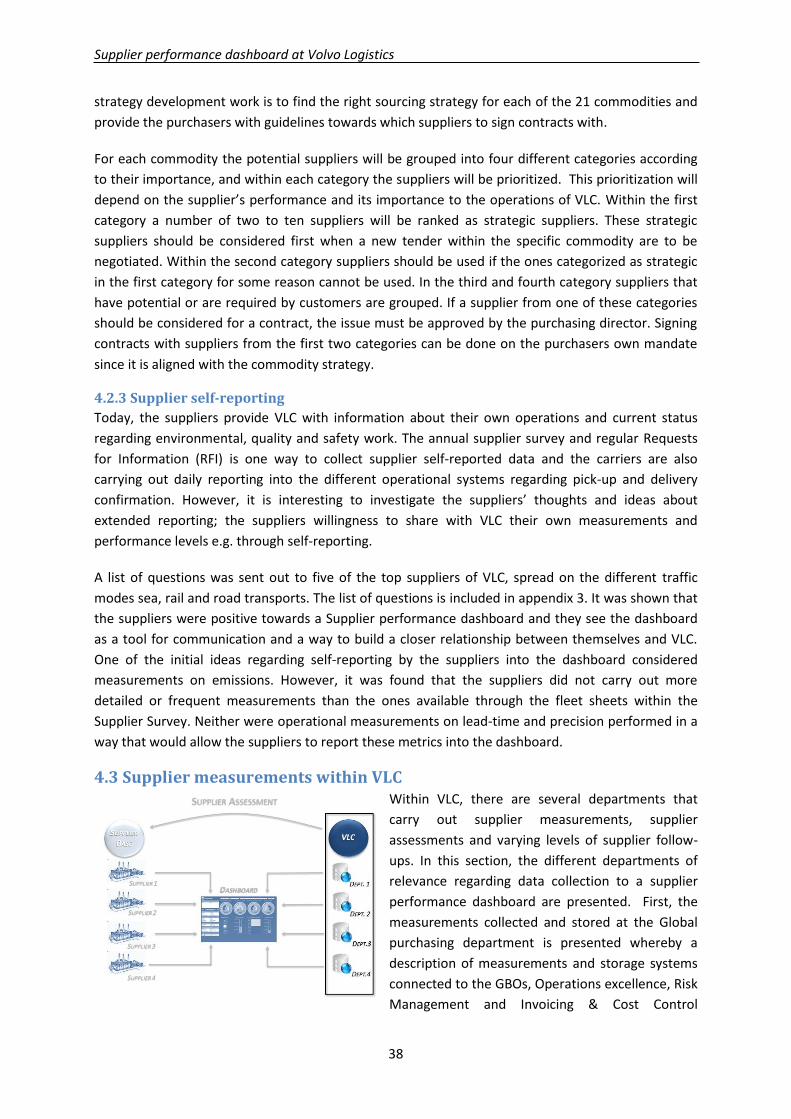
FIGURE 15; ILLUSTRATION OF THE THREE MAIN FOCUS AREAS OF THE EMPIRICAL CHAPTER; SUPPLIER BASE, DASHBOARD AND THE
DEPARTMENTS WITHIN VLC. ................................................................................................................................ 32
FIGURE 16; SPEND DIVIDED BY BUSINESS AREA, 2011. ...................................................................................................... 36
FIGURE 17; NUMBER OF ACTIVE CORE SUPPLIERS PER BUSINESS AREA, 2011 ......................................................................... 36
FIGURE 18; SPEND DIVIDED BY TRAFFIC MODE, 2011. ...................................................................................................... 36
FIGURE 19; PIE CHART VISUALIZING THE SPREAD OF PURCHASED GOODS, 2011 ..................................................................... 37
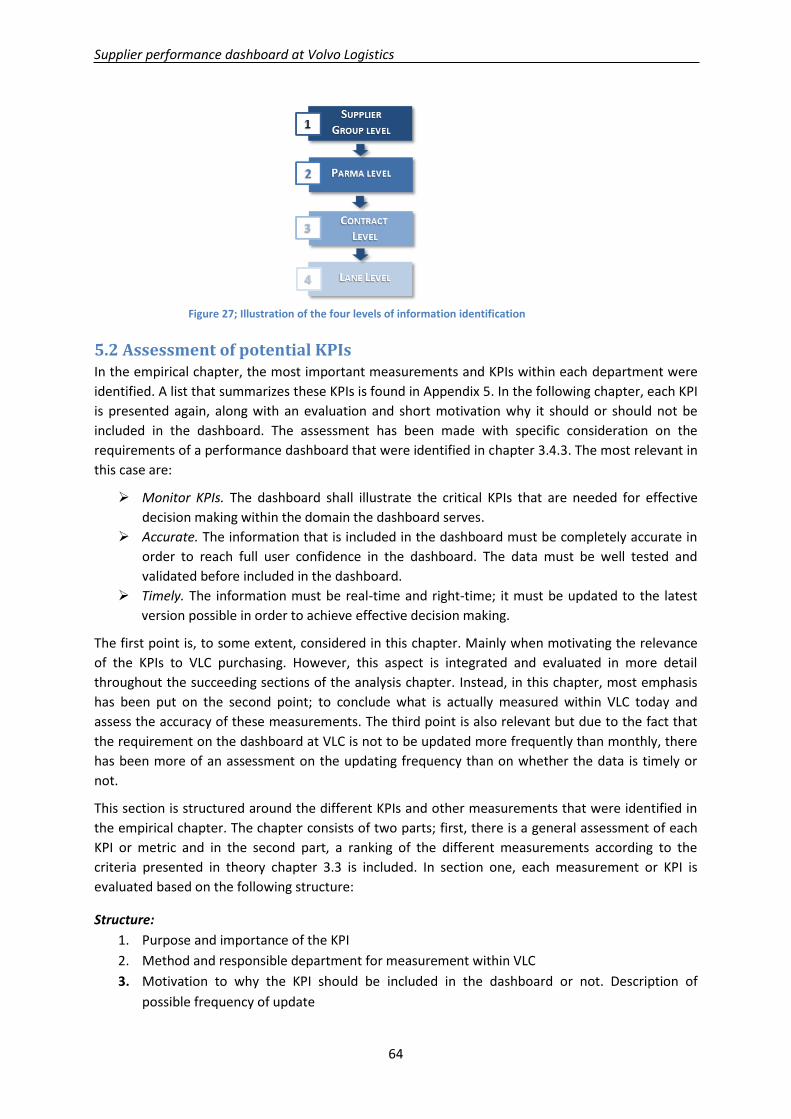
FIGURE 20; ILLUSTRATION OF THE PRECISION MEASUREMENTS AT INBOUND. ......................................................................... 43
FIGURE 21; ILLUSTRATION OF THE EMBALLAGE GLOBAL POOL OF PACKAGING ......................................................................... 46
FIGURE 22; FLOW OF EMBALLAGE. ................................................................................................................................ 47
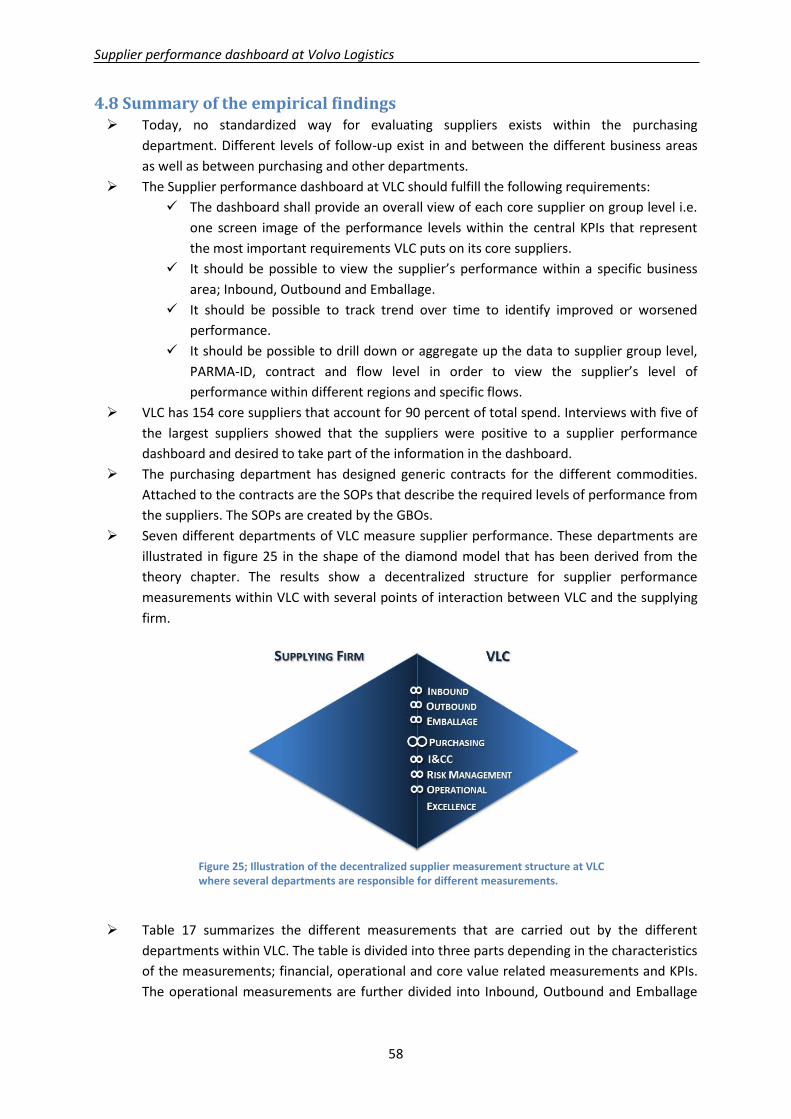
FIGURE 23; COMPARISON BETWEEN SUPPLIERS’ ANSWER IN SUPPLIER SURVEY AND RESULT FROM SAFETY AUDITS, 2010.. ............. 51
FIGURE 24; VISUALIZATION OF THE INFORMATION FLOW AND SYSTEM SUPPORT FOR HANDLING INVOICES. SOURCE: (VOLVO LOGISTICS
List of tables TABLE 1; REPORT DISPOSITION ....................................................................................................................................... 5
TABLE 2; DESCRIPTION OF THE SOURCES OF DATA THAT HAVE BEEN APPLIED IN ORDER TO ANSWER THE DIFFERENT RESEARCH
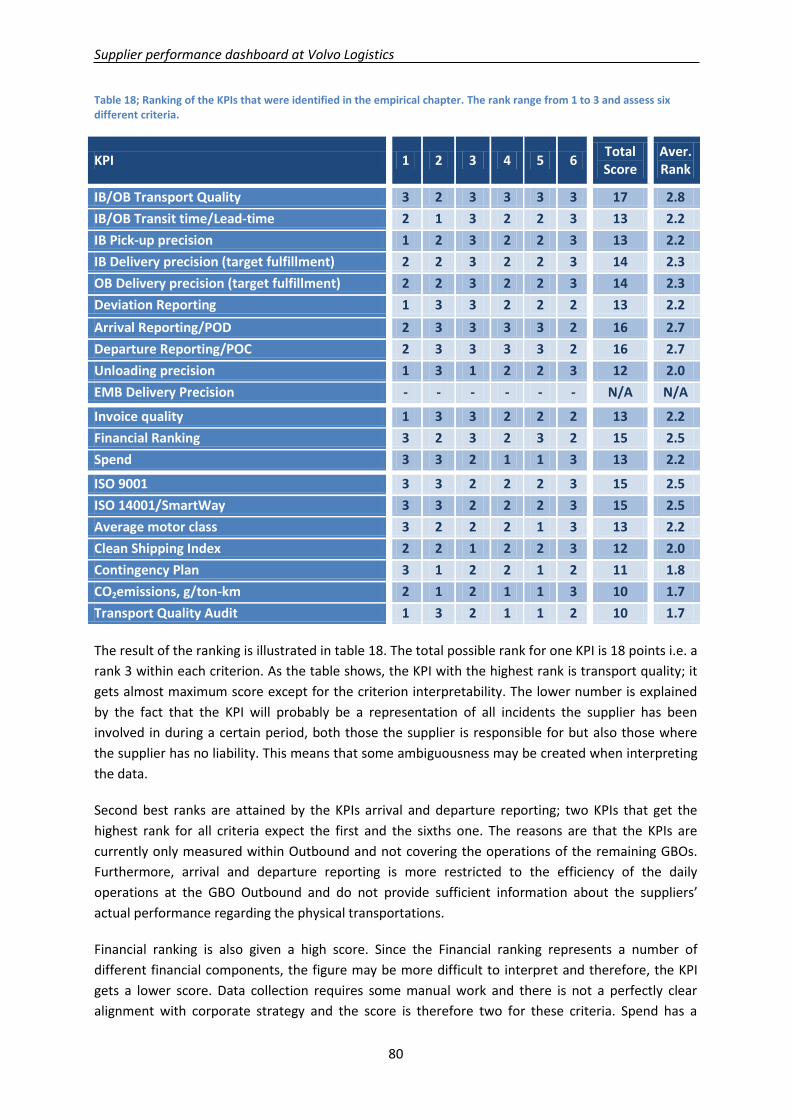
TABLE 18; RANKING OF THE KPIS THAT WERE IDENTIFIED IN THE EMPIRICAL CHAPTER. THE RANK RANGE FROM 1 TO 3 AND ASSESS SIX
DIFFERENT CRITERIA. .......................................................................................................................................... 80
TABLE 19; KPIS AND MEASUREMENTS CATEGORIZED AS QUALIFIED, FUTURE OR NON-APPLICABLE FOR THE SUPPLIER PERFORMANCE
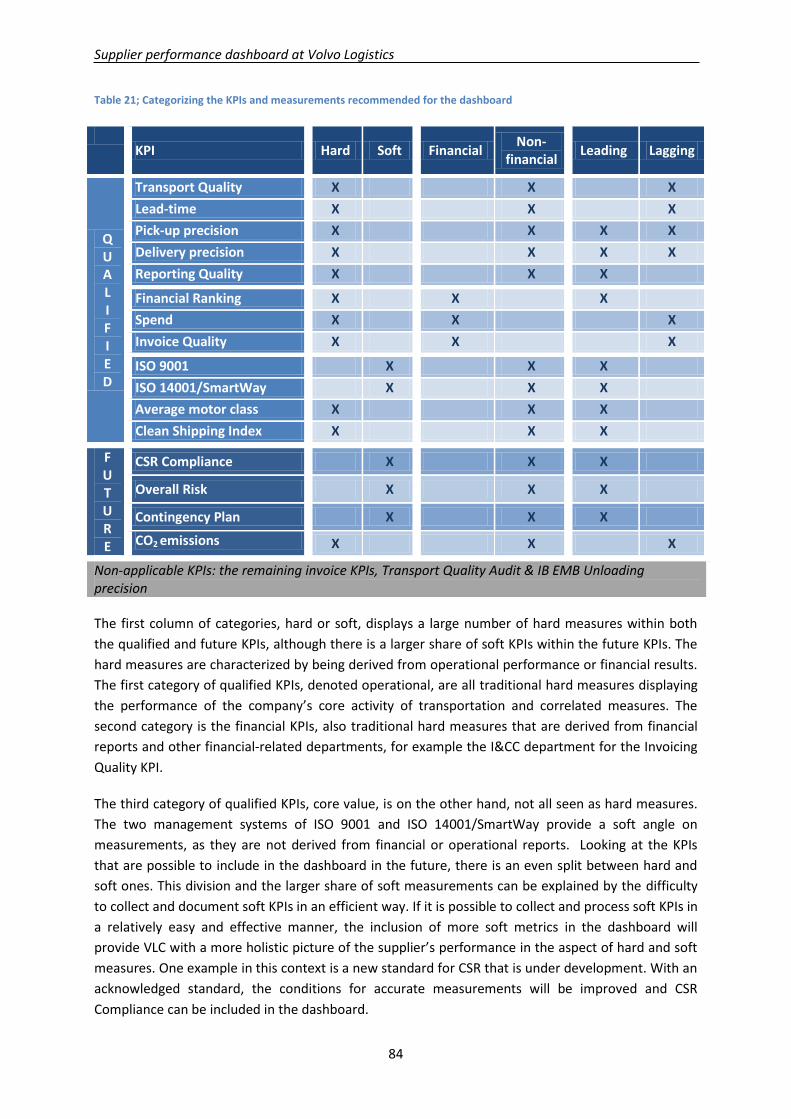
TABLE 21; CATEGORIZING THE KPIS AND MEASUREMENTS RECOMMENDED FOR THE DASHBOARD .............................................. 84
TABLE 22; ILLUSTRATION OF THE DIVISION AMONGST KPIS INCLUDED IN THE DASHBOARD BETWEEN THE DEPARTMENTS AT VLC. .... 87
TABLE 23; EVALUATION OF KPIS ON FIT TOWARDS TRAFFIC MODES ..................................................................................... 89
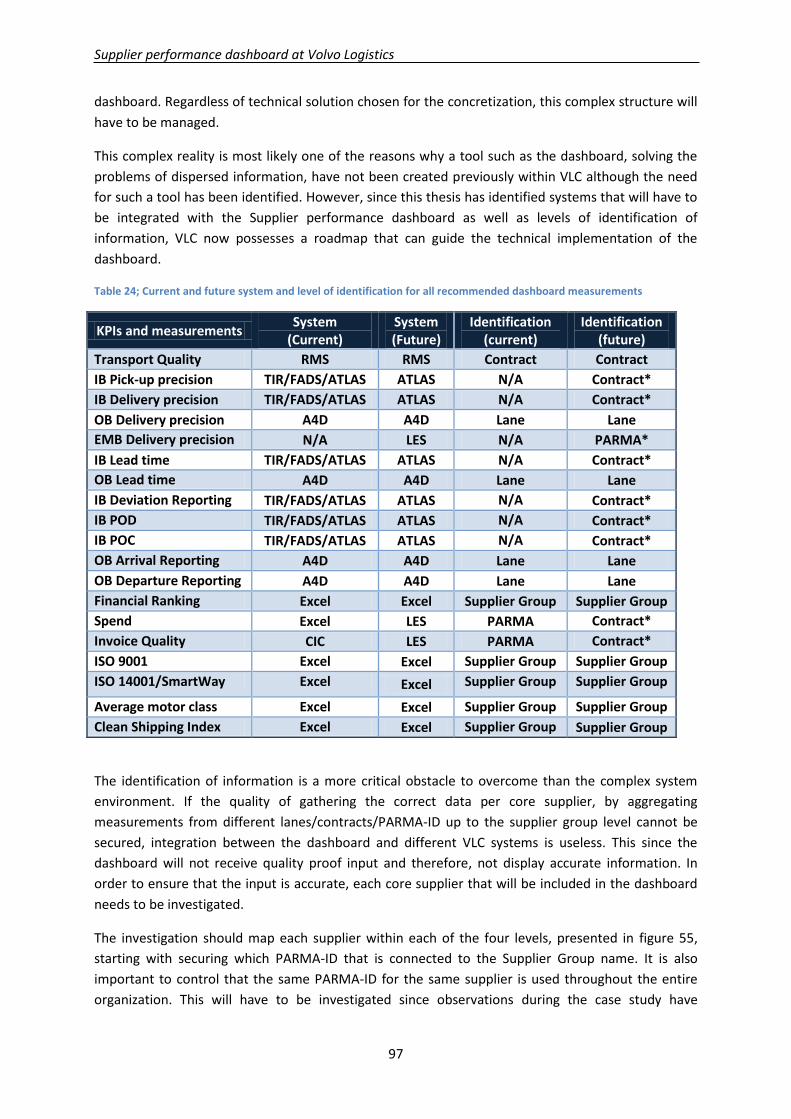
TABLE 24; CURRENT AND FUTURE SYSTEM AND LEVEL OF IDENTIFICATION FOR ALL RECOMMENDED DASHBOARD MEASUREMENTS .... 97
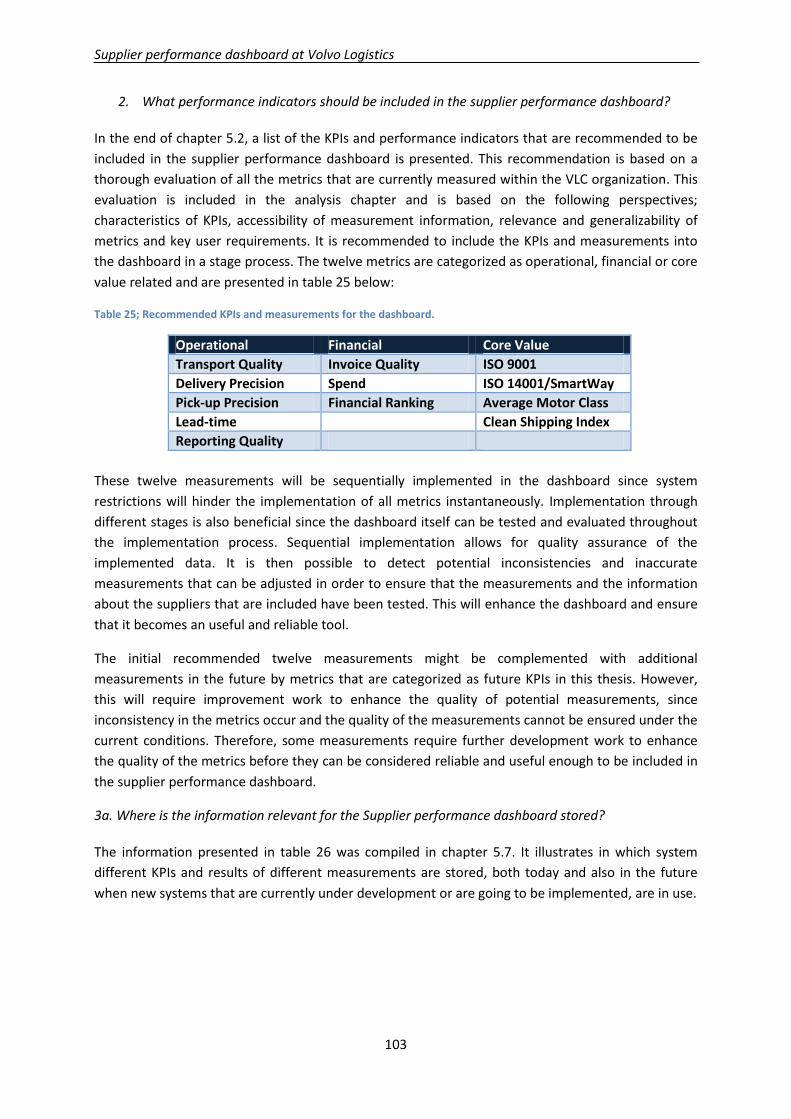
TABLE 25; RECOMMENDED KPIS AND MEASUREMENTS FOR THE DASHBOARD. ..................................................................... 103
TABLE 26; SYSTEMS, BOTH CURRENTLY AND FUTURE, WHERE KPIS AND MEASUREMENTS FOR THE SUPPLIER PERFORMANCE
DASHBOARD IS FOUND ...................................................................................................................................... 104
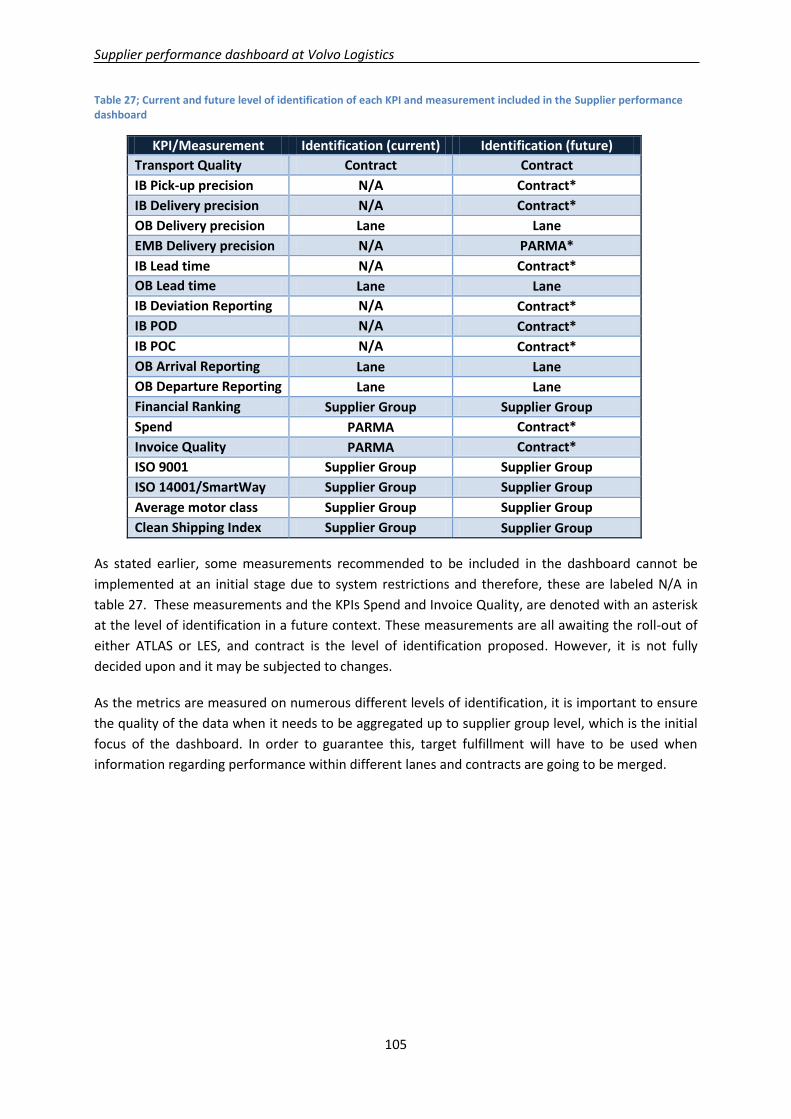
TABLE 27; CURRENT AND FUTURE LEVEL OF IDENTIFICATION OF EACH KPI AND MEASUREMENT INCLUDED IN THE SUPPLIER
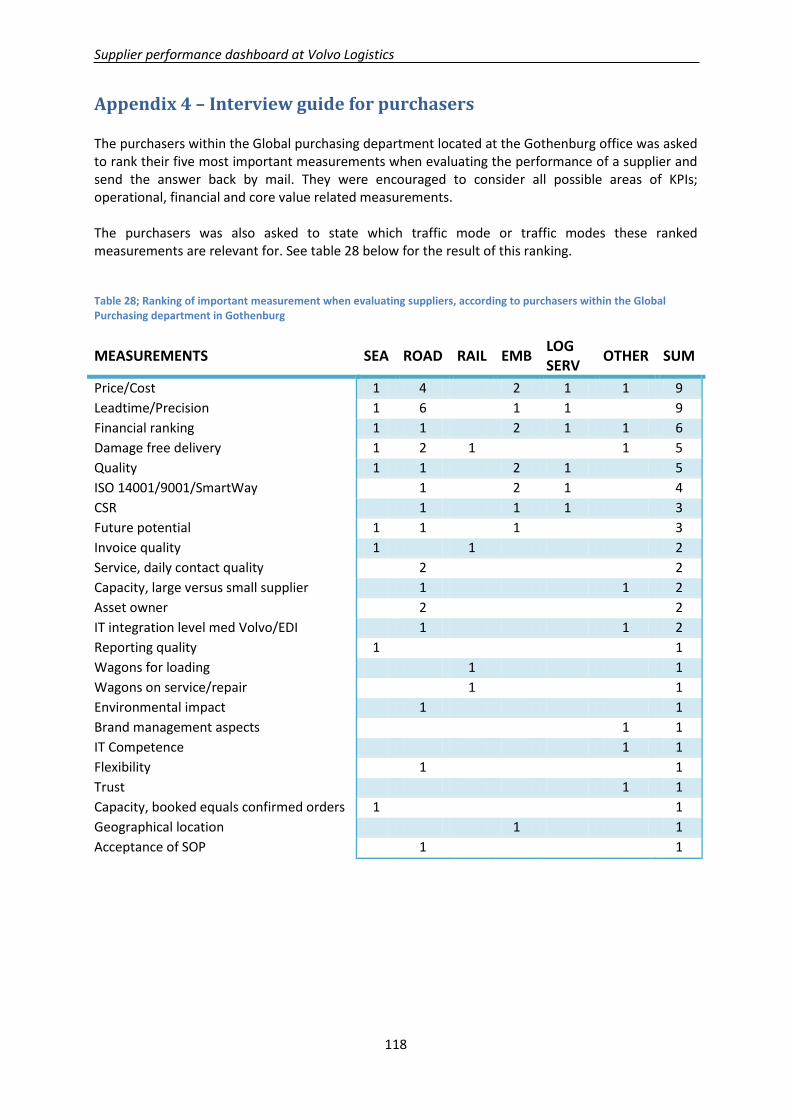
TABLE 28; RANKING OF IMPORTANT MEASUREMENT WHEN EVALUATING SUPPLIERS, ACCORDING TO PURCHASERS WITHIN THE GLOBAL
PURCHASING DEPARTMENT IN GOTHENBURG ........................................................................................................ 118
TABLE 29; SUMMARY OF ALL IDENTIFIED METRICS MEASURED WITHIN ALL INVESTIGATED DEPARTMENTS AT VLC ........................ 119
Supplier performance dashboard at Volvo Logistics
xi
List of abbreviations
A4D Application For(4) Distribution
APAC Asia & Pacific
ATLAS Advanced Transport Logistics for Automotive Supply
BAS Business Analysis System
BI Business Intelligence
CIC Contracting & Invoice control
CSR Corporate Social Responsibility
EBD Enterprise Buyer Desktop
EDI Electronic Data Integration
EMEA Europe, Middle East & Africa
FADS Forwarding Administration System
GBO Global Business Operations
I&CC Invoicing & Cost Control
JIT Just-in-time
KPI Key Performance Indicator
LES Logistics Enterprise Solution
NAM North Americas
NAP Non-Automotive Products
POC Proof of Collection
POD Proof of Delivery
PS&S Purchasing Strategy & Support
RFI Request for Information
RMS Risk Management System
SAP Systems, Applications and Products in Data Processing
SFUR Special Follow-Up Routine
SOP Standard Operating Procedure
TIR Transport Information Routines
TMR Trigger, measureable time period and record
VBS Volvo Business Services
V-EMS Volvo Emballage Management System
VLC Volvo Logistics
Supplier performance dashboard at Volvo Logistics
1
1 Introduction The introductory chapter starts with a brief background to the topic of this thesis and its relevance in
a broader context. Thereafter, a company background is provided followed by the purpose and the
research questions. The chapter ends with delimitations and a description of the report disposition.
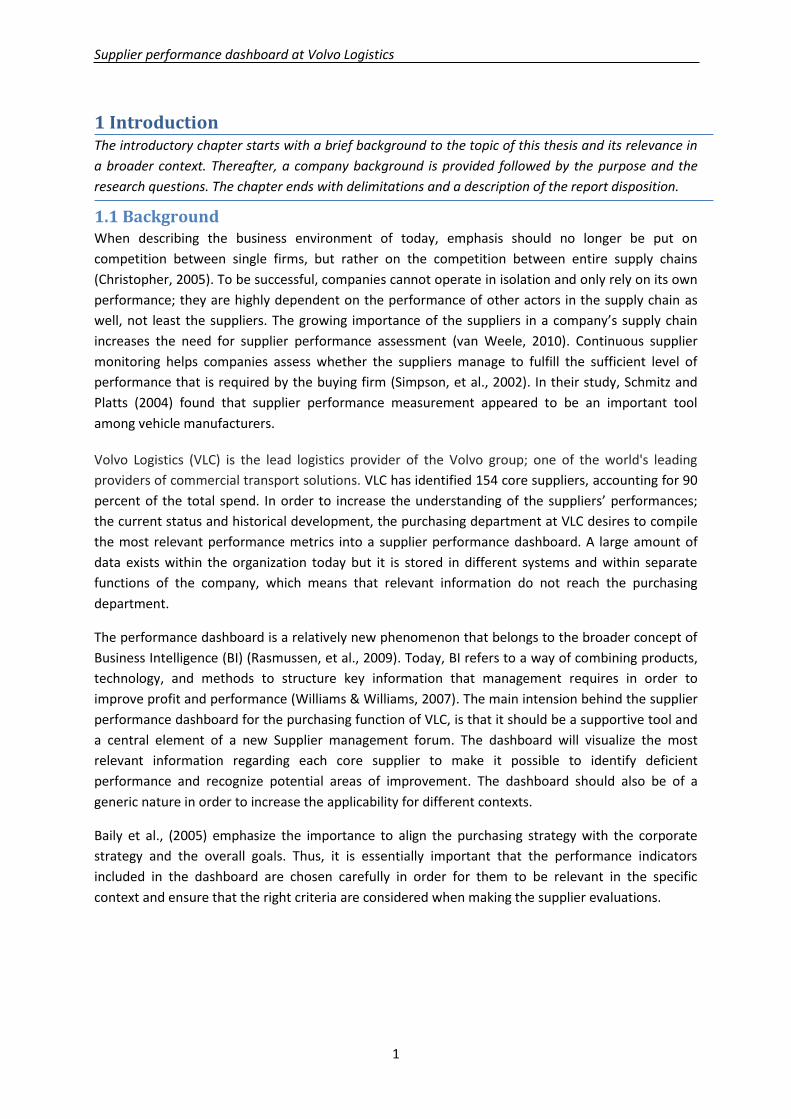
1.1 Background When describing the business environment of today, emphasis should no longer be put on
competition between single firms, but rather on the competition between entire supply chains
(Christopher, 2005). To be successful, companies cannot operate in isolation and only rely on its own
performance; they are highly dependent on the performance of other actors in the supply chain as
well, not least the suppliers. The growing importance of the suppliers in a company’s supply chain
increases the need for supplier performance assessment (van Weele, 2010). Continuous supplier
monitoring helps companies assess whether the suppliers manage to fulfill the sufficient level of
performance that is required by the buying firm (Simpson, et al., 2002). In their study, Schmitz and
Platts (2004) found that supplier performance measurement appeared to be an important tool
among vehicle manufacturers.
Volvo Logistics (VLC) is the lead logistics provider of the Volvo group; one of the world's leading
providers of commercial transport solutions. VLC has identified 154 core suppliers, accounting for 90
percent of the total spend. In order to increase the understanding of the suppliers’ performances;
the current status and historical development, the purchasing department at VLC desires to compile
the most relevant performance metrics into a supplier performance dashboard. A large amount of
data exists within the organization today but it is stored in different systems and within separate
functions of the company, which means that relevant information do not reach the purchasing
department.
The performance dashboard is a relatively new phenomenon that belongs to the broader concept of
Business Intelligence (BI) (Rasmussen, et al., 2009). Today, BI refers to a way of combining products,
technology, and methods to structure key information that management requires in order to
improve profit and performance (Williams & Williams, 2007). The main intension behind the supplier
performance dashboard for the purchasing function of VLC, is that it should be a supportive tool and
a central element of a new Supplier management forum. The dashboard will visualize the most
relevant information regarding each core supplier to make it possible to identify deficient
performance and recognize potential areas of improvement. The dashboard should also be of a
generic nature in order to increase the applicability for different contexts.
Baily et al., (2005) emphasize the importance to align the purchasing strategy with the corporate
strategy and the overall goals. Thus, it is essentially important that the performance indicators
included in the dashboard are chosen carefully in order for them to be relevant in the specific
context and ensure that the right criteria are considered when making the supplier evaluations.
Supplier performance dashboard at Volvo Logistics
2
1.2 Company background – the Volvo Group The Volvo Group was founded in 1927 by Gustaf Larson and Assar Gabrielsson, in Gothenburg,
Sweden. Today, the company is a world leading provider of commercial transport solutions including
products such as; trucks, buses, engines, construction equipment, aircraft engine components and
drive shafts for boats and industrial applications as well as financial solutions and an increasing
number of other services (AB Volvo, 2012). The Volvo Group employs approximately 100 000 people
with production facilities in 19 countries and sales activities in totally 180 different markets with Net
sales for 2011 of 310,367 MSEK and an Operating income of 26,899 MSEK (Volvo Group, 2012)
The Volvo Group operates according to three core values; safety, quality and environmental care.
These values are an important part of the corporate culture and they serve as a foundation to the
company’s products and operations. Volvo aims at maintaining a leading position within these areas
(AB Volvo, 2012).
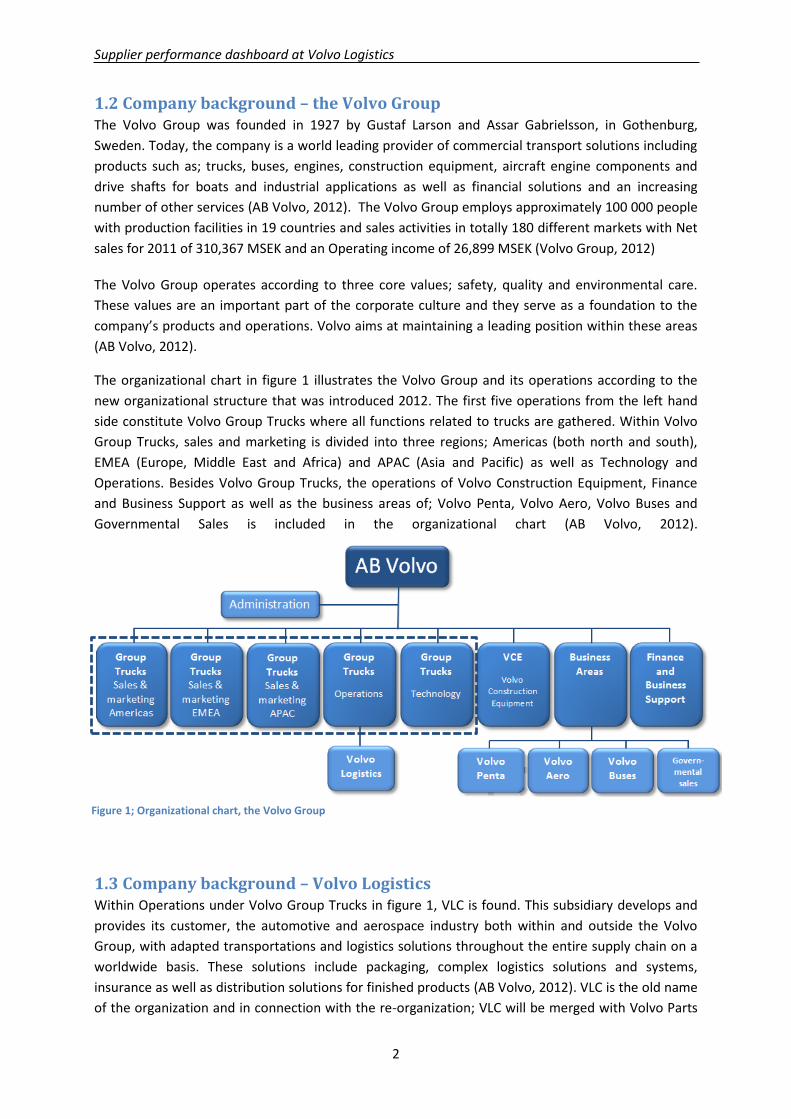
The organizational chart in figure 1 illustrates the Volvo Group and its operations according to the
new organizational structure that was introduced 2012. The first five operations from the left hand
side constitute Volvo Group Trucks where all functions related to trucks are gathered. Within Volvo
Group Trucks, sales and marketing is divided into three regions; Americas (both north and south),
EMEA (Europe, Middle East and Africa) and APAC (Asia and Pacific) as well as Technology and
Operations. Besides Volvo Group Trucks, the operations of Volvo Construction Equipment, Finance
and Business Support as well as the business areas of; Volvo Penta, Volvo Aero, Volvo Buses and
Governmental Sales is included in the organizational chart (AB Volvo, 2012).
1.3 Company background – Volvo Logistics Within Operations under Volvo Group Trucks in figure 1, VLC is found. This subsidiary develops and
provides its customer, the automotive and aerospace industry both within and outside the Volvo
Group, with adapted transportations and logistics solutions throughout the entire supply chain on a
worldwide basis. These solutions include packaging, complex logistics solutions and systems,
insurance as well as distribution solutions for finished products (AB Volvo, 2012). VLC is the old name
of the organization and in connection with the re-organization; VLC will be merged with Volvo Parts
Figure 1; Organizational chart, the Volvo Group
Supplier performance dashboard at Volvo Logistics
3
Dealer Supplier
Emballage
Factory
Inbound Outbound
under the name of Logistic Services. Since the thesis work was initiated before the new organization
was implemented, the investigation and the associated findings will be presented according to the
old organizational structure and the company will be addressed as Volvo Logistics.
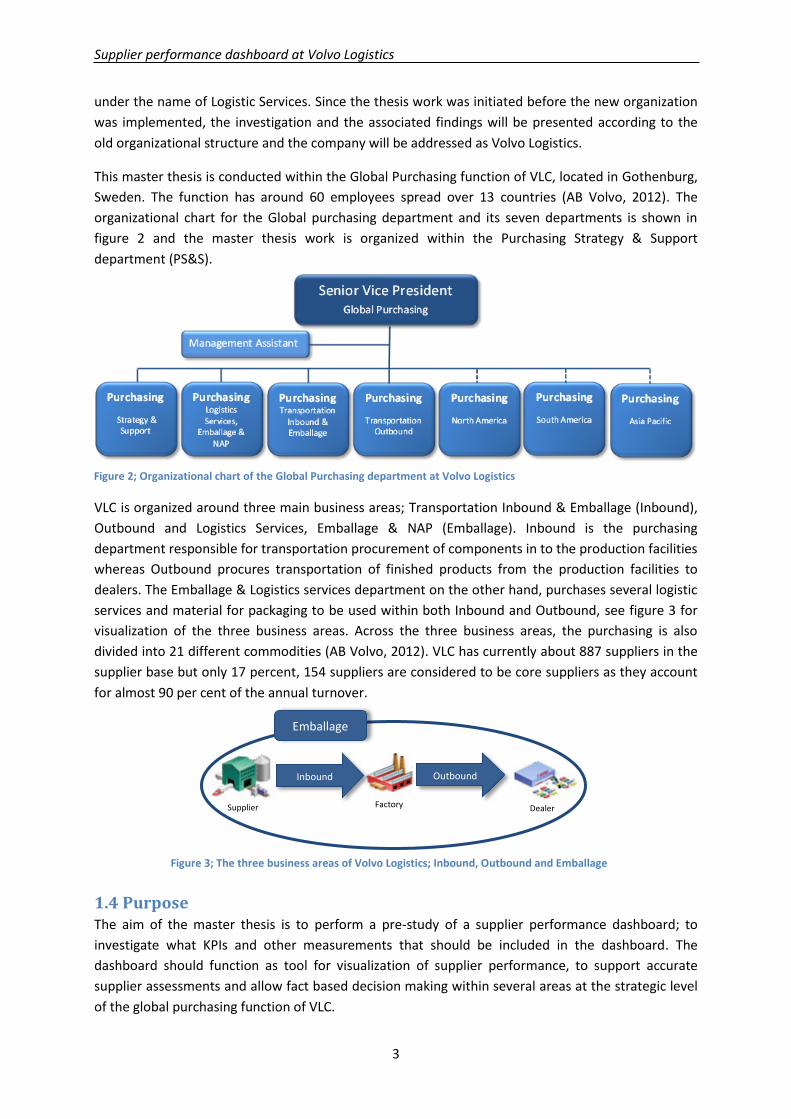
This master thesis is conducted within the Global Purchasing function of VLC, located in Gothenburg,
Sweden. The function has around 60 employees spread over 13 countries (AB Volvo, 2012). The
organizational chart for the Global purchasing department and its seven departments is shown in
figure 2 and the master thesis work is organized within the Purchasing Strategy & Support
department (PS&S).
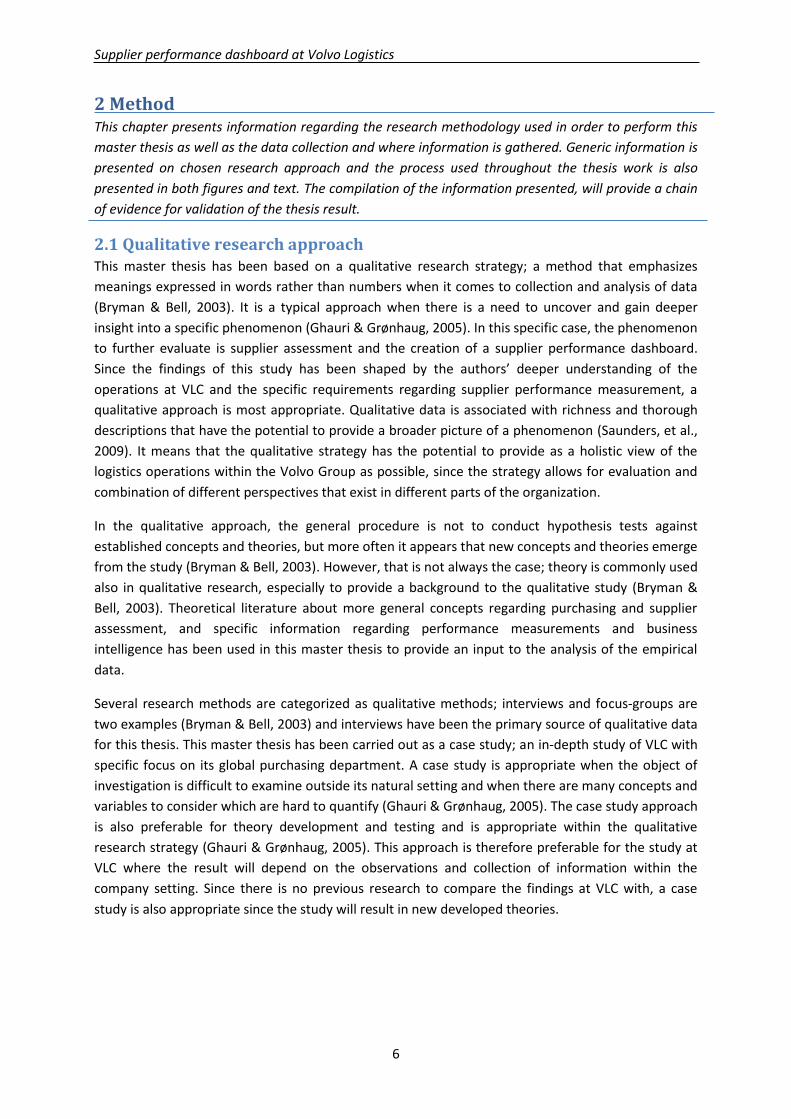
VLC is organized around three main business areas; Transportation Inbound & Emballage (Inbound),
Outbound and Logistics Services, Emballage & NAP (Emballage). Inbound is the purchasing
department responsible for transportation procurement of components in to the production facilities
whereas Outbound procures transportation of finished products from the production facilities to
dealers. The Emballage & Logistics services department on the other hand, purchases several logistic
services and material for packaging to be used within both Inbound and Outbound, see figure 3 for
visualization of the three business areas. Across the three business areas, the purchasing is also
divided into 21 different commodities (AB Volvo, 2012). VLC has currently about 887 suppliers in the
supplier base but only 17 percent, 154 suppliers are considered to be core suppliers as they account
for almost 90 per cent of the annual turnover.
1.4 Purpose The aim of the master thesis is to perform a pre-study of a supplier performance dashboard; to
investigate what KPIs and other measurements that should be included in the dashboard. The
dashboard should function as tool for visualization of supplier performance, to support accurate
supplier assessments and allow fact based decision making within several areas at the strategic level
of the global purchasing function of VLC.
Figure 2; Organizational chart of the Global Purchasing department at Volvo Logistics
Figure 3; The three business areas of Volvo Logistics; Inbound, Outbound and Emballage
Supplier performance dashboard at Volvo Logistics
4
1.5 Problem analysis and research questions The main issue within the purchasing function of VLC that the supplier performance dashboard is
intended to address is that data about supplier performance is not easily accessible, particularly in
the case of operational performance. It is known that a larger part of the information is measured
and stored somewhere in the organization today, but there is no exact view of what information
exists and it is not possible to get a holistic view of a supplier’s level of performance within the most
relevant aspects. By replacing gut feeling with facts, the conditions for more efficient decision making
should increase. Furthermore, a supplier performance dashboard is intended to detect deficient
performance and identify potential areas for supplier performance improvement. The main
requirements of the supplier performance dashboard as expressed by VLC are:
Provide a holistic view of the most important measurements of a supplier’s performance.
Be generic in order to be easy to grasp and to be applicable in different contexts.
Have a global coverage as far as possible.
The implementation of a dashboard should be feasible and not require too many resources.
In order to understand the processes of supplier evaluation at VLC and what requirements they have
on their suppliers, it is important to map the current situation; what evaluation practices are used
today, how frequently they are performed and to what extent this information is shared, between
the departments and with the suppliers. Therefore, to find an answer to the following research
question is relevant:
1. How is the supplier performance evaluation process currently carried out at VLC?
Baily et al., (2005) emphasize the importance to align the purchasing strategy with the corporate
strategy and the overall goals. Therefore, it is essentially important that the performance indicators
included in the dashboard are chosen carefully in order for them to be relevant in the specific
context and the right criteria are considered when making the supplier evaluations. This also means
that the chosen Key Performance Indicators (KPIs) and measurements should represent the complex
organizational structure by the inclusion of measurements and KPIs from all relevant departments.
The KPIs and measurements included in the dashboard should be evaluated according to different
characteristics and requirements. This reasoning should be kept in mind when answering the second
research question:
2. What performance indicators should be included in the Supplier performance dashboard?
Based on the findings in the previous questions, it is important to further investigate where the
information is stored and how the data can be accessed. Some of the relevant information for the
dashboard is accessible through the purchasing department’s current supplier assessment work.
However, important information intended for the Supplier performance dashboard does not reach
the purchasing department at VLC today. A large amount of data is measured and stored in different
information systems in different departments and operations within VLC and it is essential to map
what data is measured, how it is measured and where it is stored. The answers to the last research
questions aim to clarify where the relevant data can be found and how to identify it.
3a. Where is the information relevant for the Supplier performance dashboard stored?
3b. How can the information relevant for the Supplier performance dashboard be identified?
Supplier performance dashboard at Volvo Logistics
5
1.6 Delimitations It is not within the scope of this thesis to technically create, or program a dashboard, but to develop
recommendations and guidelines for how the dashboard should be designed and from where to
collect data. Furthermore, the technical solutions required for transferring of data between different
systems will not be covered in this thesis.
The measurements considered for inclusion in the dashboard are all KPIs and metrics currently
measured within the VLC organization. Suggestions or recommendations on inclusion of metrics not
measured today within the VLC organization will therefore not be made.
The overall discussion regarding supplier performance evaluation and the use of dashboards as a tool
to achieve this is general and will be applicable to other organizations. However, the more detailed
information regarding empirical findings within the different departments of VLC is more difficult to
generalize to other areas of application.
1.7 Report disposition This thesis is structured with seven different chapters, each with a specific focus and different
purposes to be fulfilled. The different chapters and their focus are presented in table 1 below:
Table 1; Report disposition
Chapter Objective
Chapter 1; Introduction
The first chapter provides an introduction to both the purpose of the thesis, the research questions, the concept of a dashboard and the Volvo group
Chapter 2; Methodology
The methodology chapter provides information on the research methodology as well as the process used while writing this thesis
Chapter 3; Theoretical findings
Within the theory chapter, the reader will gain background information regarding purchasing and supplier assessment in general and more detailed information regarding the subjects of performance measurements and business intelligence in particular.
Chapter 4; Empirical findings
The empirical chapter describes the current state of supplier assessment within VLC. The chapter is structured around three main areas of investigation; dashboard requirements; the supplier base and the supplier measurements performed within the departments of VLC.
Chapter 5; Analysis
The findings within chapter 3 and 4 are merged within the analysis chapter where the research questions are analyzed. This chapter contains the evaluation of possible KPIs for the dashboard as well as visualization
Chapter 6; Conclusions
The conclusions in chapter 6 will answer the research questions presented in chapter 1 together with other conclusions and findings relevant for VLC, made in the process of this thesis
Chapter 7; Recommendations
In chapter 7 recommendations for VLC on how to design and proceed with the supplier performance dashboard is given
References The list of references provides the reader with all information on the sources of the literature used within this report
Appendices The appendices contains information such as list of interviewees, interview guides and other information relevant for this thesis
Supplier performance dashboard at Volvo Logistics
6
2 Method This chapter presents information regarding the research methodology used in order to perform this
master thesis as well as the data collection and where information is gathered. Generic information is
presented on chosen research approach and the process used throughout the thesis work is also
presented in both figures and text. The compilation of the information presented, will provide a chain
of evidence for validation of the thesis result.
2.1 Qualitative research approach This master thesis has been based on a qualitative research strategy; a method that emphasizes
meanings expressed in words rather than numbers when it comes to collection and analysis of data
(Bryman & Bell, 2003). It is a typical approach when there is a need to uncover and gain deeper
insight into a specific phenomenon (Ghauri & Grønhaug, 2005). In this specific case, the phenomenon
to further evaluate is supplier assessment and the creation of a supplier performance dashboard.
Since the findings of this study has been shaped by the authors’ deeper understanding of the
operations at VLC and the specific requirements regarding supplier performance measurement, a
qualitative approach is most appropriate. Qualitative data is associated with richness and thorough
descriptions that have the potential to provide a broader picture of a phenomenon (Saunders, et al.,
2009). It means that the qualitative strategy has the potential to provide as a holistic view of the
logistics operations within the Volvo Group as possible, since the strategy allows for evaluation and
combination of different perspectives that exist in different parts of the organization.
In the qualitative approach, the general procedure is not to conduct hypothesis tests against
established concepts and theories, but more often it appears that new concepts and theories emerge
from the study (Bryman & Bell, 2003). However, that is not always the case; theory is commonly used
also in qualitative research, especially to provide a background to the qualitative study (Bryman &
Bell, 2003). Theoretical literature about more general concepts regarding purchasing and supplier
assessment, and specific information regarding performance measurements and business
intelligence has been used in this master thesis to provide an input to the analysis of the empirical
data.
Several research methods are categorized as qualitative methods; interviews and focus-groups are
two examples (Bryman & Bell, 2003) and interviews have been the primary source of qualitative data
for this thesis. This master thesis has been carried out as a case study; an in-depth study of VLC with
specific focus on its global purchasing department. A case study is appropriate when the object of
investigation is difficult to examine outside its natural setting and when there are many concepts and
variables to consider which are hard to quantify (Ghauri & Grønhaug, 2005). The case study approach
is also preferable for theory development and testing and is appropriate within the qualitative
research strategy (Ghauri & Grønhaug, 2005). This approach is therefore preferable for the study at
VLC where the result will depend on the observations and collection of information within the
company setting. Since there is no previous research to compare the findings at VLC with, a case
study is also appropriate since the study will result in new developed theories.
Supplier performance dashboard at Volvo Logistics
7
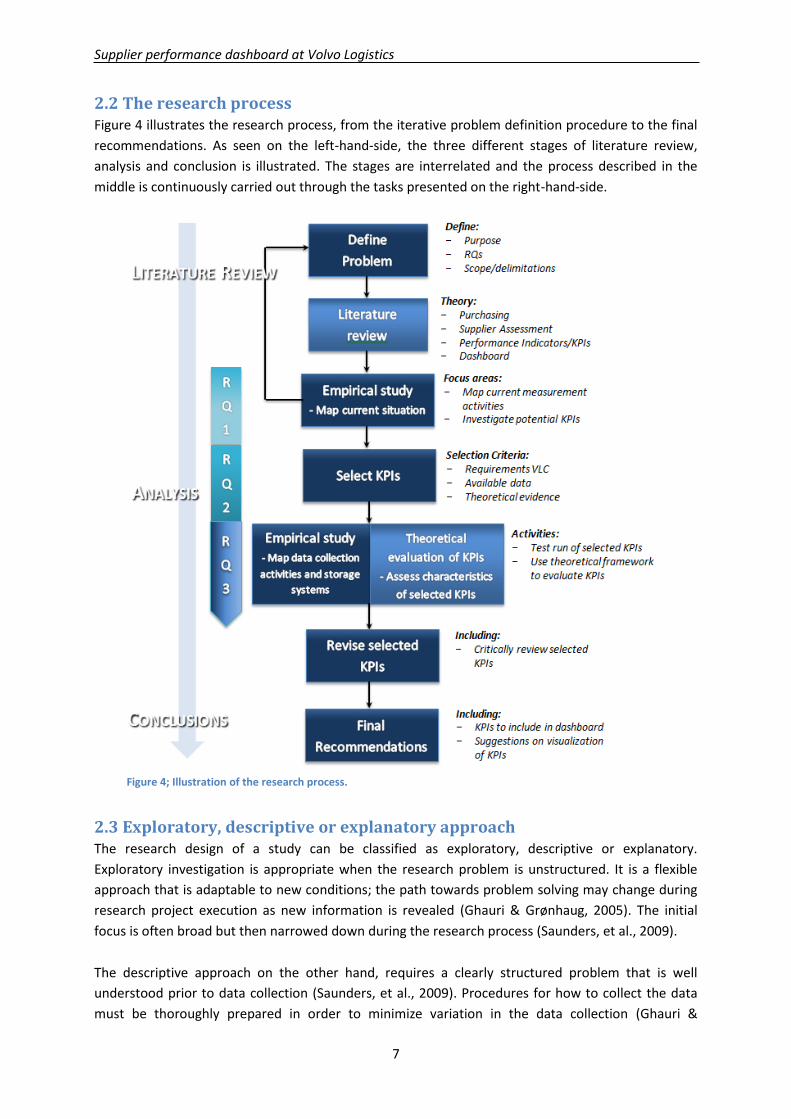
2.2 The research process Figure 4 illustrates the research process, from the iterative problem definition procedure to the final
recommendations. As seen on the left-hand-side, the three different stages of literature review,
analysis and conclusion is illustrated. The stages are interrelated and the process described in the
middle is continuously carried out through the tasks presented on the right-hand-side.
2.3 Exploratory, descriptive or explanatory approach The research design of a study can be classified as exploratory, descriptive or explanatory.
Exploratory investigation is appropriate when the research problem is unstructured. It is a flexible
approach that is adaptable to new conditions; the path towards problem solving may change during
research project execution as new information is revealed (Ghauri & Grønhaug, 2005). The initial
focus is often broad but then narrowed down during the research process (Saunders, et al., 2009).
The descriptive approach on the other hand, requires a clearly structured problem that is well
understood prior to data collection (Saunders, et al., 2009). Procedures for how to collect the data
must be thoroughly prepared in order to minimize variation in the data collection (Ghauri &
Figure 4; Illustration of the research process.
Supplier performance dashboard at Volvo Logistics
8
Grønhaug, 2005). The third approach, explanatory, or casual research, seeks to find casual
relationships between variables (Saunders, et al., 2009). The purpose is to identify and isolate causes
in order to determine to what extent a specific cause results in an effect (Ghauri & Grønhaug, 2005).
This study has, to a large extent, been characterized by an exploratory approach as the different
issues related to the research problem are not revealed from the beginning. A part of our study is to
investigate what type of data is stored within different computer systems within VLC; information
that will determine the possibilities for the creation of a supplier performance dashboard. It means
that some issues may be solved, while others occur during the process; the research direction will
change as new information is revealed until it eventually leads to the final findings and
recommendations on the design of the dashboard.
2.4 Research strategy The qualitative research approach used in this thesis, as described in chapter 2.1 is often connected
to the inductive strategy when linking data and theory together (Bryman & Bell, 2003). The inductive
strategy, which has been used throughout this report, is one of two possible strategies where the
other is the deductive approach. In the inductive strategy, a theory is the outcome of the research
performed. From the empirical observations and findings discovered, generalized conclusions are
made and the outcome of the research performed will result in a theory (Bryman & Bell, 2003;
Ghauri & Grønhaug, 2005). The deductive strategy on the other hand, describes the relationship
between theory and research; an initial hypothesis is empirically inspected and the theory guides the
research (Bryman & Bell, 2003).
Another wording is that deduction is based on logic whereas induction is based on empirical
evidence (Ghauri & Grønhaug, 2005). Although this thesis is built upon the inductive strategy,
deductive parts have been included. This is a natural way where inductive elements are performed
within the deductive strategy and the other way around (Bryman & Bell, 2003; Ghauri & Grønhaug,
2005). That the inductive approach is the main one within this thesis is seen in the structure of the
report, where theoretical and empirical findings form the basis for analysis and drawings of general
conclusions.
2.5 Data collection and data analysis The data that has been used in this master thesis consists of both primary and secondary sources of
information. Primary data is collected for a particular case and can be gathered through experiments,
observations, surveys and interviews (Ghauri & Grønhaug, 2005). In this study, interviews have
formed the basis for the primary data. Interviews has been chosen as the primary source of
information since it allows for a deeper investigation into the supplier performance evaluation
conducted at the different departments at VLC, in a way that standardized surveys would not be able
to provide.
The secondary data has been collected through an extensive literature review including academic
journals, books and carefully chosen trade magazines. Internal documents and annual reports of AB
Volvo has also been useful material for the gathering of secondary data. One advantage of secondary
data is that it saves time and money; it facilitates the understanding of the research problem and
enhances the reliability of the research findings (Ghauri & Grønhaug, 2005). In contrast, a
disadvantage presented by Ghauri and Grønhaug (2005) is that the secondary data may not fit the
Supplier performance dashboard at Volvo Logistics
9
specific problem; therefore, it is important to identify what particular information is needed and
gather data from that perspective. Table 2 illustrates what type of data that has been collected and
applied in order to answer each research question.
Table 2; Description of the sources of data that have been applied in order to answer the different research questions.
Research Question Theoretical evidence Empirical evidence
RQ 1: How is the supplier performance evaluation process currently carried out at VLC?
- Literature on purchasing in general and supplier assessment and evaluation in particular.
- Interviews with employees within different relevant departments within the VLC organization. See appendix 1 and 2 for further details. - Review of internal documentation - Observations
RQ 2: What performance indicators should be included in the Supplier performance dashboard?
- Information regarding performance measurements and a compilation of transportation related performance measurements presented in academic literature. - Present characteristics and other detailed information regarding performance indicators. - Relate to the general responsibilities of the purchasing function and investigate whether a dashboard is relevant for the objectives of the purchasing function or not. - Also include literature on the design of dashboards and the broader scope of Business Intelligence.
- Thorough interviews within VLC; map what is actually measured within VLC today and verify that data is accessible and consistently defined. - Relate to corporate strategy and goals -Interviews with buyers and key users/stakeholders of the dashboard to clarify basic requirements - Interviews with suppliers to gain insight in their attitude towards a Supplier performance dashboard and to investigate possible transformation of data from the supplier through self-reporting.
RQ 3a: Where is the information relevant for the Supplier performance dashboard stored?
N/A -Interviews with employees within relevant departments of VLC to identify in what systems and what format different measurements are stored
RQ 3b: How can the information relevant for the Supplier performance dashboard be identified?
N/A -Interviews with employees within relevant departments of VLC to identify how the performed measurements are linked to suppliers and what type and level of identification are used.
Supplier performance dashboard at Volvo Logistics
10
2.5.1 Literature review
In order to deepen our understanding of the research topic and to map previous research within the
field, an extensive literature review has been carried out. Academic journals in databases accessed
through the library of Chalmers University of Technology and books written by recognized experts
have been the primary sources of literature. As the concept of supplier performance dashboards is
relatively new and the subject has not yet been explored to any larger extent in scientific research,
but still, has attained considerable interest among managers and consultants, trade magazines and
Internet webpages have been studied in order to broaden our understanding of the most recent
trends.
The search for literature began in a broad scope where the findings helped us gain a basic knowledge
regarding the subject. When searching for academic articles, different approaches have been
applied. Free searches in the databases with the following key words have been one approach;
and Key Performance Indicators. A more systematic strategy has also been applied; to examine
relevant journals ten years back in time in order to find applicable literature. The findings have then
been scanned, categorized and analyzed in order to narrow the scope and pick the most interesting
literature for a more in-depth learning. This literature have also formed the foundation of chapter
three, the theory chapter; the framework that have been the basis for the analysis of the empirical
data.
As a part of the empirical investigation internal documents provided by VLC concerning previous and
current supplier assessment work and supplier contracts has been studied. Official documents about
supplier requirements accessed through the Volvo Group homepage have also been examined. These
documents has been valuable since it have deepen our understanding of the core values of the Volvo
Group and to understand which supplier performance measures are most important in their
organization.
2.5.2 Interviews
To get an understanding and gain empirical data of the current situation at the Global purchasing
department as well as other departments within Volvo Logistics that have information needed for
the supplier performance dashboard, a number of interviews have been carried out. In the start-up
of the thesis work, interviews of a more unstructured nature have been carried out as a pre-study to
gain basic knowledge of the organization and the expectations on the supplier performance
dashboard, more general interview guides have been formalized for these interviews due to their
unstructured nature.
The pre-study interviews have been followed by interviews held with relevant employees from the
functions within the different departments that hold information needed for deeper knowledge or to
create and design the supplier performance dashboard. In total, interviews with 35 interviewees
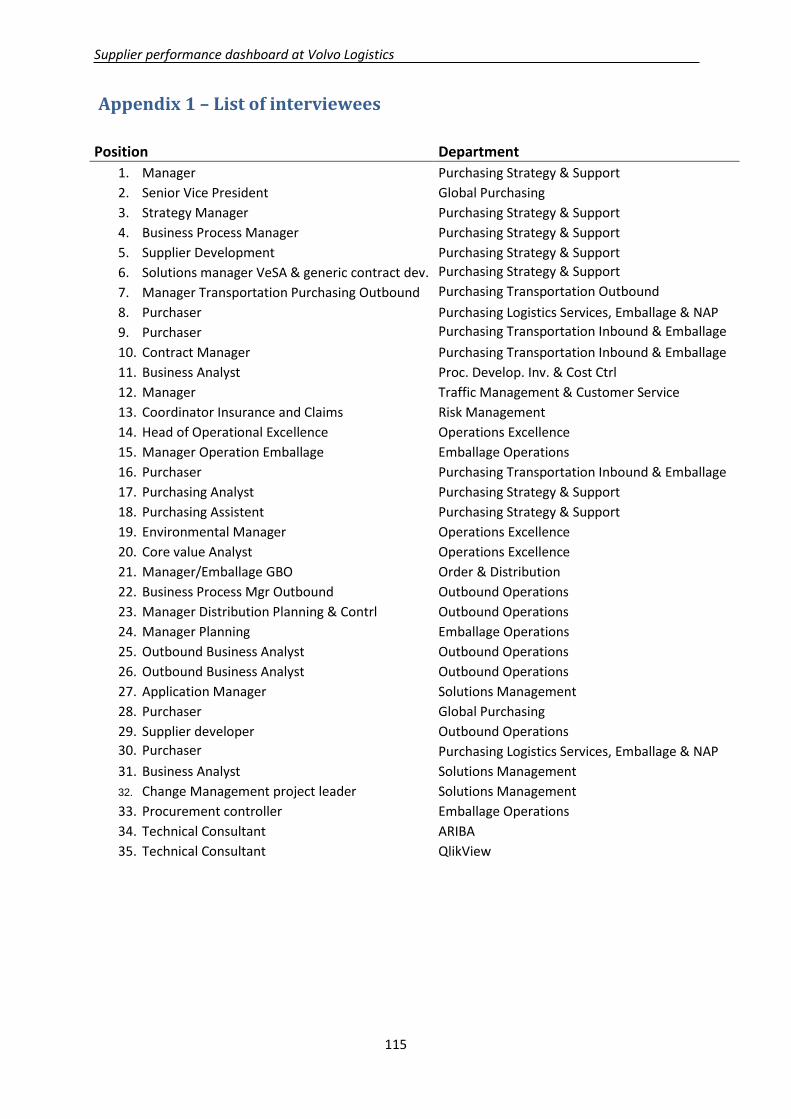
have been conducted in order to find empirical evidence for this thesis. For a list of interviewees, see
appendix 1. These interviews have been qualitative semi-structured, which means that they have
been structured to a certain degree but the structure also gives the interviewees the opportunity to
speak freely about the issues discussed (Bryman & Bell, 2011). The tape recordings from the
interviewees have received the main questions or interview guide in beforehand, in order for them
to access relevant information from within their department before the interview. A generic
Supplier performance dashboard at Volvo Logistics
11
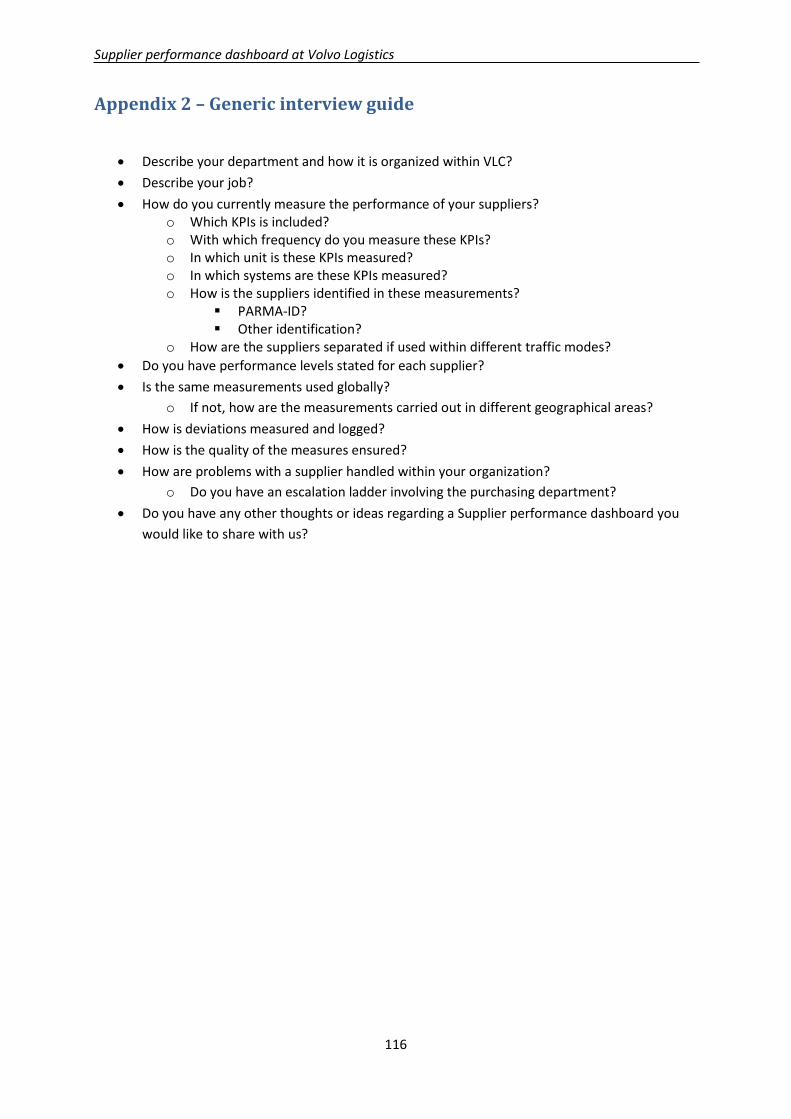
template of the interview guides is found in appendix 2, in addition to these generic questions more
specific and detailed questions may have been added to each different interview. The interviews
have been tape-recorded and notes have also been taken throughout the session, since this
combination is seen as the most useful when collecting data (Ghauri & Grønhaug, 2005). The
interviews have also been transcribed to make sure that no information is lost in translation. Due to
secrecy issues, the names of all interviewees as well as suppliers discussed will remain anonymous
throughout this report.
Interviews have also been conducted with a small number of selected suppliers in order to gain an
understanding of their overall attitude towards a supplier performance dashboard and the
possibilities to exchange data. These interviews have taken place in the later stage of the thesis
process when the concept regarding the supplier performance dashboard are formed and can be
discussed with the selected suppliers. The suppliers have been selected among the top suppliers
within the business areas of Inbound and Outbound as well as a spread between different traffic
modes. The interview guide used for these interviews is of a more standardized nature then the ones
used within VLC and the responses have been gathered through mail conversations, telephone
meetings as well as personal meetings. See appendix 3 for an anonymous list of interviewed
suppliers and an interview guide with questions.
A set of questions have also been sent via e-mail to the purchasers located at the Gothenburg office
in order to investigate which KPIs and measurements they find most important when evaluating a
supplier. The purchasers were asked to rank the most important KPIs and measurements according
to the interview guide found in appendix 4, where also the results of the survey are presented. As for
the interview guide used for the interviews with the top suppliers, this interview guide is more
standardized compared to the ones used during the interviews with internal employees.
2.6 Validity and reliability An aspect to consider regarding the research result is that the obtained knowledge is valid and that
the results are true, something that can be measured through the reliability and validity of the report
(Ghauri & Grønhaug, 2005). These are different types of measures of the rigor, quality and further
potential of the research (Bryman & Bell, 2003).
Validity refers to that performed measurements captures what they are supposed to do (Ghauri &
Grønhaug, 2005) or that observations, identifications or measurements are what they say it is
(Bryman & Bell, 2003). Since numerical measurements are not a part of this qualitative study,
Bryman and Bell’s (2003) definition of observation and identification is more appropriate to apply to
this study. They state that validity can be categorized as either internal or external, where the
internal validity means that there is a good match between the theoretical ideas developed and the
researcher’s observation (Bryman & Bell, 2003). According to Ghauri and Grønhaug (2005) internal
validity means that the results derived within the study is true.
External validity on the other hand, deals with the possibility of generalizing the findings from the
research. Such generalization could be for other populations or time periods leading to the
importance of sample procedures in quantitative studies (Ghauri & Grønhaug, 2005). In qualitative
studies, external validity instead, deals with generalization of the findings across social settings; it
may become a problem when the findings are derived from small and precise case studies (Bryman &
Supplier performance dashboard at Volvo Logistics
12
Bell, 2003). For this report, the validity in general and the external validity in particular need to be
determined from the scope of the case study. The performance of suppliers investigated is for
services and logistic services in particular, leading to a generalization possible within these fields.
The reliability refers to the stability of the measures (Ghauri & Grønhaug, 2005) and external and
internal reliability is found here as well. The external reliability refers to what degree a study can be
replicated and more useable within quantitative studies (Bryman & Bell, 2003). For qualitative
studies like this one, it is harder to replicate the study due to the impossibility of freezing a social
setting or find an exact replica where the study can be performed again. However, the internal
reliability is more applicable to this report since the research team consists of two people and that
internal reliability means that the members of the research team is in agreement of what is said and
heard (Bryman & Bell, 2003).
2.6.1 Validity and reliability in the literature review
To ensure the validity and reliability of the literature review included in this thesis, the data used are
from trustworthy sources. The majority of the data is found through the databases provided by the
library of Chalmers University of Technology and seen as credible. The published articles are also
taken from journals within the studied field in order for the information to be accurate and
applicable to our purpose. When data is gathered from other sources than acknowledged scientific
databases, the information is examined carefully to make sure that the authors do not provide a
biased viewpoint and if so, that the topic at hand is viewed through other sources as well.
2.6.2 Validity and reliability in the interviews
For the interviews conducted, the validity and reliability is ensured mostly through the agreement
between the authors on what has been said and done. When each interview is finished, a specific
time period is set-aside in order for the interviewers to individually evaluate and jointly discuss on
what the interviewee stated. As mentioned earlier, all interviews have been recorded and the tape-
recordings have been transcribed, besides the notes taken during the interview in order to guarantee
that no details are lost.
Supplier performance dashboard at Volvo Logistics
13
3 Theoretical framework The theoretical framework presented in this chapter will provide the basic knowledge within the
topic of this thesis as well as serve as the basis for the analysis of the empirical findings in chapter 4.
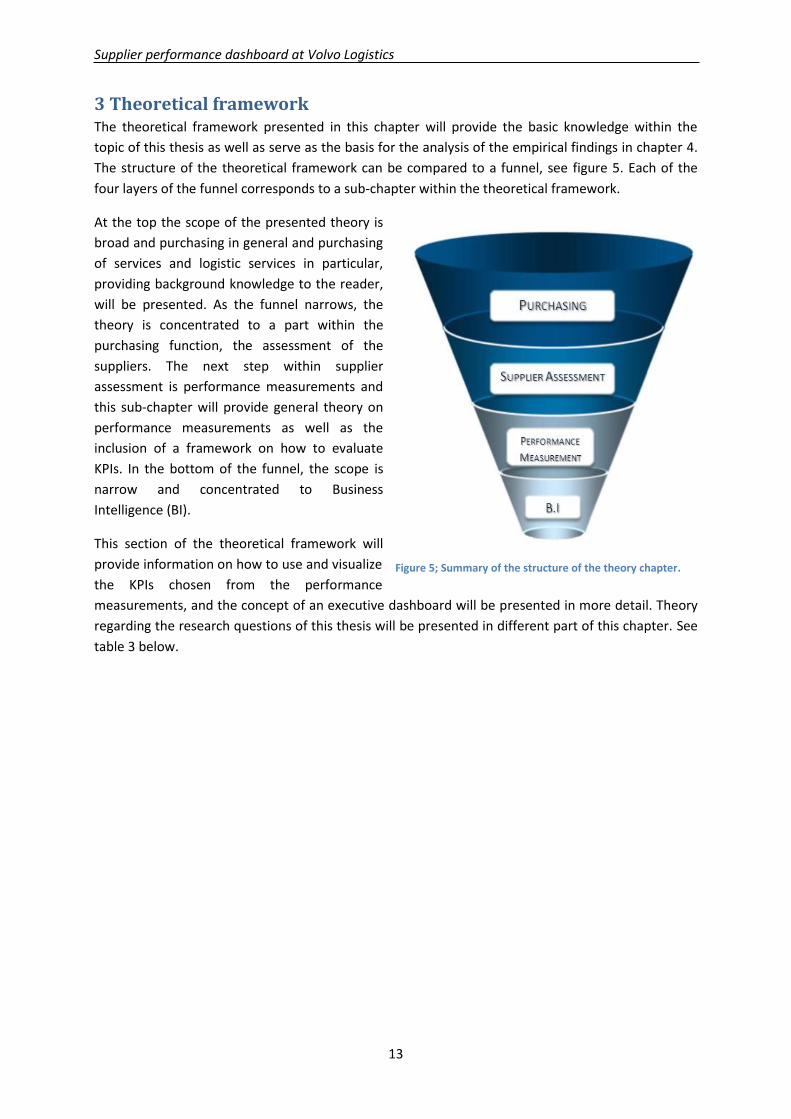
The structure of the theoretical framework can be compared to a funnel, see figure 5. Each of the
four layers of the funnel corresponds to a sub-chapter within the theoretical framework.
At the top the scope of the presented theory is
broad and purchasing in general and purchasing
of services and logistic services in particular,
providing background knowledge to the reader,
will be presented. As the funnel narrows, the
theory is concentrated to a part within the
purchasing function, the assessment of the
suppliers. The next step within supplier
assessment is performance measurements and
this sub-chapter will provide general theory on
performance measurements as well as the
inclusion of a framework on how to evaluate
KPIs. In the bottom of the funnel, the scope is
narrow and concentrated to Business
Intelligence (BI).
This section of the theoretical framework will
provide information on how to use and visualize
the KPIs chosen from the performance
measurements, and the concept of an executive dashboard will be presented in more detail. Theory
regarding the research questions of this thesis will be presented in different part of this chapter. See
table 3 below.
Figure 5; Summary of the structure of the theory chapter.
Supplier performance dashboard at Volvo Logistics
14
PURCHASING
SUPPLIER ASSESSMENT
PERFORMANCE MEASUREMENT
BUSINESS INTELLIGENCE
Table 3; Description of what theoretical data will be used in order to answer the different research questions.
Research Question Theoretical evidence
RQ 1: How is the supplier performance evaluation process currently carried out at VLC?
- Literature on purchasing in general and supplier assessment and evaluation in particular. - General structure of the buyer-supplier relationship and related complexities. - Description of the theoretical buying process and in which stage(s) the dashboard may be relevant. - Description of what is meant by supplier assessment in order to compare the appropriateness of a dashboard in this context.
RQ 2: What performance indicators should be included in the supplier performance dashboard?
- The objectives of purchasing which are directly related to the requirements on the dashboard and what information to include. - Characteristics of performance measurements to clarify what different types of measurements that are described in theory. - Identification of transportation related performance measurements in academic literature. - Also include literature on the design of dashboards and the broader scope of Business Intelligence. - Description of the benefits and potential pitfalls of a dashboard in order to adjust the information to avoid the pitfalls and utilize the benefits.
RQ 3a: Where is the information relevant for the Supplier performance dashboard stored?
N/A
RQ 3b: How can the information relevant for the Supplier performance dashboard be identified?
N/A
3.1 Purchasing Purchasing is traditionally described as the function
that performs the process of buying; from identifying
the needs to ensuring final delivery of product or
service (van Veele , 2005). Van Veele (2005) defines
purchasing as: “The management of the company’s
external resources in such a way that the supply of all
goods, services, capabilities and knowledge which are
necessary for running, maintaining and managing the
company’s primary and support activities is secured at
the most favorable conditions”. The following list is
presented by Baily et al. (2005) and includes the main
objectives of the purchasing function:
Supplier performance dashboard at Volvo Logistics
15
To meet the needs of the organization through supply of materials and services.
To maintain effective relationships with existing suppliers and develop alternative sources of
supply in order to ensure continuous supply.
To buy efficiently and wisely. With ethical means, obtain the best value for the money spent.
To maintain cooperative relationships with other departments; ensure effective operations
of the company as a whole through sharing of information and advices.
To develop staff, policies, procedures and organization to ensure achievement of the
objectives.
The authors are also describing some more detailed objectives of purchasing (Baily, et al., 2005):
To select the best suppliers in the market.
To support effective development of new products.
To look after the company’s cost structure.
To maintain a correct balance between quality and value.
To monitor supply market trends.
To negotiate effectively in order to collaborate with suppliers who seek mutual benefit
through economically superior performance.
To perform supply management in an environmentally responsible way.
The importance of purchasing has steadily increased in recent years and many organizations of today
see it as a function of considerable strategic importance (Baily, et al., 2005). As companies
increasingly focus on its core competencies, fewer activities are performed in-house which means
that the purchased value accounts for an even larger share of the total cost of goods sold (Baily, et
al., 2005; van Veele , 2005). In the automotive industry, purchased goods and services constitute
approximately 60 to 80 percent of the total cost of goods sold (Baily, et al., 2005; van Veele , 2005).
Not only increasing expenditures, but also fewer but larger suppliers, environmental awareness,
customer demands, advancing technology and finite resources are mentioned as some additional
factors that have contributed to increased strategic importance of purchasing (Baily, et al., 2005).
An additional trend within purchasing is that relationships to the suppliers have moved from arm’s
length to closer, mutual relationships. In mutual relationships, both parties invest confidence and
support with the intension to add value; something that cannot be achieved in a simple transaction
in an arm’s length relationship (Baily, et al., 2005). However, it is not convenient for companies to
have close relationships to all of its suppliers. Instead, closer relationships are sought with the
strategically most important suppliers, often those actors that perform most business with the
buying firm. These suppliers can be identified with the Pareto rule; the 20 percent of suppliers that
accounts for approximately 80 percent of the company’s expenditures.
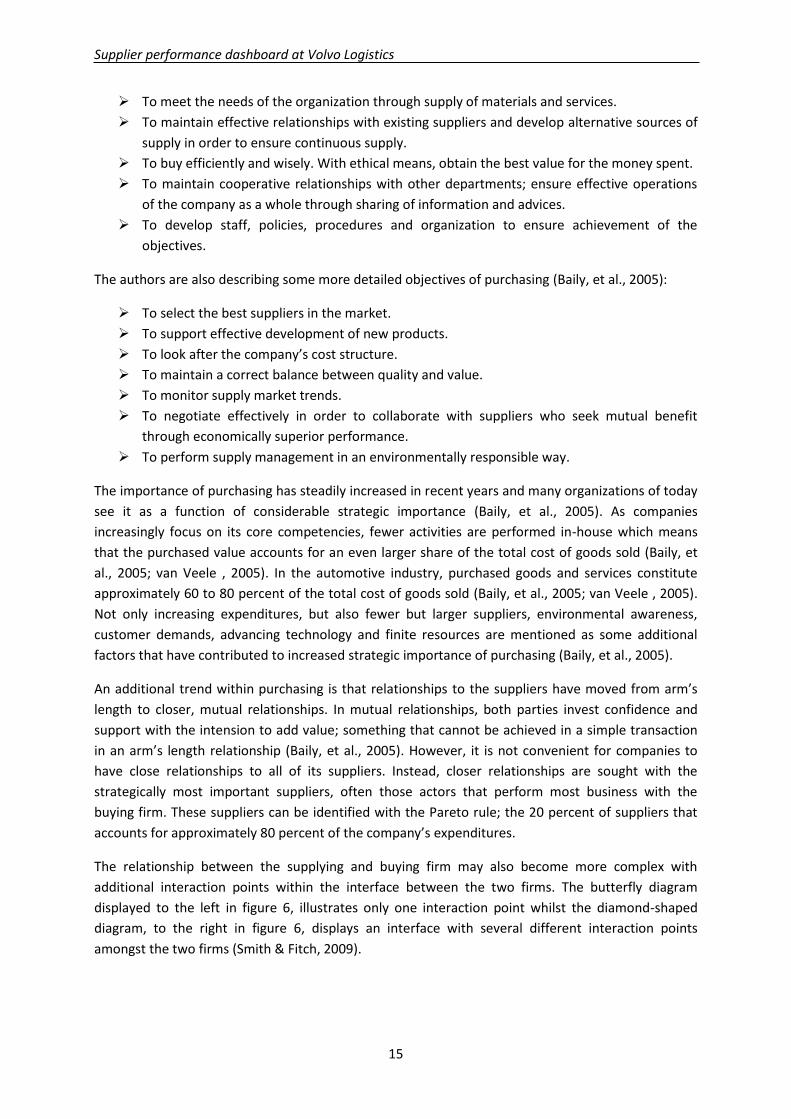
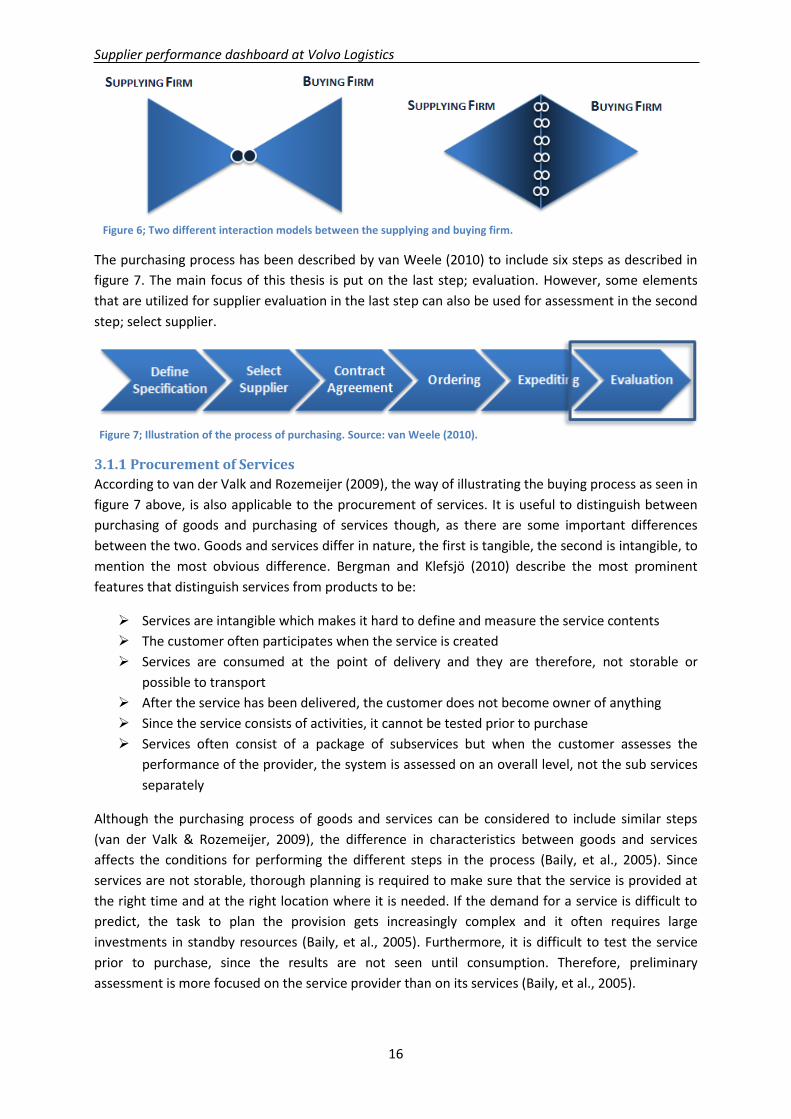
The relationship between the supplying and buying firm may also become more complex with
additional interaction points within the interface between the two firms. The butterfly diagram
displayed to the left in figure 6, illustrates only one interaction point whilst the diamond-shaped
diagram, to the right in figure 6, displays an interface with several different interaction points
amongst the two firms (Smith & Fitch, 2009).
Supplier performance dashboard at Volvo Logistics
16
The purchasing process has been described by van Weele (2010) to include six steps as described in
figure 7. The main focus of this thesis is put on the last step; evaluation. However, some elements
that are utilized for supplier evaluation in the last step can also be used for assessment in the second
step; select supplier.
3.1.1 Procurement of Services
According to van der Valk and Rozemeijer (2009), the way of illustrating the buying process as seen in
figure 7 above, is also applicable to the procurement of services. It is useful to distinguish between
purchasing of goods and purchasing of services though, as there are some important differences
between the two. Goods and services differ in nature, the first is tangible, the second is intangible, to
mention the most obvious difference. Bergman and Klefsjö (2010) describe the most prominent
features that distinguish services from products to be:
Services are intangible which makes it hard to define and measure the service contents
The customer often participates when the service is created
Services are consumed at the point of delivery and they are therefore, not storable or
possible to transport
After the service has been delivered, the customer does not become owner of anything
Since the service consists of activities, it cannot be tested prior to purchase
Services often consist of a package of subservices but when the customer assesses the
performance of the provider, the system is assessed on an overall level, not the sub services
separately
Although the purchasing process of goods and services can be considered to include similar steps
(van der Valk & Rozemeijer, 2009), the difference in characteristics between goods and services
affects the conditions for performing the different steps in the process (Baily, et al., 2005). Since
services are not storable, thorough planning is required to make sure that the service is provided at
the right time and at the right location where it is needed. If the demand for a service is difficult to
predict, the task to plan the provision gets increasingly complex and it often requires large
investments in standby resources (Baily, et al., 2005). Furthermore, it is difficult to test the service
prior to purchase, since the results are not seen until consumption. Therefore, preliminary
assessment is more focused on the service provider than on its services (Baily, et al., 2005).
Figure 6; Two different interaction models between the supplying and buying firm.
Figure 7; Illustration of the process of purchasing. Source: van Weele (2010).
Supplier performance dashboard at Volvo Logistics
17
Logistics belongs to the more commonly bought services (Baily, et al., 2005) and most of the
characteristics of procurement of services, also apply to logistics purchasing (Andersson & Norrman,
2002). However, according to Andersson and Norrman (2002), there are some important differences
between logistics services and general services:
One difference is that the types of relationships in logistics are often of a business-to-
business character. It means that it is not only the buyer that may be affected by bad service
by the service provider; it can also negatively affect the operations of the buyer’s customers.
In addition, it is often a need for close interaction, both with the processes of the client and
also with the processes of the client’s customers.
3.1.2 Supplier base analysis
All suppliers of a buying firm constitute the company’s supplier base and it is considered to be one of
the most important resources of the company (Gadde, et al., 2010). A firm may have thousands of
suppliers in its supplier base and it often has different types of relationships to different suppliers
(Skjøtt-Larsen, et al., 2007). In order to find a structured and efficient way of managing the suppliers,
a portfolio analysis of the supplier base is a useful approach (Skjøtt-Larsen, et al., 2007; Gadde, et al.,
2010). One of the more well-known portfolio models was introduced by Kraljic in 1983 but his
original idea has been interpreted and modified by researchers in later years (Skjøtt-Larsen, et al.,
2007).
In Kraljic’s portfolio model, purchasing transactions are divided into four different categories based
on two dimensions (Skjøtt-Larsen, et al., 2007). The vertical dimension in the matrix is importance of
purchasing, which means what impact the purchased product or service has on the business; its
strategic importance and value added to the final product or service. The horizontal dimension of
the matrix is complexity of supply market; the number of actors i.e. potential suppliers of the market,
monopoly situations, short-term and long-term availability, materials scarcity etc. (Kraljic, 1983).
Assessment of these two variables may help companies find appropriate strategies to reduce
supplier risk and exploit purchasing power (Kraljic, 1983). In a portfolio analysis, purchased items can
be derived to either one of the four different categories in the Krajlic model. High risk, high
important items are denoted strategic products and low risk, low important items are described as
non-critical. The high important, but low risk items are called leverage while low importance, high
risk items are denoted bottleneck, as described in figure 8.
Figure 8; Interpretation of Kraljic’s portfolio model. Source: Kraljic (1983), Gadde et al. (2010).
Supplier performance dashboard at Volvo Logistics
18
To handle the challenge of a diverse and complex supplier base, a portfolio analysis is an important
step (Gadde, et al., 2010). It allows companies to develop individual supply strategies for particularly
critical items; the approach provides an effective framework for collecting marketing and corporate
data and forecast future supply scenarios (Kraljic, 1983).
3.2 Supplier assessment As companies increasingly strive to reduce their
supplier base and seek closer, long-term relationships
to chosen suppliers, certain expectations are also put
on those suppliers to deliver according to a sufficient
level of performance (Simpson, et al., 2002). In order to
monitor and control that requirements are met,
companies use performance measurement to manage
their supplier base (Schmitz & Platts, 2004). In a survey
by Boyson (1999), performance metrics were rated as
the most efficient method for supplier assessment.
Gordon (2008) defines supplier performance management as “The process of evaluating, measuring,
and monitoring supplier performance and suppliers’ business processes and practices for the
purposes of reducing costs, mitigating risk, and driving continuous improvement”. Supplier
assessment or supplier performance evaluation is then defined by Sundtoft Hald and Hellegaard
(2011) as “the process of quantifying the efficiency and effectiveness of supplier action”. A large part
of the previous work among researchers has covered performance measurement from the intra-
organizational perspective while less research has been carried out on performance measurements
outside the measuring firm (Schmitz & Platts, 2004).
3.2.1 Motives for supplier assessment
The connection between efficient management of the buyer-supplier relationship and competitive
advantage has been addressed by several authors (Talluri & Sarkis, 2002; Sarkar & Mohapatra, 2006;
Gordon, 2008). In a study by van Laarhoven et al. (2000), it was shown that in those buyer-supplier
relationships where there is a strong performance orientation and performance reviews are carried
out more frequently, more successful results are achieved than in those relationships where there is
less focus on performance.
Sundtoft Hald and Hellegaard (2011) mention two main purposes of supplier evaluation; to support
the decision making in the buying firm and to encourage performance improvement from the
supplier. A survey by the Aberdeen Group (2002) showed that 70 percent of the respondents
considered supplier performance evaluation critical to their operations (Aberdeen Group, 2002).
Supplier performance measurement is also important in order to decide not only the price, but the
total cost of the relationship, including costs for late deliveries, damages etc. (Aberdeen Group,
2002). However, indications from the Aberdeen Group (2002) study also show how inefficient and
inconsistent supplier performance measurements may harm continuous improvement initiatives as
well as the organization’s cost structure.
PURCHASING
PERFORMANCE MEASUREMENT
BUSINESS INTELLIGENCE
SUPPLIER ASSESSMENT
Supplier performance dashboard at Volvo Logistics
19
3.2.2 Supplier assessment process
Gordon (2005) presents seven steps to assess supplier performance:
1. Align supplier performance goals with organizational goals and objectives
2. Determine an evaluation approach
3. Develop a method to collect information about suppliers
4. Design and develop a robust assessment system
5. Deploy a supplier performance assessment system
6. Give feedback to suppliers on their performance
7. Produce results from measuring supplier performance
The first step, to align supplier performance goals with organizational goals and objectives is
important in order to ensure that the right metrics are focused upon. Figure 9 is developed by
Gordon (2008) and illustrates the logical alignment between corporate goals and supplier
performance expectations.
The importance of the sixth point has also been emphasized in the Aberdeen Group study where it
was shown that those buyers who shared information on performance levels with their suppliers
achieved greater improvement in supplier performance than those who kept the data to themselves
and instead, used it for punitive measures (Aberdeen Group, 2002).
Supplier performance can be assessed on different levels. Van Weele (2010) presents four levels of
supplier assessment:
Product level
Process level
Quality assurance system level
Company level
Gordon (2008) also describes the need for segmenting the supplier base; to decide which suppliers to
measure and then, determine the level of evaluation. Some suppliers need only brief monitoring
while there are others that should be more thoroughly evaluated. According to the Aberdeen group
(2002), measuring only a small proportion of the supplier base can make sense; however the
measuring firm is then exposed to some level of risk if they do not cover the entire supply base or at
Figure 9; Supplier performance expectations development hierarchy, Source Gordon (2008).
Supplier performance dashboard at Volvo Logistics
20
least a larger part of it. Even unsatisfactory performance by smaller suppliers can have significant
impact on the operations of the buying firm.
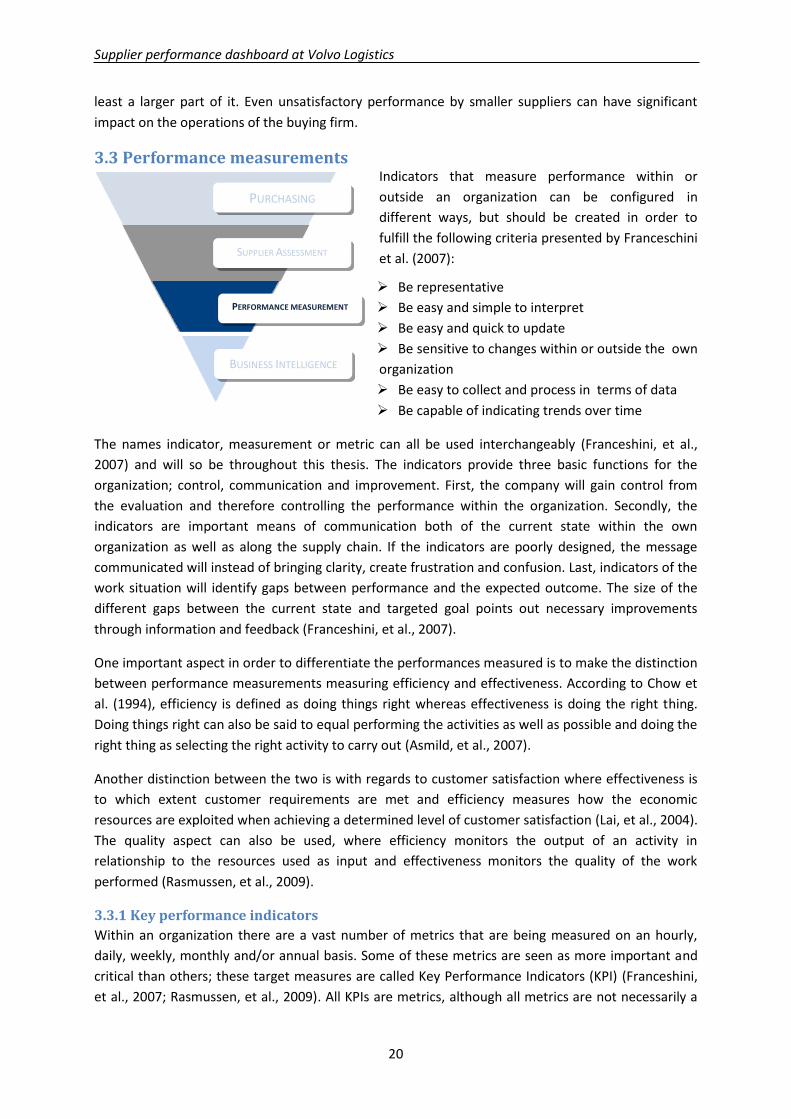
3.3 Performance measurements Indicators that measure performance within or
outside an organization can be configured in
different ways, but should be created in order to
fulfill the following criteria presented by Franceschini
et al. (2007):
Be representative
Be easy and simple to interpret
Be easy and quick to update
Be sensitive to changes within or outside the own
organization
Be easy to collect and process in terms of data
Be capable of indicating trends over time
The names indicator, measurement or metric can all be used interchangeably (Franceshini, et al.,
2007) and will so be throughout this thesis. The indicators provide three basic functions for the
organization; control, communication and improvement. First, the company will gain control from
the evaluation and therefore controlling the performance within the organization. Secondly, the
indicators are important means of communication both of the current state within the own
organization as well as along the supply chain. If the indicators are poorly designed, the message
communicated will instead of bringing clarity, create frustration and confusion. Last, indicators of the
work situation will identify gaps between performance and the expected outcome. The size of the
different gaps between the current state and targeted goal points out necessary improvements
through information and feedback (Franceshini, et al., 2007).
One important aspect in order to differentiate the performances measured is to make the distinction
between performance measurements measuring efficiency and effectiveness. According to Chow et
al. (1994), efficiency is defined as doing things right whereas effectiveness is doing the right thing.
Doing things right can also be said to equal performing the activities as well as possible and doing the
right thing as selecting the right activity to carry out (Asmild, et al., 2007).
Another distinction between the two is with regards to customer satisfaction where effectiveness is
to which extent customer requirements are met and efficiency measures how the economic
resources are exploited when achieving a determined level of customer satisfaction (Lai, et al., 2004).
The quality aspect can also be used, where efficiency monitors the output of an activity in
relationship to the resources used as input and effectiveness monitors the quality of the work
performed (Rasmussen, et al., 2009).
3.3.1 Key performance indicators
Within an organization there are a vast number of metrics that are being measured on an hourly,
daily, weekly, monthly and/or annual basis. Some of these metrics are seen as more important and
critical than others; these target measures are called Key Performance Indicators (KPI) (Franceshini,
et al., 2007; Rasmussen, et al., 2009). All KPIs are metrics, although all metrics are not necessarily a
PURCHASING
SUPPLIER ASSESSMENT
BUSINESS INTELLIGENCE
PERFORMANCE MEASUREMENT
Supplier performance dashboard at Volvo Logistics
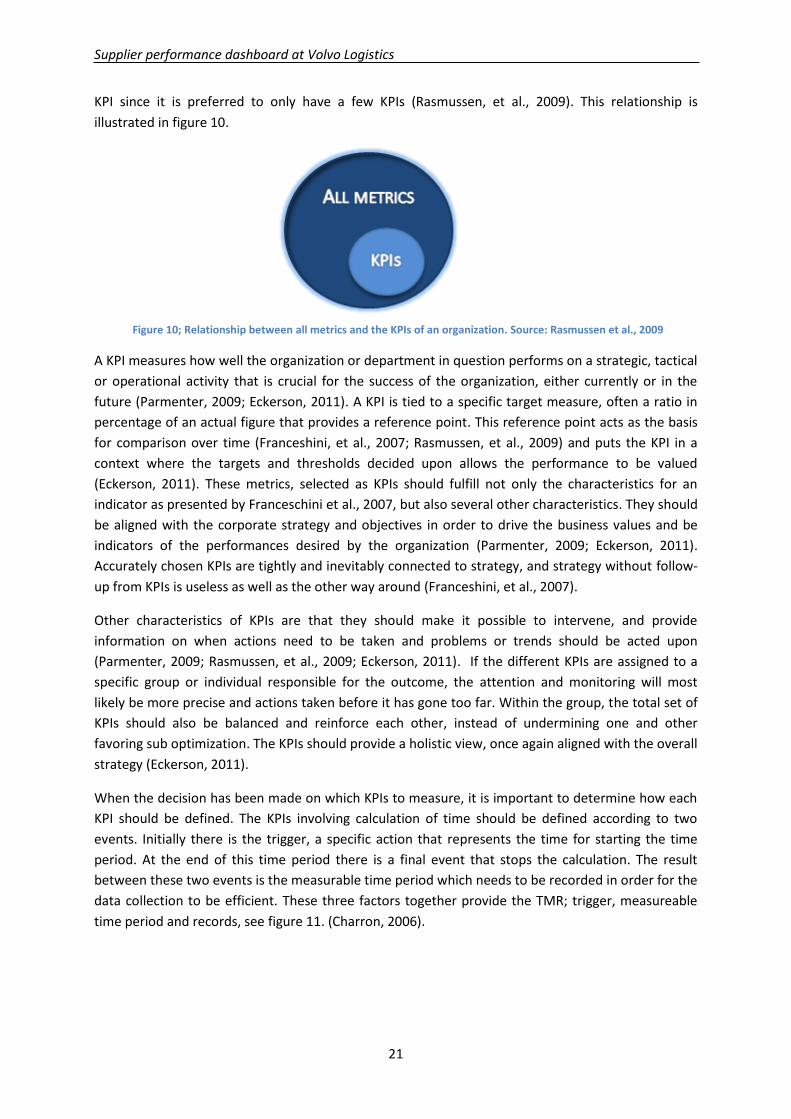
21
KPI since it is preferred to only have a few KPIs (Rasmussen, et al., 2009). This relationship is
illustrated in figure 10.
A KPI measures how well the organization or department in question performs on a strategic, tactical
or operational activity that is crucial for the success of the organization, either currently or in the
future (Parmenter, 2009; Eckerson, 2011). A KPI is tied to a specific target measure, often a ratio in
percentage of an actual figure that provides a reference point. This reference point acts as the basis
for comparison over time (Franceshini, et al., 2007; Rasmussen, et al., 2009) and puts the KPI in a
context where the targets and thresholds decided upon allows the performance to be valued
(Eckerson, 2011). These metrics, selected as KPIs should fulfill not only the characteristics for an
indicator as presented by Franceschini et al., 2007, but also several other characteristics. They should
be aligned with the corporate strategy and objectives in order to drive the business values and be
indicators of the performances desired by the organization (Parmenter, 2009; Eckerson, 2011).
Accurately chosen KPIs are tightly and inevitably connected to strategy, and strategy without follow-
up from KPIs is useless as well as the other way around (Franceshini, et al., 2007).
Other characteristics of KPIs are that they should make it possible to intervene, and provide
information on when actions need to be taken and problems or trends should be acted upon
(Parmenter, 2009; Rasmussen, et al., 2009; Eckerson, 2011). If the different KPIs are assigned to a
specific group or individual responsible for the outcome, the attention and monitoring will most
likely be more precise and actions taken before it has gone too far. Within the group, the total set of
KPIs should also be balanced and reinforce each other, instead of undermining one and other
favoring sub optimization. The KPIs should provide a holistic view, once again aligned with the overall
strategy (Eckerson, 2011).
When the decision has been made on which KPIs to measure, it is important to determine how each
KPI should be defined. The KPIs involving calculation of time should be defined according to two
events. Initially there is the trigger, a specific action that represents the time for starting the time
period. At the end of this time period there is a final event that stops the calculation. The result
between these two events is the measurable time period which needs to be recorded in order for the
data collection to be efficient. These three factors together provide the TMR; trigger, measureable
time period and records, see figure 11. (Charron, 2006).
Figure 10; Relationship between all metrics and the KPIs of an organization. Source: Rasmussen et al., 2009
Supplier performance dashboard at Volvo Logistics
22
3.3.2 Motives for performance measurements
Neely (1999) presents seven different reasons why firms should use performance measurements and
why the trend has shifted from only hard financial data to more sophisticated and developed
measurements.
The changing nature of work
Increased competition
Specific improvement initiatives
National and international awards
Changing organizational roles
Changing external demands
Powerful information technology
One of the most prominent reasons for performance measurements in Neely’s (1999) list are those
of the changing climate for businesses. This includes increased competition due to globalization and
new ways on allocating overhead costs in accounting. The harder competitive climate encourages
companies to measure their performance in order to be able to differentiate themselves. What a
company measures also indicates how they intend to deliver value to their customers (Franceshini, et
al., 2007). The competition has moved from offered products and cost as an order winner, to services
and non-financial factors as the competitive advantage resulting in the need to measure these and
gain information. The power of the information technology is though the main enabler for the use of
performance measurements. The information technology is capable of collecting and analyzing data
fast and easy. It is also able to review data and take subsequent actions. (Neely, 1999).
3.3.3 Characteristics of performance measurements
When evaluating performance measurements, several aspects need to be considered in order to
cover different angles. These angles may contradict each other but together they create a common
and holistic viewpoint when measured (Krauth, et al., 2005). It is not sufficient to measure only one
indicator of performance; hence the problem is to capture the most important performance
dimensions within the evaluated context and create an own list of measurements suitable to that
organization (Caplice & Sheffi, 1995; Chow, et al., 1994).
The time horizon is also important to evaluate when creating a suitable list of measurements,
whether or not the measurements should be on a long-term or short-term focus. For measurements
on a more strategic level, long-term measurements are more important while on an operational level
with decisions made on a day-to-day basis, short-term measurements provide more value (Krauth, et
al., 2005). In discussions regarding time, the importance of being able to track measurements over
time is another important factor in order to follow-up and detect trends, negative as well as positive
(Franceshini, et al., 2007).
Figure 11; Schematic picture of measuring a KPI based on time.
Supplier performance dashboard at Volvo Logistics
23
In 1992, Kaplan and Norton presented the balanced scorecard, a new way of combining, or balancing
performance metrics from various perspectives. The basic idea behind the balanced scorecard is to
allow managers and other decision makers to not have to focus on only one specific type of
measures, but to combine different perspectives into one uniform picture that provides a holistic
view of the company’s operations. The authors compare the idea with the cockpit of an airplane
where the pilot cannot rely on only one indicator, but have to keep control over several parameters
at the time (Kaplan & Norton, 1992).
In their framework, Kaplan and Norton (1992) combine financial and non-financial measures which
are divided into four different categories; financial, customer, internal business and innovation and
learning. While the financial measures, consisting of so called lagging indicators as described in
section 3.3.3.3, are a result of the actions already taken, the remaining three perspectives consist of
non-financial or operational metrics that are the drivers for future financial results (Kaplan & Norton,
1992). According to the authors, the balanced scorecard minimizes information overload due to the
limited number of measures included and only the most critical metrics are focused upon (Kaplan &
Norton, 1992).
3.3.3.1 Hard and soft measurements
One of the first aspects to take into consideration when characterizing measurements is that of hard
and soft measurements, where the hard ones are the traditional ones and dominated by numerical
factors. These are based on financial reports or operational results, such as time and cost (Chow, et
al., 1994). Franceschini et al. (2007), even make a distinction between financial indicators, measuring
the past performances in monetary terms, and the process indicators measuring the competitiveness
in time, flexibility, quality, productivity and environmentally purposes.
The traditional hard measurements are not seen as sufficient on its own and criticized for lacking
strategic focus, encouraging short-termism; where local optimization fail to provide customer
information. They are also historically focused and do not provide information about what will
happen next (Neely, 1999). The hard financial measurements though, create an overview if the
company’s execution and implementation of the overall strategy contributes to the bottom-line
result (Krauth, et al., 2005). In order to overcome these stated problems, the hard measurements
should be combined with soft ones. The soft ones are self-reported perceptual data and identified in
their ability to help identify problems (Töyli, et al., 2008) like customer satisfaction (Neely, 1999). In
his article, Neely (1999) refers to studies that show a correlation between customer satisfaction and
financial performance, where an increase in customer satisfaction also means an increase in net
present value of the firm in question.
Another problem to overcome is the ability to use the performance measurements for comparison
when the measurements and data collection is done externally. The hard measurements alone may
not be sufficient for this purpose due to different use of standards for accounting or reporting,
between the investigated suppliers. The soft performance measurements may then facilitate as a
bridge towards overcoming this gap (Chow, et al., 1994).
3.3.3.2 Financial and non-financial measurements
Financial measurements are the typical measurements found in quarterly and annual reports and
connected through their financial background and that they are possible to measure in monetary
terms. Non-financial measurements on the other hand are those that cannot be represented in
Supplier performance dashboard at Volvo Logistics
24
monetary terms or any currency (Dorestani, 2009). Non-financial measurements often indicate
future performances while financial measurements have a historic viewpoint, presenting financial
numbers on past performances (Caplice & Sheffi, 1995).
Examples of financial measurements are revenue, profit, net sales, profit margin etc. (Krauth, et al.,
2005) and for purchasing in particular such measurements could be purchasing price and other costs.
These measurements are more connected to the effectiveness aspect of the organization (van Veele ,
2005). Non-financial measurements are instead better for measuring the efficiency of a company’s
performance in comparison to only financial measurements (van Veele , 2005; Dorestani, 2009).
Examples of non-financial measurements are environmental factors, employee satisfaction and
customer perception (Krauth, et al., 2005).
3.3.3.3 Leading and lagging measurements
Two types of metrics to distinguish between are leading and lagging performance indicators. Gordon
(2008) describes leading indicators as metrics that predict, or drive future performance. The leading
metrics give an indication about upcoming financial results (Kaplan & Norton, 1996). In contrast,
lagging indicators measure past performance. They consist of operational metrics that measures
activities that have already occurred (Gordon, 2008). The lagging indicators are often easier to
measure and belong to the most commonly used indicators among companies (Gordon, 2008).
Lagging indicators is used to asses already completed performances and their results and do not offer
the possibility to change the performance or its result due from the KPI (Beatham, et al., 2004)
Gordon (2008) emphasizes the importance of not only considering lagging metrics, but also take into
account leading indicators in order to steer focus on future results and attain a proactive supplier
performance measurement approach (Gordon, 2008). The leading indicators provide guidance on
how to achieve financial results (Kaplan & Norton, 1996). The leading indicators are appropriate to
use in situations where preventing the occurrence of problems is the main reason for monitoring
(Franceshini, et al., 2007). They also offer the opportunity for the company to make changes as a
result of the measurements. The results can be used to predict future performances of the measured
activity or the opportunity to change working practices (Beatham, et al., 2004).
Kaplan and Norton (1996) stress the importance to combine leading and lagging indicators, in their
book denoted performance drivers and outcome measures respectively. A mix of both categories is
needed in order to achieve a good set of measurements.
3.3.4 Framework for evaluating KPIs
The characteristics of KPIs presented above will be the foundation of the framework used in order to
evaluate each KPI for the dashboard. The KPIs will be analyzed and categorized according to its
characteristics and the findings will be presented in a table designed as table 4 below. The KPIs will
be categorized as hard or soft, financial or non-financial and leading or lagging. The categorization of
the KPIs with the presented framework will ensure that the KPIs used within the dashboard at VLC
will have a wide range of characteristics and enclose all aspects wanted to be measured within the
dashboard.
Supplier performance dashboard at Volvo Logistics
25
Table 4; Illustration of the framework for evaluating KPIs and measurements
KPI/Measurement Hard Soft Financial Non-
financial Leading Lagging
Example 1 X X X
Example 2 X X X
The stakeholder aspect will also be considered when evaluating the KPIs. Specific focus will be put on
the spread of the KPIs across the VLC departments and traffic modes. The potential dashboard KPIs
will also be evaluated and ranked according to their fit and fulfillment of the different criteria that
were identified in the theory chapter:
Be representative
Be easy and simple to interpret
Be capable of indicating trends over time
Be sensitive to changes within or outside the own organization
Be easy to collect and process in terms of data
Be easy and quick to update
Be aligned to the corporate strategy and objectives
3.3.5 Transportation KPIs
According to Coyle et al. (2009), transportation KPIs can be divided into two main categories; service
quality and efficiency. Transportation service quality simply means deliver the goods at the right
time, in the right condition and at the right cost (Coyle, et al., 2009). On-time delivery precision is one
way to measure delivery performance (Krauth, et al., 2005) and it has been identified as one of the
most important performance indicators in transportation (Birkland, 2002; Menon, et al., 1998;
Gunasekaran, et al., 2004). On-time delivery is a critical requirement in lean supply chains focusing
on just-in-time (JIT) operations; consistent and accurate deliveries on time enables lower inventory
levels and reduce uncertainties in the supply chain (Coyle, et al., 2009). Coyle et al. (2009) define the
KPI on-time delivery as the ratio of shipments delivered on time divided by the total shipments
delivered by the carrier. 95 percent is a common minimum level of acceptable performance among
transportation buyers and a level of 98 percent is the target to achieve (Coyle, et al., 2009).
Coyle et al. (2009) also suggest measurement of delivery consistency; to compare the average transit
time, or lead time, from origin to destination with the promised transit time. Too large deviation
from both average time and promised transit time suggest inadequate service quality by the carrier
(Coyle, et al., 2009). Besides delivery on time with accurate lead time, damage-free delivery is also an
integral part of transportation service quality and among the most important transportation
performance indicators (Birkland, 2002; Gunasekaran, et al., 2004). Delivery disruptions caused by
transport incidents and damaged goods disturbs a continuous flow of material that are important for
lean and JIT operations (Coyle, et al., 2009). Coyle et al. (2009) denotes this claims-free delivery and
describes it as the main freight protection KPI. Most organizations have a requirement level of no less
than 99 percent of claims-free deliveries but one hundred percent perfection is the goal (Coyle, et al.,
2009).
Supplier performance dashboard at Volvo Logistics
26
The quality of the information exchange impacts the delivery performance to a large extent (Krauth,
et al., 2005). Faultless invoices (Krauth, et al., 2005) and high billing accuracy (Coyle, et al., 2009) are
two performance indicators relevant in the area of information efficiency. The KPI freight bill
accuracy measures the number of accurate freight bills compared to the total numbers. A common
acceptable level of performance for this KPI is 95 percent and a desired target level of 100 percent
(Coyle, et al., 2009). Table 5 summarizes the most important KPIs within transportation with regard
to service quality.
Table 5; Summary of important service quality KPIs in transport operations
KPI
On-time delivery
Transit time accuracy
Damage free delivery
Faultless invoices/Billing Accuracy
High service quality often implies high costs. Therefore, it is not sufficient to focus only on high
service levels, but it is equally important to follow-up on transportation service efficiency (Coyle, et
al., 2009). There is a classic trade-off between cost and service level and companies must try to find a
balance between the two parameters (Holter, et al., 2008; Coyle, et al., 2009). For many companies,
transportation accounts for the major part of the total logistics cost (Coyle, et al., 2009;
Gunasekaran, et al., 2004). Therefore, efficiency measures can provide an indication of what value is
achieved for the money spent (Coyle, et al., 2009).
3.4 Business intelligence Business Intelligence (BI) is an area that was first
introduced in the late 1980s, but was at that time
denoted Executive Information Systems. Back then,
the purpose of the systems was to provide senior
managers with a tool that gave better insight into the
business operations (Rasmussen, et al., 2009).
Howard Dresner introduced the term BI in 1989. He
described it as a set of concepts and methods to
improve decision making by using fact-based support
systems. In later years, BI has been one of the fastest
growing business software technologies in the world
(Rasmussen, et al., 2009). Today, BI is referred to as a way of combining products, technology, and
methods to structure key information that management requires in order to improve profit and
performance (Williams & Williams, 2007). Among several concepts within the area of BI, Rasmussen
et al. (2009) present dashboards, which will be described in more detail in the following section.
3.4.1 Dashboards
As the trend moves towards increased amount of information processing within companies in
general, dashboards have emerged as a new tool to bring together only the most relevant data in
order to enlighten the decision-making process (Rasmussen, et al., 2009). A dashboard can be
described as a computer interface consisting of charts, reports, visual indicators and alert
mechanisms that is compiled into an information platform (Malik, 2005). Eckerson (2011) uses the
SUPPLIER ASSESSMENT
PERFORMANCE MEASUREMENT
PURCHASING
BUSINESS INTELLIGENCE
Supplier performance dashboard at Volvo Logistics
27
27%
30%
33%
37%
43%
0% 10% 20% 30% 40% 50%
Need to align business activity withcompany strategy
Need to improve timeliness andaccuracy of business decisions
Need to remove spreadsheet-basedprocess to get to 'one version of truth'
Need to replace "gut-feel" decisionswith "fact-based" decisions
Need to gain visibility into keybusiness processes
term performance dashboard which he defines as: “a layered information delivery system that
parcels out information, insights, and alerts to users on demand so they can measure, monitor, and
manage business performance more effectively”.
The word dashboard derives from the automotive and the aircraft industries where the dashboard is
used to monitor and maneuver a complex and interdependent system. The same intension lay
behind the deployment of dashboards in the business field; to monitor and control the business
operations of an enterprise (Malik, 2005; Rasmussen, et al., 2009). An illustration of a typical
automotive dashboard can be seen in figure 12.
In a study by the Aberdeen Group (2009), the top five reasons that drive dashboard initiatives among
285 companies were identified (Aberdeen Group, 2009). These motives are illustrated in figure 13.
Among the reasons that are presented in figure 13, most of them relates back to two main issues or
needs that companies struggle with (Aberdeen Group, 2009). These include increased confidence in
Figure 13; The top five reasons that drive dashboard initiatives, based on answers from 285 firms. Source: Aberdeen Group (2009).
Figure 12; Illustration of an automotive dashboard. Source: (Car lovers magazine, 2010)
Supplier performance dashboard at Volvo Logistics
28
decision making and secondly, to speed up access to relevant data. Confidence in decision making is
enhanced when perceptions based on previous experience can be combined with, and supported by
fact-based information and the decision maker do not only have to rely on a gut feeling. To enable
decisions based on facts, quick access to relevant data is a prerequisite; the necessary information
often arrive too late which enforces more vague decisions. However, with up to date data, more
confidence can be achieved in decision making. Therefore, the pressure behind dashboard initiatives
can be summarized into two main purposes; to improve quality in business information and increase
the speed of access to this information (Aberdeen Group, 2009).
3.4.2 Enterprise dashboards
Similar to the automotive dashboard, the enterprise equivalent consists of a number of KPIs that are
critical for successful operations; the speed- or the tachometer in the automotive dashboard can be
compared to real-time indication of the most important corporate performance metrics in the
organizational dashboard. An important distinction between the two, that complicates the creation
of the organizational dashboard, is that each company has its unique set of KPIs.
While an automotive dashboard can be replicated into a countless number of similar copies, the
creation of the organizational dashboard is much more complicated as each enterprise must identify
the most important KPIs or performance indicators that are relevant for their specific operations.
There is not only a difference between companies operating in the same industry, in the same
market, but also between divisions within the same company. Each division has separate sets of KPIs,
matching the characteristics of their operations which results in different types of dashboards
depending on department goals (Malik, 2005). Figure 14 illustrates an example of an enterprise
dashboard that includes typical elements such as gauges, charts and tables.
3.4.3 Characteristics of enterprise dashboards
Malik (2005) describe five basic characteristics of an enterprise dashboard that are essential for a
successful outcome. These are summarized in the acronym SMART:
Synergetic. A dashboard must be ergonomically and visually effective in order for the user to
be able to synergize information of different nature within a single screen view.
Figure 14; Illustration of an executive dashboard. Source: (Analytics in motion, 2012).
Supplier performance dashboard at Volvo Logistics
29
Monitor KPIs. The dashboard shall illustrate the critical KPIs that are needed for effective
decision making within the domain the dashboard serves
Accurate. The information that is included in the dashboard must be completely accurate in
order to reach full user confidence in the dashboard. The data must be well tested and
validated before included in the dashboard.
Responsive. The dashboard must include functions that create user alerts like sound alarms,
e-mails, blinkers etc. in order to aware the users about critical matters.
Timely. The information must be real-time and right-time; it must be updated to the latest
version possible in order to achieve effective decision making.
In addition to the elements of SMART, Malik (2005) emphasizes the importance to include more
advanced features that cannot be found in an airplane cockpit but are essential to achieve effective
organizational management. These features are captured in the acronym IMPACT:
Interactive. It should provide an ability to drill down information to look at details and find
root causes.
More data history. The user should be able to review historical trends for the different KPIs.
Personalized. The information presented in the dashboard shall match the specific domain of
the user; only the data relevant for their field should be presented for more efficient usage.
Analytical. The dashboard should provide the user with the ability to carry out guided
analyses like what-if analysis. In addition, the user should be able to drill down, compare,
contrast and analyze different business variables.
Collaborative. The dashboard should enable user to exchange notes on specific observations
on their dashboard.
Trackability. It should enable the user to customize what metrics to track.
3.4.4 Motives for enterprise dashboards
Rasmussen et al. (2009) mention some of the benefits and pitfalls of, and motives of using
dashboards presented in the two lists below. Benefits with using dashboards:
Ability to identify and correct negative trends
Ability to perform improved analysis through the visual presentation of performance
measurements.
Ability to align strategies and organizational goals.
Reducing the need to create and maintain large numbers of static reports
Pitfalls with using dashboards:
Manual data entry or lack of automated data
Lack of useful metrics to support decision making
Poor dashboard design
There are different types of dashboards and Rasmussen et al. (2009) distinguish between strategic,
tactical and operational dashboards. According to the Aberdeen Group survey (2009), the “Best-in-
Class” companies are not only deploying dashboards among executive managers at a strategic level,
but are also using dashboard technology among line-level employees to support decisions of more
tactical nature (Aberdeen Group, 2009).
Supplier performance dashboard at Volvo Logistics
30
3.5 Summary of theoretical findings This section provides a brief summary of the most important findings of the theory chapter. This
information contains the theoretical evidence that will be used to answer the research questions.
The summarizing chapter is structured around the four main parts of the theory chapter; purchasing,
supplier assessment, performance measurements and BI.
Purchasing
The purchasing function has several objectives. The following list includes the objectives of
purchasing that are related to supplier assessment:
To maintain effective relationships with existing suppliers and develop alternative
sources of supply in order to ensure continuous supply.
To buy efficiently and wisely. With ethical means, obtain the best value for the
money spent.
To select the best suppliers in the market.
To maintain a correct balance between quality and value.
To perform supply management in an environmentally responsible way.
The relationship between the buyer and its suppliers can generally be illustrated in two
different models; the butterfly model where there is one point of interaction between the
parties, or the diamond model where there are several points of interaction between the
buyer and the supplying firm.
A large part of the characteristics related to the process of purchasing of goods also applies
to the process of logistics purchasing. However, the ways in which some activities in the
process are performed differ in character. Furthermore, generally within procurement of
logistics services, the relationship between the buyer and the supplier is more of a business
to business relationship which sometimes requires closer interaction and closer monitoring
in order to make sure that the performance of the supplier does not negatively affect the
service provided to the end customer.
All suppliers of a buying firm constitute the company’s supplier base. For more efficient
sourcing the supplier base can be structured in different ways. One way is provided by the
Krajlic-matrix which is a tool for portfolio analysis of the supplier base. The Krajlic-matrix
includes four different categories of sourcing strategy; supply management, sourcing
management, materials management and purchasing management.
Supplier assessment
The connection between efficient management of the buyer-supplier relationship and
competitive advantage has been addressed by several authors (Talluri & Sarkis, 2002; Sarkar
& Mohapatra, 2006; Gordon, 2008). In a study by van Laarhoven et al. (2000), it was shown
that in those buyer-supplier relationships where there is a strong performance orientation
and performance reviews are carried out more frequently, more successful results are
achieved than in those relationships where there is less focus on performance.
In order to monitor and control that the suppliers perform according to the required levels of
performance, companies use performance measurement to manage their supplier base.
Gordon (2008) defines supplier performance management as “The process of evaluating,
measuring, and monitoring supplier performance and suppliers’ business processes and
practices for the purposes of reducing costs, mitigating risk, and driving continuous
improvement”.
Supplier performance dashboard at Volvo Logistics
31
Performance measurement
Performance indicators provide three basic functions for the organization; control,
communication and improvement. It was also found that performance measurements are
the most efficient method for supplier monitoring.
Six criteria as presented by Franceschini et al., 2007:
o Be representative
o Be easy and simple to interpret
o Be easy and quick to update
o Be sensitive to changes within or outside the own organization
o Be easy to collect and process in terms of data
o Be capable of indicating trends over time
Performance indicators can be categorized in different ways depending on their
characteristics. Three categories were presented; financial or non-financial, hard or soft and
leading or lagging.
The most important performance indicators within transportation were identified:
o On-time delivery
o Transit time accuracy
o Damage free delivery
o Faultless invoices/Billing Accuracy
BI and enterprise dashboards
Five reasons that drive dashboard initiatives among companies were presented; gain
visibility, make fact-based decisions, obtain one version of data, improve timeliness and
accuracy of decisions and align business activity with company strategy.
An efficient dashboard should have the following characteristics; accurate, responsive,
interactive, analytical, collaborative, synergetic and provide data history.
A number of benefits of a dashboard were identified; ability to identify and correct negative
trends, perform improved analysis through visual presentation and reduce number of static
reports.
A few pitfalls related to dashboard initiatives were also identified; lack of automated data or
need for manual data entry, lack of useful metrics and poor dashboard design.
Supplier performance dashboard at Volvo Logistics
32
4 Empirical findings In this chapter, the empirical findings needed for answering the research questions are presented.
The chapter is structured according to the main focus areas that are illustrated in figure 15; the
supplier base, the dashboard and the departments at VLC. As figure 15 shows, it is primarily the
characteristics of the supplier base and the supplier assessment activities performed within the
different VLC departments that shape the conditions for the creation of a supplier performance
dashboard.
First, the requirements related to the dashboard are presented together with the areas of
applications. Thereafter the structure of the supplier base is presented, followed by the
measurements at each department within VLC. Finally, a summary of the discovered prerequisites
and specific conditions is provided.
The three elements are each presented in different sections in the empirical chapter. Each section
describing the different departments is further divided into three parts. Research question one is
connected to the first general description of each department and their supplier evaluation process
today as well as the second part of which measurements that are carried out. The current
measurements from all departments will also form the basis for answering the second research
question on which KPIs to include in the Supplier performance dashboard. Last, the third part on
level of aggregation and system storage for the KPIs will answer the third research question.
Empirical evidence connected to the research questions are presented in several different parts of
this chapter. For a summary of empirical findings and related research questions see table 6 below:
Figure 15; Illustration of the three main focus areas of the empirical chapter; supplier base, dashboard and the departments within VLC.
Supplier performance dashboard at Volvo Logistics
33
Table 6; Description of what empirical findings will be used in order to answer the different research questions
Research Question Empirical evidence
RQ 1: How is the supplier performance evaluation process currently carried out at VLC?
- Interviews with employees within different relevant departments within the VLC organization. See appendix 1 and 2 for further details. - Review of internal documentation - Observations
RQ 2: What performance indicators should be included in the Supplier performance dashboard?
- Thorough interviews within VLC; map what is actually measured within VLC today and verify that data is accessible and consistently defined. - Relate to corporate strategy and goals -Interviews with buyers and key users/stakeholders of the dashboard to clarify basic requirements - Interviews with suppliers to gain insight in their attitude towards a Supplier performance dashboard and to investigate possible transformation of data from the supplier through self-reporting.
RQ 3a: Where is the information relevant for the Supplier performance dashboard stored?
-Interviews with employees within relevant departments of VLC to identify in what systems and what format different measurements are stored. See appendix 1 and 2 for further details.
RQ 3b: How can the information relevant for the Supplier performance dashboard be identified?
-Interviews with employees within relevant departments of VLC to identify how the performed measurements are linked to suppliers and what type and level of identification are used. See appendix 1 and 2 for further details.
Supplier performance dashboard at Volvo Logistics
34
4.1 The supplier performance dashboard at VLC
According to VLC, the intension behind
implementation of a supplier performance
dashboard is to move away from decisions based on
individual perceptions towards management by
facts; to make sure that actions are taken in support
of pure facts and not based on vague opinions.
4.1.1 Areas of application
The main purpose of the supplier performance
dashboard is to be an element of a Supplier Management Forum at VLC. The forum will be
coordinated by Purchasing Strategy & Support (PS&S), but representatives from different
departments within VLC will also participate. The Supplier performance dashboard is going to be a
tool to follow up supplier targets and VLC desires to include Operational, Financial and Core Value
related requirements. As a part of the Supplier Management Forum, the dashboard is going to
support common actions to improve supplier performance and also, escalate supplier issues and
decide upon suppliers to be audited. Although the Supplier Management Forum is considered to be
the main area of application, it is advantageous if the dashboard can be used in other contexts as
well. To be a supportive tool both in commodity strategy development and for the purchasers in
their daily work are mentioned as two additional areas of application.
The daily work for the purchasers involve numerous tasks within both the pre- and post-sourcing
processes as well as continuous evaluation of the supplier during the contracted timespan. During
the pre-sourcing process the suppliers will be evaluated on whether or not they fulfill basic Volvo
requirements, involving to buy efficiently and wisely and with ethical means. It also involves making
decision to obtain the best possible value for the money spent according to these prerequisites and
to choose the best supplier in the market that fits VLCs predefined requirements.
It is also the purchaser’s responsibility to maintain effective relationships with existing suppliers and
develop alternative sources of supply in order to ensure continuous supply during the contract time,
and post-sourcing when looking for alternative sources of supply. Other decisions and areas of
application where the dashboard can be helpful are when maintaining a correct balance between
quality and value of the supplier’s offers and to perform supply management in an environmentally
responsible way.
Besides these areas of application the Supplier performance dashboard should be able to fulfill the
following requirements:
The dashboard shall provide an overall view of each core supplier on supplier group level i.e.
one screen image of the performance levels within the central KPIs that represent the most
important requirements VLC puts on its core suppliers.
It should be possible to view the supplier’s performance within a specific business area;
Inbound, Outbound and Emballage.
It should be possible to track trend over time to identify improved or worsened performance.
Supplier performance dashboard at Volvo Logistics
35
It should be possible to drill down and aggregate up the data to supplier group level, PARMA-
ID, contract and flow level in order to view the supplier’s level of performance within
different regions and specific flows.
4.1.2 Purchasers view on measurements for the dashboard
The purchasers within the Global Purchasing department, located at the Gothenburg office, was
asked to rank the most important measurements for supplier evaluation within their mode of
transport, for interview guide see appendix 4. The summarized answers can also be found in
appendix 4, and presented below are a list of the eight most important measurements:
Price/Cost
Lead-time/Precision
Financial ranking
Damage free delivery
Quality
ISO 14001/9001/SmartWay
Corporate Social Responsibility (CSR)
Future potential
These measurements are important to include in the Supplier performance dashboard and needs to
be compared to the measurements performed within the different departments at VLC presented
later in this chapter. This needs to be done in order to align the recommended measurements with
the view of the purchasers.
4.2 The supplier base The supplier base of VLC consists of 887 suppliers
where 154 of them, or 17 percent, are considered to
be core suppliers. The core suppliers account for 90
percent of the total spend (Global spend report
2011). Figure 16 illustrates the division of total spend
among the three business areas within purchasing;
Inbound, Outbound and Emballage. Inbound
accounts for the largest share with 52 percent of the
total spend while Outbound has a total of 38 percent
and Emballage stands for 10 percent.
Among the 154 core suppliers, there are 88 that are active within only one of the three business
areas. This means that 66 suppliers, or 43 percent of the core suppliers, are active in more than one
business area. In figure 17, the total number of active core suppliers per business area is displayed;
101 core suppliers within Inbound, 93 within Outbound and 57 within Emballage. Several suppliers
are active in dual business areas and 27 core suppliers are active within all three business areas.
Concerning the four traffic modes; air, rail, road and sea transportations, a division per total spend is
illustrated in figure 18. The largest traffic mode is road with 67 percent of the turnover followed by
sea with 23 percent. Rail is the smallest traffic mode with only 4 percent of the turnover and rail
accounts for 6 percent. All numbers are calculated on the turnover per 2011 for the entire supplier
base.
Supplier performance dashboard at Volvo Logistics
36
4.2.1 Supplier performance requirements
To achieve consistency in supplier agreements, VLC has developed generic contracts that are
specifically adjusted to the different commodities that are explained in more detail in chapter 4.2.2.
In the contracts, the required performance levels for different parameters and KPIs are formulated
for each specific contract. Since the performance requirements vary depending on location, VLC has
also developed generic contracts that adapts to the region of the world where the operations are
carried out.
Attached to each contract is a standard operating procedure (SOP)-document that specifies the
requirements on operational procedures. The SOPs are developed by the Global Business Operations
(GBOs) according to the demands of the customer. More details about the performance
requirements set by the GBOs are provided in chapter 4.4.
Figure 16; Spend divided by business area, 2011. Figure 17; Number of active core suppliers per business area, 2011
Figure 18; Spend divided by traffic mode, 2011.
Supplier performance dashboard at Volvo Logistics
37
4.2.2 Sourcing strategy
The operations at the purchasing department of VLC are divided into 21 different commodities
spread over the three business areas Inbound, Outbound and Emballage see table 7. The table
provides a rough description of what logistics related services and materials are being bought by the
purchasing department of VLC.
Table 7; Overview of the different commodities that are applied by the purchasing department.
Transportation services accounts for the major part of the purchases, while logistics services and
packaging material as well as non-automotive products (NAP) accounts for a smaller share of the
total spend, see figure 19.
Currently, the purchasing department is developing specific strategies for each of the commodities
that are included in table 7. One potential area of application for the supplier performance
dashboard is to be a supportive tool in the commodity strategy development work. The aim of the
Road – LTL Road – Truck & Buses Logistics Services – OB related
Road - Express Road – High &Heavy Logistics Services – EMB related
Rail Road – Passenger Packaging Material Plastic
DeepSea & ShortSea - Container
DeepSea - RoRo Packaging Material Wood
Air – Forwarders Packaging Material Disposable
Air – Integrators Packaging Material Metal
Air – Charter
LCL forwarder global
Figure 19; Pie chart visualizing the spread of purchased goods, 2011
Supplier performance dashboard at Volvo Logistics
38
strategy development work is to find the right sourcing strategy for each of the 21 commodities and
provide the purchasers with guidelines towards which suppliers to sign contracts with.
For each commodity the potential suppliers will be grouped into four different categories according
to their importance, and within each category the suppliers will be prioritized. This prioritization will
depend on the supplier’s performance and its importance to the operations of VLC. Within the first
category a number of two to ten suppliers will be ranked as strategic suppliers. These strategic
suppliers should be considered first when a new tender within the specific commodity are to be
negotiated. Within the second category suppliers should be used if the ones categorized as strategic
in the first category for some reason cannot be used. In the third and fourth category suppliers that
have potential or are required by customers are grouped. If a supplier from one of these categories
should be considered for a contract, the issue must be approved by the purchasing director. Signing
contracts with suppliers from the first two categories can be done on the purchasers own mandate
since it is aligned with the commodity strategy.
4.2.3 Supplier self-reporting
Today, the suppliers provide VLC with information about their own operations and current status
regarding environmental, quality and safety work. The annual supplier survey and regular Requests
for Information (RFI) is one way to collect supplier self-reported data and the carriers are also
carrying out daily reporting into the different operational systems regarding pick-up and delivery
confirmation. However, it is interesting to investigate the suppliers’ thoughts and ideas about
extended reporting; the suppliers willingness to share with VLC their own measurements and
performance levels e.g. through self-reporting.
A list of questions was sent out to five of the top suppliers of VLC, spread on the different traffic
modes sea, rail and road transports. The list of questions is included in appendix 3. It was shown that
the suppliers were positive towards a Supplier performance dashboard and they see the dashboard
as a tool for communication and a way to build a closer relationship between themselves and VLC.
One of the initial ideas regarding self-reporting by the suppliers into the dashboard considered
measurements on emissions. However, it was found that the suppliers did not carry out more
detailed or frequent measurements than the ones available through the fleet sheets within the
Supplier Survey. Neither were operational measurements on lead-time and precision performed in a
way that would allow the suppliers to report these metrics into the dashboard.
4.3 Supplier measurements within VLC Within VLC, there are several departments that
carry out supplier measurements, supplier
assessments and varying levels of supplier follow-
ups. In this section, the different departments of
relevance regarding data collection to a supplier
performance dashboard are presented. First, the
measurements collected and stored at the Global
purchasing department is presented whereby a
description of measurements and storage systems
connected to the GBOs, Operations excellence, Risk
Management and Invoicing & Cost Control
Supplier performance dashboard at Volvo Logistics
39
departments follow respectively.
Each department will be presented in the same way, starting with a general description of the
departments objectives. The second part is covering the measurements currently performed within
the specific department and third the systems in which the measurements are collected and the level
of aggregation upon which they are measured will be described. The IT projects of LES and ATLAS will
have a large impact on the supplier performance dashboard, for background information see
appendix 6.
This division is in close connection to the three reasearch questions of this thesis, see table 8.
Research question one is connected to the first general description of each department and their
supplier evaluation process today as well as the second part of which measurements that are carried
out. The current measurements from all departments will also form the basis for answering the
second research question on which KPIs and measurements to include in the Supplier performance
dashboard. Last, the third part on level of aggregation and system storage for the KPIs and
measurements will answer the third research question.
Table 8; Structure of chapter 4.3 and alignment with research questions
Research question Content
RQ 1 General description
RQ 2 Measurements
RQ 3a, 3b Systems & Identification
4.3.1 Global Purchasing
The Global Purchasing function of VLC is responsible for purchasing of transport, logistics services
and packaging material. Global Purchasing serves both internal AB Volvo customers and external
customers. The function is organized around the three business areas Inbound, Outbound and
Emballage as previously mentioned. The purchasing department Inbound is responsible for
procurement of transports of material and emballage in to the factories while the Outbound
department buys the transports of finished products that is going to be distributed to the dealers.
Emballage purchases packaging material and services related to logistics centers and terminals.
4.3.1.1 Measurements
Within the Global Purchasing function of VLC, the department PS&S has some specific areas of
responsibility regarding measurements of, and follow up on supplier performance. In the sections
below, these areas are briefly described starting with presentation of RFI and Supplier Survey, then
followed by a description of the financial analysis of suppliers and ended with presentation of the
global spend report.
RFI and Supplier Survey
Within the Global Purchasing function of VLC, the department PS&S is responsible of carrying out an
annual supplier survey where the data is used to follow up the Core Value objectives, check
compliance with the supplier requirements and to perform environmental calculations. The results
are also used in communication with the stakeholders of VLC. Participation in the survey by all
suppliers has been mandatory since 2009. The survey is carried out in the beginning of each year and
sent to the suppliers on a group level. More information regarding the measurements and KPIs that
are the results of the supplier survey are included in chapter 4.5; Operational excellence. The metrics
Supplier performance dashboard at Volvo Logistics
40
are summarized in chapter 4.5 since the core value related metrics should be presented together.
Even if the PS&S department is carrying out the process of the supplier survey and Operational
Excellence only is a supportive function, the metrics will be presented there.
PS&S is also carrying out Requests For Information (RFI) approximately every other year where
similar questions as in the supplier survey are being asked to core suppliers. However, in the RFI,
there are additional, more detailed questions included. The intension by VLC is to merge the supplier
survey and the RFI in order to be more efficient and only send out one survey.
Financial analysis of VLC’ suppliers
Within the department of PS&S, the financial status of VLC’s major suppliers is monitored and
analyzed. The monitoring is essential in the economic downturn since some suppliers are likely to be,
or will end up in a situation with a high risk for business failure requiring actions from VLC. The
information is delivered by two financial institutes, one covering Scandinavia and one covering the
global suppliers. The financial information about the suppliers in the European countries is
continuously updated as soon as changes occur, while the remaining suppliers are updated annually.
All core suppliers are being monitored in the financial analysis.
The financial analysis provides different components; credit worthiness, financial data/ratios and the
supplier’s ability to pay. The analysis is summarized in a ranking, a risk indicator from 1-4,
representing the total risk for business failure of the supplier. The four levels of ranking are denoted
as follows:
1= Low risk
2= Lower than average
3= Medium
4= High risk of business failure
If a supplier is ranked with a level of 3 or 4, it is the responsibility of the accountable purchaser to
contact the supplier and take actions. Such action could be to monitor the supplier closely, that the
owner company of the supplier takes financial responsibility for the supplier if being a part of a larger
organization or making sure that the supplier has launched measures for cost-savings and other
rationalizations for VLC to monitor. Depending on the status of the supplier within the VLC supplier
base, the actions may differ. A smaller supplier within express transportations is not as crucial and
can for instance be replaced much easier than if a supplier with a large spend and is hard to replace
is facing financial troubles.
Global spend report
In addition to the financial analysis and ranking of the core suppliers, a Global spend report is carried
out twice a year by the PS&S department. Information about amounts spent on each supplier is
collected manually from local sites and compiled. The data is originally collected from the supplier’s
invoices and therefore, the information is on PARMA-level. Since all sites do not share the same
systems support, the data cannot be attained automatically but requires manual reporting. This
restricts the possibility of more frequent updates of the spend data than semi-annually.
Supplier performance dashboard at Volvo Logistics
41
4.3.1.2 Systems and identification
Supplier Survey
The results from the Supplier Survey is gathered and stored in excel-files, maintained by the PS&S
and Operational Excellence departments. Operational Excellence performs calculations on fleet
sheets and other environmentally connected measurements while PS&S are maintaining the ISO
related excel-files. More information regarding the measurements and KPIs that are the results of
the supplier survey are included in chapter 4.5 Operations excellence.
Financial analysis of VLC’s suppliers
The information and ranking gathered through the external financial institutes are summarized and
stored in an excel-file, updated and controlled by a member of the PS&S department. The
information is sent by mail to the responsible employee from the suppliers and the reports are also
stored as PDF-files.
The financial evaluation is performed on supplier group level as extensively as possible. A large
supplier may have many different subsidiaries connected to the parent company but it is not feasible
to collect financial information on all of them. If there is a financial problem for one of the
subsidiaries, it is the parent company that has the overall responsibility for the financial
performance. The identification is the company identification number and PARMA-ID is not used.
Global spend report
The Global spend report carried out by the PS&S department is compiled within an excel sheet,
where the information can be divided and displayed in different ways. The excel sheet displays a
complete picture of what has been spent globally and it is possible to derive the amounts of each
supplier to either inbound, outbound or emballage operations. The data is presented on PARMA-
level but it is also possible to aggregate it to the total spend on a supplier group level. There is also a
representation of the spend data in each of the regions North Americas (NAM), Europe, Middle East
& Africa (EMEA) and Asia & Pacific (APAC).
For the European region, it is possible to extract data on a more frequent basis since the information
is stored in a data warehouse. The information is gathered from the Invoicing & Cost Control (I&CC)
department, dealing with all invoices at VLC. However, as this system is not used globally at all sites,
monthly updates would create data disparity and it would not be possible to get a complete picture
of the total spend globally. The supplier measurements within purchasing are summarized in table 9.
Table 9; Summary of Purchasing KPIs
Possible KPI:s System
(present) System (future)
Identification Global/Regional
Financial ranking External External Supplier group level Regional, Europe
Spend Excel LES? PARMA-ID Global
4.4 Global Business Operations Within VLC, there are three Global Business Operations (GBOs); Inbound, Outbound and Emballage.
The GBOs are the interface between VLC and its customers. The three operations are the creators of
the SOPs that are attached to the business contracts. The SOPs state the requirements on what is to
be purchased by the purchasing department and the supplier requirement levels are set by the
Supplier performance dashboard at Volvo Logistics
42
GBOs. Purchasing signs the contracts while it is the responsibility of the GBOs to ensure that the
requirements are met. In the following sections, each of the GBOs is presented.
4.4.1 Inbound
Inbound is responsible for arranging movements of material, information and inventory from
suppliers around the world to production facilities (AB Volvo, 2011). Inbound focuses on total
logistics solutions which encompass the whole process from logistics development and design of
material flow, to carrier selection, traffic control, risk management and logistics centers (AB Volvo,
2007a).
Within the Inbound operations, several cross docks are used to consolidate and repack goods that
come from a number of different material suppliers and are going to be distributed to customers’
production facilities all over the world. In order to improve the ability to consolidate goods, the
department uses fixed, predefined pick-up days and do also, works with fixed lead times. To make
this as efficient as possible, VLC determines the pick-up days while the customers decide upon the
frequency of pick-ups per week. The traffic department strives to develop standard procedures that
are applied globally.
4.4.1.1 Measurements
The fixed settings of lead times and pickup days also form the basis for what supplier performance
metrics are most important to measure and focus upon. The most important measurements at
Inbound are:
Pick-up precision
Delivery precision
Lead time (transport precision)
Deviation reporting
The measurements are illustrated in figure 20. Pick-up precision measures whether the goods has
been picked up the correct day and within the right time window. Delivery precision is a
measurement of the number of deliveries on time to the cross docks or the customers’ goods
receptions compared to the total number of deliveries. This is measured on trailer level; the number
of trailers delivered on time. Delivery precision is measured at the breakpoints that are managed by
VLC and at some of the customer sites where there is an agreement that the measurements should
be carried out.
Inbound uses transport precision as a measurement for lead time performance; that the carriers
operate according to the predefined lead times. If a transport route consists of different modes of
transportation, it is divided into shorter legs where the legs are measured separately. In this case, the
consignment is measured on container level. Due to system limitations, Inbound only measures lead
time and pick-up precision for a part of the operations.
Supplier performance dashboard at Volvo Logistics
43
The carriers are obliged to report delays and deviations to the customer service function. Inbound
has put a requirement on the carriers to have one hundred percent deviation reporting. It is an
important KPI as proactive deviation reporting enables VLC to rebook transports and ensure that
material and goods are delivered in time. Deviation is registered on the carrier’s PARMA-ID. Most
often, it is possible to decide which party is responsible for a delay; the carrier or the material
supplier, but there are occasions where it is difficult to determine and disputes occur.
When the transport suppliers do not perform according to the requirements, Inbound has developed
an escalation ladder. There are several units on the operational level that have direct contact with
the suppliers and the intension is that the most urgent issues are managed and solved by those units.
If the issues cannot be solved, the case is escalated to a person responsible for traffic. The second
level of escalation is when the responsible purchaser becomes involved and if the problem persists,
the purchasing manager intervenes.
4.4.1.2 Systems and identification
The ability to measure carrier performance at Inbound varies depending on location and what system
is employed. There are mainly three systems in use; Transport Information Routines (TIR),
Forwarding Administration System (FADS) and Advanced Transport Logistics for Automotive Supply
(ATLAS). If comparing the measurement systems, they do not measure all the same KPIs and
different definitions for measurements apply. TIR and FADS will eventually be replaced by ATLAS and
in the future ATLAS system, the same KPIs and definitions will be used and the same working
procedures concerning these issues can be applied. ATLAS is also the main system for the operations
in the US but the system is still under development. The intension is to have a global system that
enables consistency in the measurements regardless of location around the world, which is hard to
achieve with separate systems. Some of the new functionalities in ATLAS will be introduced in mid-
May, beginning of June in 2012, but additional functionalities will not be implemented until the end
of year 2012. The first roll-out will cover the European road operations and additional areas will be
added in later stages.
In order to identify underperforming carriers, Inbound has recently started to compile carrier
performance in an excel sheet since data cannot be found in only one system. The transport
suppliers that account for the largest share of the turnover are assessed. Traffic managers globally
are responsible of reporting, on a monthly basis, the status of the performance of the carriers within
the most important KPIs. The measurements are registered on contract level since Inbound wants to
assess how different transport suppliers perform in different regions; one supplier that accomplishes
Figure 20; Illustration of the precision measurements at Inbound.
Supplier performance dashboard at Volvo Logistics
44
a certain level of performance in one region may not reach the same levels in another part of the
world.
The KPIs are divided into three groups that each receives an overall score; precision, system
availability and proactiveness. Precision includes pickup precision, lead time precision and delivery
precision. System availability measures ATLAS input and FADS input while deviation reporting and
availability connect to proactiveness. The excel sheet does not contain information about actual
supplier performance levels but color coded numbers from 1-4 represents the supplier’s status in the
escalation process. If a supplier has reached level four, it means that the issue has formally been
handed over to the purchasing department. One of the purposes with the excel sheet is to be more
clear towards purchasing; to make clear that when a case is handed over, Inbound has already
handled the issue in several steps and it is the responsibility of the purchasers to take further action
towards the supplier.
The executive team of Inbound has recently initiated a forum where representatives for the Inbound
departments Traffic and Logistics development, and Purchasing meet regularly. The primary topic for
these meetings is deviations; where different types of deviations that are compiled in a weekly
report are being discussed. Inbound distinguishes between three types of deviations; internal
reported, carrier reported or customer reported deviations, where the last mentioned is the most
severe one. Carrier reported deviation in itself is undesired, but still, it enables Inbound to alert the
customer about the delay and it is possible to rearrange the transport or book rushes.
Inbound also employs carrier evaluations. Depending on the strategic importance of the transport
supplier, meetings are held between Inbound representatives and transport suppliers one to two, or
four to six times a year. The Inbound related supplier KPIs are illustrated in table 10.
Table 10; Summary of Inbound KPIs
Possible KPI:s System
(present) System (future) Identification Global/Regional
Delivery Precision TIR/FADS/ATLAS ATLAS Lane-level Regional, Europe
Pick-up Precision TIR/FADS/ATLAS ATLAS Lane-level Regional, Europe
Lead time TIR/FADS/ATLAS ATLAS Lane-level Regional, Europe
Deviation Reporting TIR/FADS/ATLAS ATLAS Lane-level Regional, Europe
4.4.2 Outbound
The Outbound GBO of VLC is responsible for delivering finished products from factory to customer.
Outbound operates globally and offers transportation of various types of vehicles as well as related
complete distribution solutions for logistics and information services. Within the service scope of
Outbound several areas is found; both distribution of vehicles from consignor to consignee of as well
as local vehicle movement within factory yards. Exhibition and introduction material, special and
secrecy transportations, local courier pick-up of cargo as well as personnel transportations in and
around Gothenburg is included in the services performed by the Outbound department.
4.4.2.1 Measurements
At Outbound, the most important measurement is precision. Precision metrics at Outbound includes
the KPIs delivery precision and transportation lead time. When measuring delivery precision,
Outbound focuses on target fulfillment. Target fulfillment is the ratio between the actual
Supplier performance dashboard at Volvo Logistics
45
performance level divided by the required level of performance. If the required level of performance
is 95 percent and the actual level is 93 percent, then the delivery target fulfillment value is 93/95 =
98 percent. A supplier with performance above the required level will, in principle, also achieve a
lower level of target fulfillment performance. This is important to keep in mind since a higher level of
performance than agreed upon, may imply higher transportation costs. Target fulfillment is also a
useful measurement when assessing the performance of a supplier that operates in different regions
where the performance requirements varies. With a target fulfillment ratio, it is possible to
aggregate up a total level of performance for a specific supplier. Another aspect of importance is
reporting; Outbound measures the suppliers’ arrival and departure reporting and requires timely
reporting by the suppliers.
When suppliers are not performing according to a sufficient level of performance, Outbound has a
specific process to handle this. The first step contains a so called SFUR (Special Follow Up Routine)
where corrective actions are taken by the operation together with the supplier. If the problem is not
solved, the case is escalated to a critical supplier forum where purchasing representatives
participate. The last step in the escalation process is the purchasing board which will be involved if
the problem remains.
4.4.2.2 Systems and identification
The information is stored on PARMA-IDs in a global computer system called A4D (Application for
Distribution). The system allows data search and presentation of data on supplier, destination, region
etc. i.e. representation of data in many different ways. The Outbound related supplier measurements
are illustrated in table 11.
Table 11; Summary of Outbound KPIs
Possible KPI:s System
(present) System (future)
Identification Global/Regional
Delivery target fulfillment A4D A4D Lane-level Global
Arrival reporting A4D A4D Lane-level Global
Departure reporting A4D A4D Lane-level Global
Lead-time A4D A4D Lane-level Global
4.4.3 Emballage and Logistics Services
The Emballage function supports the Volvo group with packaging materials; the function provides
both standard and special packaging. The main responsibility of Emballage is to ensure availability of
packaging material when needed. The ability to secure availability of packaging material is dependent
on mainly three parameters; enough terminal space to handle the volumes, enough washing capacity
to clean the used material for reuse and finally, sufficient reparation capacity to repair broken
packaging. Emballage is the department in charge of estimating and detecting when capacity is
insufficient, when packaging is running out and purchase of new material is needed. The new
demand is then reported to the purchasing department and it is their responsibility to make the
commercial negotiations.
The function works with a global pool of packaging, see figure 21, where new material is bought in
centrally from the office in Gothenburg. The emballage pool is organized around approximately 40
terminals and depots that are spread into different parts of the world. Three of the terminals are
Supplier performance dashboard at Volvo Logistics
46
owned by Volvo; one in Gothenburg, one in Skövde and one in Poland and the rest are owned by
external parties whose services are bought in regionally by VLC.
4.4.3.1 Measurements
VLC puts specific capacity requirements on the terminal suppliers but the ability to measure, and
keep track of the performance of the suppliers is limited. Many of the limitations are due to system
restrictions. Delivery precision is central to the operations at Emballage but currently, no system
supports this or provides any ability to measure it. This problem also concerns the logistics services;
Emballage wishes to put metrics on the performance of the service providers but currently, the
department has no system support to evaluate and follow up on this.
4.4.3.2 Systems and Identification
Emballage works in an old, mainframe based computer system called Volvo Emballage Management
System (V-EMS) where suppliers are identified with a so called Emballage-IP number and PARMA-ID
is not used, even if there is a connection between the two. In V-EMS, data is only stored 18 months
back in time and the system does not have any function for materials sourcing which makes it
difficult to monitor supplier performance. Currently, Emballage is also using EBD (Enterprise Buyer
Desktop), a system where call-offs on packaging material are made. However, this system does also
have its limitations; for instance, it is not possible to feed the system with lead times which restricts
the ability to work with deviation reporting. Emballage is included in the ongoing LES (Logistics
Enterprise Solution)-project and the intension is that the department will get a new SAP based
system where the opportunities for measurements and follow up will be better than in the current
systems in use. An import KPI that will be possible to monitor in the future when LES is implemented
is the Delivery Precison of new packaging material. This will enable more sufficient planning and
monitoring within the department.
There are two major reasons why the department needs a new system; the V-EMS system lacks a
function for planning and the balance accuracy is deficient. The planning is today, carried out with
support of an enormous excel sheet but the prospects for the future is to have a system that
supports both planning and monitoring of account balance. LES is mentioned as one possible solution
but the project is not fully developed yet. There are however possibilities within the new system to
measure delivery precision on new orders of emballage on a supplier level. The Emballage related KPI
is included in table 12.
Figure 21; Illustration of the Emballage global pool of packaging
Supplier performance dashboard at Volvo Logistics
47
Table 12; Summary of Emballage KPIs
Possible KPI:s System
(present) System (future) Identification Global/Regional
Delivery precision N/A LES Supplier-level Global
4.4.4 Emballage transportations The transportation and movement of packaging material and emballage within VLC is monitored and
carried out by the Order and Distribution Department within the GBO Emballage. This department
works within five main areas; distribution of empty packaging, order handling both adjustment of
orders and additional requests, deviations in delivery of empty packaging and collection of damaged
packaging.
There is a strong connection between the transportation of emballage and inbound materials since
they are all separate legs within a larger flow and shares the same contract with the suppliers.
However, they are both under the responsibility of the Inbound department of VLC Purchasing. The
supplier that carries out the transportation of empty emballage from VLC’s terminals to the user is
the same supplier that performs the transportation of filled emballage from the user to the VLC’s
customer. The user of emballage is the same as the component suppliers to the customers, and the
customers are the manufacturing plants of Volvo and other external customers, see figure 22.
The terminals are located in close proximity to the users. In Gothenburg the terminal is located in
Arendal and the largest users are Volvo Trucks in Tuve and Volvo Cars in Torslanda. There are
thousands of different emballage types; the most commonly used are though the L-pallet with collar
and lid, as well as the blue boxes. These emballage types stand for 75 to 80 percent of the total
volume.
4.4.4.1 Measurements
At the moment, it is only one measurement that is performed and that is pick-up precision. This
measurement is performed on a monthly basis within Europe. Other regions outside Europe do not
have the same structure and thus not the same possibilities for performance measurement due to
foremost outsourcing of emballage transportation. The booking process starts with a proposal from
VLC stating the total number of orders for the next week, divided on each day and specific times. The
Figure 22; Flow of emballage.
Supplier performance dashboard at Volvo Logistics
48
supplier makes adjustments suitable to their schedule and an exact plan is decided upon and
registered in V-EMS. It is against this plan measurements are performed.
This metric does not only measure the performance of the suppliers but also the internal
performance and the performance of the terminal. It is also not only the number of orders picked-up
that is measured, the reason for why a certain order is not picked-up is also logged, according to
different codes.
Other goods on the trailer.
Too small trailer.
Not approved trailer.
Not collected.
All codes are measured on three levels; number of orders, volume and monetary. Between the
different actors it is the internal errors that cause the largest monetary impact but it is the suppliers
that have the highest number of deviations that creates the largest problem to sort out. The
terminals have a lower number which is to be expected, it is though needed to point out that the
coding is done by the personnel at the terminal and therefore the coding may be subjected to bias.
Depending on the level used it is the ratio of the total number of orders compared to registered
deviations that is the interesting information to use.
All suppliers are measured and have a requirement to fulfill 98 percent of their pick-up precision
according to the contracts. However, action plans and follow-up is not done until the suppliers fall
below 95 percent fulfillment. Problems are not brought to the purchasing department’s attention
until it turns out to be too large for the operation to deal with.
Performance measurements beyond the pick-up precision, such as delivery precision is not possible
to measure today due to the fact that there is no active receiving of the goods. There is no logging of
the emballage upon arrival and hence accurate measurements cannot be done. It is the users who
alert the operation about problems such as goods not arriving; hence the department works reactive
instead of proactive.
4.4.4.2 Systems and identification
The suppliers carrying out the transportations are identified through their PARMA-ID and for
suppliers of emballage a second number for identification, EMBALLAGE-IP, is introduced. This
emballage specific identification is connected with PARMA-ID, being used throughout the entire
Volvo organization. For the large transportation suppliers it is however PARMA-ID that is the
identification to use. Table 13 includes the Emballage transportation related supplier KPI.
Table 13; Summary of Emballage transportation KPIs
Possible KPI:s System (present) System (future) Identification Global/Regional
Unloading precision V-EMS LES PARMA-ID Regional, Europe
4.5 Operational Excellence The Operations Excellence function at VLC works with questions related to the core values of AB
Volvo and VLC as well as acting as a supportive function to all other departments. The Operations
Supplier performance dashboard at Volvo Logistics
49
Excellence function has governance of all core value related questions and sets up overall goals and
strategies for the entire VLC organization. Each department breaks down these overall strategies into
department specific core value strategies.
The core values of AB Volvo and VLC are quality, environment care and safety; values that are all
central in the company’s business operations. With high quality, VLC intends to get “the right
product, to the right customer, in the right quantity, in the right condition, at the right place, at the
right time and at the right cost” (AB Volvo, 2007). Regarding safety issues in the logistics context, VLC
emphasizes the importance of appropriate speed, use of seat belts, driving and resting times,
securing of loads, alcohol and drugs policies and carefully monitoring of dangerous goods.
4.5.1 Measurements
Related to each core value of AB Volvo, there are different criteria that are being demanded from the
VLC suppliers. In the sections below, a summary of the performed measurements related to each
core value are presented. As mentioned in chapter 4.3.1 this survey is performed by the PS&S
department but the related metrics and measurements are presented below:
Quality
One demand is that the suppliers are certified according to the ISO 9001, which is a certificate for an
approved quality management system. If, for some reason, the supplier cannot provide a certificate,
the Operations Excellence function will have to investigate the supplier in question in order to
document what other system is in use. If the investigation finds that an equivalent system to the ISO
certification is used, a formal deviation handling from AB Volvo needs to be signed. This deviation
reporting states that AB Volvo approves the inclusion of the supplier within the supplier base despite
the lack of ISO certification. Quality issues related to damage goods are handled by the Risk
Management department, which is described in section 4.6.
A supplier measurement that involves all three core values, not only quality, is the Corporate Social
Responsibility (CSR) Compliance. CSR includes a number of topics related to a company’s influence
on its society on economic, social and environmental aspects. The suppliers are asked in RFIs and the
Supplier Survey on their CSR Compliance as well as other related issues such as their approval to
follow The Volvo Group’s Code of Conduct. There is no consistent definition or industry standard of
CSR compliancy but a new standard for CSR related questions with a third party certification is under
development.
Environmental care
Within environmental care, certification according to ISO 14001 or SmartWay in the USA is required
by the suppliers. Emissions from the transports are another vital part to monitor. Today, the
Operation Excellence function creates stencil calculations on the emissions from each supplier from
the information registered in the annual supplier survey by the suppliers. These calculations deliver
an average number on emissions of CO2 in gram per ton-kilometer per supplier. The calculations are
created from the fleet-sheet information provided by the supplier, a list of all vehicles used within
their operations and their motor class. Since the average of CO2 emission is difficult to compare to
one another, the average motor class compiled from the fleet sheets provides more comparative
information. Today average motor class is only calculated for road transportations.
Supplier performance dashboard at Volvo Logistics
50
Within the sea traffic mode a new standard for measuring the supplier from an environmental aspect
is developed within Sweden; the Clean Shipping Index. This index measures the shipping companies
in several different areas such as; emissions to air, spill of waste water into the ocean, use of
chemicals and the leakage of ground paint from the vessel into the ocean. The shipping companies
enter data on their fleet of vessels making it possible for the cargo user to gain information and
compare different shipping companies or vessels against each other. VLC is one of thirty large
Swedish companies currently using the Clean Shipping Index and fourteen of the world’s largest
container carriers have entered data as well.
The demands put on the modes of air and rail needs to be developed further in order to be possible
to monitor. Today, the traffic mode rail could be evaluated on its use of fuel, and if it is electrical
trains the question on how the electricity was produced may be of interest to ask in the supplier
survey. Regarding air, this traffic mode is seen as the “worst” from an environmental angle and
should be avoided to the largest possible extent, but no calculations on emissions or other demands
are brought forward from VLC to the concerned suppliers.
The suppliers of new material for emballage are asked in the supplier survey whether or not they are
working in accordance to the black, grey and white lists provided by the Volvo Group with
information on chemical substances that are forbidden, should be avoided or are approved to use.
This is a pre-requisite for the suppliers during the pre-sourcing process in order to be considered
included in the VLC supplier base, hence not as important in the evaluation work moving forward.
Safety
The safety issue is, to a large extent, connected to the safety of traffic such as the driver’s use of seat
belts, the use of alcohol and drugs, keeping the speed-limits and accurate handling of hazardous
goods. These types of questions are compiled under the measurement of Overall Risk and is also
included in the annual supplier survey and followed up through Transport Quality Audits performed
by the Risk Management department where these questions are asked. For more information about
the Risk Management’s Transport Quality Audit, see section 4.6. The answer of the drivers from the
Transport Quality Audit is then compared to the answers given by the supplier in the supplier survey.
As seen below in figure 23 there is a deviation on what is reported by the suppliers in the supplier
survey and what is detected when carrying out the safety audits. However, some deviations are
positive; there is for instance a slightly higher number of drivers using seat belts than stated in the
supplier survey.
Supplier performance dashboard at Volvo Logistics
51
Figure 23; Comparison between suppliers’ answer in supplier survey and result from safety audits, 2010..
There are other aspects to traffic safety as well, such as the laws and regulations of transportation.
The regulations are the physical demands on the vehicle; correct breaks and tires, working lights as
well as the regulations put on the drivers on driving and resting hours. The Operation Excellence
department works in close connection to the Swedish police with these questions. The function
participates, or gets reports on the outcome of performed inspections on vehicles carrying VLC
goods. These types of inspections are carried out in Europe, mostly Sweden, and only on road
transportations.
The supplier survey also includes the question whether the supplier has a contingency plan or not.
This is a yes or no question asked mostly to ensure that the suppliers have such a plan, especially the
emballage material suppliers, suppliers of logistic service centers or single-sourcing suppliers. If a
situation arises where the capacity of the supplier to perform the contracted action is in trouble, VLC
can put demands on the supplier to work through the problem. The supplier will have to use another
solution, since the supplier has stated that they have a contingency plan and are prepared for
possible disturbances.
4.5.2 Systems and identification
The input of data to the Operation Excellence department is provided by PS&S through the annual
supplier survey. The supplier survey has three purposes for the department. First, to make sure that
the demands put on the suppliers are being followed. Secondly, the information gathered enables
the department to follow up on the environmental and core value goals for VLC and third, the data
forms the basis for calculation. The calculations and analyzes of data are carried out through Excel-
based solutions.
The supplier survey is sent to suppliers on a supplier group level; hence the information is only
possible to access on this level. The survey is not global but limited to Europe. The supplier
measurements that are related to Operational Excellence are included in table 14.
99% 97% 100% 98% 98%
85%
98% 98%
50%
60%
Always keep speedlimits
Always use seatbelts
Always respectdriving & resting
times
Employeer alwayschecks alcohol &
drug use
Always secure loadaccording toregulation
Supplier Survey 2012 Result of safety audits 2010
Supplier performance dashboard at Volvo Logistics
52
Table 14; Summary of Operation Excellence KPIs
Possible KPI:s System (present)
System (future)
Identification Global/Regional
ISO 9001 Supplier Survey
- Supplier group level Global
ISO 14001/Smart Way Supplier Survey
- Supplier group level Global
Motor class, average Supplier Survey
- Supplier group level Regional, Europe
CO2 emissions, g/ton-km Supplier Survey
- Supplier group level Regional, Europe
Clean shipping Clean Shipping Index
- Supplier group level Global* (for suppliers based in Europe)
Contingency plan Supplier Survey
- Supplier group level Global
CSR Compliance Supplier Survey
- Supplier group level Global
Overall Risk Supplier Survey
- Supplier group level Global
4.6 Risk Management The insurance issue of the Volvo Group is handled by the Headquarters but the logistics part is
delegated to the Risk management function at VLC. Risk management consists of four different
departments; Insurance & Claims, Customer Relation and Quality Assurance where High and Heavy is
an own department. The Insurance & Claims department handles the damages of cargo towards
customers and suppliers; the customer relation department makes sure that the customers have the
correct insurance coverage whilst Quality Assurance tries to prevent the accidents from occurring.
The different insurance policies presented below are the backbone within the work of the risk
management function, and from which everything is derived:
Cargo insurance; a property and casualty insurance bought for VLC’s customers in order to insure the
goods during transportation. The liability VLC has towards the customer through the signed contract
is covered by this insurance. This is an all-inclusive insurance, first signed in 1947 and used globally as
much as possible. However, there are countries that do not allow a global insurance, but instead
requires a local insurance and hence a local policy from VLC. These countries are Brazil, China, Russia,
India and the USA.
Freight forwarders liability, this insurance is for the third-party customers of VLC, companies outside
the Volvo group. This insurance is not needed within the Volvo group, since liability insurance cannot
cover the company’s own operations.
Professional indemnity, this is consultancy liability insurance, applicable for the work of consultants
within the Volvo group that covers loss of capital due to wrong counseling. This is mostly used within
research and development.
Property insurance, this insurance covers loss of or damage to property of the Volvo Group such as
buildings and terminals, but also machinery, computers and inventory. The general policy of the
Supplier performance dashboard at Volvo Logistics
53
Volvo Group and Volvo Group Real Estate (VGRE) covers most of these issues. Products may also fall
within this category if they are on stock, as well as including emballage.
General liability, an insurance from the Volvo Group covering costs for a third-party and third-party’s
property if something is destroyed or damaged, for instance if a forklift drives with the forks into a
parked car while unloading a truck.
When transporting goods, it is always partly insured by the freight forwarder, but only to a certain
degree. How much is dependent on an entity called Special Drawing Rights (SDR) which is a foreign
exchange reserve and the compensation is calculated with regards to the weight of the products.
VLC’s products is mostly heavy but this insurance is not enough for full coverage and it is extremely
important to cover products with a cargo insurance, especially if they are light in weight but with a
high value. The emballage used by VLC, is both light in weight and holds a low value. Therefore, the
emballage is covered by the STR and additional insurance is not needed. This is the reason why the
Risk Management function only covers the business areas Inbound and Outbound and not
Emballage.
Besides different policies for different geographical areas there are also different laws and
regulations in different countries. The securing of loads is one aspect where there are no general
standard, not even within the EU. Therefore, pan-European transportations need to meet different
requirements depending on country. At the loading, consideration needs to be taken upon which
countries the transportation will go through.
4.6.1 Measurements
The analysis tool used within Risk Management, BAS (Business Analysis System), enables the user to
look at accidents and cargo damages on a detailed level for each supplier, each market, product and
lane. The supplier may be involved in a number of accidents but they will only be legally responsible
for a part of these. There is a lead time for accidents; suppliers have twelve months to regress.
Hence, it is not certain that the supplier is legally responsible of all accidents registered per month.
This fact is important to consider when deciding upon which of the two numbers to include in the
dashboard. The total number of accidents is important in order to improve the overall quality of the
supplier even if the supplier is not liable for all accidents. However, if sharing the information of the
dashboard with the supplier, it is important to explain how the number is calculated.
The Risk Management department and the quality assurance unit also perform transport quality
audits of the suppliers. These audits evaluate the supplier on different aspects according to the
handling instructions enclosed in all contracts. These handling instructions contain information on
how to carry out the transportations of VLC goods, one for each traffic mode of sea, rail, road, air and
yard-handling. A problem with suppliers not following these instructions may be that there are no
common standards; hence all suppliers have different handling instructions for different customers.
When the audits are carried out questions related to traffic safety issues are also asked for the
Operations Excellence department, see section 4.5. The result of the Transport quality audits,
excluding traffic safety issues, is ranked on a three-rated scale. If the supplier receives a lower score
due to some issues not being performed according to the handling instructions, this is pointed out to
the supplier who creates an action-plan and a new audit is carried out.
Supplier performance dashboard at Volvo Logistics
54
4.6.2 Systems and identification
Risk Management has built its own system together with Volvo IT called Risk Management System,
(RMS). This system gathers information regarding audits, transportations, damages etc. The system is
used globally and it is possible for the department to implement the system at new sites through its
web based structure. RMS is connected to the system within Outbound, A4D. This connection makes
it possible to compare the reported data on damages to the transportation data within A4D.
Unfortunately this is not possible with the system within Inbound. ATLAS is being implemented
across the Inbound organization but not yet in full use. That RMS is not fully integrated with ATLAS
hinders the Risk Management in their work as the relevant data is not accessible.
BAS is an analysis tool that gathers information from a data warehouse, which stores information
from numbers of systems within VLC. This information can be entered into BAS and then sliced and
diced in order to analyze according to the specific needs. The data warehouse and the connection to
A4D also make it possible to create reports towards the customers of Outbound, which is not
possible for Inbound.
As identification of suppliers, PARMA-ID is used. The PARMA is chosen according to the contracts
signed between the purchasing department and the suppliers. However, there are some problems
with suppliers that have several PARMA-ID in use, especially within Inbound. The Risk Management
related measurements are included in table 15.
Table 15; Summary of Risk Management KPIs
Possible KPI:s System
(present) System (future)
Identification Global/Regional
Transport Quality, number of damages
RMS RMS Supplier group level Global
Transport Quality Audits RMS RMS Supplier group level Global
4.7 Invoicing & Cost Control Invoicing & Cost Control (I&CC) is a department within the business function of Finance and Business
control, a new organization since 2010. Business Control is a global support function responsible for
the financial issues of VLC including IS/IT support of the financial systems (AB Volvo, 2012). I&CC
holds responsibility for the verification and administration of both the incoming service invoices and
for the invoicing of VLC’s services to its customer. The mission of the department is to handle
incoming and outgoing invoices in a correct, lean and timely way that contribute to the customer
satisfaction and the shareholders’ value, profit and cash flow. The aim is one hundred percent
correct supplier and customer invoices and to utilize the payment terms of incoming and outgoing
invoices in order to secure a positive cash flow (AB Volvo, 2011).
Within the I&CC department there are different units for each business area; I&CC Inbound, I&CC
Outbound and I&CC Emballage. The different units handle the incoming and outgoing invoices
related to their specific business area and each have specific goals and requirements regarding
system support.
Supplier performance dashboard at Volvo Logistics
55
4.7.1 Measurements
The invoices are entered into the invoicing system used within I&CC, Contracting & Invoice Control
(CIC), either by EDI (Electronic Data Integration) or manually by VBS (Volvo Business Services). The
system compares the data for an automatic match. If everything is in order, the invoice is sent on to
SAP for coding, verification and payment, which is done by VBS. The I&CC units do not need to do
anything if this match is complete. However, if for some reason there is no match, a series of actions
is required. An invoice that does not match automatically will be parked and labeled either; not
handled yet, price block quantity block, awaiting credit or incomplete invoice by the person who then
manually handles the invoice. These labels help determine why the invoice was not matched directly
and where to gain the information needed for a manual match. A division is also made between
carrier disputes and internal problems where carrier disputes refer to issues with the quality of the
supplier’s invoice. Price block means issues with the cost of the transportation and if the problem is
internal, the responsibility lies with the purchasing department. Quantity block, on the other hand,
means issues with the transportation data and if internal, the responsibility lies within the traffic
department.
Overdue amounts are another measure used within the I&CC organization. This is invoices that for
some reason have not been paid on time, and the metric is followed up extensively. The overall goal
is to have zero overdue invoices but VLC will not pay an invoice just in order to reach this goal. There
are invoices where VLC are in a dispute with the supplier since VLC believes that the invoice is
incorrect, and then the invoice will not be paid until the issue is resolved. There are different codes
for why the invoice is overdue for follow-up. This is carried out, not only within the business areas
but also on a supplier group level. This information is relevant in a situation where the supplier
contacts VLC and asks why the invoice is overdue. The KPIs that are presented above and related
information are included in table 16.
Spend per supplier is possible to measure through the invoiced amounts per supplier for a specific
time period, such as on a monthly basis. This data is stored at the data warehouse and possible to
extract through reports. However, currently this is only possible to extract for the European
operations but once the IT project of LES is implemented this will be possible to do on a global scale.
When a new contract is to be negotiated within the purchasing department, I&CC should be involved
in the tendering process in order to evaluate the potential invoicing quality in beforehand, and the
possibility of automatic matching in CIC. Today, there are problems with how the transportation
flows and hence the invoices are set up in order to generate automatic invoicing match. By involving
the I&CC department early on in the procurement process, the hit rate in CIC may be improved by
designing the new transportation flows in a certain way. However, this is always an assessment and a
trade-off that needs to be made between operations and I&CC-fit. If the proposal from a carrier is
better from an I&CC perspective but another supplier is better and with a lower cost on the
operational side the I&CC department can approve on a lower invoicing quality. This is a factor that is
important when deciding on the performance levels on each individual supplier.
Inbound, Outbound and Emballage set their KPIs and goals to reach as well as develops how the
internal feedback will be designed. A common report is sent out on a monthly basis from the process
development I&CC unit; covering the performance of all units. This report covers aspects of number
Supplier performance dashboard at Volvo Logistics
56
of invoices and invoice lines per GBO, parked invoices and overdue amounts, both on a general level
and divided on each GBO.
Within each I&CC unit the employees are divided into geographical groups such as Europe, domestic
and overseas, and all employees have their specific suppliers that they are responsible for. When a
problem arises that cannot be solved internally the first contact with the supplier is always done by
this person, trying to solve the problem before escalading it to another level, for instance the
purchasing department.
4.7.2 Systems and identification
Each GBO; Inbound, Outbound and Emballage, has their own transportation system for handling all
data related to the carried out transportations. All data regarding the transport that is relevant for
matching the incoming invoices to VLC is sent to I&CC’s system CIC, this information is called Sjob
and is structured in a certain way according to specific rules. All performed transportations get a
unique reference which also is used by the carriers when creating the invoice. Figure 24 visualizes the
information flow and system support for handling invoices within I&CC.
From the Global purchasing department the information agreed upon between VLC and the supplier
in the transportation contracts as well as prices are entered into CIC, and this information together
with the Sjob creates VLC’s reference when controlling the incoming invoices.
The supplier creates an invoice with a corresponding reference to the one created by the traffic
department at VLC, and the invoice is send to VLC either by Electronic Data Interchange (EDI) where
the invoice goes directly into CIC at each I&CC unit. The information in CIC does not provide a picture
of the original invoice, which instead can be seen in OnDemand. If the invoice is sent by paper it is
registered and transcribed into CIC by VBS. However, there are invoices that cannot be sent this way,
for instance invoices regarding additional costs. There is also a monetary aspect of wanting a high
rate of EDI invoices since I&CC have to pay VBS 18 SEK per invoice line in order for them to transcribe
the data into CIC.
The PARMA-ID is closely linked to the invoicing process and hence all measurements and follow-up is
done with the PARMA-ID as common identification. There is a problem within the I&CC organization
that the PARMA-ID sending the invoices is not always the correct PARMA-ID according to contracts,
Figure 24; Visualization of the information flow and system support for handling invoices. Source: (Volvo Logistics Corporation, 2010)
Supplier performance dashboard at Volvo Logistics
57
although correct supplier has carried out the transportation since there are numerous PARMA-ID
connected to each supplier on a supplier group level. Within the I&CC organization this is handled
through sub-coupling the different accounts. This is not a major problem for the I&CC organization,
today there is no possibility to measure the suppliers invoicing performance on contract-level, but if
this would be asked for in the future the sub-coupling would need to be reorganized in order to
secure that the correct PARMA-ID’s are connected to the correct contracts number. When CIC will be
replaced by a SAP solution from the LES project, the issue with sub-coupling will have to be handled.
Table 16 summarizes the I&CC related supplier measurements.
Table 16; Summary of I&CC KPIs
Possible KPI:s System
(present) System (future)
Identification Global/Regional
Number of parked invoices due to supplier errors, divided by total number of invoices (Invoice quality)
CIC/SAP LES PARMA-ID Regional, Europe
Number of automatically matched CIC lines/total number of CIC lines
CIC/SAP LES PARMA-ID Regional, Europe
Number of overdue invoices/total number of invoices
CIC/SAP LES PARMA-ID Regional, Europe
Number of parked invoices/total number of invoices, defined according to labels
CIC/SAP LES PARMA-ID Regional, Europe
Supplier performance dashboard at Volvo Logistics
58
4.8 Summary of the empirical findings Today, no standardized way for evaluating suppliers exists within the purchasing
department. Different levels of follow-up exist in and between the different business areas
as well as between purchasing and other departments.
The Supplier performance dashboard at VLC should fulfill the following requirements:
The dashboard shall provide an overall view of each core supplier on group level i.e.
one screen image of the performance levels within the central KPIs that represent
the most important requirements VLC puts on its core suppliers.
It should be possible to view the supplier’s performance within a specific business
area; Inbound, Outbound and Emballage.
It should be possible to track trend over time to identify improved or worsened
performance.
It should be possible to drill down or aggregate up the data to supplier group level,
PARMA-ID, contract and flow level in order to view the supplier’s level of
performance within different regions and specific flows.
VLC has 154 core suppliers that account for 90 percent of total spend. Interviews with five of
the largest suppliers showed that the suppliers were positive to a supplier performance
dashboard and desired to take part of the information in the dashboard.
The purchasing department has designed generic contracts for the different commodities.
Attached to the contracts are the SOPs that describe the required levels of performance from
the suppliers. The SOPs are created by the GBOs.
Seven different departments of VLC measure supplier performance. These departments are
illustrated in figure 25 in the shape of the diamond model that has been derived from the
theory chapter. The results show a decentralized structure for supplier performance
measurements within VLC with several points of interaction between VLC and the supplying
firm.
Table 17 summarizes the different measurements that are carried out by the different
departments within VLC. The table is divided into three parts depending in the characteristics
of the measurements; financial, operational and core value related measurements and KPIs.
The operational measurements are further divided into Inbound, Outbound and Emballage
Figure 25; Illustration of the decentralized supplier measurement structure at VLC where several departments are responsible for different measurements.
Supplier performance dashboard at Volvo Logistics
59
related measurements. For a more detailed summary of the present and future systems,
identification, and regional or global data collection, see appendix 5.
Table 17; Summary of all possible KPIs to include in a dashboard, divided with regards to financial, operational or core-value orientation.
Possible Financial KPIs Possible Operational KPIs Possible Core-Value KPIs
Financial Ranking IB -Delivery precision ISO 9001
Spend IB-Pick-up precision ISO 14001 / SmartWay
Number of registered CIC lines IB-Lead-time Motor class, average
Number of automatically matched CIC lines / total number of CIC lines
IB-Deviation Reporting CO2-emission, g/ton-km
Number of overdue invoices / total number of invoices
IB/EMB-Unloading precision Clean Shipping Index
Number of parked invoices / total number of invoices, according to labels
IB/OB-Transport Quality Contingency plan
OB-Arrival reporting Transport Quality Audit
OB-Departure reporting
OB-Lead-time
OB-Delivery target fulfillment
EMB – Delivery Precision
There is no standardized systems environment within VLC. Each business area and
department have developed and implemented its own system.
The system that is connected to supplier identification within VLC; PARMA, contains some
inconsistency. A supplier that has a specific PARMA-ID in one system may have a totally
different PARMA-ID in another system. This can create unreliable measurements since one
supplier may incorrectly, be connected to the wrong PARMA-ID. One of the reasons behind
the inconsistency is that all systems are not updated when a supplier gets a new PARMA-ID.
Furthermore, PARMA has no limit for creation of new ids for a supplier which means that one
supplier may have several ids in PARMA.
Supplier performance dashboard at Volvo Logistics
60
5 Analysis The theoretical and empirical findings will form the basis for the analysis chapter. The main focus in
the analysis is to make an evaluation of all the KPIs that were identified in the empirical chapter. The
evaluation and analysis is structured around four areas that have been identified to affect the
content of the dashboard as illustrated in figure 26. The areas are; Purchasing objectives and VLC
requirements, Technical restrictions, Characteristics of KPIs and Organizational representation. Step
by step, the number of KPIs will be reduced and the analysis chapter will end up in a number of KPIs
that should be included in the dashboard. The analysis will also include suggestions for KPI
visualization in the dashboard and a recommended implementation process. These aspects are
presented in chapter 5.7.1 and 5.8 respectively.
The four areas in figure 26 will be covered in the following way:
Purchasing objectives and VLC requirements – This aspect is discussed in chapter 5.1. Focus is on
how dashboards can be a tool to help fulfill purchasing objectives in general and the requirements
and needs of VLC purchasing in particular.
Technical restrictions – Technical restrictions will affect what information is possible to include in the
dashboard. In chapter 5.2, the KPIs are evaluated from different perspectives but much focus is on
accessibility of data. The chapter also includes an assessment of the possibilities for automatic
transferring of data that would limit the needs for manual data input.
Characteristics of KPIs – The characteristics of KPIs can be evaluated from many different
perspectives. In the end of chapter 5.2, the KPIs are ranked according to a number of different
criteria that were identified in chapter 3.3. Chapter 5.3 includes an assessment of the KPIs based on
the framework that was developed in chapter 3.3 and its subchapters. The purpose of this
assessment is to investigate the level of balance between the chosen set of KPIs and measurements.
Figure 26; Illustration of the analysis process. The figure includes the four areas of evaluation; Purchasing objectives and VLC requirements, Technical restrictions, Characteristics of KPIs and Organizational representation
Supplier performance dashboard at Volvo Logistics
61
Organizational representation – The fourth area of consideration, organizational representation, will
be covered in chapter 5.4 and 5.5. In these sections, the KPIs will be evaluated based on which
department of VLC they represent and which traffic modes they are relevant for. This is to ensure
that the dashboard will be as comprehensive as possible; that it covers all modes when applicable
and that the relevance and usability is maximized in order for the dashboard to apply to all potential
stakeholders.
5.1 Dashboard for purchasing In the literature review, it was found that the purchasing department has several objectives. Some of
these objectives do specifically relate to the relationship to the suppliers and are more relevant for
the purpose of this thesis. In the following list, those purchasing objectives have been identified:
To maintain effective relationships with existing suppliers and develop alternative sources of
supply in order to ensure continuous supply.
To buy efficiently and wisely. With ethical means, obtain the best value for the money spent.
To select the best suppliers in the market.
To maintain a correct balance between quality and value.
To perform supply management in an environmentally responsible way.
To fulfill these objectives, the purchasing department needs access to relevant supplier information
in an efficient way in order to support decision making. Continuous evaluation of the suppliers is
important in this aspect; to collect information about the suppliers’ operations and their
performance. Supplier assessment is many times even more relevant in logistics service
procurement, since the performance of the logistics provider will have a direct impact on the service
provided to the end customers. Primarily, this concerns operational performance, however, it is still
important to monitor the supplier’s performance within other areas as well.
Many companies struggle with a vast amount of information, generated by various disparate
reporting systems. The relevant data is not readily accessible when the decision maker is in direct
need of the specific information. It is in this context the supplier performance dashboard is relevant.
Eckerson (2011) uses the term performance dashboard which he defines as: “a layered information
delivery system that parcels out information, insights, and alerts to users on demand so they can
measure, monitor, and manage business performance more effectively”. Deployment of dashboards
is an attempt to create a simplified picture of a complex reality. The dashboard is a tool that brings
together the most relevant data that is needed for efficient decision making. Reducing the need to
create and maintain large numbers of static reports was identified by Rasmussen et al. (2009) as one
of the benefits of dashboards. The authors also mention ability to identify and correct negative
trends and to improve measurement analysis as positive outcomes of dashboard deployment.
Relating back to the list of objectives for purchasing that was presented above, a dashboard may
address these areas of responsibility in different ways. The first point, to maintain effective
relationships with the suppliers, can be supported by information in a dashboard. A comprehensive
overview of the most relevant KPIs helps identify problem areas that need improvement; it can also
mean to communicate these areas of improvement to the suppliers in order to collaborate on a
solution for better performance. For assessment of new suppliers, the dashboard will not include
operational data which means that a dashboard is more appropriate for existing suppliers.
Concerning the second and fifth point, the dashboard can provide relevant information about the
Supplier performance dashboard at Volvo Logistics
62
suppliers that covers environmental and ethical aspects. The dashboard can display whether the
supplier has ISO certificates, it can provide an indication about rate of emissions and information
about the attitude towards CSR related issues in general.
The dashboard can also help identify the best suppliers in the market which is the third objective of
purchasing. By comparing the performance levels of different suppliers it is possible to identify the
supplier with the best performance rates. Again, it will be difficult to include and compare new and
unproven suppliers for an overall assessment but still, a comparison between existing suppliers is
fully possible. The fourth objective is to maintain a balance between quality and value and the
dashboard can also be an assisting tool in this context. The general performance level of the
suppliers and particularly, the operational performance levels, indicate what quality the supplier
provides; the better the performance, the higher the quality. However, it can be difficult to assess
what value this implies, the turnover per supplier indicates the money spent but a relative figure
representing value versus performance can be more difficult to display.
5.1.1 Areas of dashboard application at VLC purchasing
VLC is not the only company that desires to enhance decision making through dashboard support. In
its study among 285 firms, the Aberdeen Group (2009) found that the primary motives to why
companies drive dashboard initiatives is to gain visibility into key business processes and to replace
decisions based on gut feeling with decisions based on facts.
Today, VLC measures its suppliers within several areas; different departments within the company
carry out various forms of supplier measurements. For instance, requirements connected to the core
values are covered by the supplier survey and the RFIs, operational performance are measured by
the GBOs and I&CC keeps track of the supplier invoicing quality. The problem is that only a part of
this information reaches purchasing; the function cannot today get a holistic view of the supplier
performance that represents all areas of supplier performance requirements. Supplier evaluations
and sourcing decisions are too often based on vague perceptions of individuals and there is a lack of
supporting facts.
This was also the main intension behind the initiation of the dashboard project within purchasing at
VLC; the function needs a tool that provides the most relevant data about the suppliers for more
efficient decision making. Since it is desired to use the dashboard in several different contexts, it
requires the dashboard to be generic and not too specific for a certain situation. VLC has mentioned
the Supplier Management Forum to be the main area of dashboard application. In this forum,
representatives from different departments within VLC will participate and the intension is that the
members of the forum will meet on a monthly basis. Supplier assessment on this, more overall level
puts certain requirements on the content of the dashboard; these specific requirements are listed
below:
The dashboard shall provide an overall view of each core supplier on group level i.e. one
screen image of the performance levels within the central KPIs that represent the most
important requirements VLC puts on its core suppliers.
The dashboard shall represent the interest of all the stakeholders of the forum
The KPIs shall be relevant for all traffic modes
The suppliers are presented on supplier group level
The KPIs represent all the operations globally
Supplier performance dashboard at Volvo Logistics
63
It should be possible to view the supplier’s performance within a specific business area;
Inbound, Outbound or Emballage.
It should be possible to track trend over time to identify improved or worsened performance.
Possible to link the overall performance to a more detailed report in order to identify root
causes
In the succeeding chapters of the analysis, the KPIs from the empirical chapter will be evaluated in
detail, where there will be specific consideration on the requirements that are listed above.
Evaluation of the KPIs will help adjust the content of the dashboard to meet these requirements. In
the end of the analysis, there will be a discussion about the KPIs that are finally chosen to be included
in the dashboard where the main focus will be on how well the requirements are fulfilled by the
dashboard.
During the study, three additional areas of potential dashboard application within purchasing at VLC
have been identified:
Strategy Development
Purchasing Managers
Purchasers
Actors within these three areas have different agendas; the focus of their work differs and when it
regards issues related to supplier assessment, the actors have different areas of importance and
prioritization. That means that the requirements on the content and functionalities of a supplier
performance dashboard may differ between these three groups of people. However, regardless of
what issues are important and should be prioritized within each area, the main purpose of the
dashboard is that it shall provide the viewer with a comprehensive view of the suppliers’ most
important performance indicators. The more possibilities for data drill down and aggregation, the
more useful the dashboard will be as an analysis tool. Therefore, it is possible to identify a list of
general requirements that apply for all of the areas that were listed above:
The dashboard shall provide an overall view of each core supplier on group level i.e. one
screen image of the performance levels within the central KPIs that represent the most
important requirements VLC puts on its core suppliers.
It should be possible to view the supplier’s performance within a specific business area;
Inbound, Outbound and Emballage.
It should be possible to track trend over time to identify improved or worsened performance.
It should be possible to drill down the data to PARMA, contract and lane level in order to
view the supplier’s level of performance within different regions and specific lanes. For
illustration of the different levels of aggregation, see figure 27. Important to note is that this
requirement only applies for the operational and the financial KPIs except for the financial
ranking KPI. The reason is that it is not convenient to measure the remaining KPIs other than
on supplier group level.
Supplier performance dashboard at Volvo Logistics
64
5.2 Assessment of potential KPIs In the empirical chapter, the most important measurements and KPIs within each department were
identified. A list that summarizes these KPIs is found in Appendix 5. In the following chapter, each KPI
is presented again, along with an evaluation and short motivation why it should or should not be
included in the dashboard. The assessment has been made with specific consideration on the
requirements of a performance dashboard that were identified in chapter 3.4.3. The most relevant in
this case are:
Monitor KPIs. The dashboard shall illustrate the critical KPIs that are needed for effective
decision making within the domain the dashboard serves.
Accurate. The information that is included in the dashboard must be completely accurate in
order to reach full user confidence in the dashboard. The data must be well tested and
validated before included in the dashboard.
Timely. The information must be real-time and right-time; it must be updated to the latest
version possible in order to achieve effective decision making.
The first point is, to some extent, considered in this chapter. Mainly when motivating the relevance
of the KPIs to VLC purchasing. However, this aspect is integrated and evaluated in more detail
throughout the succeeding sections of the analysis chapter. Instead, in this chapter, most emphasis
has been put on the second point; to conclude what is actually measured within VLC today and
assess the accuracy of these measurements. The third point is also relevant but due to the fact that
the requirement on the dashboard at VLC is not to be updated more frequently than monthly, there
has been more of an assessment on the updating frequency than on whether the data is timely or
not.
This section is structured around the different KPIs and other measurements that were identified in
the empirical chapter. The chapter consists of two parts; first, there is a general assessment of each
KPI or metric and in the second part, a ranking of the different measurements according to the
criteria presented in theory chapter 3.3 is included. In section one, each measurement or KPI is
evaluated based on the following structure:
Structure:
1. Purpose and importance of the KPI
2. Method and responsible department for measurement within VLC
3. Motivation to why the KPI should be included in the dashboard or not. Description of
possible frequency of update
Figure 27; Illustration of the four levels of information identification
Supplier performance dashboard at Volvo Logistics
65
In connection to each metric evaluation, a figure is presented that summarizes the findings. For
consistency reasons, all the measurements are denoted KPIs in the figures even if some of them in
more correct terms should be denoted metrics or measurements.
Financial Ranking – The financial ranking is an important metric as it can give an indication of the
financial risk of the supplier. It is especially relevant to assess the financial risk of the most critical
suppliers that either accounts for a large share of the turnover or suppliers that are single providers
of a product or a service where the options for alternative suppliers are limited. Financial stability is
essential in order for the supplier to be able to continue to operate the market and provide VLC with
the services needed.
Currently, financial ranking for the suppliers is provided by a financial institute and the information is
manually entered into an excel sheet. A future prospect is that this data is directly fed into the
dashboard system instead of an excel file which would mean that the data is readily accessible in the
system. The data is only registered on supplier group level, however, in most cases; the financial risk
figure will also apply for subsidiaries and entities within the corporation since the financial risk is
most often covered by the parent company.
To conclude, this measurement is possible to extract and should be included in the dashboard. It is
most realistic to update the numbers yearly even if European figures may be updated more
frequently. The more frequent updates the better basis for accurate decision making of course.
However, it should not come at the expense of any additional manual work; more frequent updates
must come automatically. Figure 28 summarizes the previous findings regarding the financial ranking
measurement.
Spend – The turnover per supplier is important information as it provides an indication of the
importance of the supplier; the larger spend, the more important the supplier is. However, it should
be remembered, that also a relatively small supplier can be as important if it is critical to VLC’s
operations. There are regions where a supplier is the only alternative and in that case, the spend
data is not a sufficient indication of the relative importance. Nor will the spend be an accurate
indication for the small suppliers that are strategically important as they operate critical lanes of
traffic or where there are specifically developed set ups of transportation.
PS&S is responsible for the compilation of a spend report. This is done manually in an excel sheet.
Due to system disparity, it is not possible to collect global spend data in a convenient way more
frequent than semi-annually. However, if limiting the focus of the dashboard to only European
suppliers, the spend data could be updated monthly by extracting data from the I&CC department
Figure 28; Summary of the current status of the financial ranking measurement; why it is important and where it is currently stored. Also a judgment on whether it should be included in the dashboard or not is provided.
Supplier performance dashboard at Volvo Logistics
66
and the data warehouse. Suppliers are assessed on PARMA-level and it is possible to aggregate the
information up to supplier group level.
Despite the fact that the turnover is not exclusively an indication of the supplier’s importance it is
useful and should be included in the dashboard. Considering the current system conditions at VLC, it
is only convenient to update the turnover per supplier on a semi-annual basis in connection to the
creation of the global spend report. What is possible and most convenient today is to extract the
spend data for the core suppliers from the global spend excel sheet, but direct entry into a
dashboard system will simplify the process. Figure 29 summarizes the previous findings regarding the
spend metric.
Number of parked invoices due to supplier errors divided by total number of invoices (Invoice
quality) – Invoice quality is an important KPI as low invoice quality implies hidden extra costs that
come from additional administrative work and manual rework. Automatically approved invoices are
desired but as soon as an invoice does not match in the system, administrative work is required to
track the source of error and make corrective actions, which may be costly in the long term.
The number of parked invoices due to supplier errors is measured by the I&CC department and the
figures are currently stored in the department’s system CIC. When extracting the numbers, it only
provides a snapshot of the instant situation i.e. the current number of parked invoices due to
supplier errors at the specific moment. The present system is only covering the European operations
but the future implementation of the ongoing LES project will enable global measurements.
When assessing the invoice quality, the I&CC department measures primarily four KPIs. However,
what is considered relevant when it comes to assessing supplier performance is number of parked
invoices divided by the total number of invoices. In this case obviously, it is only the number of
parked invoices that are caused by the suppliers that are relevant as it determines the supplier
performance. This KPI should be included in the dashboard as low performance may imply
considerable costs and the KPI can reveal underperforming suppliers that require corrective actions.
Due to the current system restrictions, that only include measurements of European operations, it is
recommended to await the implementation of the LES project until the invoice quality KPI is included
into the dashboard. For the purpose of the dashboard, monthly updates are most appropriate. The
invoice quality KPI will be readily accessible which means that it can be automatically updated
according to a monthly frequency. Figure 30 summarizes the previous findings regarding the invoice
quality KPI.
Figure 29; Summary of the current status of the spend metric; why it is important and where it is currently stored. Also a judgment on whether it should be included in the dashboard or not is provided.
Supplier performance dashboard at Volvo Logistics
67
IB Delivery Precision – VLC is highly dependent on the operational performance of the suppliers.
Poor operational supplier performance will have an immediately negative impact also on the
operations of VLC’s customers. Delivery precision has been identified in several studies as one of the
most important transportation KPIs (Birkland, 2002; Menon, et al., 1998; Gunasekaran, et al., 2004).
VLC and its suppliers have agreed on required performance levels that are included in the contracts.
It means that VLC can put specific demands and take action against the suppliers who do not fulfill
these requirements. Delivery precision is especially important in Inbound transports where JIT
delivery is a prerequisite for an efficient flow and avoidance of disruptions in production.
Delivery precision is measured by the GBO Inbound but today, the information is stored in different
systems depending on the geographical location of the operations. This creates difficulties to
automatically extract figures that have a global representation. Within the different systems, there
are also different definitions of the metrics of Inbound and it is not certain that all systems measure
the same metrics as it depends on what the customer demands. For the European operations,
operational data can be found in TIR and FADS, while the operations in the US are using ATLAS. When
ATLAS has been rolled-out globally it will be possible to achieve more consistency in the
measurements and it is expected that data can be extracted automatically from the system and be
transferred into the dashboard.
Since the suppliers’ operational performance is such important to the operations of VLC and as it has
direct impact on the customer service provided to VLC’s customers, it is recommended to include
delivery precision in the dashboard. However, due to the current system disparity and inconsistency
in metric definitions, it is not convenient to set up solutions for transferring of data from all the
different systems today. Instead, it is recommended to wait with implementation of this metric until
ATLAS has been rolled-out globally. In order to enable comparability of data, delivery precision
should be included in the dashboard in terms of target fulfillment. The updating frequency should,
preferably be on a monthly basis. Figure 31 summarizes the previous findings regarding the IB
delivery precision KPI.
Figure 30; Summary of the current status of the invoice quality KPI; why it is important and where it is currently stored. Also a judgment on whether it should be included in the dashboard or not is provided.
Figure 31; Summary of the current status of the IB delivery precision KPI; why it is important and where it is currently stored. Also a judgment on whether it should be included in the dashboard or not is provided.
Supplier performance dashboard at Volvo Logistics
68
IB Pick-up precision – Pick-up precision is an important operational measurement, especially for the
purpose of predictability and planning at the pickup position. Besides that, a similar reasoning applies
for pick-up precision as for delivery precision, whereby the reader is referred to the section IB Delivey
Precison for more details regarding purpose and importance of the KPI.
See IB Delivery Precision for information about how the KPI is measured.
Pick-up precision is a relevant measurement that should be included in the dashboard. However, due
to system restrictions it is not feasible to include the KPI in the first implementation stage. See IB
Delivery precision for more details about motivation and updating frequency. Figure 32 summarizes
the previous findings regarding the IB pick-up precision KPI.
IB Lead time – In the theory chapter, it was shown that lead time, or transit time was one of the
most important transportation KPIs. Accurate transit time is also something the GBOs Inbound and
Outbound emphasize as being important for their operations. Transit time deviations make it difficult
to plan logistics activities and coordinate material flow, especially within the Inbound operations.
There is a connection between, transit time, pick-up- and delivery precision; if the carrier performs
well on two of the KPIs, it is evident that the third KPI is accurate as well. However, to get better
measurements it can be reasonable to measure all three KPIs.
Lead time is measured within the GBO Inbound but the information is stored in different systems
depending on the geographical location of the operations. See IB Delivery Precision for more
information about systems and measurements.
Lead time is an important operational KPI that should be included in the dashboard. However, due to
system disparity, it is not recommended to include lead time under the current conditions, but to
wait until ATLAS has been rolled-out. See IB Delivery Precision for more details about motivation and
updating frequency. Figure 33 summarizes the previous findings regarding the IB lead time KPI.
IB Deviation reporting – For the Inbound operations, it is highly important that the deviation
reporting is of high quality in order for the GBO to be able to take corrective actions against any
Figure 32; Summary of the current status of the IB pick-up precision KPI; why it is important and where it is currently stored. Also a judgment on whether it should be included in the dashboard or not is provided.
Figure 33; Summary of the current status of the IB lead time KPI; why it is important and where it is currently stored. Also a judgment on whether it should be included in the dashboard or not is provided.
Supplier performance dashboard at Volvo Logistics
69
transportation delay or disruption. It is important that the administration and collaboration with the
supplier works efficiently as it will have an impact on the level of performance in the physical
operations.
Inbound is the only GBO that monitors deviation reporting and the department require one hundred
percent reporting from the suppliers. Due to system restrictions, it is not possible to automatically
extract data of this KPI with a global coverage. See IB Delivery Precision for more details on this issue.
As mentioned, the deviation reporting KPI is of outmost importance for efficient operations at the
Inbound GBO. However, since there is currently no common system for measurement for this KPI, it
is not recommended to include it in the dashboard until ATLAS has been implemented. Figure 34
summarizes the previous findings regarding the IB deviation reporting KPI.
IB EMB Unloading precision – Unloading precision is a KPI that is similar to pick-up precision; it
represents how accurately the packaging material is picked up in time. This KPI is important for the
emballage transportation operations and especially for the planning activities in the terminals were
the material is picked up. Material that is not being picked up in time occupies terminal space and
there is also a risk that emballage material will not be available in time when needed.
This KPI is measured within the GBO Emballage and as previously mentioned, it refers to the
transportation of emballage and not to the suppliers of new packaging material. The measurement is
registered in the Emballage system V-EMS on a supplier ID called Emballage IP. The pickup
registrations are carried out in the terminals where the employees enter different error codes into
the system depending on type of error.
Since the unloading precision KPI is only measured in Europe and the information is stored in a
system, V-EMS where data cannot be easily transferred into other systems, it is not recommended to
include this KPI in the dashboard with the current conditions. Also the robustness of the KPI; that it
really represents the performance of the supplier and not errors made by any other party, can
sometimes be hard to ensure. The measurement depends on what code of error is registered into
the system and the carrier does not always agree upon who is responsible for material not being
picked up. Nevertheless, with better system support, possibly from the LES project, the unloading
precision KPI may be relevant to include in the future. However, with consideration to the current
conditions, it is not recommended to include this KPI. Figure 35 summarizes the previous findings
regarding the IB EMB unloading precision KPI.
Figure 34; Summary of the current status of the IB lead time KPI; why it is important and where it is currently stored. Also a judgment on whether it should be included in the dashboard or not is provided.
Supplier performance dashboard at Volvo Logistics
70
EMB Delivery Precision – Currently, it is not possible to measure delivery precision for suppliers of
new packaging material. However, it is something that is desired by the GBO Emballage and it is
important for capacity planning and supplier performance measurement.
Due to system restrictions, the performance of packaging suppliers cannot be measured today.
However, in the ongoing LES project, the intension is to include functionalities for supplier delivery
performance measurement on supplier group or PARMA level. However, the possibilities created by
the new system were not yet fully established while this thesis was carried out. Nevertheless, it is
something that is relevant for further investigation for potential future dashboard inclusion.
Due to system restrictions, the EMB delivery precision is not possible to include in the first stages of
the dashboard implementation. However, it is something that deserves further investigation for
potential future dashboard inclusion as earlier mentioned. Figure 36 summarizes the previous
findings regarding the EMB delivery precision KPI.
Transport quality – Transport quality is a measurement of the rate of damage free deliveries and it is
an important KPI for several reasons. First of all, damaged goods cause disruptions in the material
flow which may induce considerable costs due to loss in production. Repeated quality issues will
lower the delivery reliability which in turn, will demand for higher safety stock that generates
increasing inventory costs. The administrative cost for handling the damage claims will also grow as
the rate of damaged goods increases.
Risk Management is responsible for registration and follow-up on transport quality issues and
damaged goods. The information is stored in the Risk Management system RMS where there are
information both on total number of incidents that the carrier has been involved in as well as the
figure representing the numbers of incidents where the carrier is legally liable. The latter number will
Figure 35; Summary of the current status of the IB EMB Unloading precision KPI; why it is important and where it is currently stored. Also a judgment on whether it should be included in the dashboard or not is provided.
Figure 36; Summary of the current status of the IB EMB Delivery precision KPI; why it is important and where it is currently stored. Also a judgment on whether it should be included in the dashboard or not is provided.
Supplier performance dashboard at Volvo Logistics
71
not be as timely as the total figure due to incident resolution; it can take up to twelve months until
liability or not is decided. The data can be presented on either lane, PARMA or supplier group level.
Transport quality is a very important operational KPI. It is accurately measured by Risk Management
and for these reasons it should be included in the dashboard. The recommendation is to choose the
figure representing the total number of incidents since it is timelier and because it is important to be
aware of the total rate of incidents regardless of the liability of the carrier or not. However, it is
important to be clear, especially towards the supplier about how the numbers have been identified.
The information can be updated monthly and it is therefore recommended. Figure 37 summarizes
the previous findings regarding the transport quality KPI.
OB Delivery precison – see IB Delivery precision for purpose/importance of KPI.
In A4D, the data is registered per lane but the system allows aggregation of data up to PARMA level
as well as supplier group level. The aggregation of performance results from different lanes and
regions is possible since Outbound focuses on precision in terms of target fulfillment. By measuring
to what degree a supplier fulfills an agreed level of performance, a measurement that determines
the target fulfillment is achieved. The information in A4D is frequently updated whereby it is
possible to keep a monthly update of the delivery target fulfillment KPI in the dashboard.
Delivery target fulfillment is an important KPI that measures operational performance, it is accessible
in A4D on different levels and it enables comparison of performance both between regions and
between different suppliers and therefore, this KPI should be included in the dashboard. Figure 38
summarizes the previous findings regarding the OB delivery target fulfillment KPI.
OB Lead time – see IB Lead time for purpose/importance of KPI.
Lead time is measured within the GBO Outbound and the information is stored in its system called
A4D. The data is measured on lane level but it is possible to aggregate the information up to PARMA
and supplier group level.
Figure 37; Summary of the current status of the IB lead time KPI; why it is important and where it is currently stored. Also a judgment on whether it should be included in the dashboard or not is provided.
Figure 38; Summary of the current status of the OB delivery target fulfillment KPI; why it is important and where it is currently stored. Also a judgment on whether it should be included in the dashboard or not is provided.
Supplier performance dashboard at Volvo Logistics
72
Since accurate lead times are essential for the Outbound operations and since it gives an indication
of the performance of the suppliers, it is a KPI that should be included in the dashboard. The lead
time KPI should be a measurement of promised lead time versus actual lead time. The availability of
data in A4D allows monthly updates of this information. Figure 39 summarizes the previous findings
regarding the OB lead time KPI.
OB Arrival reporting and IB POD – Arrival reporting is an important requirement for the Outbound
operations in order for them to be able to track the goods and also, to determine whether goods are
delivered on time. Proof of Delivery (POD) is the equivalent within Inbound and it has similar
importance within their operations as for Outbound. It is an importation administrative KPI that very
well represents the quality of communication from the suppliers.
The point of arrival is reported by the carrier into A4D for Outbound and the system registers the
level of performance regarding arrival reporting. Within Inbound there is not yet a global system in
place that supports efficient measurements of POD but it is under development. Data is registered on
all four levels; supplier group, PARMA, contract and lane level.
Arrival and departure reporting are very important administrative KPIs that are essential in order to
keep operational efficiency within the GBOs. Compared to precision KPIs, the reporting
measurements says nothing about the actual operational performance but still, it measures the
supplier’s ability to communicate which deserves specific consideration. Arrival and departure
reporting is also a prerequisite for efficient precision measurements. Therefore, it is recommended
to include the reporting measurements in the dashboard. Arrival reporting within Outbound allows
monthly updates in a dashboard. Reporting quality will be the common denotation for the
measurements arrival reporting/POD, departure reporting/POC (Proof of Collection) and the Inbound
specific deviation reporting. Figure 40 and 41 summarize the previous findings regarding the OB
arrival reporting and the IB POD KPIs respectively.
Figure 39; Summary of the current status of the OB lead time KPI; why it is important and where it is currently stored. Also a judgment on whether it should be included in the dashboard or not is provided.
Supplier performance dashboard at Volvo Logistics
73
OB Departure reporting and IB POC – see OB Arrival reporting/IB POD.
ISO 9001 – Quality is one of the core values of the Volvo Group and VLC and an integral part of the
company’s operations. As the suppliers of VLC many times act as representatives of VLC towards the
customers, the quality of the suppliers’ operations is very important. Certification according to ISO
9001 means that the company has a quality focus in all of its processes. By certifying that the supplier
works with quality, it means that less quality inspection is needed from the buying firm. Bad quality
may imply considerable costs as a result of both, bad customer service, disruptions in supply and
insufficient material quality in the products.
Information about the supplier’s ISO certification is collected through the annual supplier survey and
the data is stored in an excel sheet. Therefore, it is easily accessible for a supplier performance
dashboard. A solution for the future is that the information about ISO certification is entered directly
into the dashboard system instead of into an excel sheet.
Due to the considerable importance of high quality for the operations, products and services of VLC
and because certification according to ISO 9001 is a fundamental requirement that VLC puts on its
core suppliers, it should be included in the dashboard. The static characteristics of this measurement
should not require more than annual updates about this information in the dashboard but of course,
if a certificate expires, it needs to be updated. Figure 42 summarizes the previous findings regarding
the ISO 9001 measurement.
Figure 41; Summary of the current status of the OB arrival reporting KPI; why it is important and where it is currently stored. Also a judgment on whether it should be included in the dashboard or not is provided.
Figure 42; Summary of the current status of the ISO 9001 measurement; why it is important and where it is currently stored. Also a judgment on whether it should be included in the dashboard or not is provided.
Figure 40; Summary of the current status of the IB POD KPI; why it is important and where it is currently stored. Also a judgment on whether it should be included in the dashboard or not is provided.
Supplier performance dashboard at Volvo Logistics
74
ISO 14001/SmartWay – Environmental care is a subject that has attained increasing attention in
recent years and it is also one of the core values of the Volvo Group. Certification according to ISO
14001 assures that the company has an environmental management system and works actively with
questions that concern environmental care within its processes. Active environmental work may
have several benefits for the single company and the entire supply chain; more efficient resource
utilization, reduced amount of fossil fuels, goodwill in terms of credibility regarding environmental
care etc. ISO 14001 has not been acknowledged in the US to the same extent as ISO 9001, and
therefore, SmartWay is the equivalent to ISO 14001 for the North American operations.
Questions about certification according to ISO 14001/SmartWay are included in the annual supplier
survey. The data is compiled and stored in an excel sheet. The information about expiring certificates
is handled manually and reminders are sent by mail to concerned suppliers for them to update their
certificates. The similar procedure applies for ISO 9001 as for ISO 14001/SmartWay.
Environmental awareness is essential for the operations within the Volvo Group and VLC and
therefore, it is important that the environmental performance of the suppliers is satisfying. This
measurement should be included in the dashboard due to its importance to the operations of VLC
and because the information is easily accessible. The information can be updated annually, but
potential future supplier self-reporting may allow updates whenever a certificate expires or is being
renewed. Figure 43 summarizes the previous findings regarding the ISO 14001/SmartWay
measurement.
Average motor class – A large part of the discussion regarding ISO 14001/SmartWay applies to the
motivation for measurement of average motor class. In recent years, more and more focus has been
put on emissions of greenhouse gases and specific demands for reduction of CO2 emissions.
Transport by road is the mode besides air that accounts for the largest share of CO2 emissions
(Kungliga ingenjörsvetenskapsakademien, IVA, 2002). Since VLC does not own its own fleet of trucks,
the company is indirectly responsible for the emissions of the suppliers it chooses. The type of engine
in the trucks affects the rate of emissions and therefore, the average motor class can provide a
approximate indication about the rate of emissions that is caused by a specific supplier, since actual
rate of emission currently is a metric not possible to measure.
In the annual supplier survey, the suppliers are obliged to attach its fleet sheet to the answers it
provides. From the fleet sheet, the Operational Excellence function calculates the supplier’s average
motor class. This information is compiled and stored in an excel sheet.
Figure 43; Summary of the current status of the ISO 14001/SmartWay measurement; why it is important and where it is currently stored. Also a judgment on whether it should be included in the dashboard or not is provided.
Supplier performance dashboard at Volvo Logistics
75
Average motor class gives a good indication of the rate of emissions that are caused by the suppliers
and therefore, it should be included in the dashboard. It may be desired to have more precise
measurements of the CO2 emissions but due to the complexity of such calculations, an estimate
through the motor class is sufficient considering the current conditions. Figure 44 summarizes the
previous findings regarding the average motor class measurement.
CO2 emission, g/ton-km – Purpose/Importance of KPI, see Average Motor class
Operational Excellence has the ability to calculate an approximate figure of emission for different
suppliers based on their fleet sheets. However, these figures are not always accurate as there are
several factors that have an impact on the total rate of emissions.
As previously mentioned, it may be desired to have more precise figures on emissions than just
average motor class. However, due to the inaccuracy in the CO2 emission calculations and the
inability to continuously track actual rate of emissions, figures on this KPI cannot be included in the
dashboard. There are many ways to calculate emissions and most probably, the supplier will not
always agree with the numbers presented by VLC since the parties may use different methods for
calculation. Figure 45 summarizes the previous findings regarding the CO2 emission KPI.
Clean Shipping Index – Considering the increasing focus on environmental issues as described
previously, it is equally important to monitor the emissions from sea transports as for transportation
by road. To measure sea transport emissions, motor class is not applicable; instead, a large part of
the sea transport suppliers report their emissions to the Clean Shipping Index. The Clean Shipping
Index provides environmental information and a grade regarding the shipping company’s vessels. The
index is a representation of emissions of different environmentally hazardous substances, especially
sulphur.
The clean shipping index information is reported by the sea carriers into an external website and
data must therefore, be collected manually by VLC and entered into the dashboard system. Clean
Figure 44; Summary of the current status of the average motor class measurement; why it is important and where it is currently stored. Also a judgment on whether it should be included in the dashboard or not is provided.
Figure 45; Summary of the current status of the CO2 emission KPI; why it is important and where it is currently stored. Also a judgment on whether it should be included in the dashboard or not is provided.
Supplier performance dashboard at Volvo Logistics
76
shipping index concerns the European based sea carriers and not shippers based in other parts of the
world. However, a majority of VLC’s sea suppliers are based in Europe and the reporting covers all
operations globally. The index is a representation of the sea carrier’s emissions on a company group
level.
Since consideration about environmental care within sea transports is becoming increasingly
important, especially regarding sulphur emissions, the clean shipping index should be included in the
dashboard. Since the Clean Shipping initiative is under development, it is only recommended to
update these figures annually. This requires that an employee within VLC collects the information
manually and transfer it into the dashboard. However, it should not demand too much time and
resources. Figure 46 summarizes the previous findings regarding the Clean Shipping Index
measurement.
Contingency plan – To have a contingency plan for unforeseen circumstances and exceptional risks is
very important. Especially for those suppliers that are the only provider of a specific product or
service and where there is no additional alternatives for supply. The purpose with a contingency plan
is to hedge against any disruptions that may be the result of a catastrophe and it is intended to
mitigate the impact of a disaster.
Questions about a contingency plan are included in the RFI and the Supplier Survey. However, there
is no consistent definition on what elements the contingency plan should include; each supplier may
have its own standard and the results only give an indication whether the supplier has a plan or not.
It does not provide any information on the quality of the contingency plan.
Considering the discussion in the previous paragraph, the metric contingency plan is not consistent
enough to include in the dashboard. Nevertheless, as described in the first paragraph, it is an
important parameter and it is recommended to try to enhance the consistency and ensure better
quality of the measurement. A well-developed contingency plan is critical as it can mitigate the
effects of disastrous scenarios that otherwise would cause severe supply disruptions. Figure 47
summarizes the previous findings regarding the Contingency plan measurement.
Figure 46; Summary of the current status of the CO2 emission KPI; why it is important and where it is currently stored. Also a judgment on whether it should be included in the dashboard or not is provided.
Supplier performance dashboard at Volvo Logistics
77
Transport quality audit – In line with the core values safety and quality, VLC puts specific
requirements on its suppliers to operate according to specific handling instructions. The intension
with the transport quality audits is to ensure that the instructions are fulfilled so that the products,
i.e. trucks, buses etc. are delivered under safe conditions. Poor performance in the transport quality
audit may affect both delivery precision performance and damage rates and therefore, it is important
to control and ensure that the handling instructions are fulfilled.
It is the responsibility of Risk Management to carry out transport quality audits. Based on the audit,
the suppliers are ranked according to how well the handling instructions are fulfilled. The audits are
only carried out in Europe and concerns road carriers. The data is measured on supplier group level
and processed in the Risk Management System.
Since the transport quality audit metric is only applicable for road transports within the European
operations and because there is a lack of consistency and all suppliers are not audited, the audit
ranking should not be included in the dashboard. Nevertheless, transport quality audit is a tool to
enhance supplier performance in collaboration with the supplier. Therefore, the dashboard may be
useful in order to identify suppliers that are relevant for transport quality audits. Figure 48
summarizes the previous findings regarding the transport quality audit measurement.
CSR Compliance – CSR related issues has attained more attention in society in recent years and are
often debated in media. Along with the increasing attention, the customers are also putting higher
demands on the suppliers to control the production conditions at each tier back in the supply chain.
However, there is no consistent definition of what CSR is; the concept may represent many different
aspects for instance labor conditions, environmental care etc.
In the RFI and the annual supplier survey, there are several questions that relate to CSR issues. By
answering yes to the questions, agreement with AB Volvo’s code of conduct for instance, the supplier
is approved to meet the requirements of CSR compliance. As earlier mentioned, the survey is
answered on a supplier group level and the results are stored in an excel sheet.
Figure 47; Summary of the current status of the Contingency plan measurement; why it is important and where it is currently stored. Also a judgment on whether it should be included in the dashboard or not is provided.
Figure 48; Summary of the current status of the transport quality audit measurement; why it is important and where it is currently stored. Also a judgment on whether it should be included in the dashboard or not is provided.
Supplier performance dashboard at Volvo Logistics
78
Since there is no consistent definition or industry standard of CSR compliancy, it is not recommended
to include it in the dashboard at an initial stage. Currently, it does not provide sufficient information
about how actively the supplier works with CSR and what the supplier actually accomplish through
that work. A new standard for CSR with third party certification is under development and once this
standard is accepted and used throughout the industry, this measurement should be included in the
dashboard. Figure 49 summarizes the previous findings regarding the CSR compliance measurement.
Overall Risk – Overall risk represents the suppliers’ attitude towards the four areas seatbelts,
alcohol/drug policy, loading security and resting times. These are mainly CSR related issues that may
have an impact on how AB Volvo is perceived by the customers and the society in general. It is
important to be aware of the fact that the operations of the suppliers may affect the reputation of
AB Volvo and therefore, it is relevant to measure how well the suppliers work with these issues.
The annual supplier survey includes questions about the areas covered by the measurement overall
risk. Basically, questions are asked whether the suppliers actively work with these issues or not and
the information is compiled in an excel sheet. Information in the supplier survey is collected on
supplier group level.
Similar to the difficulties with CSR compliance, there is no consistent definition on what is actually
required by the suppliers regarding these issues. It is also difficult to assess whether the suppliers
perform sufficiently and VLC does very much rely in the yes or no answers in the survey. Therefore,
this measurement is only considered to be a potential future measurement and is not robust enough
to be included considering the current situation. Figure 50 summarizes the previous findings
regarding the Overall risk measurement.
Figure 49; Summary of the current status of the CSR compliance measurement; why it is important and where it is currently stored. Also a judgment on whether it should be included in the dashboard or not is provided.
Figure 50; Summary of the current status of the overall risk measurement; why it is important and where it is currently stored. Also a judgment on whether it should be included in the dashboard or not is provided.
Supplier performance dashboard at Volvo Logistics
79
5.2.1 Ranking of KPIs
As a complement to the individual assessments in the previous part, this section will include a
ranking of each KPI according to a number of different criteria. This ranking is based on the subjective
perceptions of the authors and can be assessed differently by another evaluator. Nevertheless, the
purpose of the ranking is to further evaluate the importance and usefulness of the metrics and
motivate inclusion or exclusion in the supplier performance dashboard. The KPIs that were identified
in the empirical chapter have each been given a grade from 1 to 3 in accordance with the rate of
correspondence to different criteria. The numbers represents the following levels of correspondence:
1 = Poor compliance
2 = Good compliance
3 = Very good compliance
The different criteria that have been assessed are based on the criteria for performance indicators
that were identified in chapter 3.3. The criteria Be sensitive to changes within or outside the own
organization have been removed since it is considered to be more applicable for internal
performance evaluation for the company’s own operations, rather than evaluation of external
parties. However, one criterion has also been added: Be aligned with corporate strategy and
objectives as it was found in literature to be very important in the context of supplier assessment.
The different criteria are presented in the list below:
1 = Be representative (global coverage)
2 = Be easy and simple to interpret
3 = Be capable of indicating trends over time
4 = Be easy to collect and process in terms of data
5 = Be easy and quick to update
6 = Be aligned with corporate strategy and objectives
7 = Be sensitive to changes within or outside the own organization
Supplier performance dashboard at Volvo Logistics
80
Table 18; Ranking of the KPIs that were identified in the empirical chapter. The rank range from 1 to 3 and assess six different criteria.
The result of the ranking is illustrated in table 18. The total possible rank for one KPI is 18 points i.e. a
rank 3 within each criterion. As the table shows, the KPI with the highest rank is transport quality; it
gets almost maximum score except for the criterion interpretability. The lower number is explained
by the fact that the KPI will probably be a representation of all incidents the supplier has been
involved in during a certain period, both those the supplier is responsible for but also those where
the supplier has no liability. This means that some ambiguousness may be created when interpreting
the data.
Second best ranks are attained by the KPIs arrival and departure reporting; two KPIs that get the
highest rank for all criteria expect the first and the sixths one. The reasons are that the KPIs are
currently only measured within Outbound and not covering the operations of the remaining GBOs.
Furthermore, arrival and departure reporting is more restricted to the efficiency of the daily
operations at the GBO Outbound and do not provide sufficient information about the suppliers’
actual performance regarding the physical transportations.
Financial ranking is also given a high score. Since the Financial ranking represents a number of
different financial components, the figure may be more difficult to interpret and therefore, the KPI
gets a lower score. Data collection requires some manual work and there is not a perfectly clear
alignment with corporate strategy and the score is therefore two for these criteria. Spend has a
Supplier performance dashboard at Volvo Logistics
81
relatively low total figure. The main reasons are that the information collection requires a lot of
manual work and it is not possible to update the information more frequently than semi-annually
even if the figures change during that period of time.
Certification according to ISO 9001 and ISO 14001/SmartWay are ranked high. These are well aligned
with the core values and the corporate strategy. However, data collection and information updates
are currently requiring some manual work which explains the lower scores for those criteria. Average
motor class gets a medium score; to produce the figure, extensive manual work is required and
therefore, the score is low. The motor class metric is only representing an estimated average and
therefore, the accuracy and interpretability is a bit lower.
A lower rank can be seen for the KPIs CO2 emissions and Contingency plan. The primary reasons to
the low numbers are the lack of consistency within both KPIs. CO2 emissions are calculated based on
motor class from the suppliers’ fleet sheets. However, there are various additional factors that affect
the rate of emissions which means that the accuracy and comparability of data between suppliers
are limited. The figures are also requiring a lot of manual work to be produced and to be updated
whereby low scores are achieved.
5.2.1 Summary of the assessment of potential KPIs
In the first column of table 19, there is a list of twelve KPIs and measurements that have been
considered to be appropriate and most important to include in the supplier performance dashboard.
Based on the previous evaluations, these measurements are labeled qualified as they are considered
relevant and consistent enough to include in the dashboard. Due to system restrictions, a couple of
the qualified measurements cannot be included instantly but should be included when the new
systems LES and ATLAS are in place.
There are also four KPIs that is not included in the list of qualified KPIs but considered to be potential
to include in the dashboard in the future. Therefore, they are included in the second column of table
18 which is labeled future. However, for different reasons that were presented in more detail in
chapter 5.2, it is not recommended to include these four KPIs at an initial stage. In the third column
of the table, KPIs that do not meet the criteria to be included in the dashboard are listed. These KPIs
are measured within the VLC organization today but not considered to be relevant for the
dashboard.
Supplier performance dashboard at Volvo Logistics
82
Table 19; KPIs and measurements categorized as qualified, future or non-applicable for the Supplier performance dashboard
5.3 Characteristics of KPIs Based on the evaluations in chapter 5.1 and 5.2, the number of KPIs has been reduced. In table 19,
there is a list of twelve KPIs that are labeled qualified and have been considered to be appropriate
and most important to include in the supplier performance dashboard. There are also four KPIs that
are labeled future. These measurements is not included in the list of qualified KPIs but considered to
be potential to include in the dashboard in the future. In the third column of the table, KPIs that do
not meet the criteria to be included in the dashboard are listed and these will not be further
evaluated. These are labeled non-applicable in the table.
Van Weele (2010) presented four levels of supplier assessment; product, process, quality assurance
system and company level. When categorizing the qualified KPIs and measurements among these
four levels it is seen that they provide a diverse spread and covers all levels. The operational metrics
of transport quality, lead-time, pick-up and delivery precision are all within the product level,
providing information on how effective the suppliers provide their product; the transportation.
Invoice quality, reporting quality, average motor class, Clean Shipping Index and ISO
14001/Smartway are all examples of measurements on a process level. The ISO 9001 is considered
to be a measurement both on the process- and the quality assurance system level whilst financial
ranking and spend is measured on a company level. The different levels and related measurements
are presented in table 20.
QUALIFED FUTURE NON-APPLICABLE
Transport Quality CSR Compliance Number of overdue invoices/total number of invoices Lead-time Overall Risk
Pick-up precision Contingency Plan
Delivery precision CO2 emissions Number of automatically matched CIC lines/total number of CIC lines
Reporting Quality
Financial Ranking Number of parked invoices/total number of invoices, defined according to labels
Spend
Invoice Quality
ISO 9001 Transport Quality Audit
ISO 14001/SmartWay IB EMB Unloading precision
Average motor class
Clean Shipping Index
Supplier performance dashboard at Volvo Logistics
83
Table 20; Distribution of the twelve measurements among the four levels of supplier assessment as presented by Van Weele (2010).
LEVEL KPIS AND MEASUREMENTS
Product Transport quality, lead time, pick-up precision, delivery precision
Process Invoice quality, reporting Quality, Average Motor Class, Clean Shipping Index, ISO 14001/SmartWay, (ISO 9001)
Quality assurance system ISO 9001
Company level Financial Ranking, Spend
As table 21 below shows, there is no separation of operational KPIs between the different traffic
lanes of Inbound, Outbound and Emballage. Instead, lead-time, delivery precision and reporting
quality have been merged together for Inbound and Outbound in order to provide a simplified view.
However, in the dashboard, the intension is to present the KPIs on precision for Inbound and
Outbound separately due to the different characteristics in definitions. Important to be noted is that
Reporting Quality refers to Deviation reporting and POD/POC at Inbound and Arrival- and departure
reporting at Outbound. POD and POC would be included in the dashboard once the system, ATLAS
that provides the measurement, is completely developed and implemented.
The purpose of this chapter is to evaluate the KPIs according to the different characteristics that
were identified in the theory chapter 3.3. This means that each KPI is categorized as hard or soft,
financial or non-financial and leading or lagging. This evaluation is conducted in order to investigate
the balance of the KPIs in the dashboard. The KPIs have already been chosen but if an unbalance is
detected, this is important information for VLC in order to be able to develop the content of the
dashboard in the future.
Supplier performance dashboard at Volvo Logistics
84
Table 21; Categorizing the KPIs and measurements recommended for the dashboard
KPI Hard Soft Financial
Non-financial
Leading Lagging
Q U A L I F I E D
Transport Quality X X X
Lead-time X X X
Pick-up precision X X X X
Delivery precision X X X X
Reporting Quality X X X
Financial Ranking X X X
Spend X X X
Invoice Quality X X X
ISO 9001 X X X
ISO 14001/SmartWay X X X
Average motor class X X X
Clean Shipping Index X X X
F U T U R E
CSR Compliance X X X
Overall Risk X X X
Contingency Plan X X X
CO2 emissions X X X
Non-applicable KPIs: the remaining invoice KPIs, Transport Quality Audit & IB EMB Unloading precision
The first column of categories, hard or soft, displays a large number of hard measures within both
the qualified and future KPIs, although there is a larger share of soft KPIs within the future KPIs. The
hard measures are characterized by being derived from operational performance or financial results.
The first category of qualified KPIs, denoted operational, are all traditional hard measures displaying
the performance of the company’s core activity of transportation and correlated measures. The
second category is the financial KPIs, also traditional hard measures that are derived from financial
reports and other financial-related departments, for example the I&CC department for the Invoicing
Quality KPI.
The third category of qualified KPIs, core value, is on the other hand, not all seen as hard measures.
The two management systems of ISO 9001 and ISO 14001/SmartWay provide a soft angle on
measurements, as they are not derived from financial or operational reports. Looking at the KPIs
that are possible to include in the dashboard in the future, there is an even split between hard and
soft ones. This division and the larger share of soft measurements can be explained by the difficulty
to collect and document soft KPIs in an efficient way. If it is possible to collect and process soft KPIs in
a relatively easy and effective manner, the inclusion of more soft metrics in the dashboard will
provide VLC with a more holistic picture of the supplier’s performance in the aspect of hard and soft
measures. One example in this context is a new standard for CSR that is under development. With an
acknowledged standard, the conditions for accurate measurements will be improved and CSR
Compliance can be included in the dashboard.
Supplier performance dashboard at Volvo Logistics
85
The metric CO2 emission is a hard measurement. This metric would be highly recommended to
include in the dashboard due to its strong alignment with corporate strategy. However, it is not
possible to measure this in a correct and detailed way at the present point in time.
The division shown in table 21 with a higher number of hard than soft measures are expected as the
dashboard focuses on the overall performance of the suppliers, including the three categories of
operational, financial and core value KPIs. Operational and financial KPIs account for a large part of
the total number of KPIs; these are traditional hard measures which also explain the division. The
core value KPIs provide a more diverse perspective on the supplier’s performance and are important
to include. Since several of the future KPIs are categorized as core value with a soft character, it may
allow for a more balanced dashboard in the future when these metrics are added.
The second column provides a categorization of financial and non-financial measurements and table
21 displays the division between the two categories. All KPIs besides the financial are categorized as
non-financial; they are not possible to translate into monetary terms. All of the qualified financial
KPIs are categorized as financial whilst none of the future potential KPIs are financial, hence all of
these are categorized as non-financial.
The third and last column of leading or lagging KPIs provides a more differentiated division amongst
the KPIs. The column includes some KPIs and measurements that have qualities that categorize them
as being both leading and lagging. The difference between leading and lagging KPIs is that the lagging
KPIs measures past performances whilst the leading KPIs predicts or drive future performances and
also future economic results. The first two qualified core-value KPIs both provide information
regarding how the supplier work with a specific set of questions, environmental aspects for ISO
14001, quality assurance for ISO 9001. These KPIs provide information relevant in order to avoid
future problems, also characterizing them as leading KPIs. The suppliers of VLC may encounter
situations in the future regarding environmental or quality issues. By being certified according to the
ISO- or SmartWay standard, VLC is guaranteed that the supplier has a process in place to deal with
the situation. The certification also ensures that standards are implemented in order to avoid these
future situations.
The average motor class and Clean Shipping Index will provide insight into the supplier’s future
performance regarding emissions. If the KPI of CO2-emission would be possible to monitor in a
correct way this would be included in the dashboard on the expense of the average motor class KPI.
The average motor class KPI is the best possible solution for including an emission related KPI for
road transportations at the present. Clean Shipping is primarily included as an emission KPI but
includes more information than only CO2-emissions and would therefore be preferred. Whilst
average motor class is a leading KPI, providing information on the future emissions, the CO2-emission
KPI in itself is measuring the actual outlet of emissions, hence being lagging.
Financial ranking is also categorized as a leading KPI, predicting future performance. As described in
the empirical chapter, section 4.3.1, the financial ranking of VLC’s suppliers represents the total risk
for business failure of the supplier. With a high ranking, the financial performance of the supplier is
predicted to be good without risk for business failure. A lower ranking on the other hand, predicts a
higher level of risk for business failure, forcing VLC to take sufficient actions to ensure that the
operations related to this specific supplier will not be affected in the future.
Supplier performance dashboard at Volvo Logistics
86
Transport quality and lead-time are both examples of lagging indicators providing information on
how the supplier performed within the time period since the last update of the dashboard. The same
is true regarding pick-up precision and delivery precision, these KPIs will display the number of
transportations performed on time, either when picked-up or delivered, hence a lagging KPI. At the
same time it is possible to argue that these two KPIs are leading since they provide information on
how the supplier will perform within the lead-time KPI in the future, a high number on precision will
drive the performance of the lead-time.
These KPIs are also driving the economic result of the operations. If the precision of the transports
performed by the suppliers is high, this will lead to a high quality and high customer satisfaction
leading to better economic results in the future. There are additional KPIs that may be relevant for
this discussion of being both leading and lagging. For instance, the KPI CO2 -emissions may also be
categorized as leading since the rate of emissions drives the cost for fuel and eventually, the financial
result. However, when discussing this further, several of the KPIs listed could be seen as driving the
financial result in one way or another, and the discussion is therefore limited to the precision KPIs,
driving both financial performance and the operational performance of the lead-time KPI.
The purpose of this chapter was to evaluate the balance between the KPIs that are included in the
dashboard in order to ensure that all angles of measurements were included. As seen in the bar-
chart in figure 51, there is a good spread of leading and lagging KPIs and also, between financial and
non-financial measurements. However, there are more hard measures than soft, which is explained
by the difficulty to measure soft metrics in an efficient way. Nevertheless, overall, the graph shows a
good division amongst the different characteristics which means that the measurements in the
dashboard provides a balanced view of the performance of the suppliers. It should be considered
though, to try to include more of the soft measurements in the future.
5.4 Organizational representation of KPIs The organizational aspects regarding which KPIs to include in the dashboard is another perspective to
take into consideration in the analysis of the supplier performance dashboard and will be evaluated
in this chapter. It is important to ensure that all departments that evaluate supplier performance are
represented. There are seven different departments presented in the empirical chapter; Purchasing
Strategy & Support (PS&S) representing the purchasing department, Inbound (IB), Outbound (OB),
Emballage (EMB), Invoicing & Cost Control (I&CC), Operational Excellence (OE) and Risk Management
(RM). These departments are all represented in table 22 where the division of KPIs amongst the
departments is displayed.
Figure 51; Bar chart displaying the spread of KPIs between the different characteristics.
Supplier performance dashboard at Volvo Logistics
87
Table 22; Illustration of the division amongst KPIs included in the dashboard between the departments at VLC.
*) Not possible to measure today due to system restrictions.
KPI PS&S I&CC OE IB OB EMB RM
Transport Quality X X X
Lead-time X* X
Pick-up precision X*
Delivery precision X* X X*
Reporting Quality X* X
Financial Ranking X
Spend X X
Invoice Quality X
ISO 9001 X
ISO 14001/SmartWay X
Average motor class X
Clean Shipping Index X
Total 2 2 4 1/5* 4 1* 1
The purchasing department is represented in table 22 by the PS&S unit which includes the KPIs
financial ranking and spend where the spend KPI is shared by both PS&S and the I&CC department.
This is due to the fact that PS&S is currently carrying out the spend report manually twice a year but
the intension is that it should be possible to gather this information on a monthly basis directly from
the I&CC system where amounts invoiced per supplier is registered. The financial ranking is
connected to PS&S with regards to execution, this is a KPI that permeates and effects the entire VLC
organization. If a supplier is degraded to a lower score, this increases the risk for financial problems
and ultimately closure. Such a risk involves all operations within VLC and execution of action plans
due to the degrading may also affect some, or all, departments in their daily operations.
As mentioned, purchasing is only represented in the table by two KPIs. The majority of KPIs are
connected to, and information is gathered from other departments within VLC. This is evidence for
the need of a dashboard that displays information from the entire VLC organization. One purpose of
the dashboard is to visualize the performance of a supplier. This purpose would have been able to
fulfill even if all the KPIs already existed within the purchasing department. However, the second
purpose of the dashboard is to gather information and the defragmented spread of KPIs in table 22
illustrates that the information needed for a holistic view of a supplier’s performance is located at
different departments within VLC. In order to ensure that decisions taken within the purchasing
department is based on facts, this information needs to be collected and brought forward to the
purchasing department, hence included in the dashboard.
The third financial KPI, besides Spend and Financial Ranking, is the Invoicing Quality measurement
that is derived from the I&CC department. This KPI enables a discussion in the Supplier Management
Forum regarding the troubles encountered within the administrative handling of the supplier’s
invoices. The Operational Excellence department is represented through four KPIs; the two ISO
standards as well as Clean Shipping Index and Average Motor Class. These KPIs permeate the entire
Supplier performance dashboard at Volvo Logistics
88
VLC organization even though the responsibility lies with the Operational Excellence department.
These KPIs are also closely aligned with the core values.
The three GBOs are represented in the table by the operational KPIs where both the Inbound and
Outbound GBOs are represented by a number of KPIs. However, the Emballage GBO is only
represented by one metric. This higher number for Inbound is connected to the higher level of
complexity within the Inbound distribution leading to more measurements performed and needed.
The measurements within Inbound are of outmost importance since deviations and disturbances in
the delivery of components into the production facilities may result in large disruptions.
Several of the KPIs related to Inbound have been marked with an asterisk in table 22. These are KPIs
that is recommended to include in the dashboard but will not be able to include initially due to
system restrictions. The information regarding these KPIs would need to be collected from many
different systems (TIR, FADS, and TPS etc.) as well as processed in order to merge the findings from
the different systems together into each KPI. The Inbound organization is awaiting the roll-out of
their new global system, ATLAS, which will create a holistic system environment where
measurements are defined in a common way. This system implementation is a prerequisite for all
operational Inbound KPIs to be included in the dashboard. In the meantime, until ATLAS is operative,
these KPIs will have to be excluded from the dashboard.
Outbound does not operate with the same complexity, time constraints or time-windows as Inbound.
Lead-time and delivery precision is though measured and included in both these GBOs whilst pick-up
precision is only measured for Inbound. For Outbound the Reporting Quality KPI will include Arrival-
and Departure Reporting, measurements that together with lead-time and Delivery precision can be
collected from Outbound’s system, A4D, hence no technical restrictions apply.
The Emballage GBO is only represented by one KPI that is marked with an asterisk in the dashboard.
The reason behind the asterisk is that Emballage cannot measure delivery precision due to lack of
system support within this GBO. The department has currently no system allowing them to perform
measurements of the performance of the suppliers, making it impossible to include operational data
to the dashboard. Hopefully, the implementation of the LES-project will enable also the Emballage
GBO to carry out measurements in the future, hence be included in the supplier performance
dashboard. This illustrates the importance of system support in order to be able to measure supplier
performance.
The last department represented with KPIs in the dashboard is Risk Management and the KPI
Transport Quality; a KPI that is also shared with Inbound and Outbound. Even if this KPI is managed
by the Risk management department, it is a measure of the operational performance of the
suppliers, hence connected to the two GBOs as well. This is a good example of a cross-functional KPI,
important to several departments and therefore, it also provides a good foundation for discussion
within the Supplier Management Forum. The quality of the transportations carried out by the
suppliers and the number of damages reported per supplier is also closely aligned with the Volvo
Group’s core value quality.
The last core value of the Volvo Group; safety is not represented within this dashboard to the same
extent as the other two of quality and environmental care. Safety can be perceived in different ways
and for the end user of Volvo’s products the safety is connected to the use of the products such as
Supplier performance dashboard at Volvo Logistics
89
construction equipment or buses etc. Safety is also connected to the production of the products and
when it comes to the transportation of components and finished products safety can be linked to the
future KPI of CSR compliance including labor and safety issues such as resting times and use of
seatbelts.
5.5 Evaluation of KPIs and measurements per traffic mode The KPIs and measurements for the dashboard also need to be evaluated depending on their fit
towards the four different modes of traffic; road, rail, sea and air.
The KPIs are evaluated in table 23, where each KPI is matched towards the four traffic modes. This is
done in order to highlight which KPIs are applicable for all traffic modes and which are traffic mode
specific. Within the table, the KPIs are also evaluated on their geographical spread; whether the KPI
is global or only applicable in certain regional areas.
Table 23; Evaluation of KPIs on fit towards traffic modes
KPI IB
Road OB
Road IB
Rail OB Rail
IB Sea
OB Sea
IB Air
OB Air
Global
Transport Quality X X X N/A X X X N/A X
Lead-time - X - N/A - X - N/A X
Pick-up precision - N/A - N/A - N/A - N/A -
Delivery precision - X - N/A - X - N/A X
Reporting Quality - X - N/A - X - N/A X
Financial Ranking X X X X X X X X X
Spend X X X X X X X X X
Invoice Quality X X X X X X X X
ISO 9001 X X X X X X X X X
ISO 14001/SmartWay X X X X X X X X X
Average motor class X X N/A N/A N/A N/A N/A N/A X
Clean Shipping Index N/A N/A N/A N/A X X N/A N/A X
Total 7 10 6 5 6 10 6 5 10
Table 23 shows that all the financial KPIs are applicable to each of the four traffic modes and that is
also true for the core value KPIs consisting of ISO certifications. These KPIs are all general and not
specific to any modes of traffic as well as possible to measure globally for all KPIs except the KPI of
Invoice quality. Invoice quality is currently found in the I&CCs system CIC and is today, only applicable
to Europe. However, the LES-project, introducing a new SAP-based solution for the I&CC department
will enable this measurement on a global scale in the future.
The Spend KPI will also be influenced by the roll-out of the LES-project. Currently, the PS&S
department collects and summarizes the spend data manually on a global scale twice a year. The
I&CC department is able to retrieve the same information automatically from CIC on a monthly basis
but only for Europe. This creates a debate on which way to go at an initial stage when creating the
Supplier performance dashboard regarding the Spend KPI. If a global focus is the main objective, the
information should be gathered twice a year from the Global spend report by the PS&S department.
However, if a more frequent update is preferred, the information from I&CC and CIC should be used
Supplier performance dashboard at Volvo Logistics
90
where possible. Within a longer time horizon when the roll-out and implementation of the new
system from the LES-project is finished, monthly updates globally will be enabled.
Among the core value KPIs, there are two that are specific to only one traffic mode; Average motor
class and Clean Shipping Index. Even if these KPIs are specific they contain important information
justifying their inclusion in the Supplier performance dashboard. Average motor class is only
applicable for road transportations, but the close link between the motor class and emissions of
greenhouse gases argues for the importance of the KPI. The road transportation is also the traffic
mode with the largest number of active core suppliers. Together with the articulated environmental
focus from Volvo, this KPI as well as the Clean Shipping Index for the sea transportations are justified
in the dashboard.
When discussing if traffic mode specific KPIs should be included in the Supplier performance
dashboard, it is defensible for the two modes mentioned above, road and sea. These two constitute
90 percent of the turnover for 2011. Among the 154 core suppliers, only two operate within rail
traffic and there is no comprehensive summarizing environmental measurement for rail, as the Clean
Shipping Index exists for sea that allows more close monitoring of emissions. Among the four
different traffic modes, rail is also the one seen as most environmentally friendly. At an initial stage,
it is therefore more important, and prioritized, to have close monitoring of emissions for the other
traffic modes.
Among the four traffic modes air is the least environmentally friendly. This mode is primarily used for
express transportations or transportation of high value goods. This means that there are no
developed routes since most bookings are made under time constraint due to the urgent nature of
the express transportation. There is no frame of reference for calculations, and the emission metric is
not of same importance as for other fixed lanes in other traffic modes due to the express
transportations.
The operational KPIs are more differentiated compared to the other categories. Within the
operational KPIs, there is not only a division among the traffic modes but also a spread within the
same traffic mode for the Inbound and Outbound flow of traffic. The KPIs evaluated and
recommended to be included in the Supplier performance dashboard and displayed in table 23
should to as large extent as possible, be general and applicable to all suppliers. However, the KPI
pick-up precision is only applicable to Inbound but it is seen as important to include anyway.
Within the Inbound flow, all the operational KPIs are applicable; however the current defragmented
system environment does not support an automatic transferring of information into the dashboard
at this point. The Inbound organization is awaiting the roll-out of their new global system, ATLAS,
which will create a holistic system environment where measurements are defined in a common way
and in the mean time until ATLAS is operative these KPIs will have to be excluded from the
dashboard.
Within Outbound, the transportations are mainly carried out by road or sea transportation. With
regards to the physical size and weight of the finished products; trucks, buses, construction
equipment etc., air freight is not used. Neither is rail a transportation mode used and therefore, both
of these are excluded in the table above, marked with Not Applicable (N/A). As mentioned above,
one of the operational KPIs, pick-up precision is only measured within the Inbound flow and
Supplier performance dashboard at Volvo Logistics
91
therefore marked with N/A for Outbound as well. The remaining operational KPIs are all applicable to
the Outbound flow and are also covering the VLC operations on a global scale. The Reporting Quality
metric consists of arrival- and departure reporting for Outbound and together with delivery precision
and lead-time they are applied to both road and sea transportations, although they are somewhat
differently defined for the two traffic modes.
The last operational KPI, Transport Quality, measures the number of damages. It is applied to both
Inbound and Outbound, although the measurement is carried out by the Risk Management
department. This KPI is covering all products that are transported besides emballage which is
included in the Inbound flow. Transport Quality is also measured on a global level through Risk
Management’s own system, RMS, creating the possibility for a holistic evaluation and also a
comparison between Inbound and Outbound suppliers.
5.6 Summarizing discussion of KPI evaluation In the chapters 5.1 to 5.5, the KPIs and measurements have been evaluated from several different
perspectives. The analysis started with an assessment of the relevance of a supplier performance
dashboard for the objectives of the purchasing function. It was found that the dashboard can be a
supportive tool in many aspects while there are also weaknesses of the applicability which will be
further discussed in chapter 5.6.1. It was also shown in 5.1 that the Supplier performance dashboard
can fulfill several of the requirements on a dashboard that are desired by VLC. Particularly those
requirements that relate to the Supplier Management Forum where suppliers will be assessed on an
overall, supplier group level. If the dashboard shall be used also for decision making at lower, more
detailed levels, it is required that the dashboard enable data drilldown and that puts specific
requirements on the ability to connect and integrate the dashboard with many different systems for
automatic data transferring.
The analysis ended up in twelve measurements that are recommended to be included in the
dashboard. Due to system restrictions, a couple of these KPIs will not be possible to include at an
initial stage but are recommended to be implemented when new systems are in place. Additional
metrics were considered relevant and important to include but due to lack of consistent definitions,
these should not be focused upon until later stages of the dashboard implementation. In chapter 7,
more details regarding recommendations for the dashboard implementation process is presented.
It was shown in the first part of chapter 5.2 that system restrictions and lack of standard definitions
were the primary reasons for not including some of the KPIs at the first stages of the dashboard
implementation. The thorough evaluation of the KPIs was also complemented with a ranking of the
KPIs in the second part of chapter 5.2. The ranking was completely based on the perception of the
thesis authors and it might be judged differently by another evaluator. Nevertheless, the current
rank can still give a rough picture of the appropriateness of the different KPIs and measurements,
and the ranking is a good complement to the motivations to why KPIs should be included in the
dashboard or not.
Supplier performance dashboard at Volvo Logistics
92
The twelve KPIs and measurements that were considered appropriate for dashboard inclusion were
assesses based on their different characteristics; whether they were hard or soft, financial or non-
financial and if they were leading or lagging. The findings are summarized in figure 52 where it is
shown that the best mix was achieved between leading and lagging KPIs. The chosen set of KPIs does
not include many soft measures. It can be explained by the difficulty to quantify soft metrics and
generation of these metrics will most likely, require more manual work. Nevertheless, there are a
couple of future KPIs that have a more soft character and these should be considered in a future
context to achieve a more equal share of both hard and soft measures.
Something that has also been found from the analysis of the empirical data is that the purchasing
function of VLC is the owner of only a few of the total set of KPIs and measurements that should be
included in the dashboard. As figure 53 shows, there are seven different departments that each have
an own interface to the suppliers. It shows that there is a decentralized supplier measurement
structure. For different reasons it can be motivated to have several different interfaces in the
company, especially as different departments have specific competencies.
At VLC, each department in figure 53 measures the suppliers based on what is relevant for their
specific strategy and objectives. It means that each of these departments is responsible for a couple
of supplier KPIs. However, it also results in information disparity that is the root cause for the need of
a supplier performance dashboard at the purchasing department; a dashboard where the most
relevant information from disparate systems are compiled to provide a comprehensive view of the
overall supplier performance.
Finally, the KPIs were also evaluated based on their generalizability and applicability to different
traffic modes. It is desired that the dashboard should be relatively general and not too situation
specific. It was found that many of the KPIs cover all traffic modes but there are also those that are
Figure 52; Illustration of the balance between different characteristics of the KPIs.
Figure 53; Illustration of the decentralized supplier measurement structure at VLC where several departments are responsible for different measurements.
Supplier performance dashboard at Volvo Logistics
93
specific to only road and sea. Furthermore, since the outbound operations only concerns
transportation by road or sea, the related operational KPIs will only be relevant for these modes and
not applicable for air or rail transports for example.
As a concluding picture to illustrate the current state and conditions regarding the supplier
measurement structure at VLC, a mind map is provided in figure 54. The mind map shows a complex
reality where there are different prerequisites and conditions for the different measurements. It is
important to highlight this view, since it shows the difficulty with the creation of one common
location where all the important information is instantly accessible when needed.
Supplier performance dashboard at Volvo Logistics
94
Figure 54; Mind map that covers all the measurements that were found from the empirical study. It shows the different prerequisites and conditions that are related to each of the KPIs.
Supplier performance dashboard at Volvo Logistics
95
5.6.1 Critical discussion about the dashboard
It was found in the literature review, that enterprise dashboards can be a supportive tool for more
efficient information processing and decision making. However, it is important to consider the fact
that the content in a dashboard is a simplification of a much more complex reality. The mind map in
figure 54 in the previous section gives an indication of this complexity, even if this can also be seen as
a rough simplification of what the reality looks like. The complexity that is shown in the mind map is
the result of different supplier measurements that are carried out within different departments of
VLC where varying conditions for measurements exist. It is not an easy task to translate this complex
reality into a simple dashboard without a part of the information being left out. This is something
that needs to be considered when creating a dashboard; selection or exclusion of any KPI or
measurement will affect what kind of information the user gets access to and what data will be the
basis for the decisions making.
This aspect was considered when deciding what KPIs and measurements that should be
recommended to be included in the Supplier performance dashboard at VLC. After thorough
evaluation of the KPIs that were identified in the empirical study, the list was reduced resulting in a
set of KPIs and measurements that are recommended to be included in the dashboard. This means
that a couple of KPIs have been excluded from the dashboard. Some of the KPIs were excluded
because they were not relevant for supplier assessment, however, it can be concluded that the main
reasons for exclusion are technical restrictions and lack of standard definition of KPIs. Those KPIs and
measurements that are not possible to include due to these reasons are still relevant and can provide
important information that should also be considered when making decisions even if they are not
seen in the dashboard. Furthermore, it is recommended that the technical solution enables data
drilldown and linkages to more detailed reports in order for the decision maker to find the root
causes of any deficient performance.
In this context, it is also important to discuss whether a Supplier performance dashboard is what
purchasing at VLC really needs and if it is the right solution to its issues to compile relevant supplier
data. It was found in section 5.1 that a dashboard can support the fulfillment of some of the
objectives of the purchasing function that were found in theory. However, the dashboard cannot
reflect the relationship between VLC and its supplier; the possession of power, ease of
communication, etc. Furthermore, since there are many departments and actors that interact with
the supplier, it is difficult to grasp how well the relationship and communication works within each
department since the conditions for communication may differ.
There are additional tools with other features that can be seen as alternatives to a dashboard. The
Balanced scorecard for instance, ensures a balanced view of different metrics that are grouped into
four categories. In comparison, it is not certain that the dashboard can give this balanced view; it
depends of course on what metrics are included. It was shown in the analysis that the chosen set of
twelve KPIs are a good mix between financial and nonfinancial metrics as well as both leading and
lagging KPIs. However, there is an imbalance between hard and soft measures and that is something
that is important that VLC and the user of the dashboard are aware of. Furthermore, the balanced
scorecard includes a ranking of the level of performance that is achieved for each KPI which may
facilitate the comparison of performance between different measurement objects. An additional tool
to be used instead of a dashboard is different types of surveys where it might be possible to grasp
and measure more soft measures. Nevertheless, none of these alternatives can provide the
Supplier performance dashboard at Volvo Logistics
96
visualization that the dashboard provides and it can be difficult, especially from a survey, to get a
holistic view.
Another thing that is important to consider, is how the suppliers perceive the application of a
supplier performance dashboard. Supplier assessment can be seen as a way of ensuring high quality
of purchased products or services as high quality is considered important and prioritized by the
buying firm. However, there might be a risk that supplier measurements and control also send a
signal of distrust. It is not certain that the deployment of a dashboard is received positively by all
suppliers; some may perceive it as VLC is not relying on their operations.
Furthermore, it can also be considered to be wasteful if some metrics are measured doubly, both by
the buyer and the supplier. Nevertheless, in this specific case of the deployment of a supplier
performance dashboard, the intension is that the dashboard should be a tool to detect deviations
and deficient performance that can be improved through collaboration with the supplier and
common actions. It is also something that is supported by theory (Gordon, 2005), that the next steps
after deploying a supplier performance assessment system is to give feedback to suppliers on their
performance and then produce results in terms of improvements from measuring supplier
performance. It was also shown from the interviews with the suppliers that the attitude towards a
supplier performance dashboard was nothing but positive although one supplier mentioned that
they did not wished to be measured on something that was not agreed upon and included in the
contracts.
To conclude, the previous discussion in this section has described some of the weaknesses of the
dashboard and important issues to be aware of. Nevertheless, the conviction of the usefulness of a
supplier performance dashboard to track supplier performance has not been reduced. Considering
the situation at the purchasing department of VLC today where only a minor part of the supplier
performance data is accessible, a dashboard will be a step in the right direction towards enhanced
availability to relevant information and it also creates ability to base decisions on facts instead of gut
feeling.
The purpose of a dashboard is of course not to be only a sufficient solution that is perceived as better
than nothing, however, due to the complexity of the creation of a dashboard and the disperse
structure of measurement systems and levels of identification, the implementation must start in a
smaller scale where not all information is included initially. Additional KPIs will then be added step by
step and therefore, it is also important to find a solution that is sustainable and that is possible to
continue to build on in the long term.
5.7 Evaluation of systems and technical solutions When creating a dashboard, one of the prerequisites is that the data can be automatically feed into
the system, otherwise the dashboard will require too many resources (Rasmussen, et al., 2009). This
requirement has also been emphasized by VLC; if the dashboard demands too much manual work it
will be too complex and costly to develop and the project will most likely not be realized. Therefore,
it must be possible to integrate the dashboard system with the existing systems at VLC.
As seen in table 24, there is a complex reality regarding systems and identification of information
that needs to be considered when initializing the concretization of the Supplier performance
Supplier performance dashboard at Volvo Logistics
97
dashboard. Regardless of technical solution chosen for the concretization, this complex structure will
have to be managed.
This complex reality is most likely one of the reasons why a tool such as the dashboard, solving the
problems of dispersed information, have not been created previously within VLC although the need
for such a tool has been identified. However, since this thesis has identified systems that will have to
be integrated with the Supplier performance dashboard as well as levels of identification of
information, VLC now possesses a roadmap that can guide the technical implementation of the
dashboard.
Table 24; Current and future system and level of identification for all recommended dashboard measurements
Clean Shipping Index Supplier Group Supplier Group
As stated earlier, some measurements recommended to be included in the dashboard cannot be
implemented at an initial stage due to system restrictions and therefore, these are labeled N/A in
table 27. These measurements and the KPIs Spend and Invoice Quality, are denoted with an asterisk
at the level of identification in a future context. These measurements are all awaiting the roll-out of
either ATLAS or LES, and contract is the level of identification proposed. However, it is not fully
decided upon and it may be subjected to changes.
As the metrics are measured on numerous different levels of identification, it is important to ensure
the quality of the data when it needs to be aggregated up to supplier group level, which is the initial
focus of the dashboard. In order to guarantee this, target fulfillment will have to be used when
information regarding performance within different lanes and contracts are going to be merged.
Supplier performance dashboard at Volvo Logistics
106
7 Recommendations In this section, the recommendations to VLC regarding the implementation of a supplier performance
dashboard are provided. The section is divided into three parts with different time perspectives;
recommendations before dashboard implementation, recommendations on a short term during
implementation and recommendations on a longer term. The chapter also includes some general
recommendations that need to be considered in conjunction with the dashboard project.
Pre-implementation phase
Set required levels of target fulfillment – Set the required levels of performance for each
measurement so that the dashboard has points of reference to measure against.
Since the dashboard will measure on a global scale, aggregating operations within
different regions with different performance levels, it is important to use target
fulfillment and as an overall measurement.
Revise the PARMA system – During the study, it was found that the supplier identification
system contains some inconsistency. There are examples of suppliers that have different
PARMA-IDs in different systems and in order to ensure data accuracy and fair supplier
evaluation, the system for supplier identification need to be revised.
Decide upon dashboard system – Two suggestions on dashboard systems have been
provided in this thesis. A majority of system providers offer trial versions or pilot projects for
customer evaluation. It is recommended to start with the set of KPIs that are accessible
within the purchasing department and run a pilot test including around ten core suppliers.
The dashboard should not only gather and provide the purchasing department with
information but also display and visualize the information in an easy and accessible
way. This puts specific requirements on the technical solution that will be the final
choice for realization of the supplier performance dashboard. For examples of
visualization of selected KPIs see chapter 5.7.1.
Create a project team – Create a project team that will have specific focus on the dashboard
implementation. This project team should preferably be managed by a representative from
the PS&S department. The project team will be of a dynamic nature where the participants
will change as the project proceeds depending on which stage in the implementation process
the project has reached. The project group should preferably involve representatives of the
department that performs the specific measurements.
Implementation – Short term
Introduce the first implementation step – Start with the implementation of the
measurements that are automatically accessible within the purchasing department. The
dashboard will then include; ISO 9001, ISO 14001, Average motor class, Clean Shipping Index,
Spend and Financial ranking and these measurements will have a global coverage. Clean
shipping index will require manual data transferring and as mentioned previously, it is only
relevant for European carriers but it covers their operations globally. Spend will have a global
coverage but can only be updated semi-annually until LES is implemented.
Introduce the second implementation step – Initiate a project for system integration to
transfer data from A4D and RMS. The Outbound related operational metrics will then be
included in the dashboard as well as the transport quality KPIs for both Inbound and
Outbound.
Supplier performance dashboard at Volvo Logistics
107
Implementation – Long term
Introduce the third implementation step; Await LES roll-out – It is recommended to await
the implementation of LES before including additional KPIs. To facilitate the dashboard
project planning, it is good to continuously communicate with the LES-project to track when
parts of the system will be implemented and new functionalities will be in place. When new
functionalities are in place which will allow for extraction of invoice quality, spend and
Emballage related operational data, a new project for data integration can be initiated to
also include these measurements in the supplier performance dashboard.
Invoice quality for the European operations is currently accessible in another system
but due to limited coverage and to avoid rework, it is recommended to await
inclusion of invoice quality until the LES-project is completed.
Emballage related operational KPIs only include delivery precision. Since more details
about the Emballage related measurements were not in place during the execution
of this thesis, it is important to evaluate further details about this measurement.
Introduce the fourth implementation step; Await ATLAS roll-out – The Inbound related
operational KPIs cannot be added to the dashboard until ATLAS is implemented.
The ATLAS system will be implemented in stages which mean that a global coverage
of measurements cannot be achieved instantly. The first ATLAS roll-out will include
road Europe and then additional regions and modes can be added. The
recommendation is to add the Inbound measurements in stages.
Communicate with the ATLAS project to make sure that the functionalities required
from a purchasing perspective is also included in order to make the best use of
ATLAS in the future. This particularly refers to the inclusion of a contract row in order
to enable derivation of data to supplier group level.
When ATLAS is fully implemented, the Inbound related operational measurements
can be added to the supplier performance dashboard.
General recommendations
Share the information in the dashboard with the suppliers. The supplier performance
dashboard will be useful not solely within the VLC organization but also in the relationship
between VLC and the core suppliers. The dashboard will act as a tool for communication and
create a closer relationship between the supplier and VLC where common action towards a
better result within several questions and areas can be accomplished.
It was found that the suppliers in general are positive towards a supplier
performance dashboard, and particularly take part of the supplier measurements of
VLC.
Important to notify though, is that the suppliers do not desire to be measured on
anything but what has been agreed upon in the contracts.
Extend the areas of application – The dashboard is primarily intended for the supplier
management forum. However, the intension is to extend the applicability to use the
dashboard in other contexts as well. A requirement on the dashboard that have been
emphasized in this thesis is to allow data aggregation and drill down. If this requirement can
be fulfilled, it would enable deployment of the supplier performance dashboard in areas
where a more detailed level of analysis is required.
Supplier performance dashboard at Volvo Logistics
108
Consider the fifth implementation step – Revise the definitions and standards for future
metrics. Evaluate possibilities for more standardized measurements. This refers particularly
to measurements that are categorized as future KPIs in this thesis, such as Overall safety,
Contingency plan and CSR compliance.
8 Future Research The scope of this master thesis has been relatively broad and it covers many aspects regarding
purchasing, supplier assessment, performance indicators and dashboard application. Nevertheless,
the study has had its limitations and there are several areas that can be investigated further and are
suggested for future research. First of all, this study was carried out as a case study at VLC; a
company within the automotive industry that buys transportation services and packaging material.
The findings in this thesis are very specific for the operations of VLC; the performance indicators that
were chosen for the dashboard are aligned with the specific strategy and goals of the company.
Nevertheless, some elements of the content in the dashboard may be generalizable to other contexts
besides the logistics and automotive industry, and the development of a framework for dashboard
design is an interesting subject for future research.
Furthermore, it was not within the scope of our thesis to provide a technical solution for the
dashboard to VLC. However, it is something that could be interesting to evaluate further; to closer
examine the determining factors for a specific dashboard solution and assess how different
dashboard systems can benefit a company. It would also be interesting to further investigate how
the dashboard can be used in the strategy development work. Theory behind portfolio analysis was
provided in this thesis but to evaluate how the dashboard may be adjusted depending on the
strategic importance of the supplier could be interesting to evaluate further.
Finally, findings in this thesis indicate that the suppliers of VLC were positive to the idea of a
dashboard and were interested in taking part of the information. For future research, it is interesting
to further evaluate how the dashboard can be used to increase the efficiency of the relationship to
the suppliers. The relationship between buyers and suppliers is closely aligned with the strategy
development work and possibly, these two subjects; strategy development work and supplier
relationships in the context of dashboard application can be studied jointly.
Supplier performance dashboard at Volvo Logistics
109
References
AB Volvo, 2007a. Inbound. [Online] Available at: http://www.volvologistics.com/logistics/global/en-gb/Logistic%20solutions/Inbound/Pages/Inbound.aspx [Accessed 29 February 2012].
AB Volvo, 2007. Quality, safety and environmental care -our corporate values. [Online] Available at: http://www.volvologistics.com/SiteCollectionDocuments/VL/Library/Gent/Quality%20Safety%20and%20Environmental%20Care.pdf [Accessed 5 Mars 2012].
AB Volvo, 2011. Inbound. [Online] Available at: http://violin.volvo.net/volvologistics/corporate/en/businessfunctions/inbound/Pages/inbound.aspx [Accessed 29 February 2012].
AB Volvo, 2011. Inbound Traffic. [Online] Available at: http://violin.volvo.net/volvologistics/corporate/en/businessfunctions/inbound/functions/traffic/pages/inbound_traffic.aspx [Accessed 29 February 2012].
AB Volvo, 2011. Inbound Traffic Management and Customer Service. [Online] Available at: http://violin.volvo.net/volvologistics/corporate/en/businessfunctions/inbound/functions/traffic/traffic_management/Pages/traffic_management_and_customer_services.aspx [Accessed 29 February 2012].
AB Volvo, 2011. Invoicing & Cost Control. [Online] Available at: http://violin.volvo.net/volvologistics/corporate/en/businessfunctions/finance/ICC/Pages/default.aspx [Accessed 29 February 2012].
AB Volvo, 2011. Press release - Effektivare logistik minskade Volvokoncernens koldioxidutsläpp med 22 procent. [Online] Available at: http://www.vfsco.com/financialservices/norway/no-no/nyheter/_layouts/CWP.Internet.VolvoCom/NewsItem.aspx?News.ItemId=102981&News.Language=sv-se [Accessed 2 Mars 2012].
AB Volvo, 2012. Annual Reports: Volvo Group Global. [Online] Available at: www.volvogroup.com [Accessed 4 February 2012].
Supplier performance dashboard at Volvo Logistics
110
AB Volvo, 2012. Finance and Business control. [Online] Available at: http://violin.volvo.net/volvologistics/corporate/en/businessfunctions/finance/Pages/finance.aspx [Accessed 29 February 2012].
AB Volvo, 2012. Volvo Grop Sverige - Våra värderingar. [Online] Available at: http://www.volvogroup.com/group/sweden/sv-se/Volvo+Group/ourvalues/pages/volvovalues.aspx [Accessed 09 May 2012].
Aberdeen Group , 2010. QlikView Customers Outperform the Best-in-Class with Dashboards, s.l.: Aberdeen Group.
Aberdeen Group, 2009. Executive dashboards the key to unlocking double digit profit growth, s.l.: Aberdeen Group.
Analytics in motion, 2012. Analytics in motion. [Online] Available at: http://www.analyticsinmotion.net/services-business.html [Accessed 10 May 2012].
Andersson, D. & Norrman, A., 2002. Procurement of logistics services - a minutes work or a multi-year project?. European Journal of Purchasing & Supply Management, 8(1), pp. 3-14.
Asmild, M., Paradi, J., Reese, D. & Tam, F., 2007. Measuring overall efficiency & effectiveness using DEA. European Journal of Operational Research, 178(1), pp. 305-321.
Baily, P., Farmer, D., Jessop, D. & Jones, D., 2005. Purchasing principles and management. 9th ed. Essex: Pearson Education Limited.
Beatham, S., Anumba, C., Thorpe, T. & Hedges, I., 2004. KPIs: a critical appraisal of their use in construction. Benchmarking, 11(1), pp. 93-117.
Birkland, C., 2002. Stating the obvious. Fleet Equipment, 28(2), p. 4.
Boyson , S., Corsi, T., Dresner, M. & Rabinovich, E., 1999. Managing effective third-party logistics partnerships: what does it take?. The Journal of Business Logistics, 20(1), pp. 73-100.
Bryman, A. & Bell, E., 2003. Business research methods. Oxford: Oxford University Press.
Bryman, A. & Bell, E., 2011. Business Research Methods. Oxford: Oxford University Press.
Caplice, C. & Sheffi, Y., 1995. A Review and Evaluation of Logistics Performance Measurement Systems. The International Journal of Logistics Management, 6(1), pp. 61-74.
Supplier performance dashboard at Volvo Logistics
111
Car lovers magazine, 2010. Car lovers magazine. [Online] Available at: http://www.carloversmagazine.com/index.php/2010/11/22/2011-chrysler-300c-images-revealed-australian-launch-in-2012/ [Accessed 10 05 2012].
Charron, K., 2006. Why KPIs belong in supply chain contracts. Supply Chain Management Review, 10(2), pp. 22-28.
Chow, G., Heaver, T. & Henriksson, L., 1994. Logistics Performance: Definition & Measurement. International journal of Physical Distribution & Logistics Management, 24(1), pp. 17-28.
Christopher, M., 2005. Logistics and supply chain management: creating value-added networks. 3rd ed. Harlow: Pearson Education Limited.
Coyle, J. J. et al., 2009. Supply Chain Management a logistics perspective. 8th ed. Mason: Cengage Learning.
Dorestani, A., 2009. The association between non-financial key performance indicators and accounting and market-based, quality of earnings, and analysts' of forecasts. Memphis: University of Memphis.
Eckerson, W., 2011. Performance Dashboards: Measuring, Monitoring, and Managing Your Business. 2nd ed. Hoboken: John Wiley & Sons.
Franceshini, F., Galetto, M. & Maisano, D., 2007. Management by measurement: designing key indicators and performance measurement systems. Berlin Heidelberg: Springer.
Gadde, L.-E., Håkansson, H. & Persson, G., 2010. Supply Network Strategies. 1st ed. Wiltshire: John Wiley & Sons.
Ghauri, P. & Grønhaug, K., 2005. Research Methods in Business Studies. 3rd ed. Essex: Pearson Education Limited.
Gordon, S., 2005. Seven Steps To Measure Supplier Performance. Quality Progress, 38(8), pp. 20-25.
Gordon, S., 2008. Supplier Evaluation and Performance Excellence: A Guide to Meaningful Metrics and Successful Results. Florida: J. Ross Publishing.
Gunasekaran, A., Patel, C. & McGaughey, R. E., 2004. A framework for supply chain performance measurement. International Journal of Production Economics, 87(3), pp. 333-347.
Handfield, R., Walton, S. V., Sroufe, R. & Melnyk, S. A., 2002. Applying environmental criteria to supplier assessment: A study in the application of the Analytical Hierarchy Process. Journal of Operations Management, Issue 141, pp. 70-87.
Supplier performance dashboard at Volvo Logistics
112
Holter, A. R., Grant, D. B., Ritchie, J. & Shaw, N., 2008. A framework for purchasing logistics services in small and medium size enterprises. International Journal of Physical Distribution & Logistics Management, 38(1), pp. 21-38.
Kaplan, R. S. & Norton, D. P., 1992. The Balanced Scorecard: Measures that drive performance. Harward business review, 70(1), pp. 71-79.
Kaplan, R. S. & Norton, D. P., 1996. Translating Strategy into Action: The Balanced Scorecard. Boston: Harvard Business School Press.
Kraljic, P., 1983. Purchasing must become supply management. Harvard Business Review, 61(5), pp. 109-117.
Krauth, E., Moonen, H., Popova, V. & Schut, M., 2005. Performance measurement and control in logistics service providing. s.l., s.n., pp. 239-247.
Krauth, E., Moonen, H., Popova, V. & Schut, M., 2005. Performance measurement and control in logistics service providing. In: C. S. Chen, J. Filipe, I. Seruca & J. Cordeiro, eds. Proceedings of Seventh international conference on enterprise information systems. s.l.:ICEIS, pp. 239-247.
Kungliga ingenjörsvetenskapsakademien, IVA, 2002. Energianvändning i transportsektorn. [Online] Available at: http://www.iva.se/upload/Verksamhet/Projekt/Energiframsyn/Transport%20komplett3.pdf [Accessed 10 May 2012].
Lai, K.-H., Ngai, E. & Cheng, T., 2004. An empirical study of supply chain performance in transport logistics. International Journal of Production Economics, pp. 321-331.
Malik, S., 2005. Enterprise dashboards: design and best practices for IT. Hoboken: John Wiley & Sons.
Menon, M. K., McGinnis, M. A. & Ackerman, K. B., 1998. Selection criteria for providers of third-party logistics services: An exploratory study. Journal of Business Logistics, 19(1), pp. 121-137.
Neely, A., 1999. The performance measurement revolution: why now and what next?. International Journal of Operations & Production Management, 19(2), pp. 205-228.
Neely, A., Gregory, M. & Platts, K., 1995. Performance measurement system design A literature review and research agenda. International Journal of Operations & Production Management, 15(4), pp. 80-116.
Parmenter, D., 2009. Key performance indicators - developing, implementing and using winning KPIs. 2nd ed. Hoboken: John Wiley & Sons.
Rasmussen, N., Chen, C. Y. & Bansal, M., 2009. Business Dashboards A visual catalog for design and deployment. Hoboken: John Wiley & Sons.
Supplier performance dashboard at Volvo Logistics
113
Sarkar, A. & Mohapatra, P. K., 2006. Evaluation of supplier capability and performance: A method for supply base reduction. Journal of Purchasing & Supply Management, Volume 12, pp. 148-163.
Saunders, M., Lewis, P. & Thornhill, A., 2009. Research methods for business students. 5th ed. Essex: Pearson Education Limited.
Schmitz, J. & Platts, K. W., 2004. Supplier logistics performance measurement: Indications from a study in the automotive industry. International Journal of Production Economics, 89(2), pp. 231-243.
Simpson, P. M., Siguaw, J. A. & White, S. C., 2002. Measuring the Performance of Suppliers: An Analysis of Evaluation Processes. The Journal of Supply Chain Management, 38(1), pp. 29-41.
Skjøtt-Larsen, T., Schary, P. B., Mikkola, J. H. & Kotzab, H., 2007. Managing the global supply chain. 3rd ed. Gylling: Copenhagen Business School Press.
Smith, H. & Fitch, T., 2009. Application of relationship marketing & management: a large contractor case study. Construction Management & Economics, Volume 27, pp. 399-410.
Sundtoft Hald, K. & Ellegaard, C., 2011. Supplier evaluation processes: the shaping and reshaping of supplier performance. International Journal of Operations & Production Management, 31(8), pp. 888-910.
Talluri, S. & Sarkis, J., 2002. A model for performance monitoring of supplier. International Journal of Production Research, 40(16), pp. 4257-4269.
Töyli, J., Häkkinen, L., Ojala, L. & Naula, T., 2008. Logistics & financial performance: An analysis of 424 Finnish small and medium-sized enterprises. International Journal of Physical Distribution & Logistics Management, 38(1), pp. 57-80.
van der Valk, W. & Rozemeijer, F., 2009. Buying business services: towards a structured service purchasing process. Journal of Services Marketing, 23(1), pp. 3-10.
van Laarhoven, P., Berglund, M. & Peters, M., 2000. Third-party logistics in Europe. International Journal of Physical Distribution & Logistics Management, 30(5), pp. 425-442.
van Veele , A. J., 2005. Purchasing & Supply Chain Management: Analysis, Planning, Strategy and Practice. 4th ed. Croatia: Thomson Learning.
van Weele, A. J., 2010. Purchasing and Supply Chain Management. 5th ed. Hampshire: Cengage Learning EMEA.
Watson, H. J., 2006. Dashboards and Scorecards. Business Intellegence Journal, 11(2), pp. 4-7.
Williams, S. & Williams, N., 2007. The profit impact of business intelligence. 1st ed. San Francisco: Elsevier Inc..
Supplier performance dashboard at Volvo Logistics
114
Volvo Group, 2012. Report on the fourth quarter and full-year 2011, Gothenburg: AB Volvo.
Volvo Logistics Corporation, 2010. P2P & CIC in general, Gothenburg: Volvo Logistics Corporation.
Supplier performance dashboard at Volvo Logistics
115
Appendix 1 – List of interviewees
Position Department
1. Manager Purchasing Strategy & Support
2. Senior Vice President Global Purchasing
3. Strategy Manager Purchasing Strategy & Support
4. Business Process Manager Purchasing Strategy & Support
5. Supplier Development Purchasing Strategy & Support
6. Solutions manager VeSA & generic contract dev. Purchasing Strategy & Support
Describe your department and how it is organized within VLC?
Describe your job?
How do you currently measure the performance of your suppliers? o Which KPIs is included? o With which frequency do you measure these KPIs? o In which unit is these KPIs measured? o In which systems are these KPIs measured? o How is the suppliers identified in these measurements?
PARMA-ID? Other identification?
o How are the suppliers separated if used within different traffic modes?
Do you have performance levels stated for each supplier?
Is the same measurements used globally?
o If not, how are the measurements carried out in different geographical areas?
How is deviations measured and logged?
How is the quality of the measures ensured?
How are problems with a supplier handled within your organization?
o Do you have an escalation ladder involving the purchasing department?
Do you have any other thoughts or ideas regarding a Supplier performance dashboard you
would like to share with us?
Supplier performance dashboard at Volvo Logistics
117
Appendix 3 – Interview with suppliers
List of interviewees One rail supplier
Two sea suppliers
Two road suppliers
Interview guide
Do you currently measure your performance as a supplier towards VLC?
o If yes, which KPIs do you measure?
o Do you share this information with VLC?
Do you measure any other customers, excluding VLC, in a good way you would like to share?
Do you currently measure the performance of your own suppliers?
o If yes, which KPIs do you measure?
o Do you present or visualize these KPIs in any specific way?
Which measurements do you consider most important to perform on towards your
customers?
Which KPIs would you like to be measured upon from your customers?
Do you currently measure your emissions of CO2 and other emissions?
o Do you measure annually or on a more frequent basis?
o If yes, would you consider sharing this information with VLC? Possibly self-report into
the Supplier performance dashboard?
Do you have any other ideas or thoughts regarding a Supplier performance dashboard that
you would like to share with us?
Supplier performance dashboard at Volvo Logistics
118
Appendix 4 – Interview guide for purchasers The purchasers within the Global purchasing department located at the Gothenburg office was asked to rank their five most important measurements when evaluating the performance of a supplier and send the answer back by mail. They were encouraged to consider all possible areas of KPIs; operational, financial and core value related measurements. The purchasers was also asked to state which traffic mode or traffic modes these ranked measurements are relevant for. See table 28 below for the result of this ranking.
Table 28; Ranking of important measurement when evaluating suppliers, according to purchasers within the Global Purchasing department in Gothenburg
MEASUREMENTS SEA ROAD RAIL EMB LOG SERV
OTHER SUM
Price/Cost 1 4 2 1 1 9
Leadtime/Precision 1 6 1 1 9
Financial ranking 1 1 2 1 1 6
Damage free delivery 1 2 1 1 5
Quality 1 1 2 1 5
ISO 14001/9001/SmartWay 1 2 1 4
CSR 1 1 1 3
Future potential 1 1 1 3
Invoice quality 1 1 2
Service, daily contact quality 2 2
Capacity, large versus small supplier 1 1 2
Asset owner 2 2
IT integration level med Volvo/EDI 1 1 2
Reporting quality 1 1
Wagons for loading 1 1
Wagons on service/repair 1 1
Environmental impact 1 1
Brand management aspects 1 1
IT Competence 1 1
Flexibility 1 1
Trust 1 1
Capacity, booked equals confirmed orders 1 1
Geographical location 1 1
Acceptance of SOP 1 1
Supplier performance dashboard at Volvo Logistics
119
Appendix 5 – Summary of measured KPIs Table 29; Summary of all identified metrics measured within all investigated departments at VLC
Possible KPI:s System
(present) System (future)
Identification Global/Regional
Financial ranking External External Supplier group level Regional, Europe
Spend Excel LES? PARMA-ID Global
IB Delivery Precision TIR/FADS/ATLAS ATLAS Lane-level Regional, Europe
IB Pick-up Precision TIR/FADS/ATLAS ATLAS Lane-level Regional, Europe
IB Lead time TIR/FADS/ATLAS ATLAS Lane-level Regional, Europe
IB Deviation Reporting TIR/FADS/ATLAS ATLAS Lane-level Regional, Europe
OB Delivery target fulfillment
A4D A4D Lane-level Global
OB Arrival reporting A4D A4D Lane-level Global
OB Departure reporting A4D A4D Lane-level Global
OB Lead-time A4D A4D Lane-level Global
EMB Delivery precision N/A LES Supplier-level Global
EMB/IB Unloading precision
V-EMS LES PARMA-ID Regional, Europe
ISO 9001 Excel Supplier group level Global
ISO 14001/SmartWay Excel Supplier group level Global
Motor class, average Supplier Survey - Supplier group level Regional, Europe
CO2 emissions, g/ton-km
Supplier Survey - Supplier group level Regional, Europe
Clean Shipping Index Clean Shipping Index
- Supplier group level Global* (Europe based suppliers)
Contingency plan Supplier Survey - Supplier group level Global
CSR Compliance Supplier Survey - Supplier group level Global
Overall Risk Supplier Survey - Supplier group level Global
Transport Quality, number of damages
RMS RMS Supplier group level Global
Transport Quality Audits
RMS RMS Supplier group level Global
Number of parked invoices due to supplier errors, divided by total number of invoices (Invoice quality)
CIC/SAP LES PARMA-ID Regional, Europe
Number of automatically matched CIC lines/total number of CIC lines
CIC/SAP LES PARMA-ID Regional, Europe
Number of overdue invoices/total number of invoices
CIC/SAP LES PARMA-ID Regional, Europe
Number of parked invoices/total number of invoices, defined according to labels
CIC/SAP LES PARMA-ID Regional, Europe
Supplier performance dashboard at Volvo Logistics
120
Appendix 6 – Background information on ATLAS and LES
IT-project ATLAS Within the Inbound GBO there is an ongoing IT-project for a new system support called ATLAS.
Currently three systems are used globally; TIR, FADS and ATLAS. TIR and FADS will eventually be
replaced by ATLAS and in the future ATLAS system, the same KPIs for supplier evaluation will be used
and the same working procedures concerning these issues can be applied globally. The intension is to
have a global system that enables consistency in the measurements regardless of location around
the world, which is hard to achieve with separate systems. The implementation of ATLAS will enable
the inclusion of all operational metrics regarding Inbound into the dashboard.
Some of the new functionalities in ATLAS will be introduced in mid-May, beginning of June in 2012,
but additional functionalities will not be implemented until the end of year 2012. The first roll-out
will cover the European road operations and additional areas will be added in later stages.
IT-project LES An ongoing IT-project called LES affects several departments in relation to the metrics and
measurements recommended for the dashboard. The system developed within the LES project is an
SAP solution that will be used within both the I&CC department as well as the Emballage GBO.
When implementing LES within I&CC instead of today’s system, CIC, this will enable the department
to measure the quality of the supplier’s invoices on a global scale and allows the KPIs of Invoice
Quality and Spend to be automatically fed from the system into the dashboard on a monthly basis.
The LES project also concerns the Emballage GBO and will enable them to measure Delivery precision
of new packaging material, something that their current system of V-EMS is unable to provide.