Page 1
University of Kentucky University of Kentucky
UKnowledge UKnowledge
Theses and Dissertations--Manufacturing Systems Engineering Manufacturing Systems Engineering
2013
SUPPLIER SUSTAINABILITY EVALUATION UTILIZING MULTI SUPPLIER SUSTAINABILITY EVALUATION UTILIZING MULTI
ATTRIBUTE UTILITY MODELING ATTRIBUTE UTILITY MODELING
Scott E. Ladd University of Kentucky, [email protected]
Right click to open a feedback form in a new tab to let us know how this document benefits you. Right click to open a feedback form in a new tab to let us know how this document benefits you.
Recommended Citation Recommended Citation Ladd, Scott E., "SUPPLIER SUSTAINABILITY EVALUATION UTILIZING MULTI ATTRIBUTE UTILITY MODELING" (2013). Theses and Dissertations--Manufacturing Systems Engineering. 4. https://uknowledge.uky.edu/ms_etds/4
This Master's Thesis is brought to you for free and open access by the Manufacturing Systems Engineering at UKnowledge. It has been accepted for inclusion in Theses and Dissertations--Manufacturing Systems Engineering by an authorized administrator of UKnowledge. For more information, please contact [email protected] .
Page 2
STUDENT AGREEMENT: STUDENT AGREEMENT:
I represent that my thesis or dissertation and abstract are my original work. Proper attribution
has been given to all outside sources. I understand that I am solely responsible for obtaining
any needed copyright permissions. I have obtained and attached hereto needed written
permission statements(s) from the owner(s) of each third-party copyrighted matter to be
included in my work, allowing electronic distribution (if such use is not permitted by the fair use
doctrine).
I hereby grant to The University of Kentucky and its agents the non-exclusive license to archive
and make accessible my work in whole or in part in all forms of media, now or hereafter known.
I agree that the document mentioned above may be made available immediately for worldwide
access unless a preapproved embargo applies.
I retain all other ownership rights to the copyright of my work. I also retain the right to use in
future works (such as articles or books) all or part of my work. I understand that I am free to
register the copyright to my work.
REVIEW, APPROVAL AND ACCEPTANCE REVIEW, APPROVAL AND ACCEPTANCE
The document mentioned above has been reviewed and accepted by the student’s advisor, on
behalf of the advisory committee, and by the Director of Graduate Studies (DGS), on behalf of
the program; we verify that this is the final, approved version of the student’s dissertation
including all changes required by the advisory committee. The undersigned agree to abide by
the statements above.
Scott E. Ladd, Student
Dr. Fazleena Badurdeen, Major Professor
Dr. Dusan P. Sekulic, Director of Graduate Studies
Page 3
SUPPLIER SUSTAINABILITY EVALUATION UTILIZING MULTI ATTRIBUTE
UTILITY MODELING
THESIS
A thesis submitted in partial fulfillment of the
requirements for the degree of Master of Science in
Manufacturing Systems Engineering in the College of Engineering
at the University of Kentucky
By
Scott E. Ladd
Lexington, Kentucky
Director: Dr. Fazleena Badurdeen, Associate Professor of Mechanical Engineering
Lexington, Kentucky
2013
Copyright © Scott E. Ladd 2013
Page 4
ABSTRACT OF THESIS
SUPPLIER SUSTAINABILITY EVALUATION UTILIZING MULTI ATTRIBUTE
UTILITY MODELING
Conventionally, the focus during supplier evaluation has been to assess cost,
quality and delivery effectiveness due to their impact on profitability. In recent years,
there has been increased emphasis on promoting more sustainable business practices that
focus on reducing environmental impact and improve societal well-being, in addition to
economic benefits. However, most of the existing supplier evaluation methods in
literature as well as those used by leading companies fall short of comprehensively
assessing suppliers from a Triple Bottom Line (TBL) perspective. TBL defined as
holistically looking at the economic, environmental, and societal aspects of an entity.
This paper presents a review and selection of metrics for economic, environmental and
societal sustainability evaluation. In addition, this work proposes a methodology for
combining the scores into a comprehensive score that can be used to compare two entities
performance relative to the TBL.
KEYWORDS: Sustainability, Supplier Selection, Triple Bottom Line, Multi Attribute
Utility Model, Triple Bottom Line Metrics.
Scott E. Ladd
Student’s Signature
January 30, 2013
Date
Page 5
SUPPLIER SUSTAINABILITY EVALUATION UTILIZING MULTI ATTRIBUTE
UTILITY MODELING
By
Scott E. Ladd
Dr. Fazleena Badurdeen
Director of Thesis
Dr. Dusan P. Sekulic
Director of Graduate Studies
January 30, 2013
Page 6
Dedicated to:
My wife, my family, my friends, and a very special Ranger who inspires me to never, ever
give up.
Page 7
iii
ACKNOWLEDGMENTS
Dr. Fazleena Badurdeen
Dr. I.S. Jawahir
Dr. Bruce Walcott
Dr. Dusan Sekulic
Dr. Thomas Goldsby
Dr. Sarah Wackerbarth
Dr. Michael Kennedy
Dan Seevers
Dan Fusting
Sammie Brooks
Anna Firestone
Rhonda Fabion
Jeannie Staab
Stan Mickey
Mohannad Shuaib
Heather-Michele Adkins
Phi Delta Theta
Case Western Reserve University
McDonald High School
Roosevelt Elementary
Page 8
iv
TABLE OF CONTENTS
ACKNOWLEDGMENTS ................................................................................................. iii
LIST OF TABLES .............................................................................................................. v
LIST OF FIGURES ........................................................................................................... vi
CHAPTER ONE Introduction ........................................................................................... 1
1.1 Supplier Selection ............................................................................................. 1
1.2 Supply Chain Management and the Sustainable Supply Chain ........................ 2
1.3 Impetus for Sustainable Supplier Selection ...................................................... 4
1.4 Reasoning for Sustainable Supplier Selection .................................................. 5
1.5 Problem Statement ............................................................................................ 6
CHAPTER TWO Literature Review ................................................................................. 8
2.1 Supplier Selection Literature Review ............................................................... 8
2.3 Economic Metrics for Supplier Evaluation ..................................................... 12
2.4 Environmental Metrics for Supplier Evaluation ............................................. 14
2.5 Societal Metrics for Supplier Selection .......................................................... 17
2.6 Mathematical Modeling Literature Review .................................................... 21
2.7 Significance of Research and Work Presented ............................................... 22
CHAPTER THREE Methodology ................................................................................... 23
3.1 Importance of Defining Relationship Under Review ..................................... 24
3.2 General Parameters for Metric Selection ........................................................ 25
3.2.1 Economic Metric Selection .......................................................................... 26
3.2.2 Environmental Metric Selection .................................................................. 27
3.2.3 Societal Metric Selection and Process for Selection.................................... 27
3.3 Weighting and Scaling of Metrics .................................................................. 28
3.4 Quality Function Deployment (QFD) ............................................................. 29
3.5 Multi Attribute Utility (MAU) Model ............................................................ 31
CHAPTER FOUR Case Study......................................................................................... 34
4.1 Determining Metrics Used for Case Study ..................................................... 34
4.2 Multi Attribute Utility Modeling for Toyota Case Study ............................... 37
4.2.1 Toyota MAU for 2010 ................................................................................. 37
4.2.2 Toyota MAU for 2011 ................................................................................. 38
4.3 Review and Discussion of Toyota MAU Results ........................................... 40
4.4 Toyota Results with Equal TBL Weighting.................................................... 42
CHAPTER FIVE Conclusions and Future Work ............................................................ 46
References ......................................................................................................................... 48
Vita .................................................................................................................................... 53
Page 9
v
LIST OF TABLES
Table 2.3.1 Sub-Criteria for Supplier Selection (Jain et al., 2009) ...............................13
Table 2.3.2 Financial Ratios Summary (Bryne, 1992) .................................................14
Table 2.4.1 Qualitative Environmental Criteria (Humphreys et al,. 2003) ...................15
Table 2.5 Industry Metric Examples ..........................................................................20
Page 10
vi
LIST OF FIGURES
Figure 1.2 Integrated Approach to SSCM (Badurdeen et al., 2010) .............................3
Figure 2.1.1 MCDM for Supplier Selection (Sonmez, 2006) ..........................................9
Figure 2.1.2 Five Phases of Supplier Selection (Sonmez, 2006) ...................................10
Figure 2.1.3 Supplier Selection Methods (Sonmez, 2006).............................................11
Figure 3 Steps in Supplier Selection Model .............................................................23
Figure 3.2.1 Economic Metrics ......................................................................................26
Figure 3.2.2 Environmental Metrics...............................................................................27
Figure 3.2.3 Societal Metrics .........................................................................................28
Figure 3.4.1 QFD Model for Sustainable Supplier Selection.........................................30
Figure 3.5.1 Category Utility Score ...............................................................................32
Figure 3.5.2 Multi Attribute Utility Model ....................................................................33
Figure 4.1.1 Economic Metrics for Toyota Evaluation ..................................................36
Figure 4.1.2 Environmental Metrics for Toyota Evaluation ..........................................36
Figure 4.1.3 Societal Metrics for Toyota Evaluation .....................................................37
Figure 4.2.1 Toyota’s 2010 Multi Attribute Utility Model ............................................38
Figure 4.2.2 Toyota’s 2011 Multi Attribute Utility Model ............................................39
Figure 4.3.1 Summary of Toyota Case Studies ..............................................................40
Figure 4.4.1 Idealized Model for Toyota’s 2010 Results ...............................................43
Figure 4.4.2 Idealized Model for Toyota’s 2011 Results ...............................................44
Page 11
1
CHAPTER ONE
Introduction
Historically, corporate supplier relationships have been transactional, exchanging goods
or services for a fee – as opposed to being partners the relationship was therefore based
on the economic impact of the collaboration (Dixon, 1966).
As supplier relationships developed, companies have realized the critical nature of these
relationships to the point that many companies refer to their suppliers as partners.
Supplier selection and management of suppliers is recognized as being critical for
companies in maintaining a strategically competitive position (Chen et al., 2006). The
competitive position of good suppliers consists not only of being the source for goods and
services required to generative profit, but also includes the environmental and societal
manner in which these suppliers provides said goods and services. The TBL factors by
which the goods and services are provided “play a vital role for the long term resiliency
of a supply chain” (Seuring et al,. 2008). TBL defined as holistically looking at the
economic, environmental, and societal aspects of an entity. However, the environmental
and societal review still typically occurs after the choice of a supplier has already
occurred and tends to be very qualitative in nature. This review of the environmental and
societal aspects tends to look for compliance to a minimum level of acceptance.
1.1 Supplier Selection
Supplier selection is the process by which a given entity chooses by whom services and /
or items will be supplied. The decision has a direct effect on profitability, as the cost of
an item or service directly affects the cash flow of the company procuring the service. It
is important to note that the financial impact must also be weighed against the risk that is
Page 12
2
inherent in any supplier customer relationship. (Tahrir et al., 2007). Supplier selection
has been a topic of academic research for more than 50 years and is, in essence, decision
making problem. (Huang & Keskar, 2007). The primary focus of initial academic
research in the supplier selection was on optimizing profit while minimizing risk. Huang
and Keskar identified five methods that are used for the optimization: Linear
Programming, Mixed Integer Programming, Goal Programming, Multi-objective
Programming, and Non-linear Programming.
1.2 Supply Chain Management and the Sustainable Supply Chain
Promoting sustainable practices in business operations requires making the entire supply
chain more sustainable. Supply chain management (SCM), the process of managing
internal business practices as well as those across organizational boundaries, has
emphasized generating value for the company’s shareholders with economic value-added
(Lambert, 2008) being the main metric of performance. However, the transition towards
more sustainability-oriented practices requires a shift towards sustainable SCM (SSCM)
practices and use of sustainability value-added to evaluate performance. As such SSCM
has become a topic of significant discussion with increasing research. Most of the
definitions however, do not capture all aspects needed to promote sustainability in the
supply chain. One of the more comprehensive definitions describes SSCM as "the
planning and management of sourcing, procurement, conversion, and logistics involved
during the pre-manufacturing, manufacturing, use, and post-use stages in the life cycle in
closed-loop through multiple life-cycles with seamless information sharing about all
product life-cycle stages between companies by explicitly considering the social and
environmental implications to achieve a shared vision" (Metta & Badurdeen, 2009).
Page 13
3
This comprehensive definition considers the total life-cycle of the product, including the
post-use stage, often disregarded in conventional SCM and most important from a
sustainability perspective. Incorporating the total life-cycle enables considering closed-
loop flow of materials, also important from a sustainability perspective. One approach to
integrate the flow across the life-cycle stages is by applying the 6R's which refer to
Reduce, Reuse, Recycle, Redesign, Remanufacture, and Recover (Jawahir, 2006). By
encompassing the 6R's, companies can better plan for and manage the resources across
life-cycle stages – so that virgin natural resources requirements can be minimized. A
holistic approach to viewing the supply chain through this framework is presented in
Figure 1.2.
Other Manufacturing
Companies
Focal Manufacturing
Company
Tier 3 to
Initial SuppliersTier 3 to
Disposal
Init
ial
Su
pp
lier
s
Tie
r 3
to
n S
up
pli
ers
2
n
n
1
2
1
3
n
1
3
2
n
1
Co
nsu
mer
s/E
nd
-use
rs
Tie
r 3
to
en
d C
ust
om
ers
n
1
2
3
1
2
n
1
n
1
2
Tier 2
Suppliers
Tier 1
Suppliers
Tier 1
Customers
Tier 2
Customers
Tier 3 to
Consumers/
End-users
n
1
2
3
n
2
1
n
1
Tier 1
RLP’s
Tier 2
RLP’s
1
n
Tie
r 3
to
Dis
po
sal
Dis
po
sal
1
Conventional SC focus
Reuse RecoverRecycle RemanufactureRedesign
RLP = Reverse Logistics
Providers
Pre-Manufacturing Manufacturing Post-useUse
Product Life-cycle Stages
Reduce
Figure 1.2 Integrated Approach to SSCM (Badurdeen et al., 2010)
Page 14
4
1.3 Impetus for Sustainable Supplier Selection
Increasingly more consumers and therefore retailers are seeking out products that are
sustainability compliant. As a result, supplier selection and evaluation practices have
evolved beyond this financial and transactional relationship into reviewing the
environmental (Humphreys et al., 2003) and societal (Badurdeen et al., 2010)
ramifications of having a relationship. This trend can be clearly illustrated by Wal-
Mart’s use of Supplier Sustainability Assessments (SSA, Wal-Mart corporate website).
Included in the SSA are fifteen questions divided into four categories, Energy and
Climate (ascertaining a supplier's greenhouse gas emissions and whether or not there is
any effort underway to reduced said emissions), Material Efficiency (packaging and
water waste), Nature and Resources (whether a supplier to Wal-Mart has looked into its
supply chain for regulatory compliance with environmental certifications for production
and products) and People and Community (reviews company's awareness to the societal
impact of a company's supply chain). Though not strictly quantitative in nature, the SSA
signals the retail giant's focus on sustainability and the demands that are likely to be
placed on suppliers.
An example of how companies are being held accountable for the actions of their
suppliers is the incident in which McDonald’s was selling glassware in conjunction with
the release of the movie “Shrek Forever After”. Unknown to McDonald’s, the supplier of
the glassware used cadmium – a toxic metal and likely carcinogen – in the paint used to
decorate the glasses. This was brought to the attention of U.S. Consumer Product Safety
Commission (CPSC) and in addition to the negative publicity, McDonald’s recalled 12
million glasses that were being sold (Mead, 2010).
Page 15
5
In addition to McDonald’s, Apple Incorporated has also received criticism due to the
employee treatment practices of one of the largest suppliers, Foxconn. Although Apple
indicates a preference that employee’s at their suppliers do not work more than 60 hours
per week, a report published by the South China Morning Post in October 2010 showed
that employees at Foxconn are “forced to work double or triple the legal limit on
overtime”. Further evidence of issues with employees is that there were 14 suicide
attempts by employees during the first six months in 2010. The publicity caused by these
incidents contributed to protestors attending the launch of the new I-pad, the new I-
phone, and the annual shareholder’s meeting with signs asking Apple to make “ethical”
devices. These issues caused Apple to take action and require Foxconn to undergo an
independent audit by the Fair Labor Association that was documented by ABC
Television’s Nightline on February 21, 2012. As a result of the Fair Labor Association
audit and the public outcry, on March 29, 2012 after a visit from Apple CEO, Tim Cook,
Foxconn announced it will hire tens of thousands of workers, clamp down on illegal
overtime, improve safety protocols and upgrade worker housing and other amenities,
(ABC News Web-site, accessed May 10, 2012).
1.4 Reasoning for Sustainable Supplier Selection
Given the view of SSCM depicted in Figure 1.3, it is imperative that companies adopt a
more holistic view in selecting suppliers and managing relationships with them. Instead
of the conventional practice of focusing merely on the supplier’s financial capability as
the basis to assess their ability to provide the materials, components or other services, it is
necessary to focus on how the partnership can help or hinder promoting the other goals of
sustainable business practices: environmental protection and societal well-being. This
Page 16
6
means, for example, it is necessary to consider supplier’s practices such as the use of
more energy efficient manufacturing processes, water usage, and recycling of waste. In
terms of societal well-being this means evaluating practices such employee health and
welfare, contributions to local community, and promoting diversity. This research,
therefore, was built upon this existing view of SSCM and evaluating suppliers from that
perspective.
1.5 Problem Statement
Despite the increased emphasis on sustainability considerations (Lamming et al., 1996)
most supplier evaluation methods—those practiced by companies as well as reported in
literature—still have a heavy economic emphasis (Sonmez, 2006). However, if business
practices are to be more sustainable, it is necessary that companies begin evaluating
supply chain partner compliance and improvement across the triple bottom line (TBL) of
economic, environmental protection and societal well-being (Badurdeen et al., 2010).
There have been developments in considering the environmental aspect (Humphreys et
al., 2003) and societal aspects (Ehrgott et al., 2011) of the TBL when addressing supplier
selection; however these methods only address the single aspect under review. The
research and literature is lacking in considering all three aspects of the TBL
simultaneously in a holistic approach.
The objective purpose of this research is to develop a methodology for supplier
sustainability evaluation and combining the three TBL elements for a comprehensive
assessment. The specific goals are: (1) to develop a quantitative supplier sustainability
assessment tool that incorporates the TBL aspects, (2) to ensure the ease of use by
Page 17
7
companies, and (3) to identify and incorporate fairly readily available metrics for supplier
sustainability assessment.
The remaining sections of this thesis provides a review of literature and corporate
practices on supplier selection, (economic, environmental and societal) supplier selection
metrics, and the mathematical modeling process that is developed to evaluate suppliers
for their sustainability performance.
Copyright © Scott E. Ladd 2013
Page 18
8
CHAPTER TWO
Literature Review
In order to assess current practices of supplier evaluation, a selection of both academic
literature and industry practices was reviewed for general content, depth of the content,
and the general approach being taken to supplier assessment. A large body of literature
centered on evaluating suppliers on a financial basis. More recent work relates to
assessing environmental aspects of interactions with a supplier. In a few cases there are
environmental and societal items considered together, but the literature is lacking with
respect a comprehensive approach to all three of the TBL criteria at the supplier level.
There has been work addressing the TBL at the enterprise supply chain level (Badurdeen
et al., 2010), but the literature is still lacking at addressing the relationship with
individual suppliers.
2.1 Supplier Selection Literature Review
In his work “A Review and Critique of Supplier Selection Process and Practices”,
Sonmez (2006) reviewed 147 academic journal articles. In this work the articles were
classified into five categories: decision criteria that should be used, use of decision
making / support techniques and tools, buyer / seller relationships, international supplier
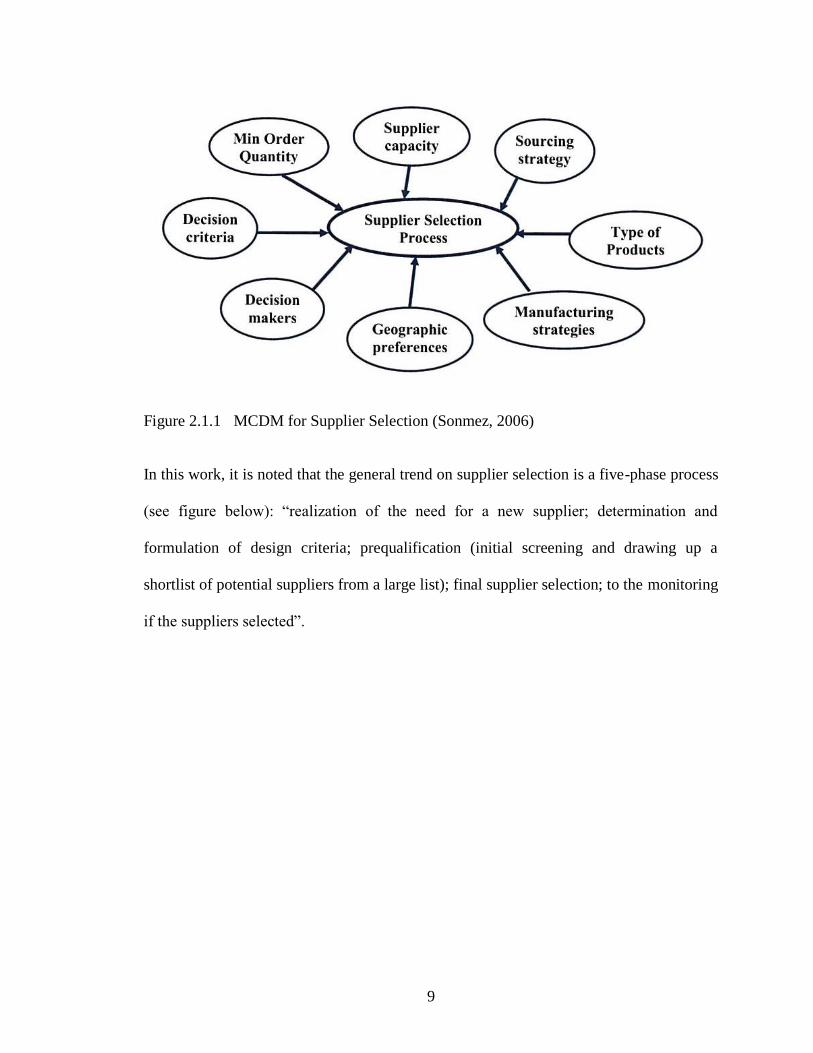
section practices, and e-procurement. It was noted that the evaluation of suppliers is a
multiple criteria decision making (MCDM) problem that can have the complexity of
having both qualitative and quantitative criteria (see figure below).
Page 19
9
Figure 2.1.1 MCDM for Supplier Selection (Sonmez, 2006)
In this work, it is noted that the general trend on supplier selection is a five-phase process
(see figure below): “realization of the need for a new supplier; determination and
formulation of design criteria; prequalification (initial screening and drawing up a
shortlist of potential suppliers from a large list); final supplier selection; to the monitoring
if the suppliers selected”.
Page 20
10
Figure 2.1.2 Five Phases of Supplier Selection (Sonmez, 2006)
Sonmez also categorizes the types of models used in supplier selection literature that was
reviewed and provides a list of the corresponding methods used for each type of category
(see figure below)
Page 21
11
Figure 2.1.3 Supplier Selection Methods (Sonmez, 2006)
Sonmez also noted that supplier selection, like all decision making problems, has two
main tasks: the process of evaluation and assessment and summarizing this information to
allow for the choice to be made.
As in most of the supplier selection literature, Choi and Kim (2008) model a financial
decision model in attempting to provide a method for supplier selection. This work
Page 22
12
classifies the criteria into two major categories: qualitative and quantitative. Choi and
Kim’s work is significant to the research done in the work here, due to the emphasis
placed on the final selection of a supplier being ‘multi-objective’ in nature. The multi-
objectives that are being considered by Choi and Kim’s work are all relative to what can
be called economic criteria, but nonetheless it places significant emphasis on the MCDM
discussed previously.
Zhang (2010) proposes a multi attribute utility (MAU) model approach to selecting
suppliers, but in the work only provides a detailed mathematical method for performing
this evaluation and has no criteria or metrics reviewed or listed.
2.3 Economic Metrics for Supplier Evaluation
Academic literature reviewing the financial impact of supply chain and supplier
relationships tends to be detailed and quantitative in nature (Sonmez, 2006).
A variety of criteria have been used for supplier selection and the most common include
cost, delivery, and product quality (Jain et al., 2007). Jain et al (2007) create six ‘criteria’
for supplier selection which are cost, quality, service, relationship, organization, and
cycle time. Each of the criterion have sub-criteria, metrics. A sampling of the sub-
criteria is outlined in Table 2.3.1. However, Jain proposes no ranking or weighting of the
metrics, they are simply listed.
Page 23
13
Table 2.3.1 Sub-Criteria for Supplier Selection (Jain et al., 2009)
The economic health and fiscal security is crucial for any supplier relationship (Bryne,
1992) as a financially unhealthy supplier can cause significant disruptions in the supply
chain and business in general. Bryne (1992) proposes generating four types of ratios to
access the financial health of a given supplier. These ratios are liquidity ratios, leverage
ratios, activity ratios, and profitability ratios. All of these ratios are defined as coming
from readily available information.
The liquidity ratios measure a company’s ability to meet the immediate financial needs of
the business; and include factors such as salaries, interest on debt, and taxes. Leverage
ratios indicate the extent to which a company’s funds are provided by creditors. These
leverage ratios give an approximation of the financial risk of a company. The activity
ratios show the correlation between sales and assets of a given supplier. It is a way of
Page 24
14
quantifying the revenues generated from its resources. The profitability ratios are a way
of accessing if a company generates enough profit to have long term viability. Table
2.3.2 lists the specific formulas that can be used for each of the ratios.
Table 2.3.2 Financial Ratios Summary (Bryne, 1992)
It is also significant to note that Bryne (1992) stresses the importance of comparing these
ratios to industry specific “standards” and to perform a year to year comparison to
establish a trend line.
Significant work has been done to document and control both the supply chain and
individual supplier relationships (Lambert & Pohlen, 2001), but these works do not
consider the TBL objectives and view the relationships as strictly financial in nature.
2.4 Environmental Metrics for Supplier Evaluation
There have been both academic and professional literature generated which address the
issue of suppliers being required or asked by their customers to become “green”. A
significant piece of relevant academic literature incorporating some TBL aspects into the
supplier selection process is that of Humphreys et al., (2003). Humphreys et al (2003)
Page 25
15
create a decision support system to evaluate suppliers based on a seven environmental
categories separated into two groups, quantitative environmental criteria and qualitative
environmental criteria.
The quantitative environmental criteria include two categories: environmental costs
‘pollutants effects’ and environmental costs ‘improvement’ with five metrics listed for
each category. For environmental costs ‘pollutants effects’ the metrics are: solid waste,
chemical waste, air emission, water waste disposal, and energy, while the five metrics for
environmental costs ‘improvement’ are buying environmental friendly material, buying
new environmentally friendly equipment, redesign of product, staff training, and
recycling.
The qualitative environmental criteria are divided into five categories and these
categories and metrics are detailed in Table 2.4.1.
Table 2.4.1 Qualitative Environmental Criteria (Humphreys et al,. 2003)
From an industry perspective ‘most green supply chain initiatives are the result of
customer requests or government regulation’ (Katz, 2009) and tend to look for
compliance after the decision to have a supplier- customer relationship has already been
determined. This compliance is not insignificant and can be expensive, as it is estimated
Page 26
16
that $3 billion is spent annually by the electronics industry alone to conform to the
European Union regulations (Katz, 2009). Companies such as Toyota (Toyota web-site)
and Wal-Mart (Wal-Mart website) have developed and use some type of “Green Supplier
Guidelines”, but these guidelines look for compliance and tend not to be considered in
conjunction with the other elements of the TBL.
The stated reason for the Toyota’s Green Supplier Guidelines is “thorough compliance
with all applicable laws, regulations, and social norms and consideration for the
environment” (Toyota website, 2009). Toyota’s “Green Supplier Guidelines” have eleven
questions contained within six environmental categories. The six environmental
categories are ISO 14001 certification, substances of concern (e.g., hazardous chemical
use), Eco-VAS (e.g., environmental impact of Toyota’s vehicles), environmental
compliance, reduction of carbon dioxide emissions, and reduction of packaging and
wrapping materials. These requirements are part of an assessment performed on each
supplier and they are monitored on the performance relative to these expectations,
however no indication is given that Toyota considers compliance with this document as a
consideration in determining whether or not to initially choose to have a relationship with
a given supplier or to use the information in choosing between two suppliers.
Wal-Mart’s Sustainability Supplier Assessment consists of four categories with a total of
fifteen questions. The four categories are Energy and Climate, Material Efficiency,
Nature and Resources, and People and Community. The People and Community
category is reviewed in the section 2.5 of this research. The stated goal for each of the
categories is as follows: Energy and Climate – reduce energy costs and greenhouse gases,
Material Efficiency – reduce waste and enhance quality, and Nature and Resources – to
Page 27
17
ensure acquiring high quality, responsibly sourced raw materials. In this document Wal-
Mart acknowledges that the assessment is not comprehensive as it relates to
sustainability, but they do state intentions of rewarding suppliers for addressing the
metrics contained within the assessment. The explanation of the document and the
questions attempt to direct every item towards some type of eventual cost advantage for
both the supplier and Wal-Mart. In other words, Wal-Mart attempts to make the business
case for sustainability.
2.5 Societal Metrics for Supplier Selection
When considering the societal aspects of the TBL, there are few academic resources as
far as it relates to suitable metrics. A significant amount of literature on the societal
sustainability aspects for suppliers comes from the Journal of Business Ethics. This
literature however tends to look at what can be called brand protection, being concerned
with the image portrayed (Amaeshi et al., 2008) or look at the pressures which cause a
company to review its suppliers from a societal point of view (Ehrgott et al., 2011).
According to the work of Ehrgott et al (2011), there are six reasons that companies
choose to be responsible from a societal standpoint in selecting suppliers: intensity of
customer social pressures, intensity of government social pressures, intensity of social
middle management pressure, supplier strategic capabilities, buying firm reputation, and
extent of organizational learning in supplier management.
There has been work which has attempted to quantify some of the societal aspects of
business models (Darby et al., 2006), but the research is broad in nature and does not go
into the metric level. Darby et al (2006) state that there are six “accounts” that need to be
reviewed in evaluating what is called the “social accounting” of a given entity. They are
Page 28
18
a report on performance against stated objectives, an assessment of the impact on the
community, the views of stakeholders on objectives and values, a report on
environmental performance, a report on how equal opportunities are implemented, and a
report on compliance with statutory quality and procedural standards.
The 2002 United Nations Johannesburg Summit – Global Challenge Global Opportunity
provides a framework from which metrics can be derived (Summit, 2002). This
framework accomplishes this by reporting on what The Summit believes to be the most
critical issues facing the future of the planet: population growth, poverty and inequality,
food and agriculture, freshwater, forests, energy, climate change, health as it relates to
water, and health as it relates to air pollution.
The most comprehensive academic literature on societal metrics is contained in a
working paper titled “ESAT: A Framework and Metrics for Corporate Sustainability
Assessment” (Badurdeen et al., 2013). Unlike the previous works discussed in this
section, Badurdeen et al’s work present very detailed metrics and provides computational
methods for calculating a value for each metric while indicating the desired trend for each
metric to improve societal sustainability. The metrics are structured under nine
performance criteria which are anti-corruption/anti-bribery, supplier development and
training practices, employee development and training, customer satisfaction, customer
awareness, compliance and product responsibility, employee well-being, community
development, and diversity and equal opportunity. The paper does not define an
acceptable level for metric score. This is typical when reviewing environmental and
societal metrics, as they tend to be specific to a particular industry or facility.
Page 29
19
From industry standpoint, societal metrics are included in Wal-Mart’s Supplier
Sustainability Assessment. There are many other companies who address the societal
aspects of the TBL, but Wal-Mart’s is significant in that unlike most companies, the
metrics are scored and provide a scale by which the companies can be measured. The
four questions or metrics included in the Wal-Mart Supplier Sustainability Assessment
are do you know the location of 100% of the facilities that produce your products, do you
have a process for managing social compliance at the manufacturing level, do you work
with your supply base to resolve issues found during social compliance evaluations and
also document specific corrections and improvements, and do you invest in community
development activities in the markets you source and/or operate within?
Industry literature (e.g., company websites and CSR reports) were reviewed in the
process of identifying environmental and societal issues being utilized by industry. This
information tended to be very qualitative or binary in nature. More specifically, the
tendency is to look at compliance with standards or membership in industry associations.
An example of one of the common standards adhered to by the consumer electronics
industry is the Electronics Industry Citizenship Coalition (EICC). The company websites
that were included in this review are Toyota Motor Corporation, Apple Inc., and Hewlett-
Packard. In addition, the societal and environmental considerations appear to be part of
reviewing the supplier after a decision has been made to have a relationship. However,
some companies are detailed and specific with regards to their suppliers' environmental
and societal practices. Among the corporate practices reviewed, those of Hewlett-
Packard and Apple were most comprehensive in terms of their coverage of the TBL
aspects. Those of Apple were more specific and quantitative, as Apple goes into great
Page 30
20
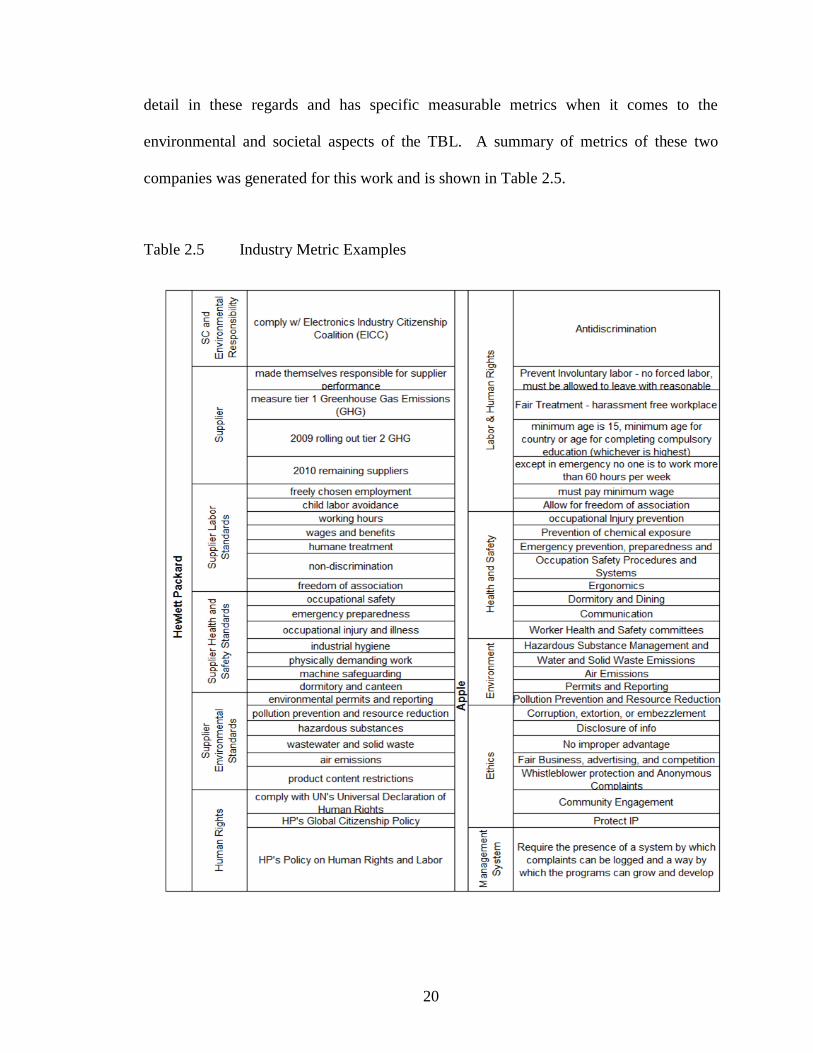
detail in these regards and has specific measurable metrics when it comes to the
environmental and societal aspects of the TBL. A summary of metrics of these two
companies was generated for this work and is shown in Table 2.5.
Table 2.5 Industry Metric Examples
Page 31
21
2.6 Mathematical Modeling Literature Review
Several items were considered and reviewed when evaluating the choice of a
mathematical model for this research. The items considered were ability to weight
metrics and the TBL elements relative to each other, simplicity of use, and the degree of
compatibility with a user-friendly Microsoft Excel tool.
Initially, various mathematical methods of supplier selection were reviewed and
considered (de Boer et al., 2001; Tahriri et al., 2007), including grey-based decision
making (Li et al., 2007), multivariate analysis (Lasch & Janker, 2005), hybrid decision
models (Sevkli et al., 2007; Choi & Kim, 2008), and fuzzy decision making (Chen et al.,
2005). These modeling techniques were eliminated using the three decision criteria
presented in the previous paragraph. However the primary reason for not utilizing the
mathematical methods discussed here is that they required the user of the tool being
created to have to high of a level mathematical modeling. In addition, these tools did not
provide a clear, easy to understand method for weighting the different metrics.
The initial model selected was a modified Quality Function Deployment (QFD). QFD,
first described by Akao (1990), is a means of ensuring quality throughout each stage of
the production process. Although several articles were reviewed: “Extended QFD and
Data-Mining-Based Methods for Supplier Selection in Mass Customization (Ni et al.,
2007), “Modern QFD-Based Requirements Analysis for Enterprise Modelling: Enterprise
–QFD” (Ozdagoglu & Salum, 2009), and “Application of Fuzzy QFD for Enabling
Leanness in a Manufacturing Organisation” (Vinodh & Chintha, 2009), the primary
source for reviewing the QFD process and methodology was the textbook, The
Management and Control of Quality by Evans & Lindsay (,2005).
Page 32
22
Keeping with the three main objectives for selecting a modeling technique further
research was conducted into possible modeling processes. An article by Jie Weiss, David
Weiss, and Ward Edwards titled ‘A descriptive multi-attribute utility model for everyday
decisions’ (Weiss et al., 2010) pointed the research towards using a MAU model to
achieve the desired results as it relates to this research. Two additional articles ‘Multiple
Attribute Group Decision Making’ (Zhang, 2010) and Multi-attribute utility models; a
review of field and field-like studies (Huber, 1974) provided the complete framework for
the mathematical modeling to be used in this research.
2.7 Significance of Research and Work Presented
This research describes a void in the field of Sustainable Supplier Selection and thus
addresses a comprehensive approach or modeling tool that considers all three TBL
elements simultaneously. This work is also unique in that it proposes using the Societal
and Environmental TBL elements as part of the supplier selection process, instead of the
common industry and academic practice of reviewing these two elements after the
supplier selection has been made based of the Financial Element. This research provides
a methodology for the metrics within a TBL element to be weighed against each other,
allowing the user to determine which TBL elements are most important to the user.
This work also provides an easy to use tool that utilizes commonly available software,
Microsoft Excel. The Microsoft Excel Tool allows for the metrics to be prioritized
against each other per the objectives of the entity making the sourcing decision.
Copyright © Scott E. Ladd 2013
Page 33
23
CHAPTER THREE
Methodology
The major steps followed in developing the proposed supplier selection model are shown
in Figure 3 and described in detail in the following sections.
Figure 3 Steps in Supplier Selection Model
Significant thought was placed on selecting metrics to yield a representative result,
because "metrics should always be tied to strategic goals" (Marshall, 2007). The
Brundtland Report published by the United Nations describes the framework for metrics
to be used in reviewing and evaluating sustainability in general. This report makes the
case for sustainability by stating “economics and ecology bind us {the world} in ever-
tightening networks.” These networks are loosely defined as our economic {trade and
production}, our environmental {the resources needed to sustain life} and our society
Page 34
24
{poverty and equality}. These basic tenants can be extrapolated into metrics such as a
company’s profitability, a company’s resource usage, and a company’s treatment of and
concern for its employees (Brundtland, 1987). The 2002 United Nations Johannesburg
Summit yielded specific metrics. Specifically significant to this work was the emphasis
this report placed on energy consumption and water usage (Summit, 2002).
Much of the academic literature concerned with metrics tends to be established at the
product level. One such work considered six metrics: material consumption, energy
consumption, emissions, liquid waste and solid waste (Jiang et al., 2012), but as is the
case with most literature this work considered only the environmental aspect and to a
lesser extent the economic elements or the TBL. Another significant work in this area
proposes a methodology for establishing a product sustainability index for manufactured
parts (Zhang et al., 2012). This does combine all of the TBL elements into an aggregate
score for a given product, but the evaluation is performed at the product level and not the
supplier level. This difference causes many of the metrics to be considered to be
significantly different.
3.1 Importance of Defining Relationship Under Review
Defining the relationship to be evaluated is important because the particular metrics that
must be chosen for TBL evaluation depends on the type of supply chain relationship to be
evaluated. For example, if an original equipment manufacturer (OEM)–contract
manufacturer relationship is being evaluated, the product/component designs are
provided by the OEM with the materials and processes mostly defined. The metrics used
to evaluate TBL performance for such a relationship must then take into account these
factors. On the other hand, if a retailer was evaluating suppliers providing the
Page 35
25
merchandise sold by the retailer, then the factors to be considered and the metrics could
be different. Therefore, it is important to define the nature of the relationship to be
evaluated. Developing a tool to evaluate any generic supplier-manufacturer/retailer
relationship will require including an extensive number of metrics some of which may be
redundant in evaluating certain relationships.
3.2 General Parameters for Metric Selection
A variety of metrics are used by companies to assess supplier performance. In selecting a
representative sample of metrics for supplier sustainable performance assessment, a
number of factors must be considered: relevance in the context of supplier’s business
(industry and size of business); availability of data required or ease of computing from
information provided; limited number of metrics for practicality of use. The metrics
presented in the following sections were selected with these factors in mind.
It is important to understand the context of the supplier’s business, because different
industries have different challenges and goals. For example, due to regulations and other
factors such as public opinion, automotive companies have a need to monitor carbon
dioxide emissions. While an injection molding company would be more concerned with
what percentage of its incoming raw plastic ends up being discarded to a landfill during
the manufacturing process.
The ease of obtaining the data is significant as the ideal situation would be for the
supplier evaluation process to generate as little disruption as possible to the parties
involved with the evaluation and to not create additional effort.
Page 36
26
Limiting the number of metrics serves several purposes. First, it causes the entity using
the tool to carefully consider the metrics which are most important for their evaluation.
Limiting the metrics also provides for a clearer differentiation in the weighting of the
metrics. The limiting of the metrics has the added benefit of not overwhelming either
entity in the evaluation.
3.2.1 Economic Metric Selection
The primary drivers in selecting the economic metrics were to gain insight into (1) the
current financial strength of the company being reviewed and (2) on the potential for
future growth and success. Metrics selected to evaluate economic performance in the
context of the relationship of focus. The economic metrics used and the formulas to
derive each of them are outlined in Figure 3.2.1 below.
Figure 3.2.1 Economic Metrics
Page 37
27
3.2.2 Environmental Metric Selection
The environmental metrics were selected to gain an insight into the current environmental
impact of a given supplier, while attempting to ascertain if the company under review is
attempting to improve their impact on the environment. The environmental metrics were
also selected so that they would be quantifiable and not binary in nature, and the data
required was either already available or relatively easy to obtain. The environmental
metrics chosen and the formula to derive each of them is outlined in Figure 3.2.2.
Figure 3.2.2 Environmental Metrics
3.2.3 Societal Metric Selection and Process for Selection
The societal metrics were defined to characterize how the company behaves with respect
to the treatment of their employees and community in which they are located. It is also
significant to note that societal evaluations tend to be challenging in nature, as companies
Page 38
28
tend to be either reluctant to provide sensitive information or fail to track the information
being reviewed. The metrics chosen for this work are listed in Figure 3.2.3.
Figure 3.2.3 Societal Metrics
3.3 Weighting and Scaling of Metrics
Each metric is assigned a weight by the user of the tool. The weight for each set of
metrics (Environmental, Economic, and Societal) must sum to one. The totaling of the
weights to a total of one is a conventional needed for the MAU Model which is explained
in section 3.5 of this paper. The weighting is significant as it allows the user to rank
order the importance of each metric being reviewed relative to the other metrics in the
same TBL element and due to the nature of the MAU Model effect the Overall Score of a
company being reviewed. The weighting of the metrics also allows for the tool to have
additional flexibility for use in different industries, as the relative importance of metrics
may vary widely depending on the particular industry or supplier under review.
Page 39
29
In addition to assigning a weight to the metrics, each metric must also be scaled or have a
range established by which the entity or entities under review can be evaluated. Scaling
of the metrics can be very difficult, as the entity being evaluated might be measured with
different scales. An example of this would be that there would be different scales for
carbon dioxide emissions if two power plants were being scored versus scoring two
plastic part suppliers. The scales must be adjusted to show significant differentiation
between the two entities being scored. In addition, for the purposes of the model being
used, a multi attribute utility model, the utility score for each metric derived from the
scaling needs to either be 0, 25, 50, 75, or 100.
3.4 Quality Function Deployment (QFD)
The initial model used was a QFD. The figure below provides a view of the model that
was attempted using a QFD. Ultimately, the QFD method was abandoned. Although it
could accomplish the desired output, the requirements placed on the user of the Microsoft
Excel Tool was too cumbersome. It required the same data to be entered in several
different places, which in addition to being cumbersome also introduced more
opportunity for error during the data entry. In addition, output was unclear – requiring
too much subjective interpretation by the end-user.
QFD was considered due to the models ability to weight various items against each other.
QFD also lends itself to being utilized as a Microsoft Tool, although the tool turned out to
be cumbersome for the reason outlined in the previous paragraph.
Page 40
30
Figure 3.4.1 QFD Model for Sustainable Supplier Selection
Page 41
31
3.5 Multi Attribute Utility (MAU) Model
Several mathematical methods and models were reviewed as noted in section 2.7 of this
paper. After the attempt to use QFD detailed in section 3.5 of this work, the method
chosen was a MAU Model. The MAU Model was selected due to three major factors: (1)
the MAU allows for weighting and scaling of metrics, (2) it provides a score for each
TBL element, and (3) it allows for a MAU to be embedded in a MAU, so that not only
can the individual metrics being weighted against each other within a given TBL element,
the TBL elements can be weighed against each other when the Supplier Sustainability
Rating is calculated.
The MAU is constructed so that once the scaling and scoring of the individual metrics is
complete, as explained in section 3.4, the metrics are then placed into a multi attribute
utility model for a given TBL element. Each metric has two values assigned the weight
{W1,…W5} and the utility score {US1,…US5}. Each metrics’ weight and utility score
are multiplied together and then added to the other metrics’ weight and utility score
multiplication within a TBL element to generate the Category Utility Score. The weight
of each element reflects its relative importance and is dependent on the priorities of the
organization comparing the suppliers. The weight is distributed among the five metrics
but must sum to one. For example, metric 1 and 2 can have weights of .2, metrics 3 and 4
can have weights of .1, requiring metric 5 to have a weight of .4.
For each TBL element a “Category Utility Score” is by combining the two values for
each metric within the TBL element with the equation ∑15 (Wx*Ux). This calculation and
generic format is illustrated in Figure 3.5.1below.
Page 42
32
Figure 3.5.1 Category Utility Score
The “Category Utility Score” for each TBL element then acts as the Utility Score for the
multi attribute utility model that determines the overall utility score for the supplier being
evaluated. The TBL element is then weighted with an overall element weight. In this
work, it has been determined that the economic element is weighted at .6, the
environmental element is weighted at .25 and the societal element is weighted at .15.
These numbers are then combined as they were to determine the individual element score
to determine the Supplier Sustainability Rating (SSR).
The generic MAU model created for this research is depicted in the Figure 3.5.2.
Page 43
33
Figure 3.5.2 Multi Attribute Utility Model
Copyright © Scott E. Ladd 2013
Page 44
34
CHAPTER FOUR
Case Study
The methodology detailed above was utilized to conduct a review of Toyota Motor
Company by comparing Toyota’s performance against itself on year to year basis for the
fiscal years of 2010 and 2011 utilizing data obtained from Toyota’s Annual Report,
Environmental Report, and the Relations with Employees Website.
Comparing a company’s performance against itself is not the intended use of the
methodology and tool developed in the work. The case study was performed in this
manner primarily due to the difficulty in obtaining the data required for two separate
entities by an impartial observer. This difficulty can be overcome if a customer was
trying to obtain this information from potential suppliers, as the suppliers under
consideration would be motivated to provide the information requested by a potential
customer.
Although it is not the intention of this work, comparing Toyota to itself on a year on year
basis validates this work as it allows two entities, “2010 Toyota” versus “2011 Toyota” to
be compared for the three TBL elements using the same metrics.
4.1 Determining Metrics Used for Case Study
The metrics justified in the methodology section were not available in the sources used to
obtain data for this case study. Thus, following the main criteria discussed for selecting
metrics detailed in Section 3.3 of this work a slightly different set of metrics were chosen
for this study. However the metrics conform to the criteria outlined in the methodology.
One of those criteria being the data should be readily available.
Page 45
35
In addition to conforming to the criteria outlined above, choosing metrics from the
various reports published by Toyota Annual Report (Toyota website), Environmental
Report, and the Relations with Employees Website, provided insight into what is
important to Toyota as an organization.
It is important to note that there are metrics that are specifically derived from Toyota’s
North American Operations, while other metrics use data from Toyota as an entire
corporation. The financial metrics are based on the entire corporation as the entire
corporation’s financial health is an important factor in determining whether or not to have
or continue with Toyota as a supplier. The environmental and societal aspects of the
TBL are more regionalized as they are, by their nature, governed by local legal and
cultural norms.
Based on the criteria outlined in section 3.3 of this work, the metrics selected for
comparing Toyota’s 2010 performance against Toyota’s 2011 performance are illustrated
in the Figures 4.1.1, 4.1.2, & 4.1.3.
Page 46
36
Figure 4.1.1 Economic Metrics for Toyota Evaluation
Figure 4.1.2 Environmental Metrics for Toyota Evaluation
Page 47
37
Figure 4.1.3 Societal Metrics for Toyota Evaluation
4.2 Multi Attribute Utility Modeling for Toyota Case Study
The MAU model utilizes the framework outlined in the methodology section of this
work, but uses the metrics described above to perform the sustainability evaluation of
Toyota as a supplier.
4.2.1 Toyota MAU for 2010
The MAU for the evaluation of the 2010 performance of Toyota is in figure 4.2.1.
Page 48
38
Figure 4.2.1 Toyota’s 2010 Multi Attribute Utility Model
4.2.2 Toyota MAU for 2011
The MAU model for the evaluation of 2011 performance of Toyota is in figure 4.2.2.
Page 49
39
Figure 4.2.2 Toyota’s 2011 Multi Attribute Utility Model
Page 50
40
4.3 Review and Discussion of Toyota MAU Results
Figure 4.3.1 Summary of Toyota Case Studies
As can be observed from Figure 4.3.1 Toyota’s Economic Category Utility Score was
reduced from 62.5 in 2010 to 55 in 2011. As reported in Toyota’s Annual Report, 2011
was indeed a challenging year for the company from a financial standpoint as production
output was significantly affected by the “Great East Japan Earthquake”. Therefore, it can
be inferred that the financial portion of the model effectively represents reality. This
finding is important as the financial performance is typically the easiest to evaluate, due
to the nature of the metrics. Furthermore it adds validity to the evaluation of the
environmental and societal TBL elements, as discussed below.
There was an improvement in the Environmental Category Utility Score for Toyota from
35 in 2010 to 45 in 2011, with the major contributor to the improvement being that less
Page 51
41
“carbon-dioxide was produced per vehicle produced”. Due to the weight of this metric,
the overall environmental score improved despite two other environmental metrics
reducing on a year to year comparison. This finding underscores the importance of the
weighting assigned to a given metric.
Although the Societal Category Utility Score remained relatively flat – 67.5 in 2010 and
65 in 2011, several metrics scored differently. The total score remaining relatively
unchanged was largely due to the most heavily weighted metric, Industrial Accident
Frequency, remaining unchanged on a year to year basis.
As can be observed, even though the Environmental Category Utility Score was 10 points
higher in 2011 and the Societal Category Utility Score changed by 2.5, the overall Utility
Score was better in 2010. This finding is due to the Supplier Sustainability Rating of the
Economic Category Utility Score being higher at .6, compared to the Environmental
Category Utility Score being having a Supplier Sustainability Rating of .25 and the
Societal Category Utility Score being having a Supplier Sustainability Rating of .15.
The methodology used was able to successfully evaluate the entities being reviewed,
while the tool provided results that concur with Toyota’s own assessment of the two
years in question. Per Toyota’s Annual report 2011 is recognized as a difficult year for
the company.
A significant finding in performing the case study was the need to identify and highlight
the Category Utility Score for each TBL element in addition to providing the Utility
Score for the entity under evaluation. This finding is significant due to the fact that
Page 52
42
although the Category Utility Score can change significantly, the Utility Score may not
change due to the weighting of each TBL element.
4.4 Toyota Results with Equal TBL Weighting
This section of the Case Study is a review of the data from the Case Studies that
“idealizes” the weighting of the TBL Elements by assigning them equal weight.
Figure 4.4.1 shows the results when applying equal weight to the TBL to the Toyota 2010
results presented earlier in this section:
Page 53
43
Figure 4.4.1 Idealized Model for Toyota’s 2010 Results
Figure 4.4.2 shows the results when applying equal weight to the TBL to the Toyota 2010
results presented earlier in this section:
Page 54
44
Figure 4.4.2 Idealized Model for Toyota’s 2011 Results
Page 55
45
Equalizing the weights yielded results that for the Supplier Sustainability Rating that the
performance was the same. The non-idealized data showed that 2010 was a better
performer than 2011. This was primarily due to a much better economic performance in
2010. When weighted equally, the environmental improvements in 2011 was able to off-
set the financial issues seen by Toyota during 2011.
Copyright © Scott E. Ladd 2013
Page 56
46
CHAPTER FIVE
Conclusions and Future Work
The methodology and case study were presented in the previous sections of this research.
This section is intended to present conclusions and future research opportunities.
In this research, the issue of generating a method by which all aspects of a supplier’s (or
business entity in general) TBL can be evaluated concurrently and comprehensively was
solved by a MAU model. In addition to providing metrics and scaling, a framework for
altering both the metrics and scaling was explained.
The research was motivated by the lack of a comprehensive method for evaluating the
TBL, as most methods address only one or two of the TBL elements. However the
typical industry practice is for an entity to choose the supplier based on an economic
relationship and after the relationship is solidified an inspection of the environmental and
societal TBL elements is undertaken to ensure conformance.
Overall the research demonstrates a methodology and a tool by which entities can be
compared to each other to create a rank order score.
Although the research presented here is intended to evaluate potential or current suppliers
in similar, if not the same, industry relative to each other; the case study conducted
compared Toyota’s 2010 & 2011 performance. This case study was sufficient to prove
out the tool and research, as it was able to compare two entities in similar if not the same
industries and show differentiation between them. The ideal case study would have been
to compare two suppliers in similar industries, but from an academic standpoint it is
unrealistic to expect two entities to reveal the data required for an academic exercise. It
Page 57
47
is however, very realistic to expect suppliers to supply the data required to current or
potential customers.
The largest hole that the Toyota study leaves versus a case study of two separate, but
similar companies is that of vetting the metrics to be used. From an academic standpoint,
it is assumed that if two companies would submit to taking part in the case study they
would only be willingly to reveal public data and this data may be different between the
two companies being reviewed. This would cause additional work in establishing the
metrics.
The true purpose of a case would be for a company to use the tool created in this research
to evaluate potential or current suppliers. Not having this company allowed for the
metrics to be established via relativity arbitrary “values” of the author’s research. An
example of this would be if a company is a not for profit entity, it my look at its
supplier’s through a much different lens than a company that is for profit.
The overall Supplier Sustainability Rating given to each entity provides a relative score
that can be used to compare similar entities. What is inferred by similar is that the
entities being reviewed or compared are in similar, if not the same, industry. The metrics
presented in the methodology section of this research were developed as idealized metrics
conforming to the parameters for metric selection and scaling outlined there, while the
metrics in the case study section of this research were altered to allow for the evaluation
of Toyota. Future work can be conducted to develop metrics for specific industries or
businesses.
Copyright © Scott E. Ladd 2013
Page 58
48
References
ABC Television’s Nightline on February 21, 2012
ABC News Website, abcnews.go.com, ‘Apple to Help Pay Costs of Improving Foxconn
Factories, accessed May 10, 2012
Akao, Y, 1990, ’Quality Function Deployment (QFD). Integrating customer requirements
into product design’, Cambridge, Massachusetts, Norwalk, Connecticut.
Apple Inc., www.apple.com, accessed January 3, 2010
Amaeshi, K., Osuji, O., and Nnodim, P., 2008, ‘Corporate Social Responsibility in
Supply Chains of Global Brands: A Boundaryless Responsibility? Clarification,
Exceptions and Implications’, Journal of Business Ethics, (81): 223-234
Badurdeen, F., Iyengar, D., Goldsby, T. J., Metta, H., Gupta, S., & Jawahir, I. S. (2010).
Extending total life-cycle thinking to sustainable supply chain design.
International Journal of Product Lifecycle Management, 4(1), 49-67.
Badurdeen, F., Goldsby, T.J., Metta, H., and Jawahir, I.S., 2013, ’ESAT: A Framework
and Metrics for Corporate Sustainability Assessment’ , Unpublished Manuscript
Brundtland, G. H., & World Commission on Environment and Development. (1987), Our
Common Future, (Vol. 383). Oxford: Oxford University Press.
Byrne, P., 1992,‘Selecting Financially Healthy Suppliers’, Transportation & Distribution,
(33) (1), 21-23
Chen, C., Lin, C., and Huang, S., 2006, ‘A Fuzzy Approach for Supplier Evaluation and
Selection in Supply Chain Management’, International Journal of Production
Economics (102): 289-301
Choi, J., and Kim, J., 2008, ‘A Hybrid Decision Support Model for Selecting Highly
Qualified Suppliers’, The Journal of Computer Information Systems, Fall 2008;
(49): 90-100
Darby, L. and Jenkins, H., 2006, ‘Applying Sustainability Indicators to the Social
Enterprise Business Model: The Development and Application of an Indicator
Page 59
49
Set for Newport Wastesavers, Wales’, International Journal of Social Economics
(33), 5/6 (2006): 411-431
de Boer, L., Labro, E., and Morlacchi., P, 2001, ‘A Review of Methods Supporting
Supplier Selection’, European Journal of Purchasing & Supply Management (7):
75-89
Dixon, G.W., 1966, ‘An analysis of supplier selection systems and decisions’, Journal of
Purchasing, 2 (1), 28-41
Ehrgott, M., Reimann, F., Kaufmann. L., Carter, C., 2011, ‘Social Sustainability in
Selecting Emerging Economy Suppliers’, Journal of Business Ethics (98): 99-119
Evan, J., and Lindsay, W., 2006, The Management and Control of Quality, Sixth Edition,
Southwestern College Pub, New York
Ford Motor Company, www.ford.com, accessed January 10, 2010
Hewlett Packard, www.hp.com, accessed December 19, 2009
Huang, S., and Keskar, H., ‘Comprehensive and configurable metrics for supplier
selection’, Internation Journal of Production Economics 105 (2007) 510-523
Humphreys, P., Wong, Y., Chan, F., 2003 ‘Integrating environmental criteria into the
supplier selection process’, Journal of Materials Processing Technology, (138),
349-356.
Jain, V., Wadhwa, S., Deshmukh, S., 2009, ‘Select supplier-related issues in modeling a
dynamic supply chain: potential, challenges, and direction for future work’,
International Journal of Production Research, 47 (11), 1 June 2009, 3013-3039
Jaing, Z., Zhang, H., and Sutherland, J., 2012, ‘Development of an Environmental
Performance Assessment Method for Manufacturing Process Plans’, International
Journal Advance Manufacturing Technology, (58): 783-790
Jawahir, I.S., P.C. Wanigarathne and X. Wang, “Chapter 12: Product Design and
Manufacturing Processes for Sustainability”, Mechanical Engineering Handbook,
3 rd Edition, Vol. 3, Manufacturing and Management, John Wiley & Sons,
October 2005, pp. 414-443.
Page 60
50
Katz, J., 2009, ‘The Green Ultimatum’, www.industryweek.com, September 2009, 22-24
Lambert, D., and Pohlen, T., 2001, ‘Supply Chain Metrics’, International Journal of
Logistics Management, 2001; 12 ,1
Lambert, D.M. 2008, ‘Supply Chain Management: Processes, Partnerships,
Performance’, 3rd edition, Supply Chain Management Institute: Sarasota, FL.
Lamming, R., and Hampson, J., 1996, ‘The environment as a supply chain issue’, British
Journal of Management, (7) 1, 45-62.
Lasch, R. and Janker, C., 2005, ‘Supplier Selection and Controlling Using Multivariate
Analysis’, International Journal of Physical Distribution & Logistic Management,
(35): 409-425
Li, G., Yamaguchi, D., and Nagai, M., 2006, ‘A Grey-Based Decision-Making Approach
to Supplier Selection Problem’, Mathematical and Computer Modelling, (46):
573-581
Marshall, R., 2007, ‘Supply Chain Management: Analyzing Industry and Air Force
Metrics’, Air Force, Journal of Logistics, Volume XXXI, Number 3
Mead, M. N. 2010, ‘Cadmium confusion: do consumers need protection?’ Environmental
Health Perspectives, 118(12), A528.
Metta, H., Badurdeen, F., 2009, A framework for coordinated sustainable product and
supply chain design, Proceedings of the 2nd International Conference on Value
Chain Sustainability (ICOVACS), October 19-21, 2009, Louisville, KY, pp. 20-
25.
Ni, M., Xu, X., and Deng, S., 2007, ‘Extended QFD and Data-Mining-Based Methods for
Supplier Selection in Mass Customization’, International Journal of Computer
Integrated Manufacturing, (20): 280-291
Ozdagoglu, G., and Salum, L., 2009, ‘Modern QFD-Based Requirements Analysis for
Enterprise Modelling: Enterprise-QFD’, International Journal of Computer
Integrated Manufacturing, (22): 1102-1127
Page 61
51
Sevkli, M., Koh, S.C., Zaim, S., Demirbag, M., and Tatoglu, E., 2007, ‘Hybrid Analytical
Hierarchy Process Model for Supplier Selection’, Industrial Management & Data
Systems (108): 122-142
Seuring, S. Muller, M., 2008 “From a literature review to a conceptual framework for
sustainable supply chain management,’ Journal of Cleaner Production, (16) 15,
1699-1710
Sonmez, M., 2006, ‘A Review and Critique of Supplier Selection Process and Practices’,
Business School of Loughborough University, Occasional Paper Series, 2006, Vol
1
South China Morning Post, www.scmp.com accessed October, 11, 2010
Starbucks, www.starbucks.com, accessed April 2, 2012
Summit, Johannesburg. "World summit on sustainable development."
www.JohannesburgSummit.org. (2002).
Tahriri, F., Osman, M., Ali, A, and Yusuff, R., ‘A Review of Supplier Selection Methods
in Manufacturing Industries’, 2007, Suranaree Journal of Science & Technology,
15(3): 201-208
Toyota Motor Company, www.toyotosupplier.com, accessed October 23, 2009
Toyota Relations with Employees, www.toyota-global.com, accessed February 15, 2012
Toyota 2011 North America Environmental Report, www.toyota.com, accessed
February 15, 2012
Vinodh, S., and Chintha, S., 2011, ‘Application of Fuzzy QFD for Enabling Leanness in
a Manufacturing Organisation’, International Journal of Production Research,
49(6): 1627-1644
Wal-mart Incorporated, www.walmart.com, accessed May 1, 2012
Yahoo website, www.yahoo.com accessed April 1, 2012
Zhang, X., Lu, T., Shuaib, M., Rotella, G., Huang, A., Feng, S.C., Rouch, K., Badurdeen,
F., Jawahir, I.S., 2012, ‘A Metrics-Based Methodology for Establishing Product
Page 62
52
Sustainability Index (ProdSI) for Manufactured Products’, 19th CIRP International
Conference on Life Cycle Engineering, Berkeley, 2012
Zhang, Z., 2010, ‘An Approach to Multiple Attribute Decision Making for Supplier
Selection’, Proceeding of the 2010 International Conference on Advanced
Management Science
Page 63
53
Vita
Place of Birth Warren, Ohio
Educational Background
Year Degree Institution
1995 BS in Engineering Case Western Reserve University
Professional Positions Held
Year Employer Title
2012 Lexmark International Senior - Component Engineering
Team Lead
2006 Lexmark International Component Engineering Team Lead
2005 Lexmark International Manufacturing Engineer
2004 Delphi - Packard Electric Senior Plant Tool Engineer
2000 Delphi – Packard Electric Plant Tool Engineer
1999 The Kirby Company Tooling Engineer
1998 Eaton Corporation Product Engineer I
1997 Eaton Corporation Product Engineer II
1996 Rubbermaid Incorporated Product Engineer
1996 Rubbermaid Incorporated Associate Product Engineer
1995 Rubbermaid Incorporated Design Engineer
Scholastic and professional honors
Scott E. Ladd
Signature
Year Honors Institution
2000 U.S Patent 6,142,654 Eaton Corporation


![Supplier Sustainability Guidelines and Expectationssuppliers.safeway.com/docs/supplier_sustainability...Supplier Sustainability Expectations [7] 2/18/2020 Where feasible and applicable](https://static.documents.pub/doc/80x56/5f3f28a287ed1c305f46070b/supplier-sustainability-guidelines-and-e-supplier-sustainability-expectations.jpg)