IEEJ: October 2008 Supply and Demand Analysis on Petroleum Products and Crude Oils for Asia and the World April 2008 Harumi HIRAI Yuhji MATSUO Hiroshi UNO Yu NAGATOMI The Energy Data and Modelling Center (EDMC) The Institute of Energy Economics, Japan (IEEJ)
Transcript
IEEJ: October 2008
Supply and Demand Analysis on Petroleum Products and Crude Oils
for Asia and the World
April 2008
Harumi HIRAI
Yuhji MATSUO
Hiroshi UNO
Yu NAGATOMI
The Energy Data and Modelling Center (EDMC)
The Institute of Energy Economics, Japan (IEEJ)
IEEJ: October 2008
2
SUMMARY
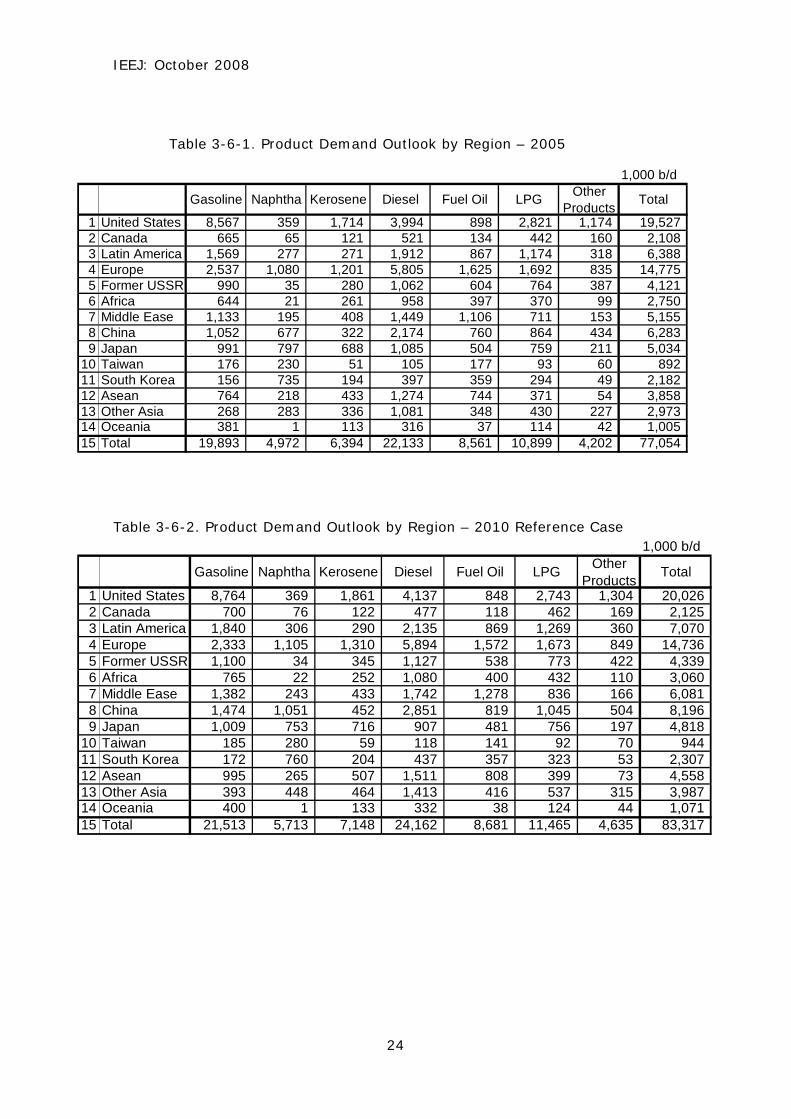
1. Supply-Demand Balance in Various Regions in 2010 and 2015
(1) China
Refining capacity expansion projects will be carried out almost as planned to
increase refining capacity (crude distillation units) to 9 million B/D by 2010 and 11
million B/D by 2015, and this nation will become a net exporter of gasoline and a
minor net importer of medium distillates, thus allowing the nation to practically
maintain its self-sufficiency rate.
(2) India
Refining capacity is expected to reach a total of 4.00 million B/D by 2010, which
is broken down into 1.50 million B/D for the private companies and 2.50 million
B/D for state-owned companies. India’s export capacity (excluding exports to the
South Asian region) is almost equivalent to private companies’ refining capacity
and comes to approximately 1 million B/D as equivalent to the amount of
gasoline/middle distillate production.
(3) Middle East
Refining capacity of this region is predicted to reach approximately 8.30 million
B/D by 2010 and approximately 10.40 million B/D by 2015. As the regional
demand is expected to grow at a higher rate, Iran and Iraq will be confronted by
a refining capacity shortage and imports of petroleum products, chiefly gasoline,
from outside the region will continue. Making progress in a now delayed project to
construct a new oil refinery in Saudi Arabia is the key to success in expanding the
region’s supplies and enhancing its product exporting capability.
(4) The United States
Demand for petroleum products will continue increasing, resulting in a shortage of
refining capacity. In “Reference case,” the nation’s imports of gasoline in 2010
and 2015 are expected to reach approximately 1.90 million B/D, about half of
which is accounted for by petroleum products.
(5) Europe
Between 2005 and 2015, gasoline demand will decrease while gas oil demand will
increase slightly, so the supply-demand balance consisting of gasoline exports
IEEJ: October 2008
3
and middle distillate imports will continue.
(6) East Asia (Excluding China) Competing with South Asia
Exports from the East Asian region (excluding China) are mainly oriented towards
China, Southeast Asia, Oceania and North America (the west coast), while exports
from South Asia and the Middle East are mainly towards Europe, Africa, and
Oceania. So there will be no market competition between the two regions, except
for Oceania.
(7) East Asia (Excluding China)
Japan, South Korea and Taiwan will compete with one another because their
markets overlap each other. In regard to Japan’s exports, it may be interesting to
note that in the “Reference case” that assumes a steady increase in world demand
and a strained supply-demand, Japan will be able to export 0.59 million B/D of
gasoline and middle distillate in 2010 and 0.77 million B/D in 2015. This
represents approximately 16% of the present CDU capacity (or 20% in crude oil
equivalent).
(8) Competition between South Asia and the Middle East
South Asia, which is ahead of other regions in the buildup of refining capacity, will
prevail in exports to the European and American markets during the period from
2010 to 2015. However, if export-oriented oil refineries come on line from 2012
onward as planned in the Middle East region, there will be intensifying competition
between South Asia and the Middle East for exports to the European and American
markets.
2. Conclusions
In summary the results of optimization in the world oil refining and trade model,
we have arrived at the following conclusions, focusing particularly on Japan.
(1) Japan’s Surplus Refining Capacity and Export Capacity
If steady growth in the petroleum product demand in the world results in a
tightening supply (Reference case), a look at Japan’s refining capacity
(approximately 4.80 million B/D) shows that approximately 20% of Japan’s
surplus refining capacity (or 16% on the gasoline and middle distillate basis) will
be used fully – mainly for exports of high-quality (very low sulfur-content)
petroleum products.
IEEJ: October 2008
4
(2) Main Export Markets
Jet fuel, gas oil and other middle distillates will be exported mainly to the Asian
region (China, ASEAN nations and Australia) while gasoline will be exported
mainly to the west coast of the United States and the Australian region.
(3) Inter-Regional and Intra-Regional Competition
Regarding inter-regional competition, there will be no competition between South
Asia / the Middle East, which export their products mainly to the European and
African markets, and East Asia, which targets the Pacific region (including Japan,
South Korea and Taiwan but excluding China), with the exception of Australia.
However, analysis of the relations among three countries in the East Asian region
– namely, Japan, South Korea, and Taiwan – shows that since Japan’s export
market overlaps with those of South Korea and Taiwan with slow growth in
domestic demand and large surplus supply capacity, keener competition among
these countries is most likely to occur in the years ahead.
3. Challenges Ahead
The above conclusions need to take the following constraints into account and
may have to be analyzed and assessed more elaborately and accurately.
(1) Exports of Gasoline and Gas Oil from Japan, South Korea and Taiwan to the
United States
(a) In the LP model, assumptions are concerned solely with refining capacity
and quality standards but do not incorporate an assessment of logistics. As a
result, the model tends to assume that Japan’s utilization rate will increase to a
level higher than the actual levels, resulting in excessive exports.
(b) Because the United States is assumed to be a single market (of uniform
quality), standards (olefin content, vapor pressure, aroma content, etc.) for
gasoline on the west coast of the United States, particularly gasoline in
California (CARBOB), are not accounted for. Japan’s standard gasoline, which
comprises mainly FCC gasoline, is far from meeting the standards. In actuality,
therefore, blending materials such as alkylate must be changed. Accordingly,
the results of LP estimation tend to assume that exports are larger than actual
levels.
(2) Treatment of Export-oriented Oil Refineries in South Asia and the Middle East
IEEJ: October 2008
5
region
(a) Export-oriented oil refineries in India in South Asia are assumed to be
intended solely for exports, but the oil refineries to be constructed (in 2012) in
the Middle East region are not assumed to be dedicated to exports.
(b) As a result, where exports to the European and American regions actually
occur, intra-regional (to Iran and Iraq, etc.) supply is assumed to occur by
priority. Exports to Europe and the United States from the Middle East region
are underestimated as a result.
IEEJ: October 2008
6
Chapter 1: Overview of the study
1.1 Objectives of the Study
1.1.1 Petroleum Product Supply and Demand
Oil demand from Asia-Pacific nations, centering on China and India, with both
countries achieving remarkable economic growth, has been growing steadily and
in recent years numerous projects to construct oil refineries and build up refining
capacity have been launched, with petroleum product supply capacity beginning
to increase gradually.
However, the recent upsurge in crude oil prices has led to a sharp rise in the prices
of materials and processing units and combined with a manpower shortage, has
substantially increased the cost of constructing oil refineries.
As a consequence, numerous construction projects are now being reconsidered or
inevitably postponed. Majority opinions are therefore that less progress will be
made in the buildup of capacities than initially expected. On the other hand, given
a slowdown in the world economy resulting from the recession of the U.S.
economy and the upsurge in crude oil prices, oil demand, mostly from advanced
nations, is most likely to become weaker or even decrease, so that from now
onwards, the supply-demand situation will differ greatly from region to region.
The future outlook for the supply and demand for petroleum products involves an
increasing number of uncertain factors, both in terms of supply and demand, and
uncertainty about the outlook is growing.
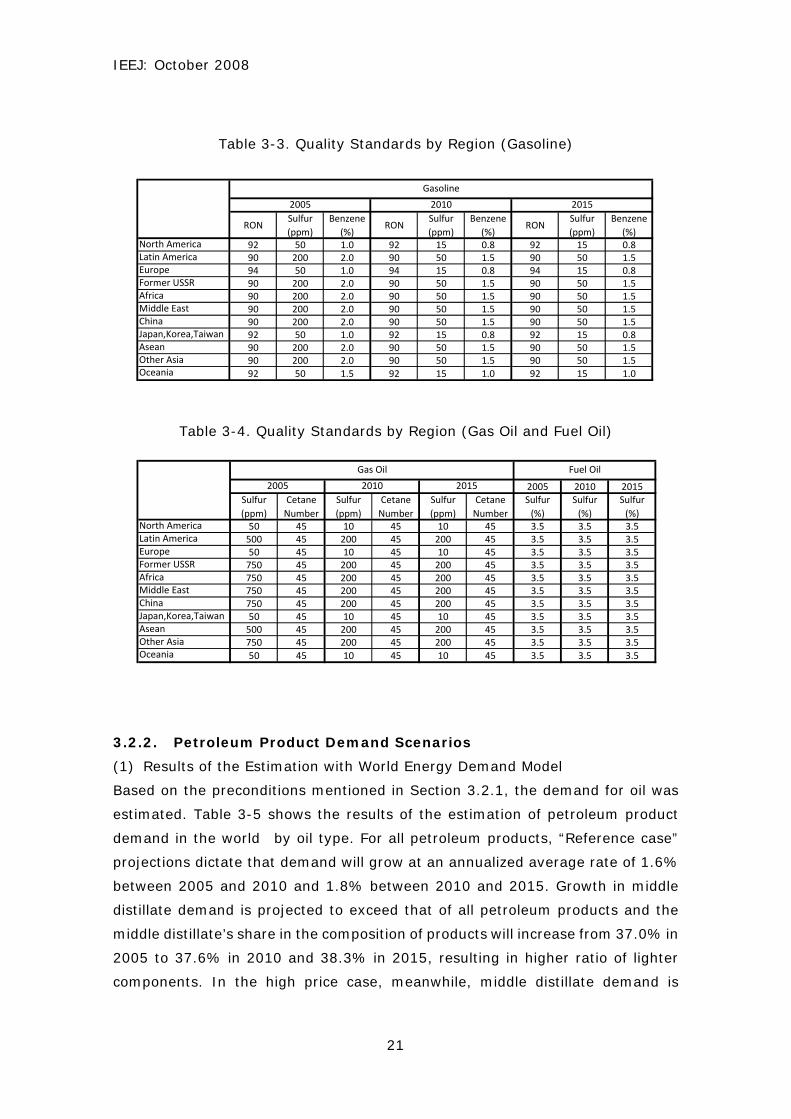
1.1.2 Deregulation and Liberalization of the downstream of Japan Oil
Industry
Diverse measures for deregulation and liberalization surrounding the downstream
petroleum sector (petroleum refining) are being pushed ahead in various
countries around the world. Forging a global petroleum product trade framework
smoothly and efficiently is crucial to accelerating this move. Because one of the
factors disturbing product trade is the difference in efforts that countries are
making to tighten quality regulations, there is a difference observed in the quality
and standards of petroleum products among countries. In this regard, the impact
(or effects) of quality regulations, such as the lower sulfur content of gasoline and
gas oil (sulfur-free products), due to measures designed to protect the
IEEJ: October 2008
7
environment, must receive full attention.
1.1.3 Challenges for Japan Oil Industry and objectives of the Study
Japan, which is dependent on imports from abroad for most of its crude oil
requirements while experiencing the maturity of the domestic petroleum product
market and an early decline in domestic demand, needs to establish its position in
the international petroleum market while securing a steady supply of petroleum
products. To this end, a very important approach is to econometrically assess and
comprehensively analyze the most accurate and up-to-date information on the
trends in oil supply and demand and supply capacity in the world, including in the
Asia-Pacific region.
The present study was carried out in order to renew the (existing) world models
aimed at analyzing the supply and demand for petroleum products in various
parts of the world and to consider the flow of inter-regional product trade, make
analyses with this model in various case studies, and thereby grasp the
ever-changing international oil supply-demand trends systematically, and come
up with well-timed basic data needed to formulate future policy measures for
energy sources, including petroleum.
1.2 Scope of the Study
In the present study, in order to achieve the abovementioned purpose, energy
data and related statistical data on crude oil and petroleum products in the world,
mostly in the Asia-Pacific region that is closely connected with Japan, were
surveyed systematically and in detail, collected and analyzed. At the same time,
World Energy Demand Model and World Oil Refining and Trade Model constructed
in the econometric analysis model survey of petroleum product supply-demand
trends, conducted in fiscal 2005 based on the latest information and the most
up-to-date data on the effects of the economic situations in India and China,
environmental regulations in various countries, and crude oil price trends, were
further refined and with these models, short- and medium-term simulation and
analyses were performed.
The present study consisted of:
(i) Collection and analysis of data on the supply and demand for energy and oil
in the world, mostly in Asia;
IEEJ: October 2008
8
(ii) Collection and organization of information about various countries’ long-term
energy and oil supply-demand outlook, and energy policies (oil policies);
(iii) Creation and revision of World Energy Demand Model and World Oil Refining
and Trade Model reflecting the most up-to-date data and situations;
(iv) Using the abovementioned models, simulation of petroleum supply and
demand based on various assumptions (economic growth, population, crude oil
prices, refining facility projects, and various energy policies) from a medium-term
perspective up to 2010 and 2015;
(v) Based on the results of the above simulation, an analysis of effects on Japan’s
petroleum industry and petroleum product trade flow.
The present study was conducted by the Institute of Energy Economics, Japan at
the request of the Ministry of Economy, Trade and Industry in the FY2007 Study
of the Petroleum Industry and Others (the Econometric Analysis Model Survey of
the Petroleum Product Supply-Demand Trends). In carrying out this study, an
International Working Group (the “International WG”), composed of experts
working for oil companies and trading concerns and who are well versed in
international oil supply and demand, was organized and has held three committee
meetings since November 2007. Because of this consideration, the accuracy of
the models was improved by setting cases to consider in simulation with
econometric analysis models and others, and by carefully examining the results of
simulation so that the study could be conducted efficiently.
Meanwhile, a project team was organized within the IEEJ’s Energy Data and
Modeling Center to collect and analyze, through surveys at site, the most
up-to-date information and data on environmental regulations enforced by
various countries, including China and India, and on the trends in crude oil prices.
The econometric analytical techniques and the models constructed so far were
also improved.
IEEJ: October 2008
9
Chapter 2: Overview of the Models
2.1 Overview of the Models
In the present estimation, based on the economic and population outlooks, world
energy demand and petroleum product demand were estimated by using an
econometric technique. Various countries’ net positions concerning petroleum
products were analyzed by using a linear programming method as well as trade
flow models. The following two models were used in the present estimation:
(i) World Energy Demand Model (econometric model); and
(ii) World Oil Refining and Trade Model (linear programming model (LP)).
Figure 2-1 shows a calculation flow of the present estimation with these two
models, which will be outlined individually in the ensuing sections.
Figure 2-1. The Structure of the Model and a Calculation Flow Diagram
GDP,Population,Crude oil price,Exchange rate,Inflation rate,Power generation mix, etc.
Assumptions (1)
30 regions & countriesFocusing specifically on East Asia and Asean countries
Macroeconomic model
Energy Demand (by sector & by energy source)Conversion sector
Energy supplyPetroleum products consumption
Energy demand-supply model (30 regions & countries)
Refinery capacity,Refining costs,
Freight, etc.
Assumptions (2)
Crude oil supply and tradingPetroleum products supply and trading
Refinery utilization rate
Optimization by cost-minimizing[Cost] defined by [Crude oil price + Refining cost + Freight]
World refining & trade model (LP model)
IEEJ: October 2008
10
2.2 World Energy Demand Model
World Energy Demand Model is composed of demand functions by energy source
and by industrial sector based on the International Energy Agency’s (IEA)
country-by-country energy balance table data and estimates demand by using an
econometric technique. Regarding petroleum products, inter alia, the model is
capable of estimating demand by product category after consideration of the
countries’ electricity demand and progress in motorization.
Regions covered by the model are not exactly the same as those for analysis
withWorld Oil Refining and Trade Model, which will be described later, partly
because the estimation formulas used vary, depending on the characteristics of
energy supply and demand in each country (each region). The basic structure of
this model is shown in Figure 2-2.
Figure 2-2. The Basic Structure of World Energy Demand Model
GDP,Population,Exchange rate, etc.
Vehicle number
Electric ity demandby sector
Final energyconsumption
(by sector,by energy source)
Electric ity generationkWh
Electric ity generationNuclear,Hydro, Geothermal, etc.
Electric ity generationCoal,oil,gas-fired
Generationefficiency
Fuel consumption
Oilconsumption
Oil/Coal/Gasratio
A
B
Energy supplyNuclear,Hydro etc.
Crude oilprice
Energy demandby sector
Oil/Coal/Gasprice ratio
Oildemandby sector
Coaldemandby sector
Gasdemandby sector
Oilprimarysupply
Coalprimarysupply
Gasprimarysupply
A
A
Total primaryenergy supply
by energy source
Petroleum productsdemand
by product type
petroleumproduct demand
by sector
Internationalbunker demand
Coalconsumption
Gasconsumption
B
assumptions
IEEJ: October 2008
11
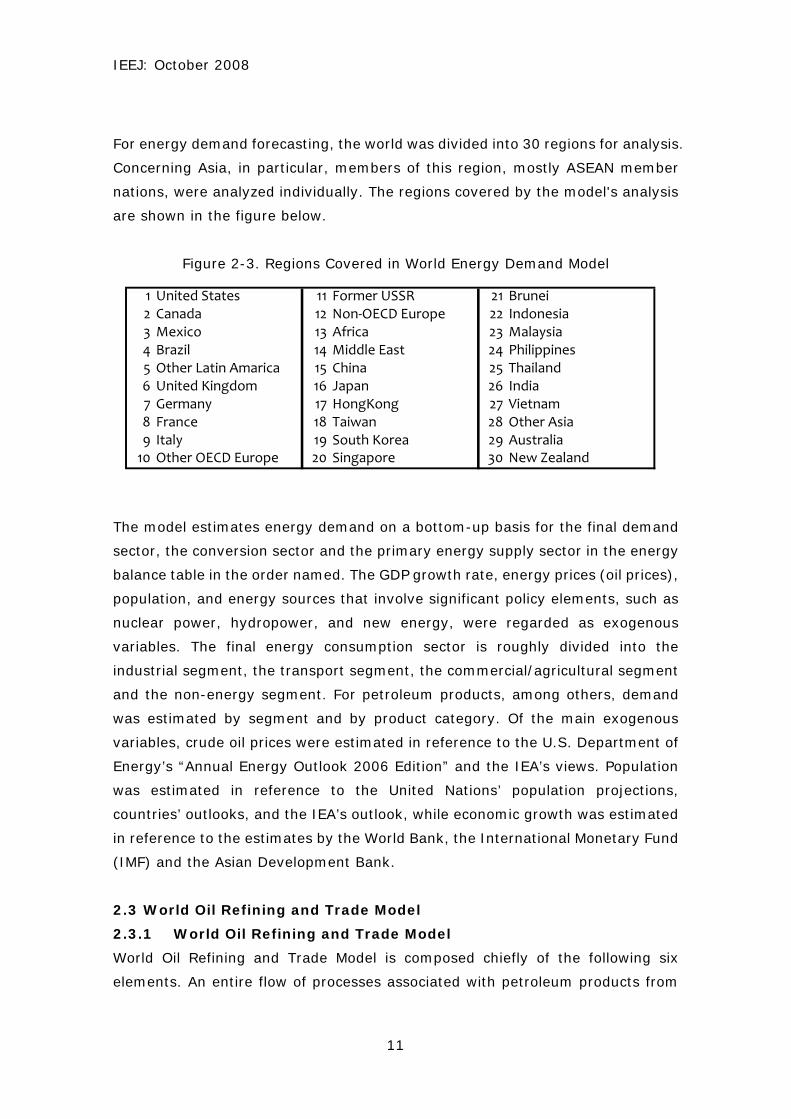
For energy demand forecasting, the world was divided into 30 regions for analysis.
Concerning Asia, in particular, members of this region, mostly ASEAN member
nations, were analyzed individually. The regions covered by the model's analysis
are shown in the figure below.
Figure 2-3. Regions Covered in World Energy Demand Model
The model estimates energy demand on a bottom-up basis for the final demand
sector, the conversion sector and the primary energy supply sector in the energy
balance table in the order named. The GDP growth rate, energy prices (oil prices),
population, and energy sources that involve significant policy elements, such as
nuclear power, hydropower, and new energy, were regarded as exogenous
variables. The final energy consumption sector is roughly divided into the
industrial segment, the transport segment, the commercial/agricultural segment
and the non-energy segment. For petroleum products, among others, demand
was estimated by segment and by product category. Of the main exogenous
variables, crude oil prices were estimated in reference to the U.S. Department of
Energy’s “Annual Energy Outlook 2006 Edition” and the IEA’s views. Population
was estimated in reference to the United Nations’ population projections,
countries’ outlooks, and the IEA’s outlook, while economic growth was estimated
in reference to the estimates by the World Bank, the International Monetary Fund
(IMF) and the Asian Development Bank.
2.3 World Oil Refining and Trade Model
2.3.1 World Oil Refining and Trade Model
World Oil Refining and Trade Model is composed chiefly of the following six
elements. An entire flow of processes associated with petroleum products from
1 United States 11 Former USSR 21 Brunei2 Canada 12 Non‐OECD Europe 22 Indonesia3 Mexico 13 Africa 23 Malaysia4 Brazil 14 Middle East 24 Philippines5 Other Latin Amarica 15 China 25 Thailand6 United Kingdom 16 Japan 26 India7 Germany 17 HongKong 27 Vietnam8 France 18 Taiwan 28 Other Asia9 Italy 19 South Korea 29 Australia10 Other OECD Europe 20 Singapore 30 New Zealand
IEEJ: October 2008
12
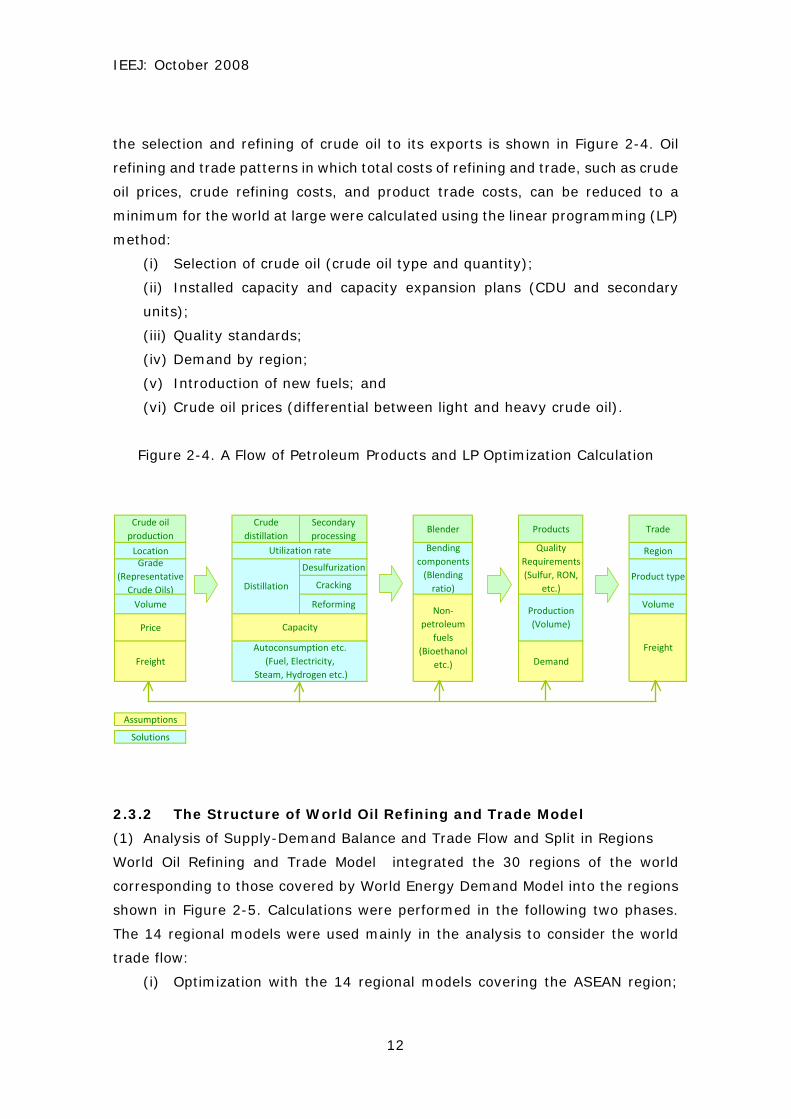
the selection and refining of crude oil to its exports is shown in Figure 2-4. Oil
refining and trade patterns in which total costs of refining and trade, such as crude
oil prices, crude refining costs, and product trade costs, can be reduced to a
minimum for the world at large were calculated using the linear programming (LP)
method:
(i) Selection of crude oil (crude oil type and quantity);
(ii) Installed capacity and capacity expansion plans (CDU and secondary
units);
(iii) Quality standards;
(iv) Demand by region;
(v) Introduction of new fuels; and
(vi) Crude oil prices (differential between light and heavy crude oil).
Figure 2-4. A Flow of Petroleum Products and LP Optimization Calculation
2.3.2 The Structure of World Oil Refining and Trade Model
(1) Analysis of Supply-Demand Balance and Trade Flow and Split in Regions
World Oil Refining and Trade Model integrated the 30 regions of the world
corresponding to those covered by World Energy Demand Model into the regions
shown in Figure 2-5. Calculations were performed in the following two phases.
The 14 regional models were used mainly in the analysis to consider the world
trade flow:
(i) Optimization with the 14 regional models covering the ASEAN region;
Crude oil
production
Crude
distillation
Secondary
processingBlender Products Trade
Location Region
Desulfurization
Cracking
Volume Reforming Volume
Price
Freight Demand
Assumptions
Solutions
Production
(Volume)
Freight
Product type
Autoconsumption etc.
(Fuel, Electricity,
Steam, Hydrogen etc.)
Quality
Requirements
(Sulfur, RON,
etc.)
Grade
(Representative
Crude Oils)
Bending
components
(Blending
ratio)
Non‐
petroleum
fuels
(Bioethanol
etc.)
Utilization rate
Distillation
Capacity
IEEJ: October 2008
13
and
(ii) Optimization with the 7 regional models within the ASEAN region.
(In the present study, the ASEAN nations’ supply-demand balance was checked
but a simulation of detailed trade flow was not carried out.)
Note: Optimization with the intra-region detailed model in other regions is a task
for future investigation.
Figure 2-5. Regions in the World Oil Refining and Trade Model
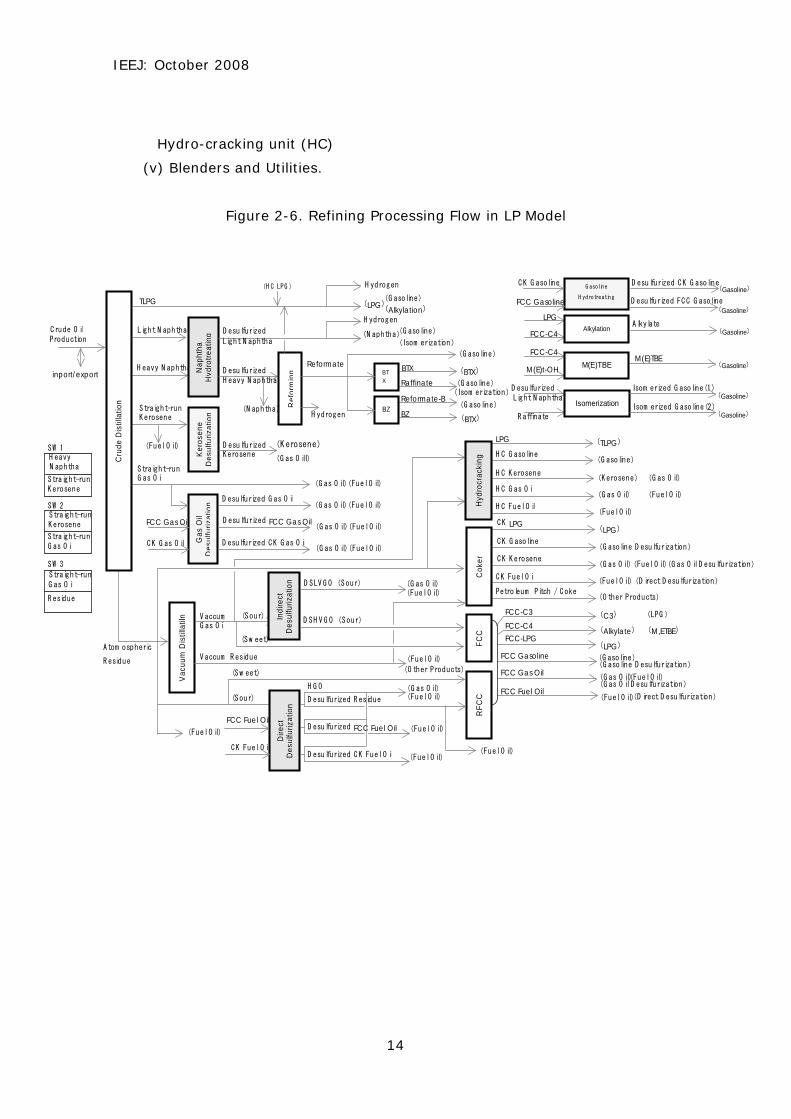
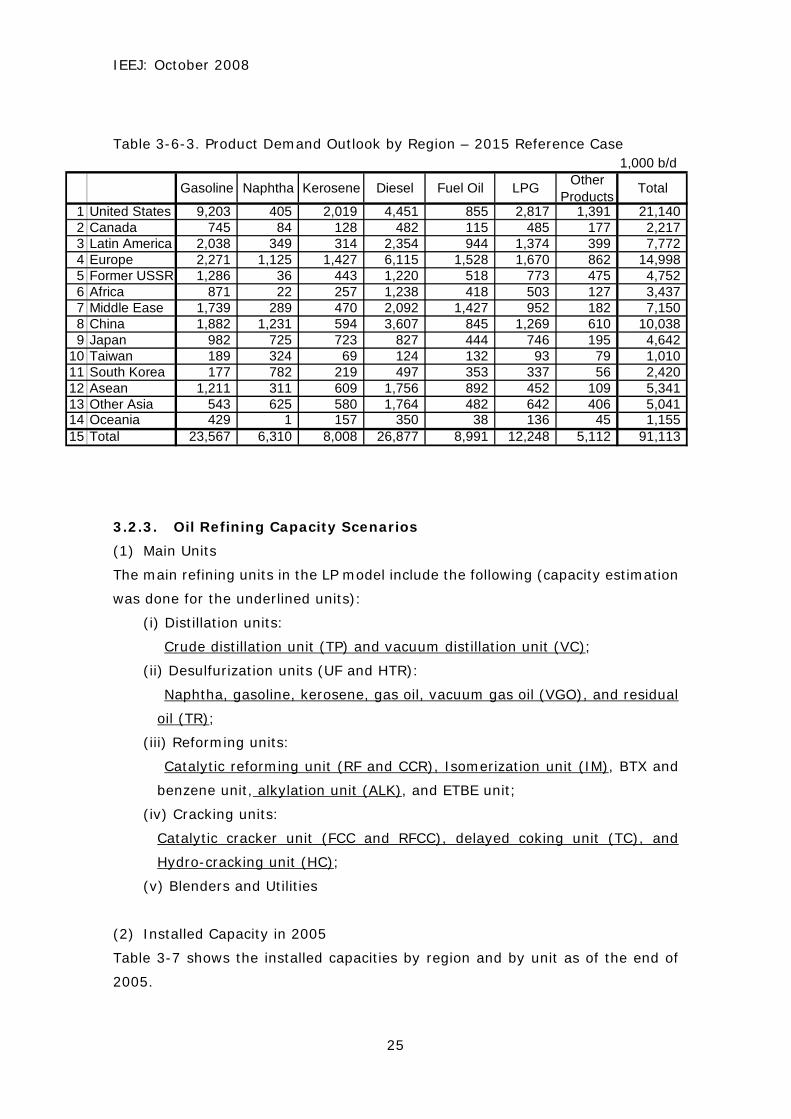
(2) Refining Processing Flow
Oil refining flow in LP Model is shown in Figure 2-6. The major units include:
(i) Distillation units
Crude distillation unit (CDU) and vacuum distillation unit (VC)
(ii) Desulfurization units (UF and HTR)
Naphtha, gasoline, kerosene, gas oil, vacuum gas oil (VGO), and residual
oil (TR)
(iii) Reforming units
Reforming unit (RF and CCR), Isomerization (IM), BTX unit, benzene unit,
Alkylation unit (ALK), and ETBE unit
(iv) Cracking units
Catalytic cracking unit (FCC and RFCC), Delayed coking unit (TC), and
World trade model (14 regions)
United StatesCanada
Asean model (7 countries)
ThailandVietnamSingaporeMalaysia
China Indonesia
Japan Philippines
Taiwan Brunei
South Korea
North
America
Oceania
Latin AmericaOECD EuropeFormer USSR,Non‐OECD Europe
Middle EastSouth AsiaSoutheast Asia
East
Asia
Africa
IEEJ: October 2008
14
Hydro-cracking unit (HC)
(v) Blenders and Utilities.
Figure 2-6. Refining Processing Flow in LP Model
C rude O il
Ker
osen
eD
esul
furiz
atio
n
Straight-run
Straight-run
H eavy N aphtha
TLPG
Light N aphtha
Nap
htha
Hyd
rotr
eatin
g
D esulfurized
D esulfurized
D esulfurized
D esulfurized G as O il
Gas
Oil
Des
ulfu
rizat
ion
RF
CC
FC
C
A tom ospheric
R esidue
Vac
uum
Dis
tilla
tiln V accum
V accum R esidue
Indi
rect
Des
ulfu
rizat
ion
(Sour)D SH V G O (Sour)
D SLV G O (Sour)
Dire
ctD
esul
furiz
atio
n
(Sour) D esulfurized R esidue
H G O
(Sw eet)
C K LPG
C K G asoline
C K K erosene
C K Fuel O il
LPG
H C G asoline
H C K erosene
H C G as O il
H C Fuel O il
FCC-LPG
FCC Gas Oil
FCC Fuel Oil
FCC Gasoline
(Sw eet)
D esulfurized FCC Fuel Oil
D esulfurized C K Fuel O il
FCC Fuel Oil
C K Fuel O il
G asoline
H ydrotreating
C K G asoline
FCC Gasoline
D esulfurized C K G asoline
D esulfurized FC C G asoline
FCC Gas Oil
C K G as O il D esulfurized C K G as O il
D esulfurized FCC Gas Oil
Ref
orm
ing
Reformate-B
Alkylation
LPG
FCC-C3FCC-C4
(LPG)
(Kerosene)
(G asoline)
A lkylateFCC-C4
BTX
Raffinate (G asoline)
(BTX)
(G as O il)
(Fuel O il)
(Fuel O il)
Petroleum Pitch / C oke
M(E)TBEFCC-C4
M(E)t-OH
(O ther Products)
(N aphtha)
H ydrogen
H ydrogen
(Fuel O il)
(Fuel O il)
(G as O il)(Fuel O il)
(Fuel O il)(D irect D esulfurization)
(G as O il)(Fuel O il)
(G asoline D esulfurization)(G asoline)
(LPG)
(Alkylate) (M,ETBE)
(C3)
(O ther Products)
(D irect D esulfurization)(Fuel O il)
(G as O il)(Fuel O il)
(G asoline D esulfurization)
(LPG)
(Fuel O il)
(G as O il) (Fuel O il)
(Kerosene)
(G asoline)
(TLPG)
(G as O il)(Fuel O il)
(G as O il)(Fuel O il)
(Fuel O il)(G as O il)
(G as O il)
(G asoline)
H ydrogen
(G asoline)
(Gasoline)
(Gasoline)
(Gasoline)
(Gasoline)
inport/export
(H C LPG)
(Alkylation)
(G as O il D esulfurization)
(G as O il D esulfurization)
Cru
de D
istil
latio
n
(Fuel O il)
Hyd
rocr
acki
ngC
oker
M(E)TBE
(G as O ill)
(G as O il)
(Fuel O il)
(N aphtha)
H eavy
Straight-run
SW 1
Straight-run
Straight-run
SW 2
Straight-run
R esidue
SW 3
(LPG)
(Fuel O il)
Isomerization
Isom erized G asoline(1)
Isom erized G asoline(2)
(Gasoline)
(Gasoline)
(Isom erization)
(Isom erization)
R affinate
BTX
BZ
D esulfurized
BZ (BTX)
Reformate(G asoline)
(Fuel O il)
N aphtha
Kerosene
Kerosene
G as O il
G as O il
Light N aphtha
Light N aphtha
H eavy N aphtha
K erosene
K erosene
G as O il
G as O il
Production
IEEJ: October 2008
15
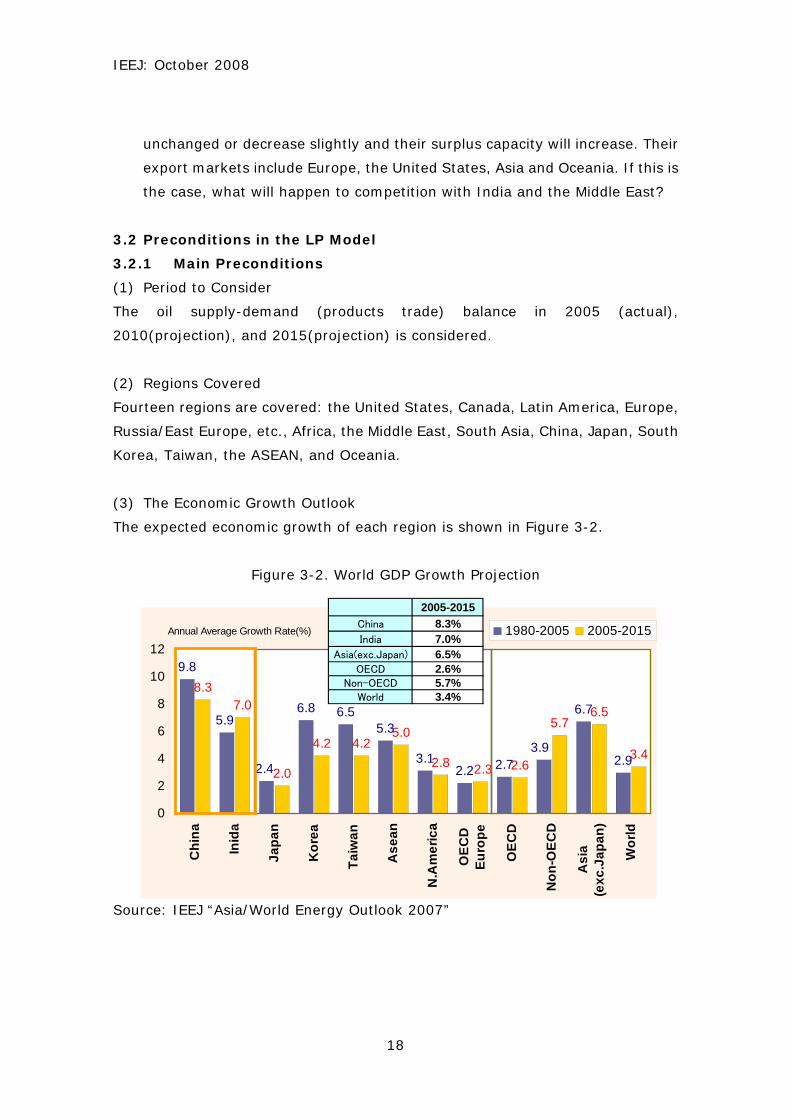
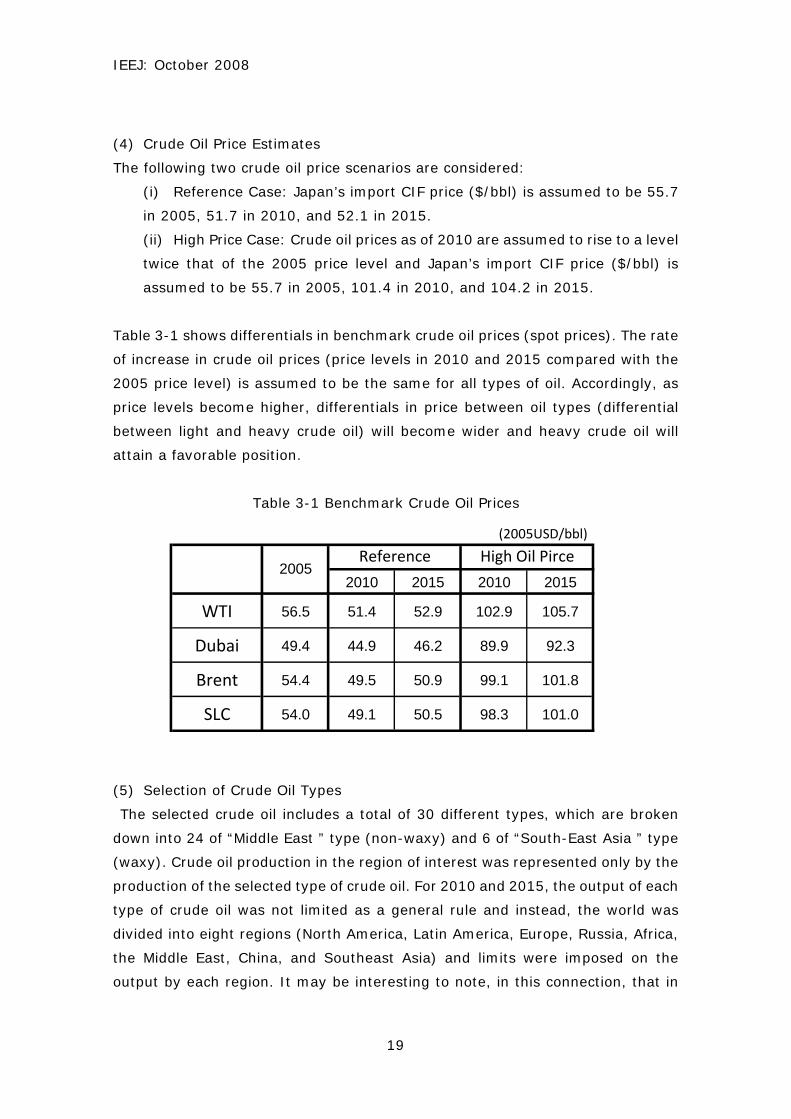
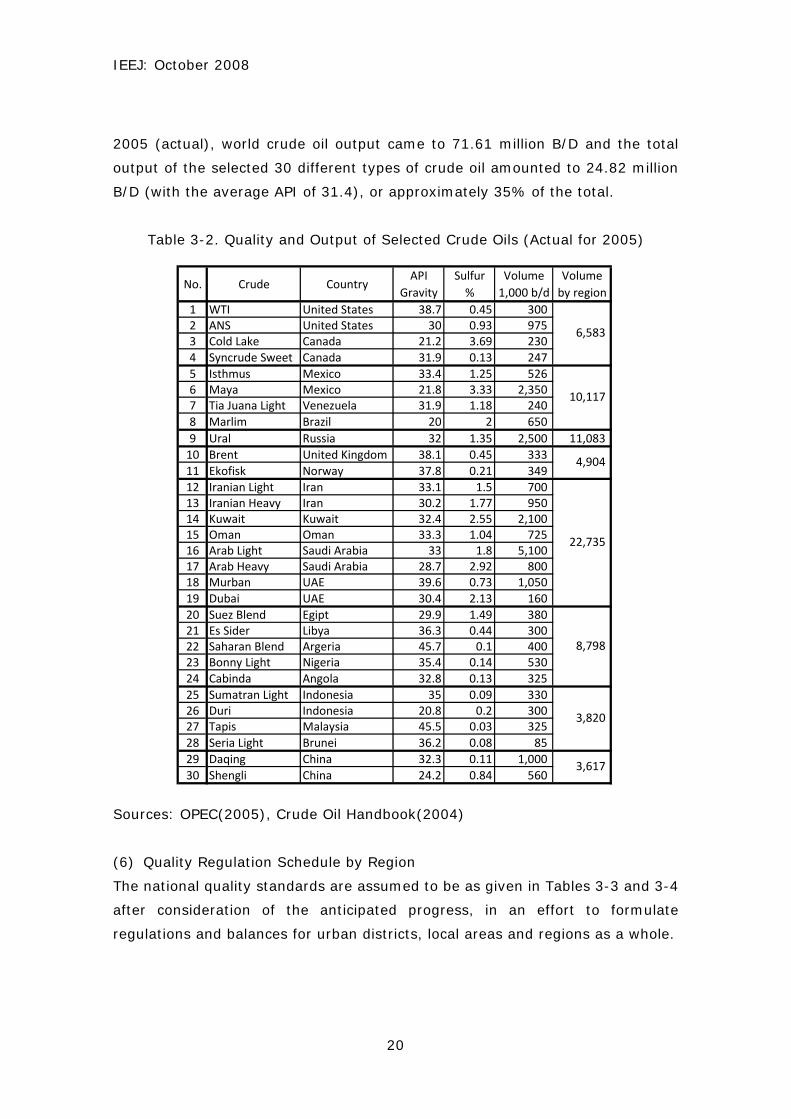
Chapter 3: Preconditions on the LP Model
3.1 Framework of the Study
3.1.1 The Product Supply-Demand Situations Until 2005
(1) 2004 Was the Year of a Major Turnaround
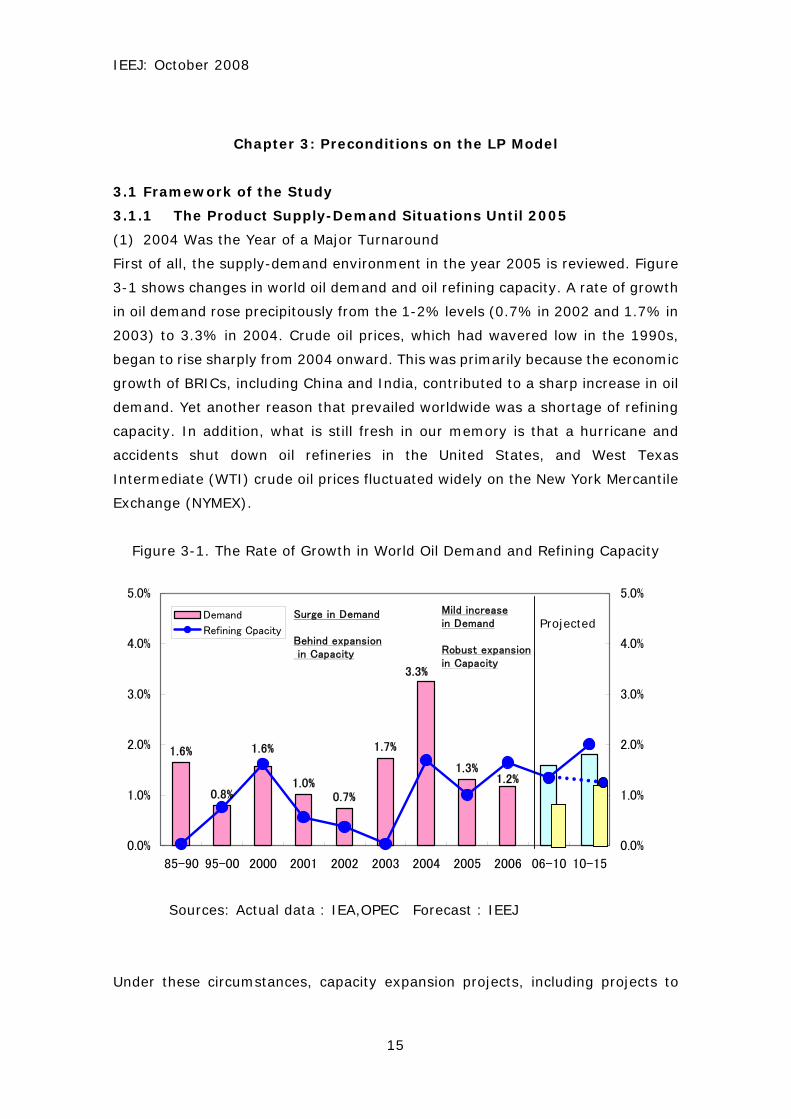
First of all, the supply-demand environment in the year 2005 is reviewed. Figure
3-1 shows changes in world oil demand and oil refining capacity. A rate of growth
in oil demand rose precipitously from the 1-2% levels (0.7% in 2002 and 1.7% in
2003) to 3.3% in 2004. Crude oil prices, which had wavered low in the 1990s,
began to rise sharply from 2004 onward. This was primarily because the economic
growth of BRICs, including China and India, contributed to a sharp increase in oil
demand. Yet another reason that prevailed worldwide was a shortage of refining
capacity. In addition, what is still fresh in our memory is that a hurricane and
accidents shut down oil refineries in the United States, and West Texas
Intermediate (WTI) crude oil prices fluctuated widely on the New York Mercantile
Exchange (NYMEX).
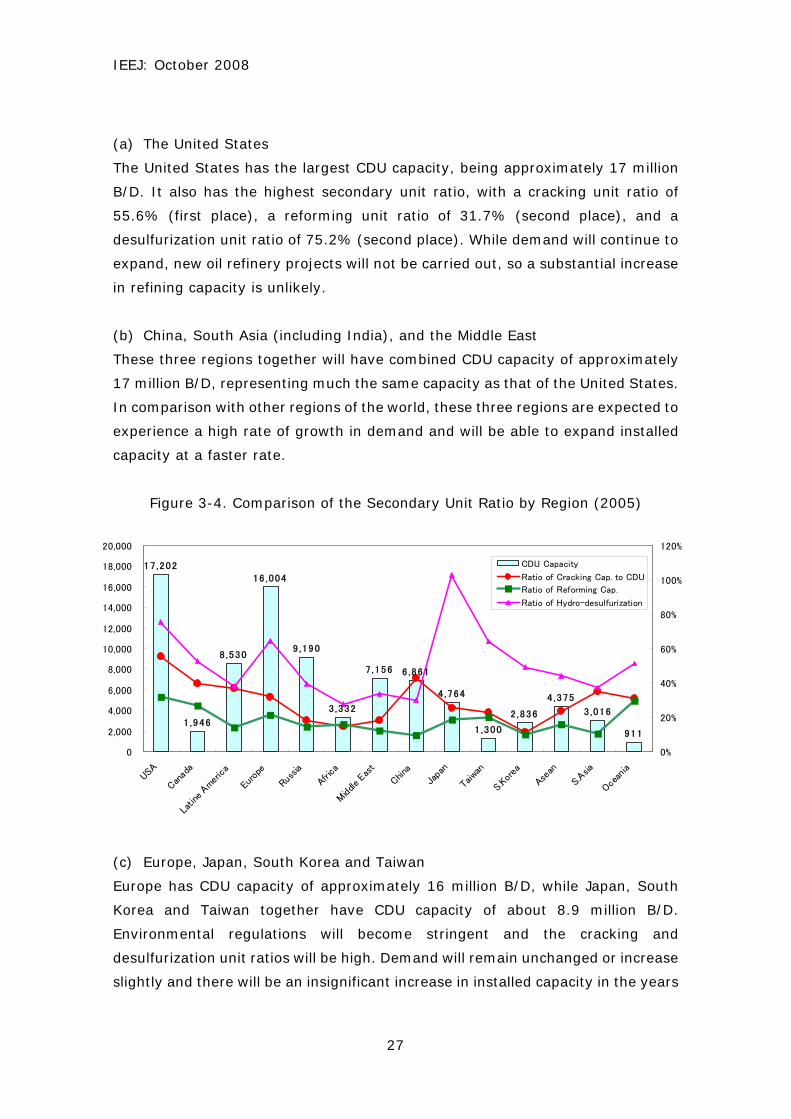
Figure 3-1. The Rate of Growth in World Oil Demand and Refining Capacity
Sources: Actual data : IEA,OPEC Forecast : IEEJ
Under these circumstances, capacity expansion projects, including projects to
Figure 3-7. Changes in the Buildup of Installed Capacity by Region (2010-2015)
0
500
1000
1500
2000
2500
North A
merica
Latin
Americ
a
Europe
Form
er USS
RAfric
a
Middle East
China
Japan
Taiw
an,S.Korea
Asean
Other A
sia
Oceania
0.0
1.0
2.0
3.0
4.0
5.0
Incremental Capacity
Capacity Growth
Demand Growth
Demand Growth (High Oil Price)
① CDU(2010-2015)2005‐2015 Increment
(thousand barrels per day)
Annual Growth Rate
(%)
0
200
400
600
800
1000
North A
merica
Latin
Americ
a
Europe
Form
er USS
RAfric
a
Middle East
China
Japan
Taiw
an,S.Korea
Asean
Other A
sia
Oceania
0.0
1.0
2.0
3.0
4.0
5.0
Incremental Capacity
Capacity Growth
Demand Growth
Demand Growth (High Oil Price)
② Cracking(2010-2015)2005‐2015 Increment
(thousand barrels per day)
Annual Growth Rate
(%)
IEEJ: October 2008
39
0
100
200
300
400
500
North A
merica
Latin
Americ
a
Europe
Form
er USS
RAfric
a
Middle East
China
Japan
Taiw
an,S.Korea
Asean
Other A
sia
Oceania
0.0
1.0
2.0
3.0
4.0
5.0Incremental Capacity
Capacity Growth
Demand Growth
Demand Growth (High Oil Price)
③ Reforming(2010-2015)2005‐2015 Increment
(thousand barrels per day)
Annual Growth Rate
(%)
0
300
600
900
1200
1500
North A
merica
Latin
Americ
a
Europe
Form
er USS
RAfric
a
Middle East
China
Japan
Taiw
an,S.Korea
Asean
Other A
sia
Oceania
0.0
1.0
2.0
3.0
4.0
5.0Incremental Capacity
Capacity Growth
Demand Growth
Demand Growth (High Oil Price)
④ Desulfurization(2010-2015)Annual Growth Rate
(%)
2005‐2015 Increment
(thousand barrels per day)
IEEJ: October 2008
40
Chapter 4: Estimates by the LP Model
4.1 Reference Case and High Price Case
4.1.1 The Utilization Rate of CDU
(1) The Utilization Rate of CDU (Figures 4-1 and 4-2)
(a) Reference Case:
Demand is expected to grow steadily at the rates of 1.6% (for the period from
2005 to 2010) and 1.8% (for the period from 2010 to 2015). As a result, the
capacity utilization rate of crude distillation units is projected to increase by
1.2% from 90.3% in 2005 to 91.6% in 2010 and further to 91.5% in 2015,
thereby tightening supply and demand worldwide.
(b) High Price Case:
Demand is expected to grow at a lower rate of 0.7% (for the period from 2005
to 2010) and 1.2% (for the period from 2010 to 2015), so the capacity
utilization rate is likely to drop by 3.4% from 90.3% in 2005 to 87.5% in 2010
(down 2.8% compared with the 2005 level) and further to 86.9% in 2015. In
some regions, the capacity utilization rate will decline to generate a surplus
capacity.
Figure 4-1. Changes in the Amount of Crude Oil Processed
and the Utilization Rate of the CDU
85 ,732
94 ,355
78 ,942
87 ,408
81 ,912
91 .5%91 .6%
90 .3%
86 .9%
87 .5%
70 ,000
75 ,000
80 ,000
85 ,000
90 ,000
95 ,000
100 ,000
2005 2010 2015
85%
86%
87%
88%
89%
90%
91%
92%
93%
94%
95%
Crude Throughput(Base Case)
Crude Throughput(High Price Case)
Utilization Rate(Base Case)
Utilization Rate(High Price Case)
IEEJ: October 2008
41
Figure 4-2. Estimates of CDU Capacity and Petroleum Product Demand
(2) The API Gravity of Processed Crude Oil and the Utilization Rate of Cracking
Units
(a) API Gravity:
The API gravity of processed crude oil, as shown in Figure 4-3, is projected to
rise from 33.6 in 2005 to 33.8 in 2010 and to 33.9 in 2015 in “Reference case”,
with oil becoming a little lighter. In “High price case”, on the other hand, the API
gravity is projected to reach 33.5 in 2010 and 2015, with oil becoming heavier,
if only a little.
(b) The Capacity Utilization Rate of Cracking Units:
In “Reference case”, the capacity utilization rate is projected to rise by 2.1%
from 87.9% in 2005 to 89.2% in 2010 and to 90.0% in 2015. In “High price
case”, on the other hand, it is projected to rise by 0.5% to 90.1% in 2010 and
to 90.4% in 2015.
83,317
91,113
79 ,690
84 ,592
103 ,155
77 ,054
87,423
93 ,565
100,555
70,000
75,000
80,000
85,000
90,000
95,000
100,000
105,000
2005 2010 2015
Demand (Base Case)
Demand (High Price Case)
Refining Capacity : (Base Case)
Refining Capacity : (High Price Case)
Refining Capacity : (Estimated in 2005)
IEEJ: October 2008
42
Figure 4-3. Changes in the Utilization Rate of CDU
and the API Gravity of Processed Crude Oil
Figure 4-4. Changes in Cracking Capacity and the Utilization Rate
(3) Summary
(a) Reference Case:
The capacity utilization rate of crude distillation units stands at a very high level of
91% and that of cracking units is also projected to stay at a level as high as 90.0%,
with the API gravity of processed crude oil becoming higher.
33.9
33.6
33.8
33.533.6
33.5
80%
85%
90%
95%
100%
2005 2010 2015
32.0
32.5
33.0
33.5
34.0
34.5
35.0Utilization Rate(Base Case)
Utilization Rate(High Price Case)
API of processed crude (Base Case)
API of processed crude (High Price Case)
90 .0%
89 .2%
90 .1%
87 .9%
90 .4%
20,000
25,000
30,000
35,000
40,000
45,000
50,000
2005 2010 2015
80%
85%
90%
95%
Refining Capacity(Base Case)
Refining Capacity(High Price Case)
Utilization Rate (Base Case)
Utilization Rate (High Price Case)
IEEJ: October 2008
43
(b) High Price Case:
The capacity utilization rate of crude distillation units is projected to decline to
86%. On the other hand, the capacity utilization rate of cracking units is projected
to rise to 90.4%, a level higher than in the reference case and the API gravity of
processed crude oil is projected to become a little lower.
4.1.2 The Utilization Rate of CDU by Region (Figures 4-5 and 4-6)
(a) Reference Case:
Units are projected to operate at nearly full capacity in North America (the United
States and Canada), Europe, Japan, the ASEAN, South Asia, and Oceania.
(b) High Price Case:
As in the reference case, units are projected to continue operating at nearly full
capacity in North America (the United States and Canada), Japan1, the ASEAN and
Oceania, but the utilization rate is expected to decline, thus generating a surplus
capacity in Europe, Russia, Middle East, China, Taiwan, South Korea and South
Asia.
Figure 4-5. Comparison of the Utilization Rate of the CDU by Region (2010)
1 Japan’s gasoline and middle distillate exports are likely to decrease substantially and, instead, its fuel oil exports are expected to increase. If fuel oil exports are restricted, the capacity utilization rate will decline.
100.0
76.4
59.1
69.1
85.6
100.0 100.0
93.3
100.0
87.6
100.0
84.789.2
73.9
100.0
91.6
71.7
85.6
95.5
50
60
70
80
90
100
North A
merica
Latin
Americ
a
Euro
pe
Form
er USS
RAfric
a
Middle East
ChinaJa
pan
Taiw
an,S.Korea
Asean
Other Asia
OceaniaWorld
Utilization Rate (%)
Reference Case
High Oil PirceCase
IEEJ: October 2008
44
Figure 4-6. Comparison of the Utilization Rate of the CDU by Region (2015)
4.1.3 Product Supply-Demand Balance and Product Trade by Region
(1) Supply-Demand Balance by Region (Reference Case)
During the period from the 1990s to the first half of the 2000s, product trade was
centered on intra-region: (a) in the Atlantic region where excesses and shortages
were adjusted (traded) among North America, Europe and Russia; and (b) in the
East Asian region where excesses and shortages in China and the ASEAN region
were adjusted (traded) chiefly by the refining capacities of Japan, South Korea
and Taiwan.
The results of supply-demand balance estimation with the LP model for 2005,
2010 and 2015 are shown in Figures 4-7, 4-8 and 4-9.2 Based on this estimation,
the intra-regional supply-demand balances for the Middle East and the South
Asian region, in addition to the above two regions, are discussed below.
Intra-Regional Supply-Demand Balances for the Three Main Regions
(a) The Region (the numerical values given are for 20053, 2010, and 2015)
2 In the LP model, it should be noted, because regional excesses and shortages (exports and imports) are determined by verifying whether the refining capacity in which region can be operated at what levels and where excesses and shortages should be imported (or exported) at the minimum costs for the whole world to meet the demand in each region, these regional excesses and shortages do not always represent (potential) surpluses (exports) that can be made available when the refining capacity in the region in question is fully operational. 3 Figure 4-7 shows the results of estimation with the LP model and the actual figures in 2005.
100.0
76.4
93.7
58.2
100.0
72.2
100.0 100.0
86.9
100.0
82.8
89.9
76.0
100.0
91.5
69.6
85.6 84.3
94.7
68.7
86.3
50
60
70
80
90
100
North A
merica
Latin
Americ
a
Euro
pe
Form
er USS
RAfric
a
Middle East
ChinaJa
pan
Taiw
an,S.Korea
Asean
Other Asia
OceaniaWorld
Utilization Rate (%)
Reference Case
High Oil PriceCase
IEEJ: October 2008
45
- North America: Net gasoline imports (▲ 1.82 million B/D; ▲ 1.78 million
B/D; ▲ 1.96 million B/D)
- Europe: Net gasoline exports (1.13 million B/D; 1.45 million B/D; 1.57
million B/D)
Net middle distillate imports (▲ 1.03 million B/D; ▲ 0.42 million B/D; ▲
0.6 million B/D)
- Russia: Net gasoline exports (0.23 million B/D; 0.45 million B/D; 0.45
million B/D)
Net middle distillate exports (1.43 million B/D; 1.16 million B/D; 1.2 million
B/D)
(b) The East Asian Region
- Japan: Net gasoline exports (0.17 million B/D; 0.14 million B/D; 0.12
million B/D)
Net middle distillate exports (0.4 million B/D; 0.45 million B/D; 0.65 million
B/D)
- South Korea and Taiwan: Net gasoline exports (0.04 million B/D; 0.03
million B/D; 0.04 million B/D)
Net middle distillate exports (0.47 million B/D; 0.34 million B/D; 0.25
million B/D)
- China: Net gasoline exports (0.32 million B/D; 0.37 million B/D; 0.42 million
B/D)
Net middle distillate imports (▲0.28 million B/D; ▲ 0.45 million B/D; ▲
0.55 million B/D)
- The ASEAN: From net gasoline exports to net imports (0.13 million B/D; ▲
0.17 million B/D; ▲ 0.26 million B/D)
From net middle distillate exports to net imports (0.16 million B/D; ▲ 0.16
million B/D; ▲-0.21 million B/D)
(c) The Middle East and the South Asian Region
- The Middle East: Net gasoline imports (▲0.17 million B/D; ▲0.16 million
B/D; ▲0.21 million B/D)
From net middle distillate imports to net exports (▲0.18 million B/D; 0.08
While gasoline exports and imports in the LP model include blending materials for gasoline, the actual figures include products only. A look at gasoline imports in the United States reveals that blending materials for gasoline are imported in the quantity almost equal to (or greater than) that of products.
IEEJ: October 2008
46
million B/D; 0.11 million B/D)
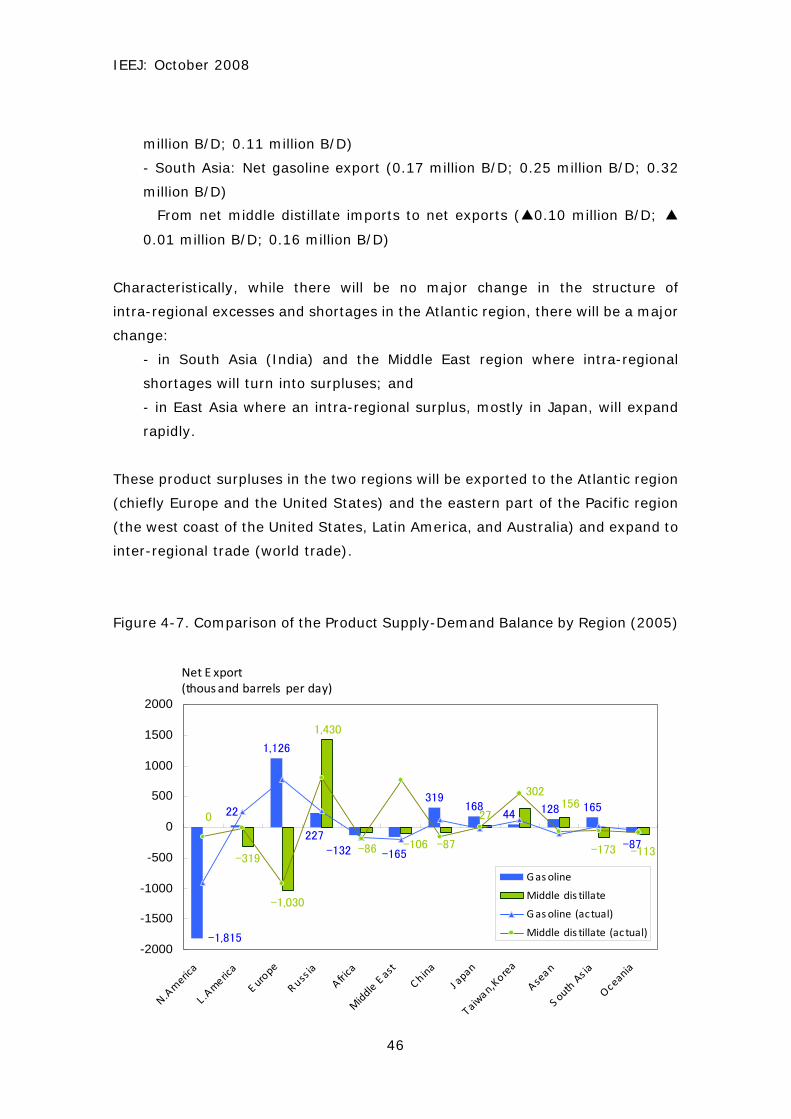
- South Asia: Net gasoline export (0.17 million B/D; 0.25 million B/D; 0.32
million B/D)
From net middle distillate imports to net exports (▲0.10 million B/D; ▲
0.01 million B/D; 0.16 million B/D)
Characteristically, while there will be no major change in the structure of
intra-regional excesses and shortages in the Atlantic region, there will be a major
change:
- in South Asia (India) and the Middle East region where intra-regional
shortages will turn into surpluses; and
- in East Asia where an intra-regional surplus, mostly in Japan, will expand
rapidly.
These product surpluses in the two regions will be exported to the Atlantic region
(chiefly Europe and the United States) and the eastern part of the Pacific region
(the west coast of the United States, Latin America, and Australia) and expand to
inter-regional trade (world trade).
Figure 4-7. Comparison of the Product Supply-Demand Balance by Region (2005)
1,126
319168 165
-87
0
-319
-1,030
1,430
-87
27
-173
-1,815
22
227
-165
44 128
-132-106
302156
-113-86
-2000
-1500
-1000
-500
0
500
1000
1500
2000
N.Am
erica
L .Am
erica
E urope
Russia
Africa
Middle E ast
China
J apan
Taiwan,Korea
Asean
S outh Asia
Oceania
Gasoline
Middle dis tillate
Gasoline (actual)
Middle dis tillate (actual)
Net E xport(thousand barrels per day)
IEEJ: October 2008
47
When the supply-demand balance for the whole world is optimized at minimum
costs, Japan’s optimum operation level will be full operation and exports will
amount to 0.14 million B/D (gasoline) plus 0.45 million B/D (middle distillate),
0.59 million B/D in total in 2010, and 0.12 million B/D (gasoline) plus 0.65 million
B/D (middle distillate), 0.77 million B/D in total in 2015. In crude oil equivalent,
the exports will represent approximately 1 million B/D in 2015, accounting for
approximately 20% of the present CDU capacity of approximately 4.8 million B/D.
Figure 4-8. Comparison of the Product Supply-Demand Balance by Region
Reference Case (2010)
Figure 4-9. Comparison of the Product Supply-Demand Balance by Region
Reference Case (2015)
1,448
-203
365
33249
-78
0
-399 -418
1,158
78
-445
451 338
-161
-12
-1,778
-270
453
-185
140
-174
-456
-134
-2000
-1500
-1000
-500
0
500
1000
1500
2000
N. Americ
a
L.Americ
a
Europe
Form
er USS
RAfric
a
Middle East
China
Japan
Taiw
an, S.Kore
aAse
an
Other A
sia
Oceania
gasoline
middle distil lates
Net Export
(thousand barrels per day)
-1,957
1,571
-248
420
36315
-85
249
-598 -603
1,197
111
-549
252 157
-143
450
-222
124
-262
-512
651
-205 -148
-2500
-2000
-1500
-1000
-500
0
500
1000
1500
2000
N. Americ
a
L.Americ
a
Europe
Form
er USS
RAfric
a
Middle East
China
Japan
Taiw
an, S.K
oreaAse
an
Other A
sia
Oceania
gasoline
middle distillates
Net Export
(thousand barrels per day)
IEEJ: October 2008
48
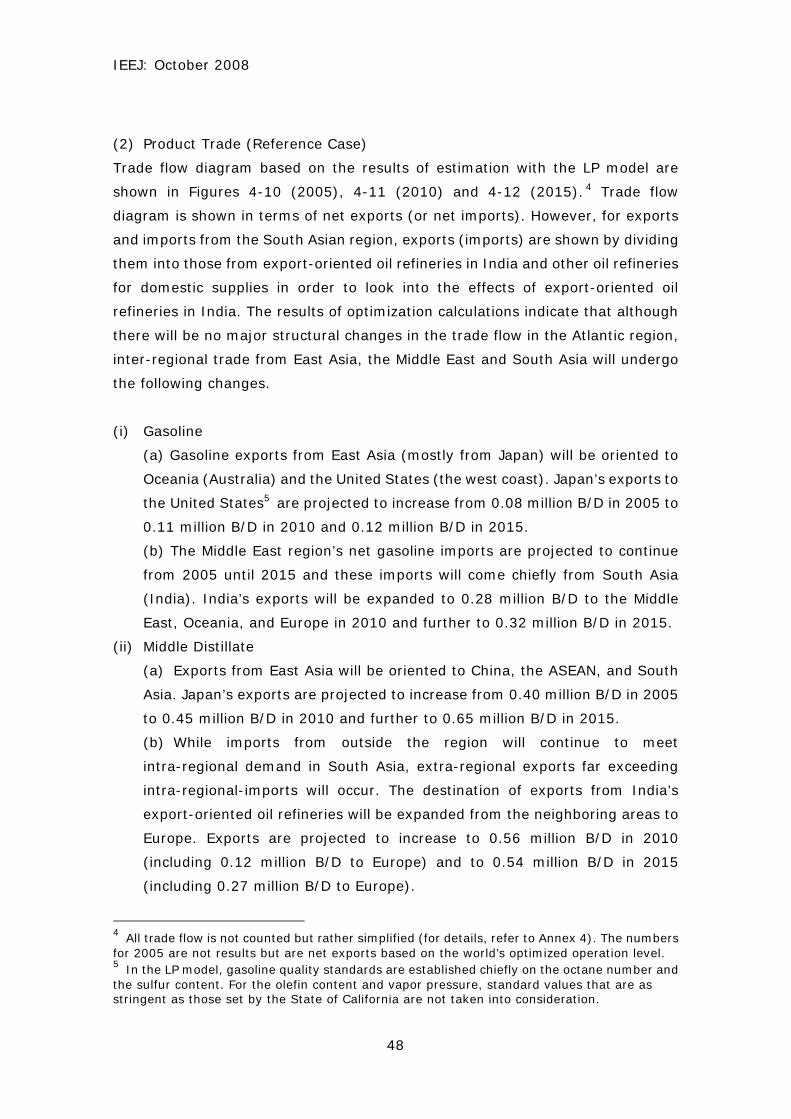
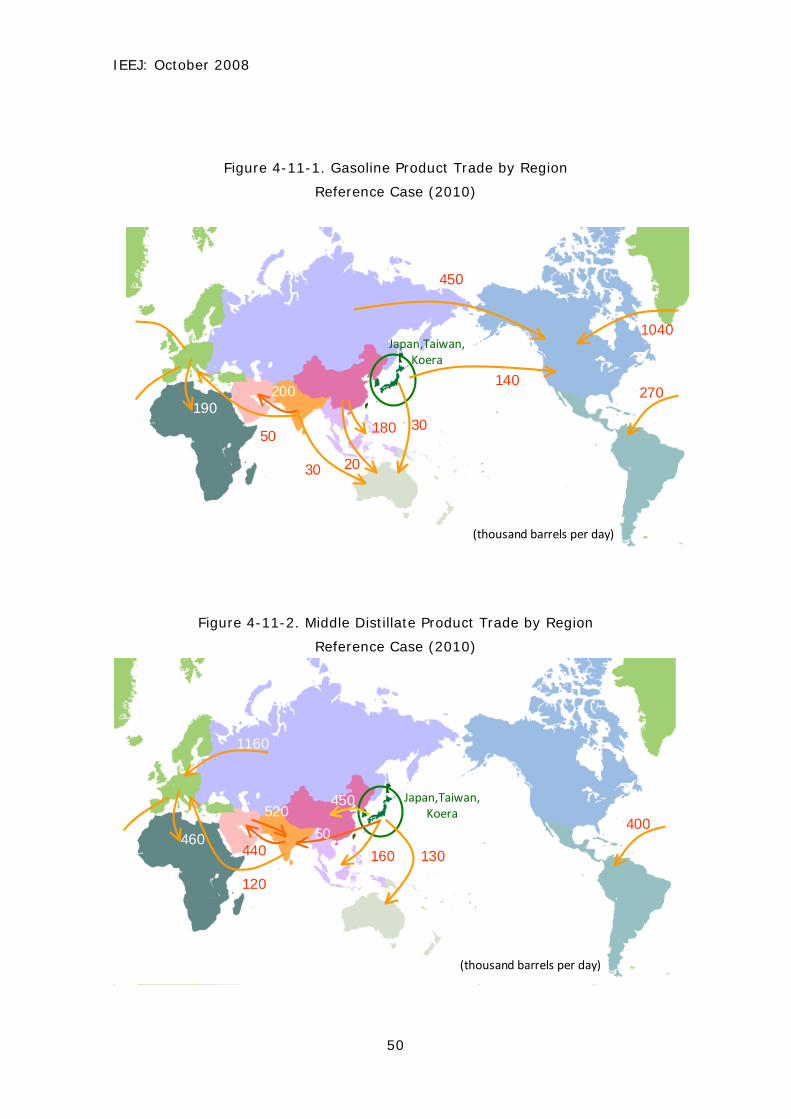
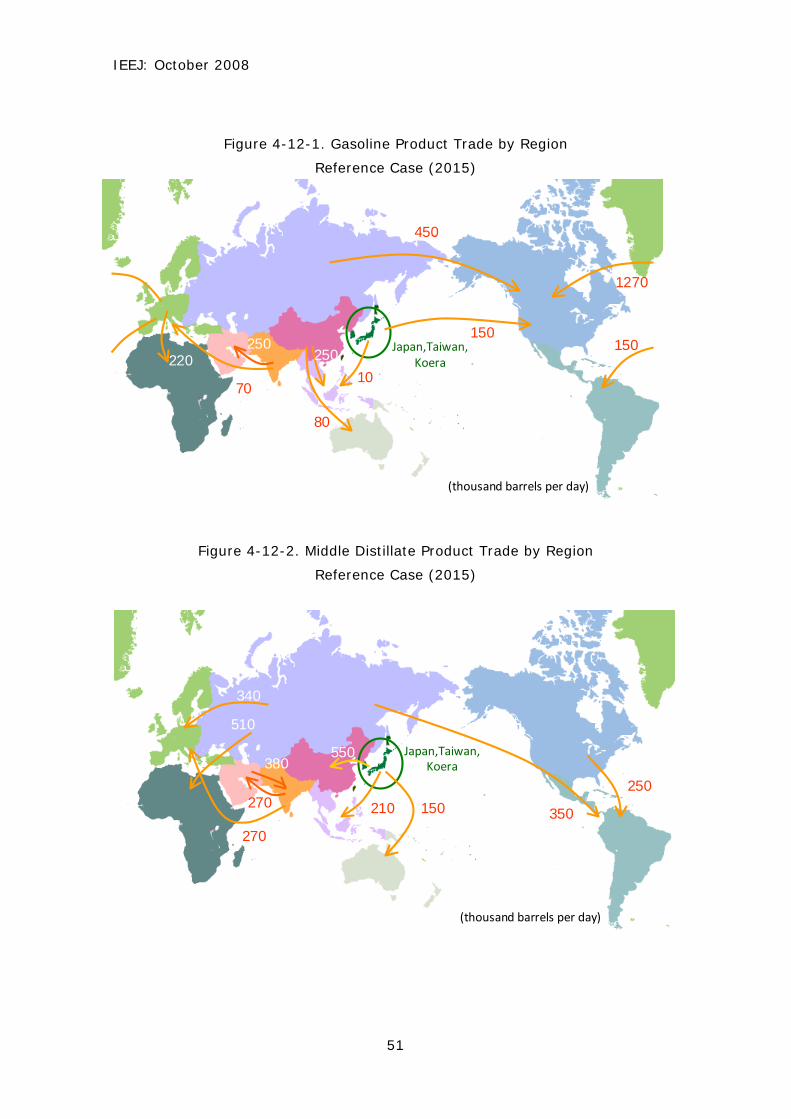
(2) Product Trade (Reference Case)
Trade flow diagram based on the results of estimation with the LP model are
shown in Figures 4-10 (2005), 4-11 (2010) and 4-12 (2015). 4 Trade flow
diagram is shown in terms of net exports (or net imports). However, for exports
and imports from the South Asian region, exports (imports) are shown by dividing
them into those from export-oriented oil refineries in India and other oil refineries
for domestic supplies in order to look into the effects of export-oriented oil
refineries in India. The results of optimization calculations indicate that although
there will be no major structural changes in the trade flow in the Atlantic region,
inter-regional trade from East Asia, the Middle East and South Asia will undergo
the following changes.
(i) Gasoline
(a) Gasoline exports from East Asia (mostly from Japan) will be oriented to
Oceania (Australia) and the United States (the west coast). Japan’s exports to
the United States5 are projected to increase from 0.08 million B/D in 2005 to
0.11 million B/D in 2010 and 0.12 million B/D in 2015.
(b) The Middle East region’s net gasoline imports are projected to continue
from 2005 until 2015 and these imports will come chiefly from South Asia
(India). India’s exports will be expanded to 0.28 million B/D to the Middle
East, Oceania, and Europe in 2010 and further to 0.32 million B/D in 2015.
(ii) Middle Distillate
(a) Exports from East Asia will be oriented to China, the ASEAN, and South
Asia. Japan’s exports are projected to increase from 0.40 million B/D in 2005
to 0.45 million B/D in 2010 and further to 0.65 million B/D in 2015.
(b) While imports from outside the region will continue to meet
intra-regional demand in South Asia, extra-regional exports far exceeding
intra-regional-imports will occur. The destination of exports from India’s
export-oriented oil refineries will be expanded from the neighboring areas to
Europe. Exports are projected to increase to 0.56 million B/D in 2010
(including 0.12 million B/D to Europe) and to 0.54 million B/D in 2015
(including 0.27 million B/D to Europe).
4 All trade flow is not counted but rather simplified (for details, refer to Annex 4). The numbers for 2005 are not results but are net exports based on the world’s optimized operation level. 5 In the LP model, gasoline quality standards are established chiefly on the octane number and the sulfur content. For the olefin content and vapor pressure, standard values that are as stringent as those set by the State of California are not taken into consideration.
IEEJ: October 2008
49
Figure 4-10-1. Gasoline Product Trade by Region
– Reference Case (2005)
Figure 4-10-2. Middle Distillate Product Trade by Region
Reference Case (2005)
1040
190
21090
(thousand barrels per day)
170
70
20
40
50
Japan,Taiwan,Koera
1030
80
280
140180
130 70
250320
160
Japan,Taiwan,Koera
(thousand barrels per day)
IEEJ: October 2008
50
Figure 4-11-1. Gasoline Product Trade by Region
Reference Case (2010)
Figure 4-11-2. Middle Distillate Product Trade by Region
Reference Case (2010)
1040
450
190270200
5030
30
140
180
20
(thousand barrels per day)
Japan,Taiwan,Koera
160 130440
520
120
400
1160
460
450
50
(thousand barrels per day)
Japan,Taiwan,Koera
IEEJ: October 2008
51
Figure 4-12-1. Gasoline Product Trade by Region
Reference Case (2015)
Figure 4-12-2. Middle Distillate Product Trade by Region
Reference Case (2015)
1270
450
220150250
70
25010
150
80
(thousand barrels per day)
Japan,Taiwan,Koera
210 150
380
270
340
550
350
250
510
270
(thousand barrels per day)
Japan,Taiwan,Koera
IEEJ: October 2008
52
(3) Supply-Demand Balance by Region (High Price Case)
Figure 4-13 shows the results of estimation of the demand balance by region in
2010 and Figure 4-14 shows those in 2015. Since intra-regional demand is
projected to drop to a level lower than that estimated in “Reference case”, imports
from outside the regions will decrease, thereby easing the strain on supply. In
regions where there is a surplus refining capacity to export products to
extra-regional markets, the utilization rate of the CDU(or the utilization rate of the
secondary unit ) will decline and exports will decrease, with the result that the
amount of excesses and shortages in each region will decrease.
Figure 4-13. Comparison of the Product Supply-Demand Balance by Region
High Price Case (2010)
Figure 4-14. Comparison of the Product Supply-Demand Balance by Region
High Price Case (2015)
-1,384
-183
3 45 8249
-66
0
-544
-145
880
108 -5 0198
-138-185 -173
1,327
378
-18
209
-435-129
-2000
-1500
-1000
-500
0
500
1000
1500
N. Americ
a
L.Americ
a
Europe
Form
er USS
RAfric
a
Middle East
China
Japan
Taiw
an, S.Kore
aAse
an
Other A
sia
Oceania
gasoline
middle distil lates
Net Export
(thousand barrels per day)
-1,409
1,389
-242
17 35 160
-634
-284
932
78
-148
120282
-169-171
348
-185-36
311
-73
-490
450
-138
-2000
-1500
-1000
-500
0
500
1000
1500
2000
N. Americ
a
L.Americ
a
Europe
Form
er USS
RAfric
a
Middle East
China
Japan
Taiw
an, S.Kore
aAse
an
Other A
sia
Oceania
gasoline
middle distillates
Net Export
(thousand barrels per day)
IEEJ: October 2008
53
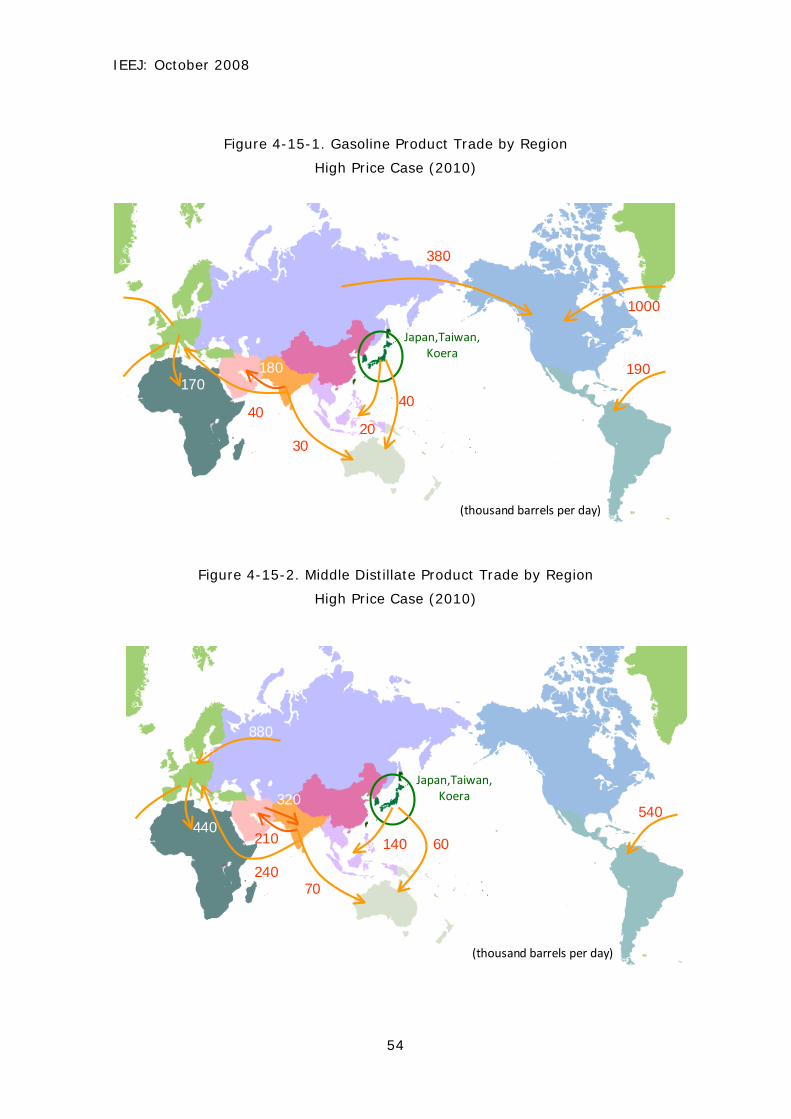
(4) Product Trade (High Price Case)
(i) Gasoline
(a) The United States’ gasoline imports will decrease to approximately 70%
of those assumed in “Reference case”, with the result that exports from East
Asia (Japan, South Korea and Taiwan) will go mainly to the ASEAN and
Oceania and exports to the United States will decrease sharply6 (to become
zero in the LP model).
(b) Japan’s exports to Oceania are projected to reach 0.04 million B/D in
2010 and to 0.08 million B/D in 2015.
(c) Gasoline exports from India’s export-oriented oil refineries to Europe will
decrease substantially compared with those assumed in the reference case
and will compete with Japan in exports to Oceania.
(ii) Middle Distillate
(a) For middle distillate, projections similar to those for gasoline are possible.
Since demand from China, the ASEAN, Oceania and the United States will
decrease, exports by Japan, South Korea and Taiwan to these regions will be
reduced.
6 In the LP model, from which region, the B region or the C region, exports to a certain region (referred to as the “A region”) will originate is determined depending on which region entails a smaller amount of the total cost of {∑ (the production cost of petroleum products) + ∑(the export cost of petroleum products)}. Accordingly, the size of the capacity utilization rate and the refining costs determined by a difference in the composition of secondary units in the respective regions will be added. It will not simply be determined solely by a difference in the export freight from both regions (the B or C region) to the A region.
IEEJ: October 2008
54
Figure 4-15-1. Gasoline Product Trade by Region
High Price Case (2010)
Figure 4-15-2. Middle Distillate Product Trade by Region
High Price Case (2010)
1000
380
170190180
4020
40
30
(thousand barrels per day)
Japan,Taiwan,Koera
140 60210
320
240
540
880
440
70
(thousand barrels per day)
Japan,Taiwan,Koera
IEEJ: October 2008
55
Figure 4-16-1. Gasoline Product Trade by Region
High Price Case (2015)
Figure 4-16-2. Middle Distillate Product Trade by Region
High Price Case (2015)
1060
350
190170240
3030
40
20 20
(thousand barrels per day)
Japan,Taiwan,Koera
130 130
80
480
630
930
490
150
40
(thousand barrels per day)
Japan,Taiwan,Koera
IEEJ: October 2008
56
Chapter 5: Conclusion
5.1 Summary
(1) Petroleum Product Demand
(a) Given economic growth in the Asian region, including China and India, in
the reference case that assumes continued steady growth, petroleum product
demand in the world is projected to grow by 1.6% during the 2005-2010
period and by 1.8% during the 2010-2015 period.
(b) In the “High price case” in which the present crude oil price level ($100)
will continue and is assumed to remain unchanged from 2010 onward, the
rate of growth in product demand in the world is projected to decline by 0.7%
during the 2005-2010 period and by 1.3% during the 2010-2015 period.
(2) Refining Capacity
(a) A survey of projects designed to expand refining capacity as of the
beginning of 2008 leads us to conclude that those projects, which are to be
completed by around 2010, will be carried out as planned. CDU capacity will
be expanded by approximately 6.10 million B/D, or by 1.4% annually.
(b) The supply-demand environment, at least from 2008 to 2010, will
become a decisive factor in estimating refining capacity in 2015. In
“Reference case”, large projects will be carried out steadily to expand CDU
capacity by around 9.60 million B/D, or by 2.0% annually, while in the high
price case in which demand is assumed to decline, numerous capacity
expansion projects will be deferred, so CDU capacity will be expanded by only
about 7.00 million B/D, or by 1.5% annually.
(3) Supply and Demand for Petroleum Products
(i) Reference Case
While petroleum product demand will continue to growth steadily, the
corresponding refining capacity expansion will generally be achieved, so that as in
the present situation, the tightening supply situation for petroleum products will
continue from 2010 onward. The utilization rate of refining capacity is projected to
remain at high levels and increase from 90.3% in 2005 to 91.6% in 2010 and to
91.5% in 2015.
(ii) High Price Case
IEEJ: October 2008
57
As growth in petroleum product demand will slow down, the tightening on supply
that will occur from 2010 onward will be eased slightly. The utilization rate is
projected to drop to 87.5% in 2010 and to 86.9% in 2015.
(4) Supply and Demand for Petroleum Products and Product Trade by Region
(i) During the period from the 1990s to the first half of the 2000s, product trade
was intra-regional: (a) in the Atlantic region where excesses and shortages were
adjusted (traded) among North America, Europe and Russia; and (b) in the East
Asian region where excesses and shortages in China and the ASEAN region were
adjusted (traded) chiefly by the refining capacities of Japan, South Korea and
Taiwan.
(ii) From 2005 onwards, particularly during the period from 2010 to 2015, the
world trade flow is such that while there will be no major changes in the structure
of intra-regional excesses and shortages in the Atlantic region, there will be a
major change,
(a) in South Asia (India) and the Middle East region where intra-regional
shortages will turn to surpluses; and
(b) in East Asia where intra-regional surplus, mostly in Japan, will expand
rapidly.
Product surpluses will be expanded in South Asia, the Middle East, and the East
Asian region; exports to the Atlantic region (chiefly Europe and the United States)
and the eastern part of the Pacific region (the west coast of the United States,
Latin America and Australia) will increase and inter-regional trade (world trade)
will become lively.
(iii) Points to be considered by region can be summarized as follows.
(a) China
Refining capacity expansion projects will be carried out almost as planned,
with the result that refining capacity (Crude distillation units) will reach 9.00
million B/D in 2010 and 11.00 million B/D in 2015; this nation will become a
net exporter of gasoline and slight net importer of middle distillates, thus
maintaining the self-supply system generally.
(b) India
Refining capacity will reach 1.5 million B/D in the private companies, 2.5
IEEJ: October 2008
58
million B/D at the state-owned companies, and 4.00 million B/D in total by
2010. India’s export capacity (excluding exports to the South Asian region)
will almost equal private companies’ refining capacity and will amount to
approximately 1.00 million B/D as equivalent to the amount of gasoline and
middle distillate production.
(c) The Middle East
Refining capacity will reach approximately 8.30 million B/D in 2010 and
approximately 10.40 million B/D in 2015. Intra-regional demand will grow at
a high rate, Iran and Iraq will experience a shortage of refining capacity, and
imports of petroleum products, mostly gasoline, from outside the region will
continue. Making progress in Saudi Arabia’s new oil refining construction
project, which is delayed, holds the key to success in expanding
intra-regional supplies and enhancing product export capacity.
(d) The United States
Petroleum product demand will continue to grow and there will be a shortage
of refining capacity. In “Reference case”, gasoline imports will reach
approximately 1.90 million B/D (petroleum product imports will be about half
of this amount) in 2010 and 2015.
(e) Europe
Between 2005 and 2015, gasoline demand will decrease and gas oil demand
will increase a little, so the supply-demand balance consisting of gasoline
exports and middle distillate imports will continue.
(f) East Asia (Excluding China) and South Asia
Exports from the East Asian region (excluding China) will go chiefly to China,
Southeast Asia, Oceania, and North America (the west coast), while exports
from South Asia and the Middle East will go primarily to Europe, Africa and the
Oceania region, resulting in no competition, except for Oceania.
(g) East Asia (Excluding China) and the United States
Japan, South Korea and Taiwan will compete with one another because their
export markets overlap each other. In regard to Japan’s exports, it may be
interesting to note that in the “Reference case” that assumes a steady
IEEJ: October 2008
59
increase in the world demand and a strained supply, Japan will be able to
export 0.59 million B/D of gasoline and middle distillates in 2010 and 0.77
million B/D in 2015. This represents approximately 16% of the present crude
oil processing capacity (or 20% in crude oil equivalent).
(h) South Asia and the Middle East
South Asia, which is ahead of other regions in the buildup of refining capacity,
will prevail in exports to the European and American markets during the
period from 2010 to 2015. However, if from 2012 onward, export-oriented oil
refineries come on line as planned in the Middle East region, there will be
intensifying competition between South Asia and the Middle East for exports
to the European and American markets.
5.2 Conclusions
The results of optimization calculation with the LP model can be summarized as
follows, with emphasis placed on Japan
(1) Japan’s Surplus Refining Capacity and Export Capacity
If steady growth in the product demand in the world results in a strained supply
(Reference case), a look at Japan’s refining capacity (approximately 4.80 million
B/D) shows that approximately 20% of Japan’s surplus refining capacity (or 16%
on the gasoline and middle distillate basis) will be fully utilized – mainly for
exports of high-quality (very low sulfur-content) petroleum products.
(2) Main Export Markets
Jet fuel, gas oil and other middle distillates will be exported mainly to the Asian
region (China, the ASEAN nations and Australia), while gasoline will be exported
mainly to the west coast of the United States and the Australian region.
(3) Inter-Regional and Intra-Regional Competition
Regarding inter-regional competition, there will be no competition between South
Asia / Middle East, which export their products chiefly to the European and African
markets, and East Asia, which targets the Pacific region (including Japan, South
Korea and Taiwan but excluding China), with the exception of Australia.
However, analysis of the relations among three countries in the East Asian region
– namely, Japan, South Korea and Taiwan – shows that because Japan’s export
market overlaps with those of South Korea and Taiwan with a slow growth in
IEEJ: October 2008
60
domestic demand and large surplus supply capacity, keener competition among
these countries is most likely to occur in the years ahead.
5.3 Challenges Ahead
The above conclusions need to give full consideration to the following constraints
and may have to be analyzed and assessed more elaborately and accurately.
(1) Exports of Gasoline and Gas Oil from Japan, South Korea and Taiwan into the
United States
(a) East Asia’s (excluding China) surplus capacity will be used effectively to
provide exports to the United States (particularly to the west coast) that suffers
from a supply shortage, resulting in a rise in the utilization rate. Because Japan
must reduce the sulfur content of gasoline and gas oil to 10 ppm in 2005, South
Korea in 2009, and Taiwan in 2011, products of generally uniform quality will be
exported from the East Asian region to the regions, including the United States,
Oceania and the ASEAN.
(b) Japan has a higher secondary unit composition ratio than South Korea
and Taiwan. On the other hand, South Korea and Taiwan have established export
units. In the LP model, however, refining capacity and quality standards alone are
considered as conditions and the assessment of logistics is not taken into
consideration. As a result, Japan’s utilization rate will increase to a level higher
than that of the actual level and its exports will tend to be overestimated.
(c) Because the United States is assumed to be a single market (uniform
quality), standards (olefin content, vapor pressure, aroma content, etc.) for
gasoline on the west coast of the United States, particularly gasoline in California
(CARBOB), are not accounted for. Japan’s standard gasoline, which comprises
mainly FCC gasoline, is far from meeting the standards. In actuality, therefore,
blending materials for gasoline such as Alkylate must be changed. Accordingly,
the results of LP estimation tend to assume exports to be larger than actual levels.
(2) Treatment of Export-oriented Oil Refineries in South Asia and the Middle East
region
(a) Export-oriented oil refineries in India in South Asia are assumed to be
intended solely for exports, but the oil refineries to be constructed (in 2012) in the
IEEJ: October 2008
61
Middle East region are not assumed to be export-oriented in the LP models.
(b) As a result, where exports to the European and American regions actually
occur, intra-regional (to Iran and Iraq, etc.) supply is assumed to occur by priority.
Exports to Europe and the United States from the Middle East region are