SUPPLY CHAIN EXPENDITURE AND PREPAREDNESS INVESTMENT OPPORTUNITIES A COOPERATIVE STUDY BY HELP LOGISTICS AG, KUEHNE LOGISTICS UNIVERSITY AND THE INTERNATIONAL FEDERATION OF RED CROSS AND RED CRESCENT SOCIETIES DECEMBER 2018 Photo: Philippine Red Cross Photo: Htien Win
Transcript
SUPPLY CHAIN EXPENDITURE AND PREPAREDNESS INVESTMENT OPPORTUNITIES
A COOPERATIVE STUDY BY HELP LOGISTICS AG, KUEHNE LOGISTICS UNIVERSITY AND THE INTERNATIONAL FEDERATION OF RED CROSS AND RED CRESCENT SOCIETIES
DECEMBER 2018
Phot
o: P
hilip
pine
Red
Cro
ss
Phot
o: H
tien
Win
Supply Chain Expenditure and Preparedness Investment Opportunities I
SUPPLY CHAIN EXPENDITURE AND PREPAREDNESS INVESTMENT OPPORTUNITIES
A Cooperative Study by HELP Logistics AG, Kuehne Logistics University and the International Federation of Red Cross and Red Crescent Societies
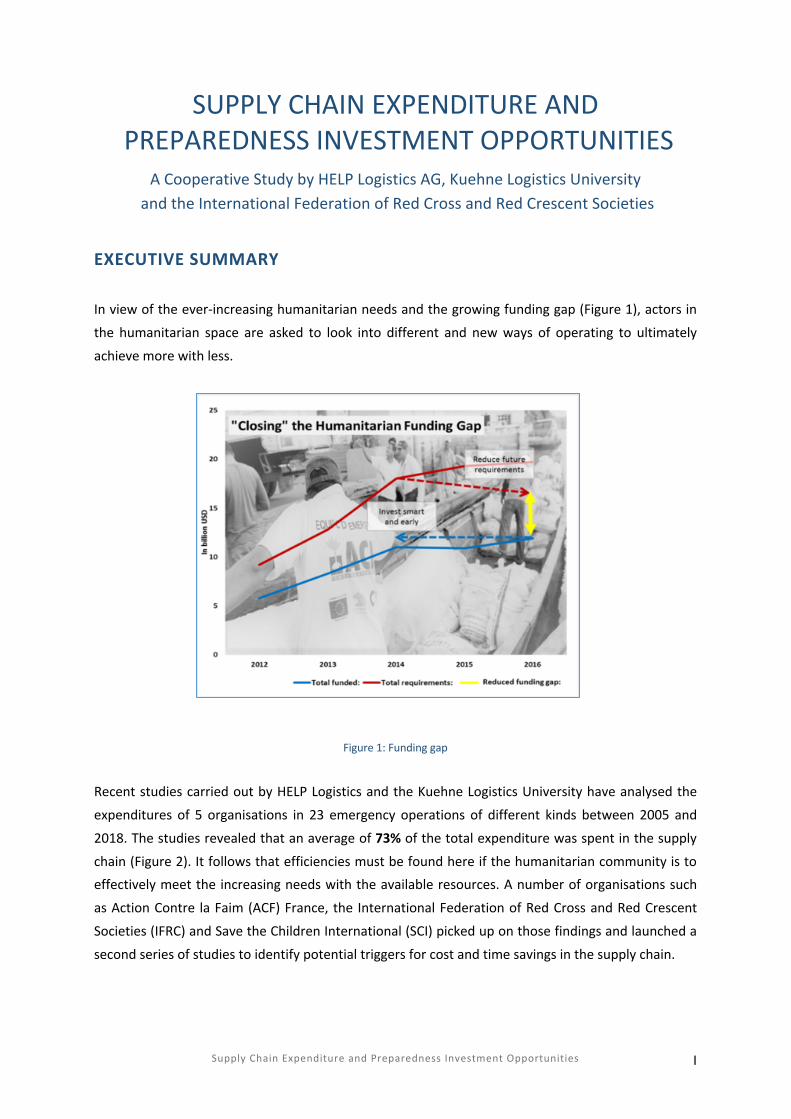
EXECUTIVE SUMMARY In view of the ever-increasing humanitarian needs and the growing funding gap (Figure 1), actors in
the humanitarian space are asked to look into different and new ways of operating to ultimately
achieve more with less.
Figure 1: Funding gap
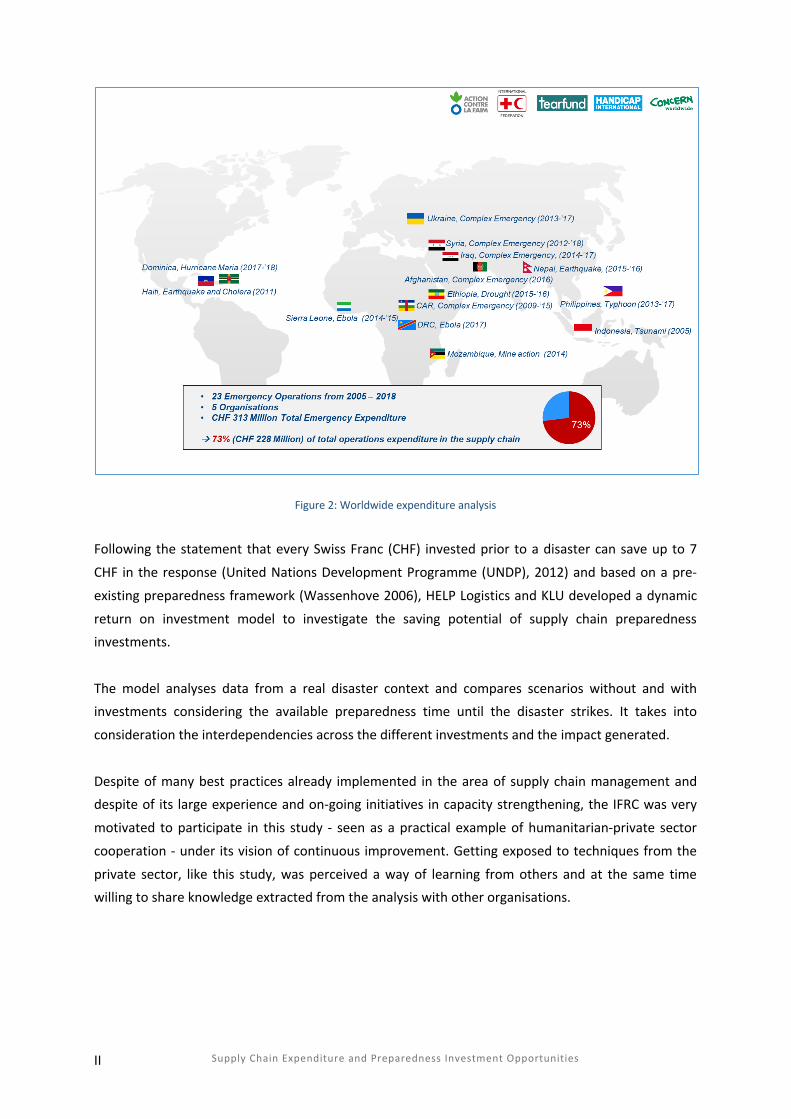
Recent studies carried out by HELP Logistics and the Kuehne Logistics University have analysed the
expenditures of 5 organisations in 23 emergency operations of different kinds between 2005 and
2018. The studies revealed that an average of 73% of the total expenditure was spent in the supply
chain (Figure 2). It follows that efficiencies must be found here if the humanitarian community is to effectively meet the increasing needs with the available resources. A number of organisations such
as Action Contre la Faim (ACF) France, the International Federation of Red Cross and Red Crescent
Societies (IFRC) and Save the Children International (SCI) picked up on those findings and launched a
second series of studies to identify potential triggers for cost and time savings in the supply chain.
Supply Chain Expenditure and Preparedness Investment Opportunities II
Figure 2: Worldwide expenditure analysis
Following the statement that every Swiss Franc (CHF) invested prior to a disaster can save up to 7
CHF in the response (United Nations Development Programme (UNDP), 2012) and based on a pre-
existing preparedness framework (Wassenhove 2006), HELP Logistics and KLU developed a dynamic
return on investment model to investigate the saving potential of supply chain preparedness investments.
The model analyses data from a real disaster context and compares scenarios without and with investments considering the available preparedness time until the disaster strikes. It takes into
consideration the interdependencies across the different investments and the impact generated.
Despite of many best practices already implemented in the area of supply chain management and despite of its large experience and on-going initiatives in capacity strengthening, the IFRC was very
motivated to participate in this study - seen as a practical example of humanitarian-private sector
cooperation - under its vision of continuous improvement. Getting exposed to techniques from the
private sector, like this study, was perceived a way of learning from others and at the same time willing to share knowledge extracted from the analysis with other organisations.
Supply Chain Expenditure and Preparedness Investment Opportunities III
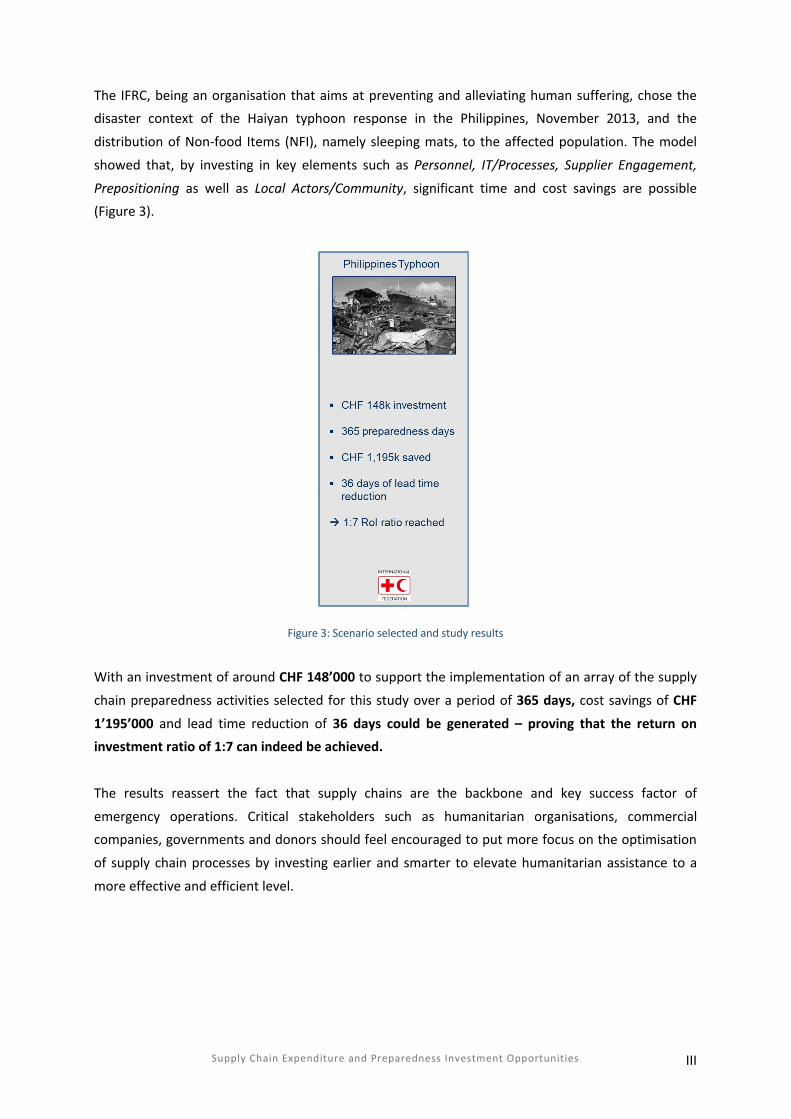
The IFRC, being an organisation that aims at preventing and alleviating human suffering, chose the disaster context of the Haiyan typhoon response in the Philippines, November 2013, and the
distribution of Non-food Items (NFI), namely sleeping mats, to the affected population. The model
showed that, by investing in key elements such as Personnel, IT/Processes, Supplier Engagement,
Prepositioning as well as Local Actors/Community, significant time and cost savings are possible (Figure 3).
Figure 3: Scenario selected and study results
With an investment of around CHF 148’000 to support the implementation of an array of the supply
chain preparedness activities selected for this study over a period of 365 days, cost savings of CHF
1’195’000 and lead time reduction of 36 days could be generated – proving that the return on investment ratio of 1:7 can indeed be achieved.
The results reassert the fact that supply chains are the backbone and key success factor of
emergency operations. Critical stakeholders such as humanitarian organisations, commercial companies, governments and donors should feel encouraged to put more focus on the optimisation
of supply chain processes by investing earlier and smarter to elevate humanitarian assistance to a
more effective and efficient level.
Supply Chain Expenditure and Preparedness Investment Opportunities IV
CONTENTS
EXECUTIVE SUMMARY ................................................................................................................... I
CONTENTS .................................................................................................................................... IV
LIST OF FIGURES ............................................................................................................................ V
LIST OF ABBREVIATIONS .............................................................................................................. VI
2.2 Data Collection and Analysis ..................................................................................................................... 1
3. RETURN ON INVESTMENT METHODOLOGY AND MODEL FRAMEWORK ................................ 4
3. APPLICATION OF THE MODEL ................................................................................................... 6
3.1 Phase 1: Define Baseline Scenario ............................................................................................................. 6 3.1.1 Define the Disaster Context and Response Operation Parameters .......................................................... 8 3.1.2 Describe the Baseline Scenario ................................................................................................................. 9 3.1.3 Collect and Inject Data for the Baseline Scenario Model ........................................................................ 10
Supply Chain Expenditure and Preparedness Investment Opportunities V
LIST OF FIGURES
FIGURE 1: FUNDING GAP ......................................................................................................................... I
FIGURE 2: WORLDWIDE EXPENDITURE ANALYSIS ................................................................................... II
FIGURE 3: SCENARIO SELECTED AND STUDY RESULTS ........................................................................... III
FIGURE 4: SUPPLY CHAIN EXPENDITURE OF SELECTED EMERGENCIES ................................................... 2
FIGURE 5: SUPPLY CHAIN EXPENDITURE OF SELECTED EMERGENCIES ................................................... 2
FIGURE 6: BREAKDOWN BY DISASTER TYPE AND EXPENDITURE CATEGORY .......................................... 3
FIGURE 7: ARCHITECTURE OF THE ROI MODEL ....................................................................................... 4
FIGURE 8: METHODOLOGY OF THE ROI MODEL ..................................................................................... 5
FIGURE 9: FLOW OF SURGE PERSONNEL DEPLOYED FROM THE IFRC NETWORK IN RESPONSE TO
MEGA DISASTERS .................................................................................................................................... 7
FIGURE 10: GENERAL IFRC SUPPLY CHAIN IN THE CONTEXT OF THE PHILIPPINES ................................. 8
FIGURE 11: MONITORING THE SCALE OF THE UPCOMING TYPHOON .................................................... 9
FIGURE 12: FLOW OF GOODS IN IFRC‘S BASELINE SCENARIO ............................................................... 10
FIGURE 13: INVESTMENTS AND COST SAVINGS OVER TIME ................................................................. 16
FIGURE 14: TREND OF COST ROI ........................................................................................................... 16
FIGURE 15: ESTIMATION OF INVESTMENTS SELECTED FOR THE STUDY ............................................... 17
FIGURE 16: OVERALL RESULTS OF THE MODEL AT DAY 365 ................................................................. 17
FIGURE 17: REDUCTIONS IN COST AND TIME AT DAY 365 .................................................................... 18
Supply Chain Expenditure and Preparedness Investment Opportunities VI
LIST OF ABBREVIATIONS
ACF: Action Contre la Faim
CHF: Swiss Franc(s)
DRC: Democratic Republic of Congo
DREF: Disaster Response Emergency Fund
ERU: Emergency Response Unit
FACT: Field Assessment and Coordination Team
FOS: Federation-owned Stocks
HNS: (Red Cross or Red Crescent) Host National Society
IFRC: International Federation of Red Cross and Red Crescent Societies
MSU: Mobile Storage Unit
NDRT: National Disaster Response Teams
NFI: Non-food Item
NS: (Red Cross or Red Crescent) National Society
PNS: (Red Cross or Red Crescent) Partner National Society
RDRT: Regional Disaster Response Teams
ROI: Return on Investment
RoRo: Roll-on-roll-off
RLU: Regional Logistics Unit;
now called Operational LPSCM Unit
(Logistics, Procurement and Supply Chain Management)
SCI: Save the Children International
UNDP: United Nations Development Programme
VCI: Vendor-consigned Inventory
Supply Chain Expenditure and Preparedness Investment Opportunities 1
1. INTRODUCTION
This report outlines the methodology of the Supply Chain Expenditure study as well as the Return on
Investment (RoI) model and its application in the supply chain preparedness project with the IFRC conducted from May to September 2018. It furthermore presents and discusses the findings of the
project and concludes on potential next steps to further enhance the response capacity of the IFRC
(considering its Secretariat together with its members of the Red Cross Red Crescent National
Societies) and other actors operating in the humanitarian space.
2. SUPPLY CHAIN EXPENDITURE
As a first step in the analysis, HELP Logistics, KLU and the IFRC investigated 7 disasters around the
globe of different types with respect to their expenditures1. The approach and the findings are
outlined in the following section.
2.1 Emergency Selection In order to cover different geographical locations, types of disasters (natural, complex, medical, and
population movement) and finance models (Disaster Response Emergency Fund (DREF) and
Emergency Appeal)2, a total of 7 emergency operations were selected: § Natural disasters (Typhoon Haiyan in the Philippines, 2013-2017; Hurricane Maria in
Dominica, 2017-2018; Drought in Ethiopia, 2015-2016)
§ Complex emergencies (Syria, 2012-2018 and Ukraine, 2013-2017)
§ Medical emergency (Ebola, Democratic Republic of Congo (DRC), 2017) § Population movement response (Iraq, 2016-2017)
2.2 Data Collection and Analysis Data on the expenses (total of CHF 235’661’426) of the selected operations was collected from IFRC’s finance department and categorised as supply chain and non-supply chain related cost. Major
components of the supply chain related costs were salaries, office space and supplies and travel of
staff with functions related to supply chain, as well as procurement, transportation and storage of
relief commodities. After several discussions with IFRC, it was decided to include the cash transfer 1 Data used is publicly available via the IFRC Operational reports published in its website http://www.ifrc.org/appeals 2 Disaster Response Emergency Fund (DREF) for small and medium scale of emergencies that allows the national societies of the IFRC to carry out their role as first responders to a disaster, as well as the Emergency Appeal for disasters that surpass National Societies’ capacity to respond
Supply Chain Expenditure and Preparedness Investment Opportunities 2
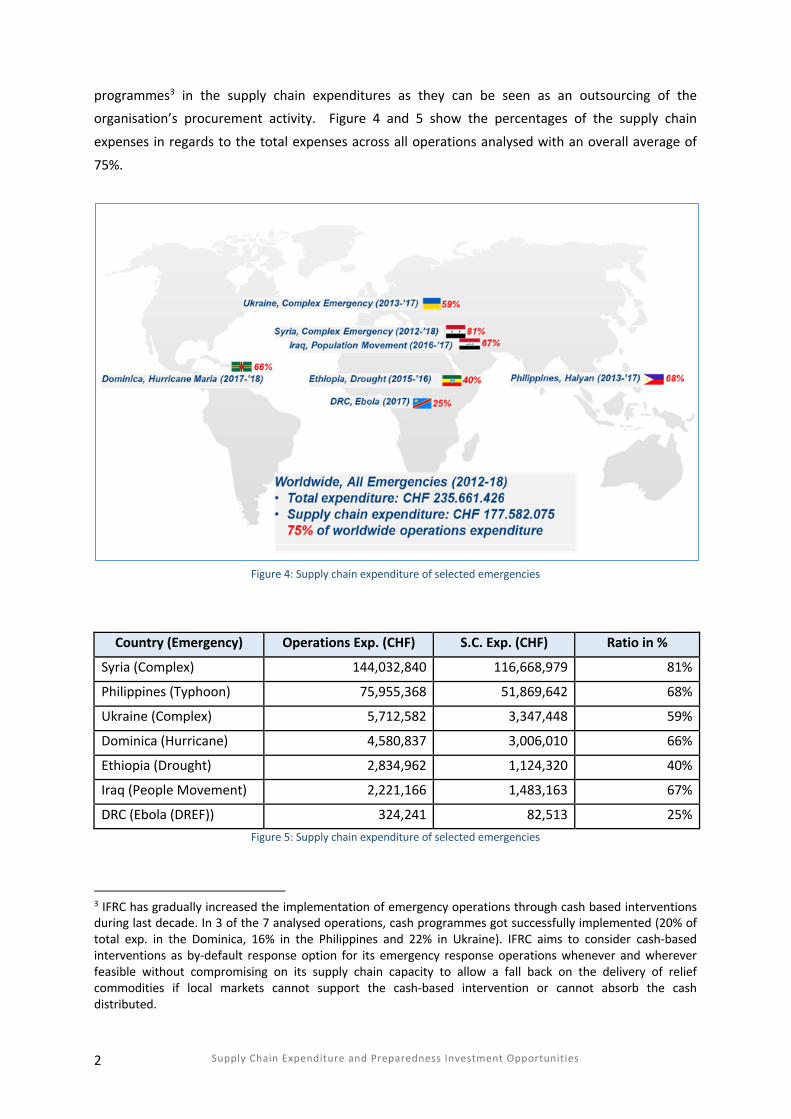
programmes3 in the supply chain expenditures as they can be seen as an outsourcing of the organisation’s procurement activity. Figure 4 and 5 show the percentages of the supply chain
expenses in regards to the total expenses across all operations analysed with an overall average of
75%.
Figure 4: Supply chain expenditure of selected emergencies
Country (Emergency) Operations Exp. (CHF) S.C. Exp. (CHF) Ratio in %
3 IFRC has gradually increased the implementation of emergency operations through cash based interventions during last decade. In 3 of the 7 analysed operations, cash programmes got successfully implemented (20% of total exp. in the Dominica, 16% in the Philippines and 22% in Ukraine). IFRC aims to consider cash-based interventions as by-default response option for its emergency response operations whenever and wherever feasible without compromising on its supply chain capacity to allow a fall back on the delivery of relief commodities if local markets cannot support the cash-based intervention or cannot absorb the cash distributed.
Supply Chain Expenditure and Preparedness Investment Opportunities 3
Across all 7 emergencies, the percentage varies between 59% to 81%, except for the drought response in Ethiopia (40%) and the Ebola response in DRC (25%). For Ethiopia, it should be noticed
that the overheads for general and personnel costs were, data-wise, not possible to be broken into
supply chain and non-supply chain related costs.
The IFRC counts with a specific tool to quickly provide an initial set of funds to start relief operations
in the ground in response to a new humanitarian crisis, while the normal fund-raising mechanisms
are launched to engage with funding partners: the Disaster Response Emergency Fund (DREF). It can
be used for any type and any scale of disaster to enable kicking-off relief activities of the National Society. As explained in the 2.1 Emergency Selection, a wide range of different types of emergencies
was selected, and one of them was a small-scale operation: the Ebola outbreak in DRC 2017 (where
no Emergency Appeal was launched, and only DREF money was used). Due to the time limitations of the study, it was not possible to include other small/medium scale operations (funded only via DREF),
where the ratio of supply chain related expenditures would have been similar to the other 6
operations analysed (between 59% to 81% of total expenditure). In the case of the selected Ebola
operation implemented in DRC during 2017 (Glide number: EP-2017-000048-COD), it was a small scale operation where the Red Cross of the Democratic Republic of the Congo focused its work to
contribute to the containment of the outbreak via community engagement and social mobilisation to
prevent and control infections - while medical treatment was carried out by other organisations. For
that reason, the IFRC project did not require a major supply chain set-up on the ground.
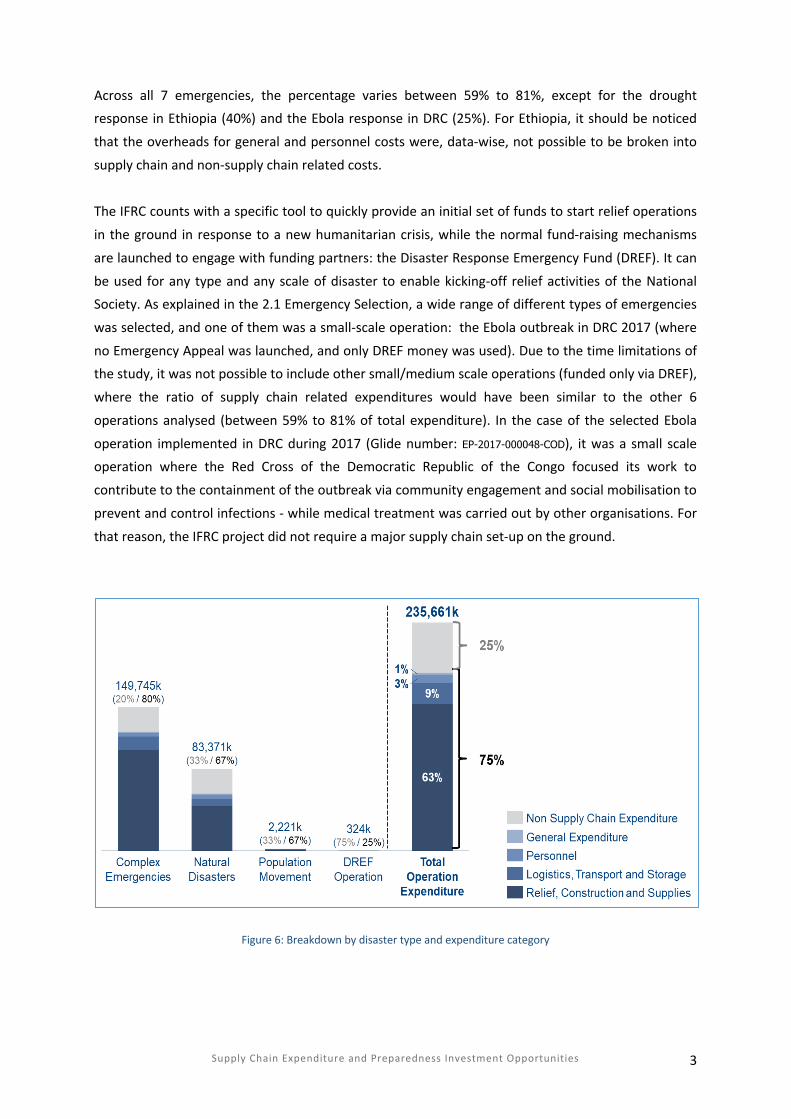
Figure 6: Breakdown by disaster type and expenditure category
Supply Chain Expenditure and Preparedness Investment Opportunities 4
Comparing the different types of emergencies, IFRC’s complex emergencies have clearly the highest share of supply chain expenses (80%); caused by access restrictions due to security concerns. Within
the total operation expenditure, the vast majority of supply chain related cost was on the Purchase
of Supplies (63%), followed by Logistics, Transport and Storage (9%), Personnel with supply chain
relevant functions (3%) and General Expenditure (1%).
3. RETURN ON INVESTMENT METHODOLOGY AND MODEL FRAMEWORK
In the aftermath of the World Humanitarian Summit 2016, HELP Logistics and KLU developed an
analytical approach that equips humanitarian actors with an enhanced understanding of investment
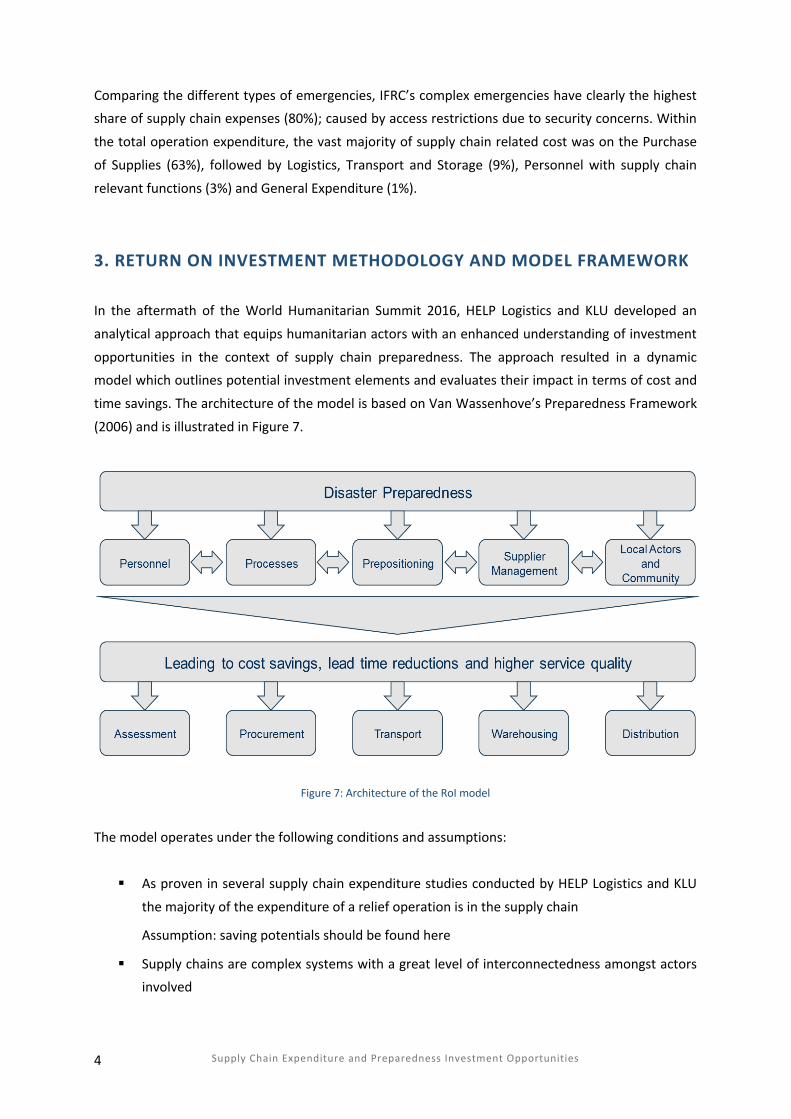
opportunities in the context of supply chain preparedness. The approach resulted in a dynamic model which outlines potential investment elements and evaluates their impact in terms of cost and
time savings. The architecture of the model is based on Van Wassenhove’s Preparedness Framework
(2006) and is illustrated in Figure 7.
Figure 7: Architecture of the RoI model
The model operates under the following conditions and assumptions:
§ As proven in several supply chain expenditure studies conducted by HELP Logistics and KLU
the majority of the expenditure of a relief operation is in the supply chain
Assumption: saving potentials should be found here
§ Supply chains are complex systems with a great level of interconnectedness amongst actors involved
Supply Chain Expenditure and Preparedness Investment Opportunities 5
Assumption: supply chain investments cannot be looked at in isolation but from a holistic view point
§ The RoI model has been designed to reflect and analyse a real operational environment
Assumption: the successful set-up and application of the model depend heavily on a critical
mass of data input provided by the participating organisation
§ Preparedness investments take time until they fully unfold
Assumption: the time between investment decision and disaster to happen has strong impact on the calculated return of investment
§ Investments cost can be one-off (e.g. development of IT system) or continuous (e.g. holding
cost for pre-positioned items)
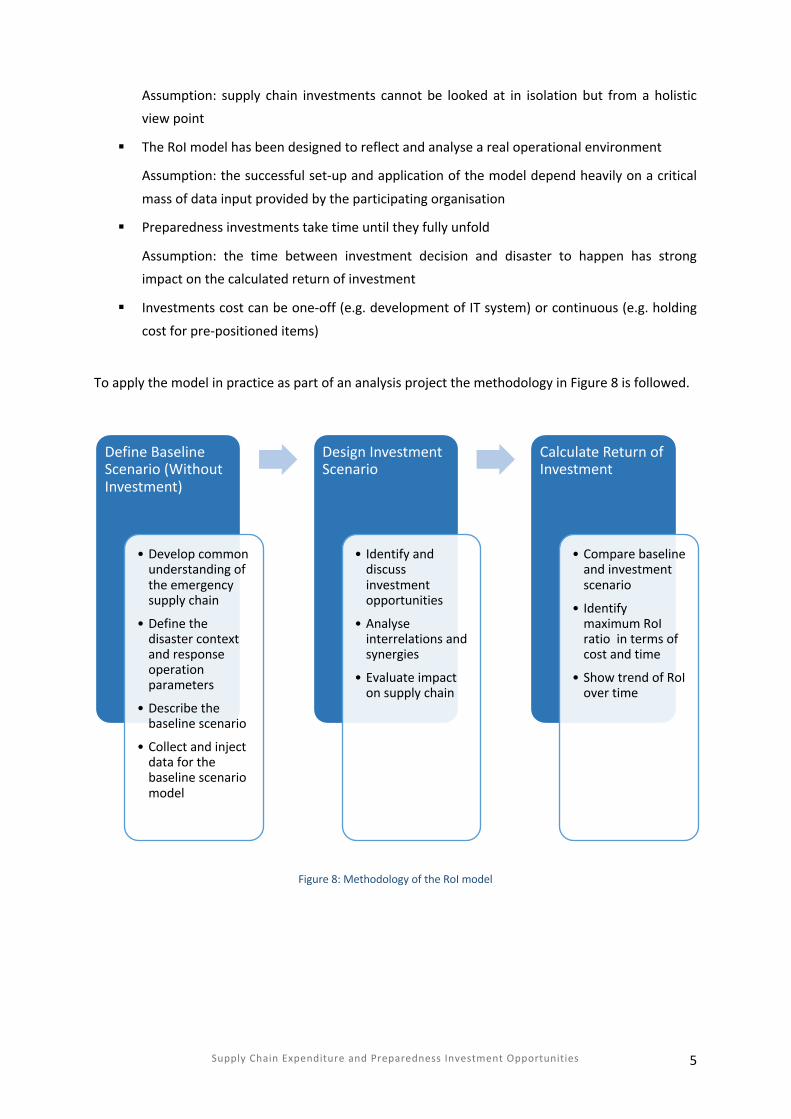
To apply the model in practice as part of an analysis project the methodology in Figure 8 is followed.
Figure 8: Methodology of the RoI model
Define Baseline Scenario (Without Investment)
• Develop common understanding of the emergency supply chain
• Define the disaster context and response operation parameters
• Describe the baseline scenario
• Collect and inject data for the baseline scenario model
Design Investment Scenario
• Identify and discuss investment opportunities
• Analyse interrelations and synergies
• Evaluate impact on supply chain
Calculate Return of Investment
• Compare baseline and investment scenario
• Identify maximum RoI ratio in terms of cost and time
• Show trend of RoI over time
Supply Chain Expenditure and Preparedness Investment Opportunities 6
3. APPLICATION OF THE MODEL
The baseline scenario forms the foundation of the subsequent modelling process as it frames the
operational context and provides the first set of supply chain data. The following steps are essential elements of the design phase and were completed in close collaboration with IFRC staff from the
Country Office in the Philippines, the Regional Office for Asia Pacific and the Headquarters.
3.1 Phase 1: Define Baseline Scenario The IFRC is the world's largest humanitarian organisation carrying out relief operations to assist
victims of disasters, and combines this with development work to strengthen the capacities of its member National Societies. When a major disaster such as the Haiyan typhoon strikes, the National
Society of the country (ex. the Philippine Red Cross Society), via its National Disaster Response Teams
(NDRT), immediately reacts under its auxiliary role to its government. If additional support is
required, the IFRC is requested to activate its humanitarian crisis protocol to plan and design the response according to available resources and identified needs. It counts with a variety of
mechanisms or tools at its disposal to support disaster response. They are designed to ensure that
assistance is delivered fast and efficiently to people affected by disasters through the provision of
funding, experienced and trained human resources and appropriate emergency services.
The Field Assessment and Coordination Team (FACT) is composed of experienced individuals in
assessment and planning from IFRC and its NS. Few NS are able to maintain and deploy teams of trained technical specialists, so-called Emergency Response Units (ERU), who use pre-packed sets of
standardised equipment in immediate disaster response. Regional Disaster Response Teams (RDRT)
are rosters of technical specialists from NS and IFRC built in the different regions across the globe
who are deployed individually to cover temporarily certain roles in a specific operation. Following an effort to strengthen local actors and in view of the growing skill levels within the regions, RDRT
personnel is more and more deployed as part of the FACT and ERU teams.
A comprehensive ‘Surge Optimisation’ process started in 2017 to improve performance and accountability in emergency operations, looking into further options to mobilise first local, later
regional and finally global resources as appropriate for each emergency event.
Supply Chain Expenditure and Preparedness Investment Opportunities 7
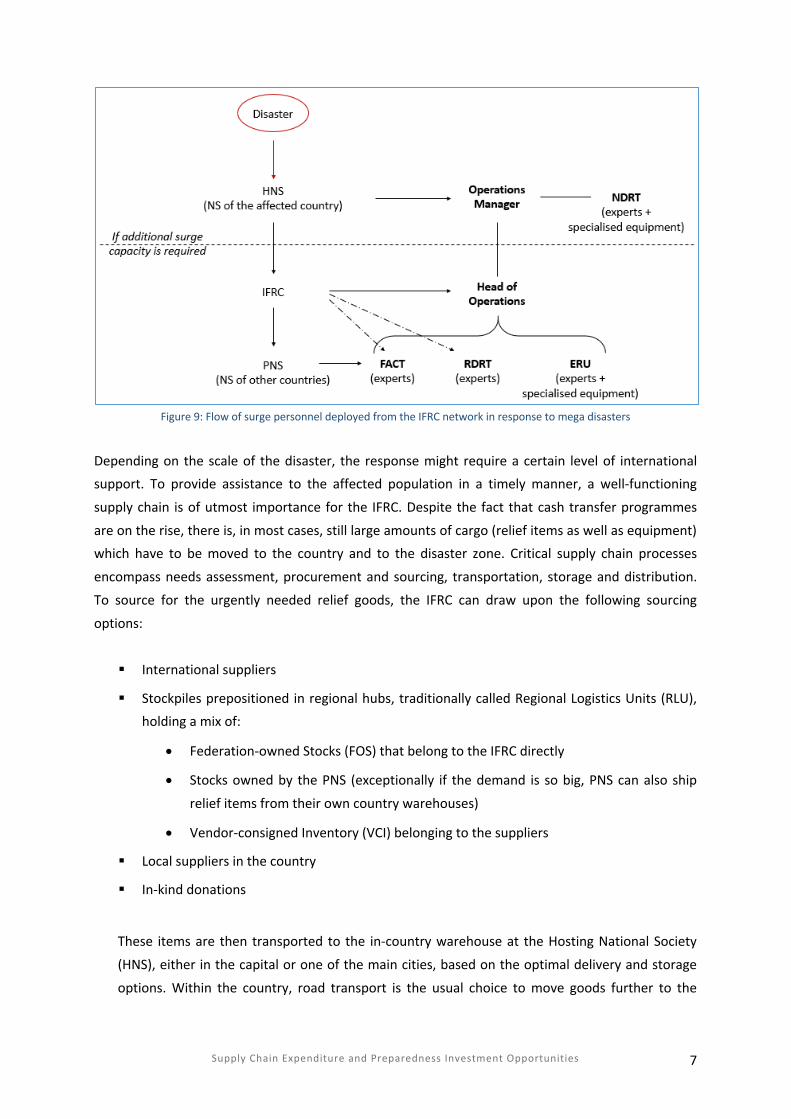
Figure 9: Flow of surge personnel deployed from the IFRC network in response to mega disasters
Depending on the scale of the disaster, the response might require a certain level of international support. To provide assistance to the affected population in a timely manner, a well-functioning
supply chain is of utmost importance for the IFRC. Despite the fact that cash transfer programmes
are on the rise, there is, in most cases, still large amounts of cargo (relief items as well as equipment) which have to be moved to the country and to the disaster zone. Critical supply chain processes
encompass needs assessment, procurement and sourcing, transportation, storage and distribution.
To source for the urgently needed relief goods, the IFRC can draw upon the following sourcing
options:
§ International suppliers
§ Stockpiles prepositioned in regional hubs, traditionally called Regional Logistics Units (RLU), holding a mix of:
• Federation-owned Stocks (FOS) that belong to the IFRC directly
• Stocks owned by the PNS (exceptionally if the demand is so big, PNS can also ship
relief items from their own country warehouses)
• Vendor-consigned Inventory (VCI) belonging to the suppliers
§ Local suppliers in the country
§ In-kind donations
These items are then transported to the in-country warehouse at the Hosting National Society
(HNS), either in the capital or one of the main cities, based on the optimal delivery and storage
options. Within the country, road transport is the usual choice to move goods further to the
Supply Chain Expenditure and Preparedness Investment Opportunities 8
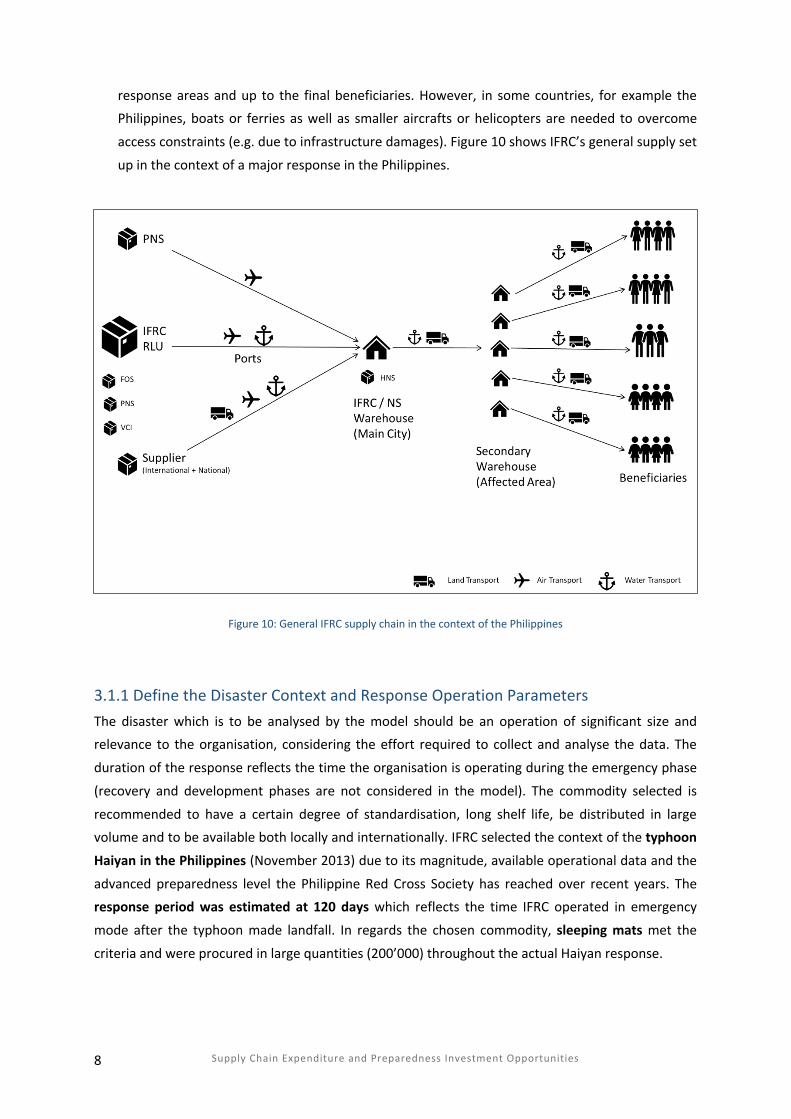
response areas and up to the final beneficiaries. However, in some countries, for example the Philippines, boats or ferries as well as smaller aircrafts or helicopters are needed to overcome
access constraints (e.g. due to infrastructure damages). Figure 10 shows IFRC’s general supply set
up in the context of a major response in the Philippines.
Figure 10: General IFRC supply chain in the context of the Philippines
3.1.1 Define the Disaster Context and Response Operation Parameters The disaster which is to be analysed by the model should be an operation of significant size and relevance to the organisation, considering the effort required to collect and analyse the data. The
duration of the response reflects the time the organisation is operating during the emergency phase
(recovery and development phases are not considered in the model). The commodity selected is
recommended to have a certain degree of standardisation, long shelf life, be distributed in large volume and to be available both locally and internationally. IFRC selected the context of the typhoon
Haiyan in the Philippines (November 2013) due to its magnitude, available operational data and the
advanced preparedness level the Philippine Red Cross Society has reached over recent years. The response period was estimated at 120 days which reflects the time IFRC operated in emergency
mode after the typhoon made landfall. In regards the chosen commodity, sleeping mats met the
criteria and were procured in large quantities (200’000) throughout the actual Haiyan response.
Supply Chain Expenditure and Preparedness Investment Opportunities 9
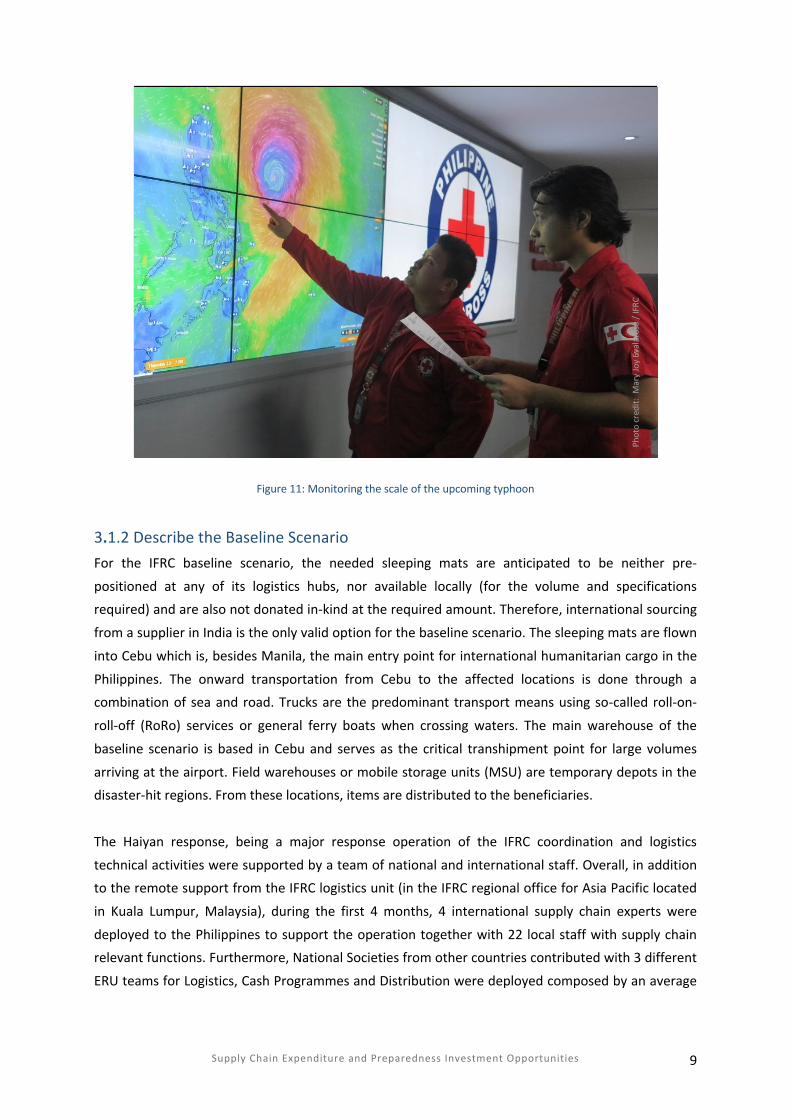
Figure 11: Monitoring the scale of the upcoming typhoon
3.1.2 Describe the Baseline Scenario For the IFRC baseline scenario, the needed sleeping mats are anticipated to be neither pre-
positioned at any of its logistics hubs, nor available locally (for the volume and specifications required) and are also not donated in-kind at the required amount. Therefore, international sourcing
from a supplier in India is the only valid option for the baseline scenario. The sleeping mats are flown
into Cebu which is, besides Manila, the main entry point for international humanitarian cargo in the
Philippines. The onward transportation from Cebu to the affected locations is done through a combination of sea and road. Trucks are the predominant transport means using so-called roll-on-
roll-off (RoRo) services or general ferry boats when crossing waters. The main warehouse of the
baseline scenario is based in Cebu and serves as the critical transhipment point for large volumes
arriving at the airport. Field warehouses or mobile storage units (MSU) are temporary depots in the disaster-hit regions. From these locations, items are distributed to the beneficiaries.
The Haiyan response, being a major response operation of the IFRC coordination and logistics
technical activities were supported by a team of national and international staff. Overall, in addition to the remote support from the IFRC logistics unit (in the IFRC regional office for Asia Pacific located
in Kuala Lumpur, Malaysia), during the first 4 months, 4 international supply chain experts were
deployed to the Philippines to support the operation together with 22 local staff with supply chain relevant functions. Furthermore, National Societies from other countries contributed with 3 different
ERU teams for Logistics, Cash Programmes and Distribution were deployed composed by an average
Phot
o cr
edit:
Mar
y Jo
y Ev
alar
osa
/ IFR
C
Supply Chain Expenditure and Preparedness Investment Opportunities 10
of 28 specialists per month. Moreover, 3 FACT specialists for Logistics and Relief activities were in place during the first two months.
Figure 12 shows IFRC’s supply chain in the baseline scenario.
Figure 12: Flow of goods in IFRC‘s baseline scenario
3.1.3 Collect and Inject Data for the Baseline Scenario Model Historical data on lead times, costs and capacities across all supply chain functions starting from
assessment to final distribution were collected and injected in the baseline scenario model. Some
data gaps where filled with assumptions based on other similar IFRC operations. Detailed data and information provided can be found in the Annex.
3.2 Phase 2 Design Investment Scenario Based on the preparedness framework by Van Wassenhove (2006), 5 different investment elements
(i.e. Personnel, IT/Processes, Prepositioning, Supplier Management and Local Actors/Communities) were discussed with the IFRC. Concrete investment opportunities were gathered from brainstorming
sessions with different IFRC experts and put into the context of the Haiyan response. Quantitative
and qualitative data was combined to estimate their impact in the baseline scenario. A mix of
historical data, recent capacity assessments, on-going logistics development initiatives and some assumptions were used to model the chosen scenario.
Supply Chain Expenditure and Preparedness Investment Opportunities 11
Personnel
Context
The performance of IFRC’s supply chain and, therefore, the overall response, depends heavily on the
capacity, productivity and the skill set of its staff. At the same time, Personnel expenses represent a
major cost component in the case that international experts are deployed as surge capacity to cover temporary gaps of resource availability in country due to the big magnitude of a disaster. Based on
experienced, it is assumed that in the case of mega disasters like the Typhoon Haiyan, some additional
international capacity from the IFRC network will be required to cover sudden picks of demand; i.e. no
single country has unlimited immediate capacity ready to face extraordinary events.
Investment Opportunity Investment Impact
Trying to use as many local human resources as possible by enabling the option of mobilising
more national and regional logisticians and
reducing the use of global logistics experts. The possible areas identified in the case of the
Philippines include: 1) continue strengthening
the regional roster of RDRT logisticians
(capacity kept and offered by other neighbouring National Societies); 2) deliver a
comprehensive training programme for the
national team of the Philippine Red Cross and
the IFRC, 3) recruit additional local staff with special knowledge on particular supply chain
functions such as warehousing, procurement or
fleet management.
Cost reduction and increase of more contextual response, where local resources are empowered and
used in the project design and implementation. In
the model, those investments result in a reduced need for deployments of international staff from
other regions (both IFRC staff, FACT and ERU teams)
in the future. The cost of deploying an international
expert it is always more costly than employing national experts. In some cases, it can be 10 times
more expensive for a similar profile. To reach the
maximal possible level of (local) staff capacity
through investments related to Personnel, a time period of 730 days is anticipated to hire and train
local resources. During that time period, the capacity
is growing steadily which is reflected in the country
readiness level in the model.
Synergies with other Investment Elements
The increased staff capacity will facilitate the activities related to other investment elements such as
Supplier Management and Local Actors. Likewise, investments in elements such as IT/Processes also
increase the productivity and therefore complement the enhancement of staff capacity.
Supply Chain Expenditure and Preparedness Investment Opportunities 12
IT/Processes
Context
The speed and quality of information flowing in a supply chain is determined by the establishment of
streamlined processes, and the information technology and systems backing those processes up.
Investment Opportunity Investment Impact
This investment element encompasses both
telecommunication equipment such as laptops or satellite phones as well as the development of
new and/or upgrade of existing information
systems. In regards to the information systems
IFRC envisages to establish a new general unit server and exchange platform, to enrich the
Enterprise Resource Planning (ERP) system
modules for procurement and warehousing and enrich the fleet monitoring system.
Investing into this element would generate lead
time savings in the supply chain (e.g. information on actual needs are shared swifter, approval
compliance and transparency. Digital technology to
support the beneficiary registration and distribution management (e.g.. data collection via smart
phones, barcoded identification cards, barcode
readers) would enable speeding up the arrival of
assistance on the hands of people in need (compared to paper-based systems). Specifically for
Cash-Based Interventions, which are not part of the
chosen scenario, but which are rapidly scaling up
globally, such technology has been identified as a prerequisite to distribute cash at scale during the
emergency phase, complying with minimum data
required by financial service providers and internal
control mechanisms.
Synergies with other Investment Elements
Investments in IT/Processes will increase the productivity of staff as they reduce the need for manual
data input as well as lengthy authorisation processes and increase the visibility on available stock piles
and suppliers.
Supply Chain Expenditure and Preparedness Investment Opportunities 13
Prepositioning
Context
Having critical relief items readily available at strategically located warehouses before the emergency
occurs, brings obvious advantages but needs to be managed carefully to avoid extreme over-stocking or
stock-outs as well as wrongly chosen locations.
Investment Opportunity Investment Impact
In the model, a total of 50’000 sleeping mats are considered as contingency stocks to quickly
respond in the Philippines by the Red Cross to
humanitarian crisis to be pre-positioned at 3
hubs in Subic, Manila and Cebu. To fully build up that inventory, a time period of 100 days is
anticipated. The investment comes with holding
cost until the goods are distributed and requires significant funding being available to procure the
goods prior to the disaster. The IFRC runs a
regional depot in Kuala Lumpur which has
storage space available for pre-positioning. One of the main advantages of pre-storing in Kuala
Lumpur is the flexibility to use the commodities
for emergencies in other countries (and re-fill the
stocks shortly after). Since the focus of the study is only on the Philippines and the flexibility
aspect needs to be analysed in future research,
the regional hub in Kuala Lumpur is not
considered as an option in the scenario modelled.
The pre-positioning takes out any procurement lead time during the response phase and also reduces
procurement and transportation expenses. As time
is not critical during the preparedness phase when
the inventory is set up, slower but cheaper transport modes can be chosen, and better
conditions can be negotiated with suppliers outside
of the hectic response period. In case of international sourcing, the import of goods would
be done before the emergency happens, thus the
time required to release goods from customs would
be avoided during the response phase.
Supply Chain Expenditure and Preparedness Investment Opportunities 14
Supplier Management
Context
Assessing local markets to identify and evaluate available suppliers and commodities, building
relationships with selected suppliers and establishing framework agreements are the essence of
professional procurement practices. Note that even if the model does not consider cash programmes, it should be mentioned that the market assessments carried out as part of this investment element can
also serve as a foundation for the implementation of those.
Investment Opportunity Investment Impact
Setting up a long-term agreement for sleeping
mats both at the national level for the Philippines
(contract to be done by the Philippine Red Cross Society or the IFRC country office in the
Philippines) and at regional/global level (contract
to be done by the IFRC). IFRC acknowledges that these tasks require staff with the necessary
competencies to conduct analyses and engage
with the suppliers as well as transportation
service providers. To reach that competency level, IFRC would train the national team to carry
out these activities.
In-depth market knowledge on available goods and
guaranteed quantities and prices through
framework agreements result in savings of procurement cost and time in the model. IFRC
assumes that it takes between 4 to 6 months to
complete the assessments and establish the agreements.
Supply Chain Expenditure and Preparedness Investment Opportunities 15
Local Actors/Communities
Context
Two types of local actors are considered in this investment element. National governments play a
critical role by coordinating the overall response and controlling in-flow of international organisations
and commodities. Another important actor are the volunteers of the Philippine Red Cross, neighbours and communities in the disaster region that are typically the first responders and provider of assistance.
Furthermore, they have great potential to support the following larger response phase through
knowledge of local context as well as assets such as temporary storage in sports halls or community
centres.
Investment Opportunity Investment Impact
The IFRC expects that building good and trustful relationships with government entities of the
country as well as with local actors at
municipality level will come with a number of advantages to IFRC’s large scale relief operations.
Similar to the supplier management investment
element, the relationship management will be
done through the recruitment of an additional expert and training of the Philippine Red Cross
Society. A preparedness time of up to 1 year is
anticipated until the return of the investment
can be expected.
The improved collaboration with national government and municipalities will speed up the
needs assessment (support from local actors at the
municipality level) and the custom process (national government) and increase the distribution capacity
(support from local actors at the municipality level).
Establishing partnerships with private sector
partners and other humanitarian organisations could facilitate in future emergency responses
getting temporary free warehouse capacity in
affected areas or benefiting from joint tendering or
supplier market assessment.
Supply Chain Expenditure and Preparedness Investment Opportunities 16
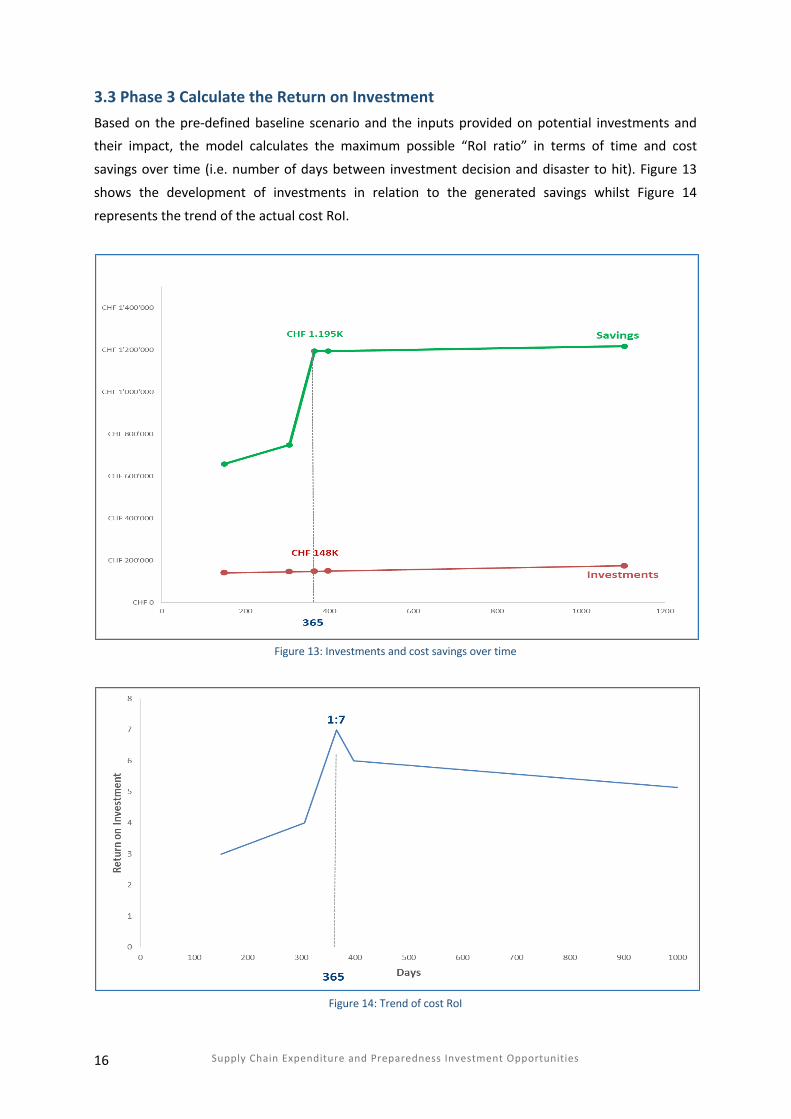
3.3 Phase 3 Calculate the Return on Investment Based on the pre-defined baseline scenario and the inputs provided on potential investments and their impact, the model calculates the maximum possible “RoI ratio” in terms of time and cost
savings over time (i.e. number of days between investment decision and disaster to hit). Figure 13
shows the development of investments in relation to the generated savings whilst Figure 14
represents the trend of the actual cost RoI.
Figure 13: Investments and cost savings over time
Figure 14: Trend of cost RoI
Supply Chain Expenditure and Preparedness Investment Opportunities 17
At day 365 (equal to 365 preparedness days), the optimal cost RoI ratio of 1:7 is reached. The investments made at that point in time across all elements, as per one possible scenario estimated
with the IFRC team (Figure 15), add up to CHF 148’000 resulting in cost savings of CHF 1’195’000 and
reduction of 36 days in lead time (Figure 16 and 17).
Investments
Total Investments CHF 148'157.88
HR / Personnel Development programme (trainings) CHF 11'324.00
IT & Processes Development programme (IT, equipment,
processes, SOP) CHF 69'415.00
Supplier Management Suggested training on local market assessment as
well as FWA with suppliers and transporters CHF 26'374.00
Figure 15: Estimation of investments selected for the study
Results
Type the day when the catastrophe is happening (between 1 to 911 days) 365
Investments
Return on Investment ratio (RoI) 1:7
Country readiness level 60%
Investment made CHF 148'157.88
Costs
Total expenditure without investment CHF 3'188'991.27
Total expenditure with investment CHF 1'993'817.60
Costs savings CHF 1'195'173.66
Costs savings percentage 60%
Time
Total lead time without investment 45
Total lead time with investment 9 Days
Lead time savings 36 Days
Lead time savings percentage 80%
Figure 16: Overall results of the model at day 365
Supply Chain Expenditure and Preparedness Investment Opportunities 18
Figure 17: Reductions in cost and time at day 365
Supply Chain Expenditure and Preparedness Investment Opportunities 19
4. CONCLUSION
This project was conducted to analyse the supply chain share in IFRC’s total operations expenditure
in response to humanitarian crises and furthermore investigate whether the paradigm of 1 CHF being invested in preparedness measures prior to the emergency could save IFRC up to 7 CHF during the
response. The results of the study provided indeed a clear picture that supply chain expenses are the
highest cost factor in a response (75% on average) and that the 1:7 hypothesis can hold true in the
chosen context.
It was found that, in the scenario of IFRC’s sleeping mat supply chain in the Philippines Haiyan
response, the ratio 1:7 can be reached and the lead time reduced by 36 days by investing in the 5
identified elements (i.e. Personnel, IT/Processes, Pre-positioning, Supplier Engagement and Local Actors) over a preparedness period of 1 year.
Interestingly, the model demonstrates that, even if the cost RoI ratio declines after the maximum of
1:7 has been reached, it then stabilises at a ratio of 1:6 and 1:5 for a long period of time. Nevertheless, it should be noted that keeping a readiness level does not involve only an initial
investment, but it also requires a certain amount of running costs (staff, IT licences/support,
warehouse buildings and equipment, etc.) and that is why the curve of savings decreases after a certain point (the more time between preparing for a disaster until a crisis response starts, the bigger
the amount of running costs that will need to be covered). In alignment with the localisation agenda,
investing in local supply chain capacity building reduces the need for more costly international
experts and international air shipments, benefiting the organisation (in this case the Philippine Red Cross Society) over a long term basis, and empowers them for a stronger engagement and
participation in the design and implementation of more contextualised, more efficient and more
effective relief response operations. The combination of investment elements which complement
each other reveals synergies and further optimisation could be expected over time. The investment in supply chain preparedness in the analysed context can therefore be considered as entirely
beneficial with no risk of becoming disadvantageous to a situation when funding is only provided in
the aftermath of a disaster.
The findings of the study have been presented to a number of institutional donors at the
Humanitarian Liaison Working Group meeting in Geneva on 17 September 2018. The presentation, in
particular the fact-based methodology, was very well received. The reaction showed the openness of donors to change their view on traditional funding streams and channel more funding towards
supply chain preparedness.
Based on the lessons learnt from the 3 RoI studies (conducted with ACF France, IFRC and SCI), HELP Logistics and KLU suggest the next steps could be focused on 3 possibilities.
Supply Chain Expenditure and Preparedness Investment Opportunities 20
Firstly, despite the success of the studies and the attention gained, more advocacy on the donor side
and also within humanitarian agencies is needed. The common understanding of the relevance and
potential of supply chain and in particular in preparedness is not widely accepted yet and requires
further efforts. This study proves the RoI can be quantified in supply chains in humanitarian context.
Secondly, the implementation of the identified investment shall be given utmost priority. As the
model shows, investments take time to fully unfold their potential and the next disasters will not
wait to happen. When implementing the investments, a comprehensive monitoring and evaluation approach is needed to go along to measure the impact and supports the advocacy efforts further.
Thirdly, whilst the current model is based on an established framework, requests have been received to expand the model. For example, it was suggested to add elements that represent the growing
relevance of cash programmes and looking into other return aspects beyond time and cost savings
such as environmental and social impact of supply chain preparedness investments.
Supply Chain Expenditure and Preparedness Investment Opportunities 21
ACKNOWLEDGEMENTS
This report was written by Lea Stegemann and Jonas Stumpf (HELP Logistics – A Programme of the
Kuehne Foundation). The authors would like to express their appreciation for the many inputs given by the IFRC staff from the global headquarters (particularly Thierry Balloy, Juan Galvez, Céline Pigny,
Coralie Diaz Luthi, Angela Eaton, Bilal Hussain Shah, Ruben Romero, and Marjorie Soto Franco), from
the regional office Asia (particularly Mathieu Grenade, Riku Assamaki, Nuraiza Khairuddin and
Gabrielle Emery), from the Philippines office (particularly Noel Delos Santos, Tahnee Collamat, Pauline Caspellan - Arce), and from the Global Fleet & Logistics Hub Dubai (Salac Agali). Furthermore,
they would like to express their gratitude for the support from Kuehne Foundation and Kuehne
Logistics University that was provided throughout the process (particularly Seán Rafter, Maria
Besiou, and Nimisha Gopakumar).
DISCLAIMER
The opinions and recommendations express in this study do not necessarily represent the official
view/policy of the IFRC or of the individual National Red Cross and Red Crescent societies. The
designation and maps used do not imply the expression of any opinion on the part of the IFRC concerning the legal status of a territory or of its authorities. Reference to all or part of the study
may be made for non-commercial use, provided the source is acknowledged.
REFERENCES
Guerrero-Garcia, S., Lamarche, J.-B., Vince, R., Cahill, S., & Besiou, M. (2016). Delivering in a Moving World
UNDP (2012). Putting resilience at the heart of development – Investing in prevention and resilient
recovery
Van Wassenhove, L. (2006). Humanitarian aid logistics: supply chain management in high gear.
Journal of the Operational Research Society, Vol. 57/5, 475-489.
Supply Chain Expenditure and Preparedness Investment Opportunities 22