Volume 12, Number 1 2001 Page 1 It is generally believed that a well-crafted system of supply chain metrics can increase the chances for success by aligning processes across multiple firms, targeting the most profitable market segments, and obtaining a competitive advantage through differentiated services and lower costs. The lack of proper metrics for a supply chain will result in failure to meet consumer/end user expectations, suboptimization of departmental or company performance, missed opportunities to outperform the competition, and conflict within the supply chain. However, there is no evidence that meaningful performance measures that span the supply chain actually exist. Many factors may contribute to this situation including: the lack of a supply chain orientation, the complexity of capturing metrics across multiple companies, the unwillingness to share information among companies, and the inability to capture performance by customer, product or supply chain. A major contributor to the lack of meaningful supply chain performance measures is the absence of an approach for developing and designing such measures. In most companies, the metrics that management refers to as supply chain metrics are primarily internally focused logistics measures such as lead time, fill rate, or on-time performance. In many instances, these measures are financial (inventory turns and overall profitability), but they do not provide insight regarding how well key business processes have been performed or how effectively the supply chain has met customer needs. In a growing number of firms management is beginning to measure performance outside the firm, but these efforts have been limited to evaluating the performance of tier one suppliers, customers, or third-party providers. These metrics do not capture how the overall supply chain has performed and fail to identify where opportunities exist to increase competitiveness, customer value, and shareholder value for each firm in the supply chain. In this paper, we present a framework for developing metrics that measure the performance of key supply chain processes, identify how each firm affects overall supply chain performance, and can be translated into Supply Chain Metrics Douglas M. Lambert The Ohio State University and University of North Florida Terrance L. Pohlen University of North Florida Most discussions and articles about supply chain metrics are, in actuality, about internal logistics performance measures. The lack of a widely accepted definition for supply chain management and the complexity associated with overlapping supply chains make the development of supply chain metrics difficult. Despite these problems, managers continue to pursue supply chain metrics as a means to increase their “line of sight” over areas they do not directly control, but have a direct impact on their company’s performance. We provide a framework for developing supply chain metrics that translates performance into shareholder value. The framework focuses on managing the interfacing customer relationship management and supplier relationship management processes at each link in the supply chain. The translation of process improvements into supplier and customer profitability provides a method for developing metrics that identify opportunities for improved profitability and align objectives across all of the firms in the supply chain. …there is no evidence that meaningful performance measures that span the supply chain actually exist.
Transcript
Volume 12, Number 1 2001 Page 1
It is generally believed that a well-craftedsystem of supply chain metrics can increasethe chances for success by aligning processesacross multiple firms, targeting the mostprofitable market segments, and obtaining acompetitive advantage through differentiatedservices and lower costs. The lack of propermetrics for a supply chain will result in failureto meet consumer/end user expectations,suboptimization of departmental or company performance, missed opportunitiesto outperform the competition, and conflictwithin the supply chain. However, there is no evidence that meaningful performancemeasures that span the supply chain actually exist. Many factors may contribute tothis situation including: the lack of a supplychain orientation, the complexity of capturing metrics across multiple companies,the unwillingness to share information among companies, and the inability tocapture performance by customer, product or supply chain. A major contributor to the lack of meaningful supply chainperformance measures is the absence of an approach for developing and designingsuch measures.
In most companies, the metrics thatmanagement refers to as supply chain metricsare primarily internally focused logisticsmeasures such as lead time, fill rate, or on-time performance. In many instances,these measures are financial (inventory turnsand overall profitability), but they do not provide insight regarding how well key business processes have been performedor how effectively the supply chain has met customer needs. In a growing number of firms management is beginning to measure performance outside the firm, but these efforts have been limited toevaluating the performance of tier onesuppliers, customers, or third-party providers.These metrics do not capture how the overallsupply chain has performed and fail toidentify where opportunities exist to increasecompetitiveness, customer value, andshareholder value for each firm in the supplychain.
In this paper, we present a framework for developing metrics that measure theperformance of key supply chain processes,identify how each firm affects overall supplychain performance, and can be translated into
Supply Chain Metrics
Douglas M. LambertThe Ohio State University and University of North Florida
Terrance L. PohlenUniversity of North Florida
Most discussions and articles about supply chain metrics are, in actuality, about internal logistics performance measures. The lack of a widely accepteddefinition for supply chain management and the complexity associated withoverlapping supply chains make the development of supply chain metrics difficult. Despite these problems, managers continue to pursue supply chainmetrics as a means to increase their “line of sight” over areas they do not directlycontrol, but have a direct impact on their company’s performance. We provide aframework for developing supply chain metrics that translates performance intoshareholder value. The framework focuses on managing the interfacing customerrelationship management and supplier relationship management processes ateach link in the supply chain. The translation of process improvements into supplier and customer profitability provides a method for developing metrics thatidentify opportunities for improved profitability and align objectives across all of thefirms in the supply chain.
…there is no evidencethat meaningful
performance measuresthat span the supplychain actually exist.
Page 2 The International Journal of Logistics Management
shareholder value. In the first section, wedescribe the problem with current metricsand the need for supply chain performancemeasures. In the second section, the relevantliterature is reviewed and its application tosupply chain management evaluated. Thepaper concludes with a framework fordeveloping supply chain metrics.
Problems with Existing MetricsThe performance measures used in most
companies have several problems thatprevent them from effectively measuringsupply chain performance. Many measuresidentified as supply chain metrics are actuallymeasures of internal logistics operations asopposed to measures of supply chainmanagement. The majority are single firmlogistics measures such as fill rate, lead time,on-time performance, damage andresponsiveness [1] and are not the multi-firmmeasures that are necessary to measure theperformance of the supply chain [2]. Similarmeasures were obtained in seminar programsheld at multiple locations in the United Statesand abroad, when we asked executives toidentify examples of supply chain metrics.
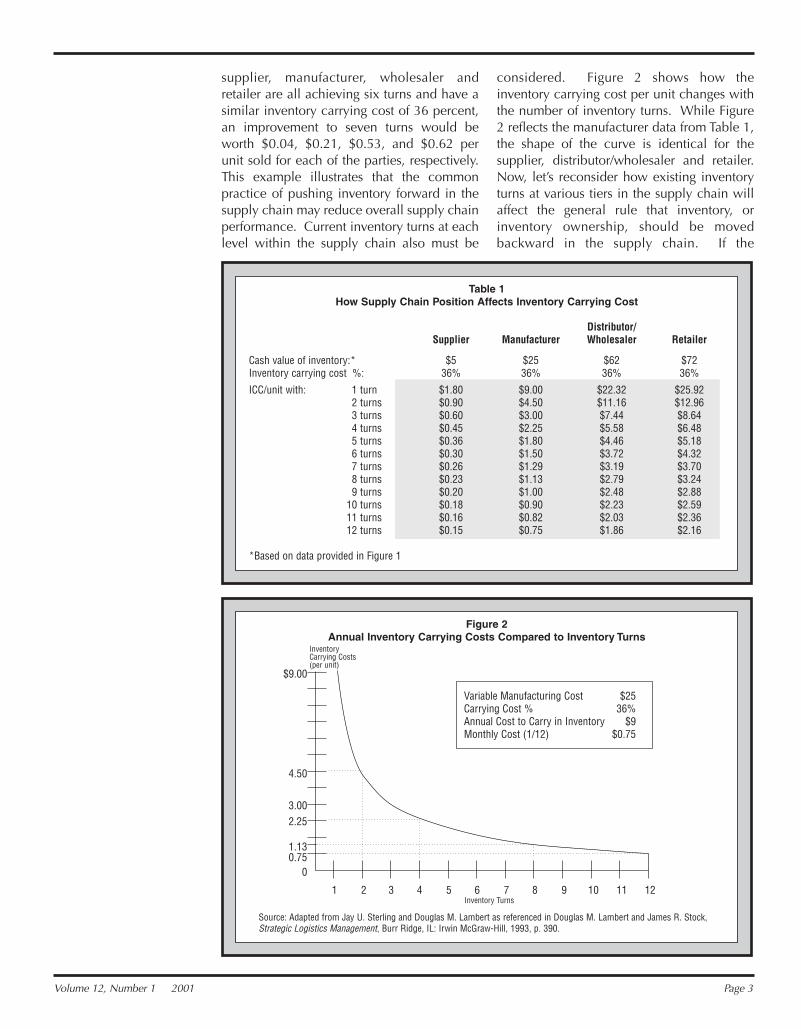
Typically, the executives identified inventoryturns as one of the measures of supply chainperformance, a view shared by severalauthors [3]. However, as a supply chainmetric, inventory turns is not an effectivemeasure and provides a useful example ofwhy new metrics are needed for managingthe supply chain.
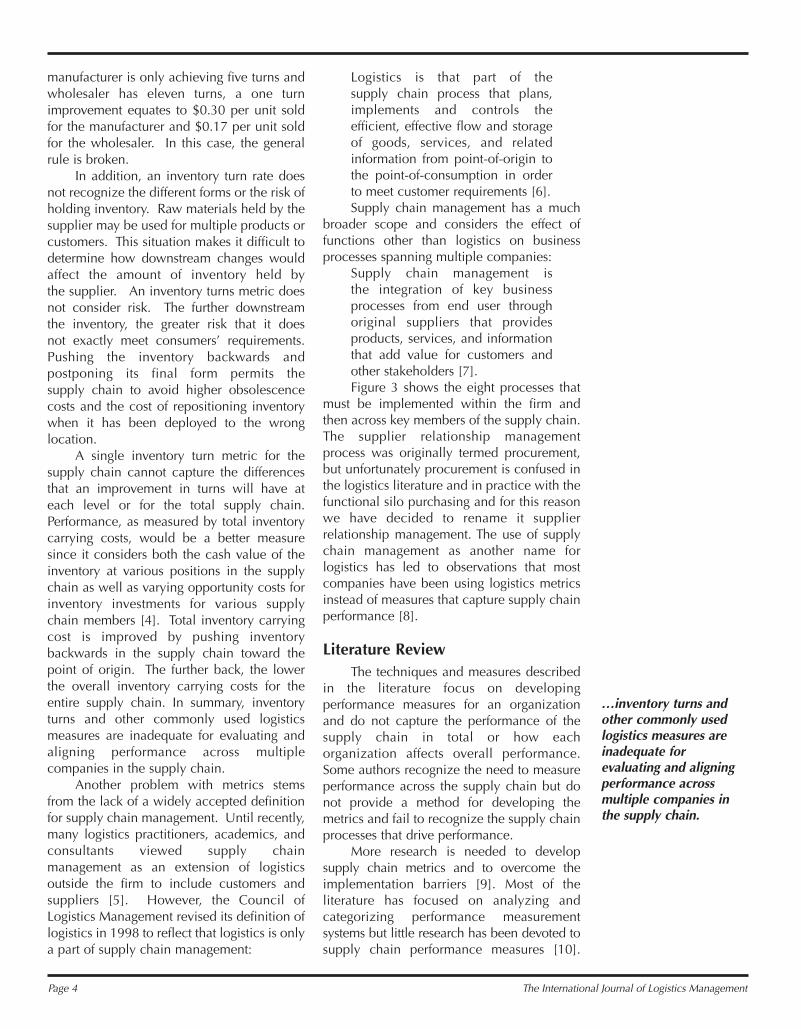
An inventory turns measurement fails tocapture key differences in product cost, form,and risk within the supply chain. Figure 1,which illustrates inventory positions and flowsacross a supply chain, helps make this point.As inventory moves closer to the point ofconsumption, it increases in value. That is,the out-of-pocket cash investment in theinventory increases.
Consequently, if the opportunity cost ofmoney and the inventory turns are similar,inventory carrying costs are much higher atthe retail level, and an inventory turnimprovement by the retailer has a muchgreater effect on overall supply chainperformance than a turn improvement by the supplier, or manufacturer, and a greater impact than a turn improvement bythe wholesaler. Referring to Table 1, if the
Many measuresidentified as supplychain metrics areactually measures ofinternal logisticsoperations as opposedto measures of supplychain management.
…an inventory turnimprovement by theretailer has a muchgreater effect onoverall supply chainperformance than aturn improvement bythe supplier…
Figure 1Inventory Flows Within the Supply Chain
Source: Adapted from Douglas M. Lambert and Mark L. Bennion, “New Channel Strategies for the 1980s,” in Marketing Channels:Domestics and International Perspectives, ed. Michael G. Harvey and Robert F. Lusch, Norman: Center for Economic ManagementResearch, School of Business Administration, University of Oklahoma, 1982, p. 127.
Suppliers Manufacturers Distributors/Wholesalers
Retailers
OrdersPayments
InformationProduct
OrdersPayments
InformationProduct
OrdersPayments
InformationProduct
$5
$10
$7
Variable costof material
Acquisitioncost
Other variablecosts
Total variablecost of product
Full manufac-tured cost
Sellingprice
$10
$1
$14
$25
$40
$60
$60
$2
$62
$70
$70
$2
$72
$120
Variable costof material
Acquisition cost
Total variablecost of product
Sellingprice
Variable costof material
Acquisition cost
Total variablecost of product
Sellingprice
Variable costof product
Full manufac-tured cost
Sellingprice
Volume 12, Number 1 2001 Page 3
supplier, manufacturer, wholesaler andretailer are all achieving six turns and have asimilar inventory carrying cost of 36 percent,an improvement to seven turns would beworth $0.04, $0.21, $0.53, and $0.62 perunit sold for each of the parties, respectively.This example illustrates that the commonpractice of pushing inventory forward in thesupply chain may reduce overall supply chainperformance. Current inventory turns at eachlevel within the supply chain also must be
considered. Figure 2 shows how theinventory carrying cost per unit changes withthe number of inventory turns. While Figure2 reflects the manufacturer data from Table 1,the shape of the curve is identical for thesupplier, distributor/wholesaler and retailer.Now, let’s reconsider how existing inventoryturns at various tiers in the supply chain willaffect the general rule that inventory, orinventory ownership, should be movedbackward in the supply chain. If the
Table 1How Supply Chain Position Affects Inventory Carrying Cost
Figure 2Annual Inventory Carrying Costs Compared to Inventory Turns
Variable Manufacturing Cost $25Carrying Cost % 36%Annual Cost to Carry in Inventory $9Monthly Cost (1/12) $0.75
InventoryCarrying Costs(per unit)
$9.00
4.50
3.002.25
1.130.75
0
1 2 3 4 5 6 7 8 9 10 11 12Inventory Turns
Source: Adapted from Jay U. Sterling and Douglas M. Lambert as referenced in Douglas M. Lambert and James R. Stock,Strategic Logistics Management, Burr Ridge, IL: Irwin McGraw-Hill, 1993, p. 390.
Page 4 The International Journal of Logistics Management
manufacturer is only achieving five turns andwholesaler has eleven turns, a one turnimprovement equates to $0.30 per unit soldfor the manufacturer and $0.17 per unit soldfor the wholesaler. In this case, the generalrule is broken.
In addition, an inventory turn rate doesnot recognize the different forms or the risk ofholding inventory. Raw materials held by thesupplier may be used for multiple products orcustomers. This situation makes it difficult todetermine how downstream changes wouldaffect the amount of inventory held by the supplier. An inventory turns metric doesnot consider risk. The further downstream the inventory, the greater risk that it does not exactly meet consumers’ requirements.Pushing the inventory backwards andpostponing its final form permits the supply chain to avoid higher obsolescencecosts and the cost of repositioning inventorywhen it has been deployed to the wronglocation.
A single inventory turn metric for thesupply chain cannot capture the differencesthat an improvement in turns will have ateach level or for the total supply chain.Performance, as measured by total inventorycarrying costs, would be a better measuresince it considers both the cash value of theinventory at various positions in the supplychain as well as varying opportunity costs forinventory investments for various supplychain members [4]. Total inventory carryingcost is improved by pushing inventorybackwards in the supply chain toward thepoint of origin. The further back, the lowerthe overall inventory carrying costs for theentire supply chain. In summary, inventoryturns and other commonly used logisticsmeasures are inadequate for evaluating andaligning performance across multiplecompanies in the supply chain.
Another problem with metrics stemsfrom the lack of a widely accepted definitionfor supply chain management. Until recently,many logistics practitioners, academics, andconsultants viewed supply chainmanagement as an extension of logisticsoutside the firm to include customers andsuppliers [5]. However, the Council ofLogistics Management revised its definition oflogistics in 1998 to reflect that logistics is onlya part of supply chain management:
Logistics is that part of the supply chain process that plans,implements and controls theefficient, effective flow and storageof goods, services, and relatedinformation from point-of-origin tothe point-of-consumption in orderto meet customer requirements [6].Supply chain management has a much
broader scope and considers the effect offunctions other than logistics on businessprocesses spanning multiple companies:
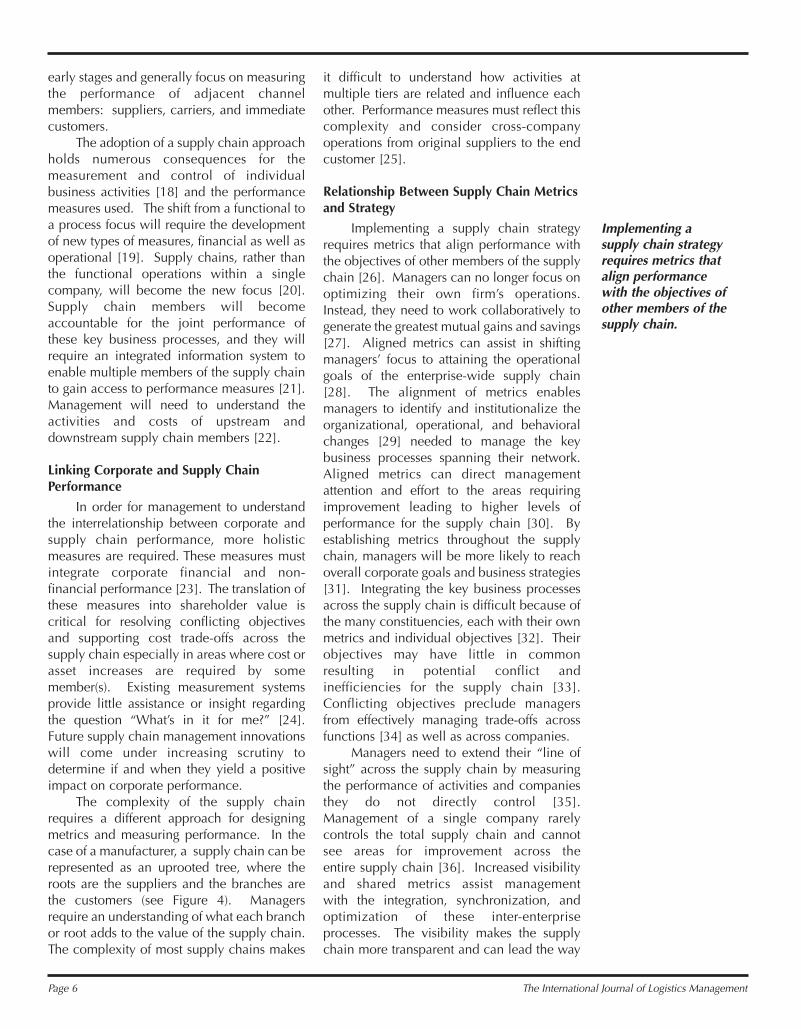
Supply chain management is the integration of key businessprocesses from end user throughoriginal suppliers that providesproducts, services, and informationthat add value for customers andother stakeholders [7].Figure 3 shows the eight processes that
must be implemented within the firm andthen across key members of the supply chain.The supplier relationship managementprocess was originally termed procurement,but unfortunately procurement is confused inthe logistics literature and in practice with thefunctional silo purchasing and for this reasonwe have decided to rename it supplierrelationship management. The use of supplychain management as another name forlogistics has led to observations that mostcompanies have been using logistics metricsinstead of measures that capture supply chainperformance [8].
Literature ReviewThe techniques and measures described
in the literature focus on developingperformance measures for an organizationand do not capture the performance of thesupply chain in total or how eachorganization affects overall performance.Some authors recognize the need to measureperformance across the supply chain but donot provide a method for developing themetrics and fail to recognize the supply chainprocesses that drive performance.
More research is needed to developsupply chain metrics and to overcome theimplementation barriers [9]. Most of theliterature has focused on analyzing andcategorizing performance measurementsystems but little research has been devoted tosupply chain performance measures [10].
Research is needed to determine what shouldbe measured, when and why. The supply chainmust be viewed as one entity and anymeasurement system should span the entiresupply chain [11]. The challenge is to developa measurement system that enables managersto see the areas where supply chainperformance can be improved, so they canfocus their attention, and obtain higher levelsof performance [12].
Why Supply Chain Metrics?
Several factors are contributing tomanagement’s need for new types ofmeasures for managing the supply chainincluding: • The lack of measures that capture
performance across the entire supply chain.• The requirement to go beyond internal
metrics and take a supply chainperspective.
• The need to determine the interrelationshipbetween corporate and supply chainperformance.
• The desire to expand the “line of sight”within the supply chain.
• The requirement to allocate benefits andburdens resulting from functional shiftswithin the supply chain.
• The need to differentiate the supply chain toobtain a competitive advantage.
• The goal of encouraging cooperativebehavior across corporate functions andacross firms in the supply chain.
Measures spanning the entire supplychain do not exist [13], and logistics or otherfunctional measures do not adequately reflectscope of supply chain management [14].Managers can only determine whether theyhave met their corporate goals after the fact,by diagnosing poor financial results or whenthey lose a key customer [15]. The measuresused have little to do with supply chainstrategy and objectives and may actuallyconflict resulting in inefficiencies for theoverall supply chain [16]. Metrics integratingperformance across multiple companies arejust emerging [17], but they are only in their
Figure 3Supply Chain Management:
Integrating and Managing Processes Across the Supply Chain
CUSTOMER RELATIONSHIP MANAGEMENT
CUSTOMER SERVICE MANAGEMENT
DEMAND MANAGEMENT
ORDER FULFILLMENT
MANUFACTURING FLOW MANAGEMENT
SUPPLIER RELATIONSHIP MANAGEMENT
PRODUCT DEVELOPMENT AND COMMERCIALIZATION
RETURNS MANAGEMENT
Information Flow
Tier 2Supplier
Su
pp
ly C
hai
n M
anag
emen
t P
roce
sses
Tier 1Supplier
Manufacturer
CustomerLogistics
PRODUCT FLOW
R & DProduction
Purchasing
Finance
Marketing & Sales
Consumer/End-user
Source: Adapted from Douglas M. Lambert, Martha C. Cooper, and Janus D. Pagh, “Supply Chain Management: ImplementationIssues and Research Opportunities,” The International Journal of Logistics Management, Vol. 9, No. 2 (1998), p. 2.
Several factors arecontributing to
management’s needfor new types of
measures for managingthe supply chain …
Page 6 The International Journal of Logistics Management
early stages and generally focus on measuringthe performance of adjacent channelmembers: suppliers, carriers, and immediatecustomers.
The adoption of a supply chain approachholds numerous consequences for themeasurement and control of individualbusiness activities [18] and the performancemeasures used. The shift from a functional toa process focus will require the developmentof new types of measures, financial as well asoperational [19]. Supply chains, rather thanthe functional operations within a singlecompany, will become the new focus [20].Supply chain members will becomeaccountable for the joint performance ofthese key business processes, and they willrequire an integrated information system toenable multiple members of the supply chainto gain access to performance measures [21].Management will need to understand theactivities and costs of upstream anddownstream supply chain members [22].
Linking Corporate and Supply ChainPerformance
In order for management to understandthe interrelationship between corporate andsupply chain performance, more holisticmeasures are required. These measures mustintegrate corporate financial and non-financial performance [23]. The translation ofthese measures into shareholder value iscritical for resolving conflicting objectivesand supporting cost trade-offs across thesupply chain especially in areas where cost orasset increases are required by somemember(s). Existing measurement systemsprovide little assistance or insight regardingthe question “What’s in it for me?” [24].Future supply chain management innovationswill come under increasing scrutiny todetermine if and when they yield a positiveimpact on corporate performance.
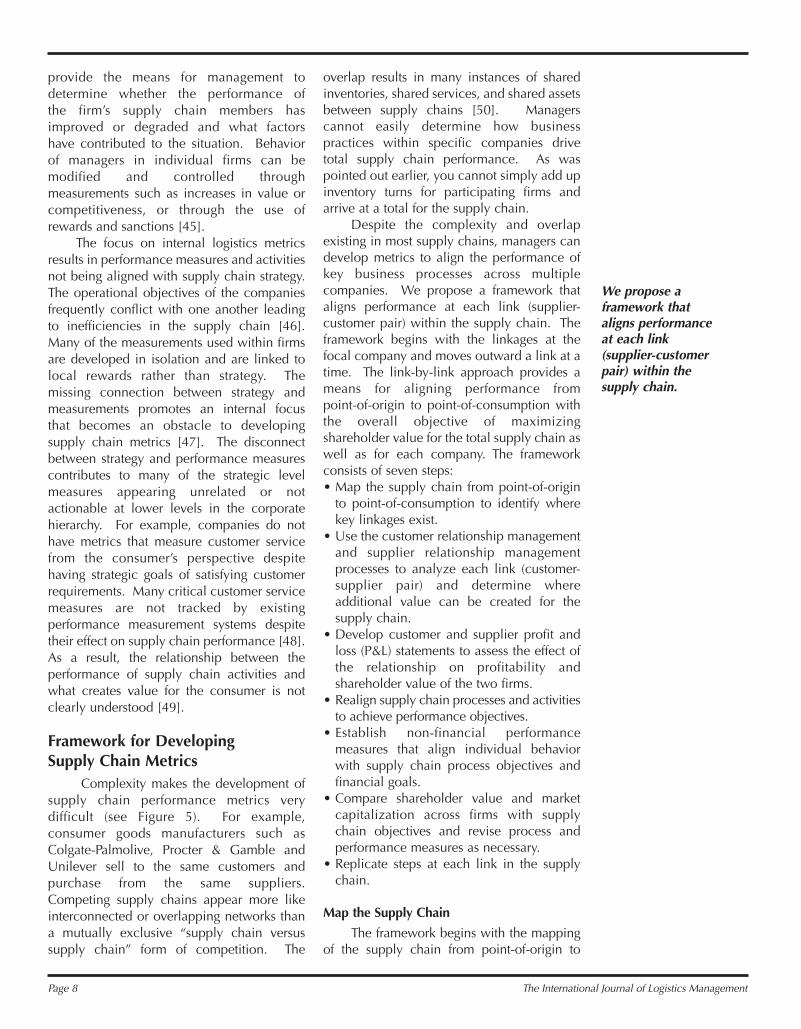
The complexity of the supply chainrequires a different approach for designingmetrics and measuring performance. In thecase of a manufacturer, a supply chain can berepresented as an uprooted tree, where theroots are the suppliers and the branches arethe customers (see Figure 4). Managersrequire an understanding of what each branchor root adds to the value of the supply chain.The complexity of most supply chains makes
it difficult to understand how activities atmultiple tiers are related and influence eachother. Performance measures must reflect thiscomplexity and consider cross-companyoperations from original suppliers to the endcustomer [25].
Relationship Between Supply Chain Metricsand Strategy
Implementing a supply chain strategyrequires metrics that align performance withthe objectives of other members of the supplychain [26]. Managers can no longer focus onoptimizing their own firm’s operations.Instead, they need to work collaboratively togenerate the greatest mutual gains and savings[27]. Aligned metrics can assist in shiftingmanagers’ focus to attaining the operationalgoals of the enterprise-wide supply chain[28]. The alignment of metrics enablesmanagers to identify and institutionalize theorganizational, operational, and behavioralchanges [29] needed to manage the keybusiness processes spanning their network.Aligned metrics can direct managementattention and effort to the areas requiringimprovement leading to higher levels ofperformance for the supply chain [30]. Byestablishing metrics throughout the supplychain, managers will be more likely to reachoverall corporate goals and business strategies[31]. Integrating the key business processesacross the supply chain is difficult because ofthe many constituencies, each with their ownmetrics and individual objectives [32]. Theirobjectives may have little in commonresulting in potential conflict andinefficiencies for the supply chain [33].Conflicting objectives preclude managersfrom effectively managing trade-offs acrossfunctions [34] as well as across companies.
Managers need to extend their “line ofsight” across the supply chain by measuringthe performance of activities and companiesthey do not directly control [35].Management of a single company rarelycontrols the total supply chain and cannot see areas for improvement across the entire supply chain [36]. Increased visibilityand shared metrics assist management with the integration, synchronization, andoptimization of these inter-enterpriseprocesses. The visibility makes the supplychain more transparent and can lead the way
Implementing asupply chain strategyrequires metrics thatalign performancewith the objectives ofother members of thesupply chain.
Volume 12, Number 1 2001 Page 7
for performance improvements. Managerscan determine how well the supply chainperformed against the expectations of theircustomers [37] and use the information todetermine where performance improvementsneed to occur. The identification ofdeficiencies outside a company’s span ofcontrol can lead to programs aimed atimproving performance or taking some levelof control of upstream or downstream supplychain activities. Managers rarely have face-to-face contact with the end users, and supplychain metrics enable all the linked membersto better respond to changes in consumerdemand [38].
Functional shifts and cost trade-offs madeacross multiple firms require metrics capableof measuring the resulting benefits andburdens. Individual companies may have tosacrifice internal efficiencies or performadditional functions to reduce or optimizetotal supply chain costs [39]. Consequently,some firms will benefit from the realignmentof activities of functions while others will incuradditional burdens or costs. Managementneeds the capability to measure where anybenefits or burdens have occurred and a
mechanism for negotiating an equitableredistribution of the benefits among firms [40].
Supply chain metrics are needed tosustain competitiveness and to differentiateproduct and service offerings. Thecommoditization of products and the numberof competitive product offerings are forcingmanagement to differentiate the firm’sofferings through increased performance. Asa result, managers must examine the supplychain to determine additional revenueopportunities and where they can obtain thegreatest leverage to differentiate the brandand/or to eliminate costs [41]. Integratedmetrics allow management to assess theoverall competitiveness of the supply chainand to determine which internal improvementefforts produce the greatest impact on overallcompetitiveness [42].
Supply chain metrics are also necessaryto encourage the desired changes in behavior.Rewards and incentives are usually based onperformance measurements that are focusedinternally rather than on the consumer or thesupply chain [43]. The metrics used influencethe behavior of individuals and determinesupply chain performance [44]. The metrics
Figure 4Types of Inter-company Business Process Links
Managed Process LinksMonitor Process LinksNot-Managed Process LinksNon-Member Process Links
Focal Company
Members of the Focal Company’s Supply Chain
Non-Members of the Focal Company’s Supply Chain
Tier 2Suppliers
Tier 3 toInitial
suppliersTier 1
SuppliersTier 1
CustomersTier 2
Customers
Tier 3 toConsumers/
End-Customers
Initi
al S
uppl
iers
Tier
3 to
n s
uppl
iers
Tier
3 to
n c
usto
mer
s
Cons
umer
s/En
d-Cu
stom
ers
1
2n
1n
1
23n
1n
1
2n
1n
1
23
1
2
n1n
ln
1
2
3
n
Source: Douglas M. Lambert, Martha C. Cooper and Janus D. Pagh, “Supply Chain Management: Implementation Issues andResearch Opportunities”, The International Journal of Logistics Management, Vol. 9, No. 2 (1998), p. 7.
Integrated metrics allowmanagement to assess
the overallcompetitiveness of the
supply chain and todetermine which
internal improvementefforts produce thegreatest impact on
overall competitiveness.
Page 8 The International Journal of Logistics Management
provide the means for management todetermine whether the performance of the firm’s supply chain members hasimproved or degraded and what factors have contributed to the situation. Behavior of managers in individual firms can bemodified and controlled throughmeasurements such as increases in value orcompetitiveness, or through the use ofrewards and sanctions [45].
The focus on internal logistics metricsresults in performance measures and activitiesnot being aligned with supply chain strategy.The operational objectives of the companiesfrequently conflict with one another leadingto inefficiencies in the supply chain [46].Many of the measurements used within firmsare developed in isolation and are linked tolocal rewards rather than strategy. Themissing connection between strategy andmeasurements promotes an internal focus that becomes an obstacle to developingsupply chain metrics [47]. The disconnectbetween strategy and performance measurescontributes to many of the strategic levelmeasures appearing unrelated or notactionable at lower levels in the corporatehierarchy. For example, companies do nothave metrics that measure customer servicefrom the consumer’s perspective despitehaving strategic goals of satisfying customerrequirements. Many critical customer servicemeasures are not tracked by existingperformance measurement systems despitetheir effect on supply chain performance [48].As a result, the relationship between theperformance of supply chain activities andwhat creates value for the consumer is notclearly understood [49].
Framework for Developing Supply Chain Metrics
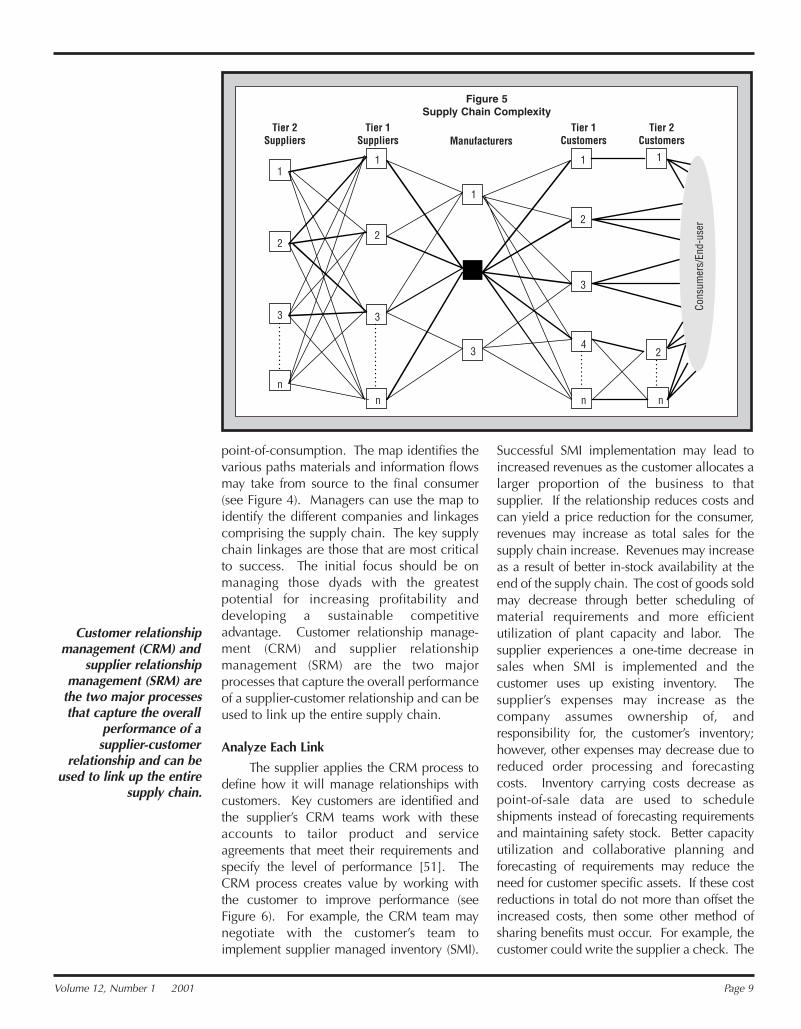
Complexity makes the development ofsupply chain performance metrics verydifficult (see Figure 5). For example,consumer goods manufacturers such asColgate-Palmolive, Procter & Gamble andUnilever sell to the same customers andpurchase from the same suppliers.Competing supply chains appear more likeinterconnected or overlapping networks thana mutually exclusive “supply chain versussupply chain” form of competition. The
overlap results in many instances of sharedinventories, shared services, and shared assetsbetween supply chains [50]. Managerscannot easily determine how businesspractices within specific companies drivetotal supply chain performance. As waspointed out earlier, you cannot simply add upinventory turns for participating firms andarrive at a total for the supply chain.
Despite the complexity and overlapexisting in most supply chains, managers candevelop metrics to align the performance ofkey business processes across multiplecompanies. We propose a framework thataligns performance at each link (supplier-customer pair) within the supply chain. Theframework begins with the linkages at thefocal company and moves outward a link at atime. The link-by-link approach provides ameans for aligning performance from point-of-origin to point-of-consumption withthe overall objective of maximizingshareholder value for the total supply chain aswell as for each company. The frameworkconsists of seven steps:• Map the supply chain from point-of-origin
to point-of-consumption to identify wherekey linkages exist.
• Use the customer relationship managementand supplier relationship managementprocesses to analyze each link (customer-supplier pair) and determine whereadditional value can be created for thesupply chain.
• Develop customer and supplier profit andloss (P&L) statements to assess the effect ofthe relationship on profitability andshareholder value of the two firms.
• Realign supply chain processes and activitiesto achieve performance objectives.
• Establish non-financial performancemeasures that align individual behaviorwith supply chain process objectives andfinancial goals.
• Compare shareholder value and marketcapitalization across firms with supplychain objectives and revise process andperformance measures as necessary.
• Replicate steps at each link in the supplychain.
Map the Supply Chain
The framework begins with the mappingof the supply chain from point-of-origin to
We propose aframework thataligns performanceat each link(supplier-customerpair) within thesupply chain.
Volume 12, Number 1 2001 Page 9
point-of-consumption. The map identifies thevarious paths materials and information flowsmay take from source to the final consumer(see Figure 4). Managers can use the map toidentify the different companies and linkagescomprising the supply chain. The key supplychain linkages are those that are most criticalto success. The initial focus should be onmanaging those dyads with the greatestpotential for increasing profitability anddeveloping a sustainable competitiveadvantage. Customer relationship manage-ment (CRM) and supplier relationshipmanagement (SRM) are the two majorprocesses that capture the overall performanceof a supplier-customer relationship and can beused to link up the entire supply chain.
Analyze Each Link
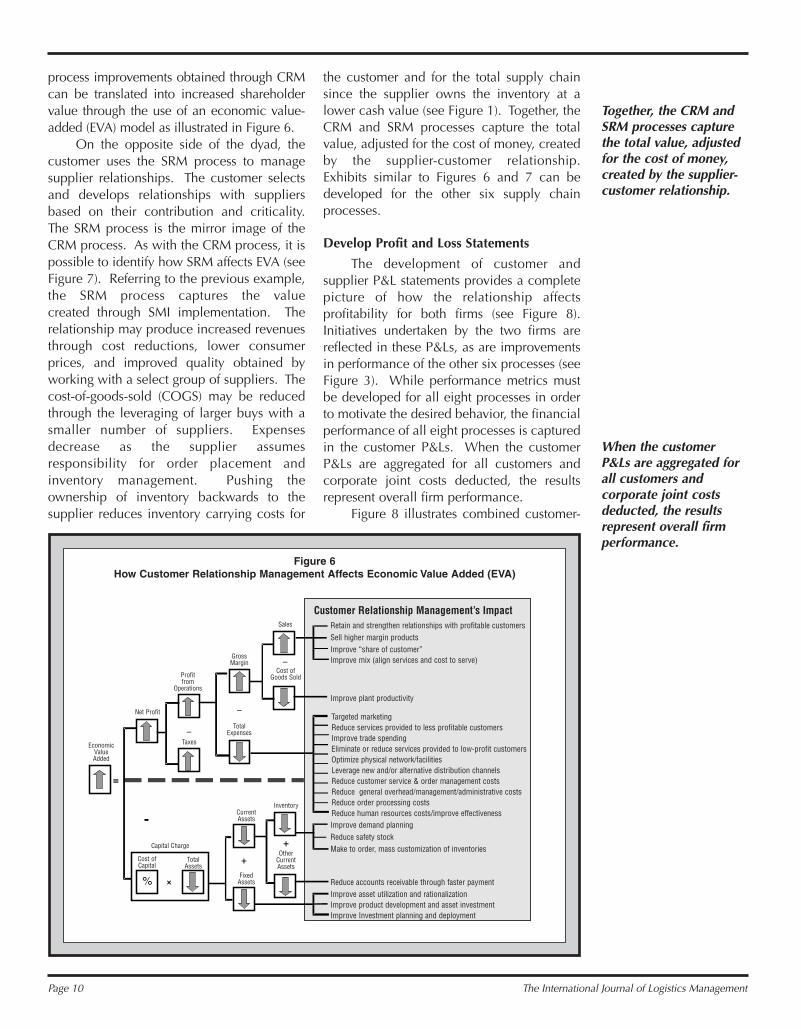
The supplier applies the CRM process todefine how it will manage relationships withcustomers. Key customers are identified andthe supplier’s CRM teams work with theseaccounts to tailor product and serviceagreements that meet their requirements andspecify the level of performance [51]. TheCRM process creates value by working withthe customer to improve performance (seeFigure 6). For example, the CRM team maynegotiate with the customer’s team toimplement supplier managed inventory (SMI).
Successful SMI implementation may lead toincreased revenues as the customer allocates alarger proportion of the business to thatsupplier. If the relationship reduces costs andcan yield a price reduction for the consumer,revenues may increase as total sales for thesupply chain increase. Revenues may increaseas a result of better in-stock availability at theend of the supply chain. The cost of goods soldmay decrease through better scheduling ofmaterial requirements and more efficientutilization of plant capacity and labor. Thesupplier experiences a one-time decrease insales when SMI is implemented and thecustomer uses up existing inventory. Thesupplier’s expenses may increase as thecompany assumes ownership of, andresponsibility for, the customer’s inventory;however, other expenses may decrease due toreduced order processing and forecastingcosts. Inventory carrying costs decrease aspoint-of-sale data are used to scheduleshipments instead of forecasting requirementsand maintaining safety stock. Better capacityutilization and collaborative planning andforecasting of requirements may reduce theneed for customer specific assets. If these costreductions in total do not more than offset theincreased costs, then some other method ofsharing benefits must occur. For example, thecustomer could write the supplier a check. The
Figure 5Supply Chain Complexity
Cons
umer
s/En
d-us
er
11
1
22
3 3
3
n
Tier 2Suppliers
Tier 1Suppliers
Tier 1Customers
Tier 2CustomersManufacturers
n
1 1
2
2
3
4
n n
Customer relationshipmanagement (CRM) and
supplier relationshipmanagement (SRM) are
the two major processesthat capture the overall
performance of asupplier-customer
relationship and can beused to link up the entire
supply chain.
Page 10 The International Journal of Logistics Management
process improvements obtained through CRMcan be translated into increased shareholdervalue through the use of an economic value-added (EVA) model as illustrated in Figure 6.
On the opposite side of the dyad, thecustomer uses the SRM process to managesupplier relationships. The customer selectsand develops relationships with suppliersbased on their contribution and criticality.The SRM process is the mirror image of theCRM process. As with the CRM process, it ispossible to identify how SRM affects EVA (seeFigure 7). Referring to the previous example,the SRM process captures the value created through SMI implementation. Therelationship may produce increased revenuesthrough cost reductions, lower consumerprices, and improved quality obtained byworking with a select group of suppliers. Thecost-of-goods-sold (COGS) may be reducedthrough the leveraging of larger buys with asmaller number of suppliers. Expensesdecrease as the supplier assumesresponsibility for order placement andinventory management. Pushing theownership of inventory backwards to thesupplier reduces inventory carrying costs for
the customer and for the total supply chainsince the supplier owns the inventory at alower cash value (see Figure 1). Together, theCRM and SRM processes capture the totalvalue, adjusted for the cost of money, createdby the supplier-customer relationship.Exhibits similar to Figures 6 and 7 can bedeveloped for the other six supply chainprocesses.
Develop Profit and Loss Statements
The development of customer andsupplier P&L statements provides a completepicture of how the relationship affectsprofitability for both firms (see Figure 8).Initiatives undertaken by the two firms arereflected in these P&Ls, as are improvementsin performance of the other six processes (seeFigure 3). While performance metrics mustbe developed for all eight processes in orderto motivate the desired behavior, the financialperformance of all eight processes is capturedin the customer P&Ls. When the customerP&Ls are aggregated for all customers andcorporate joint costs deducted, the resultsrepresent overall firm performance.
Figure 8 illustrates combined customer-
Figure 6How Customer Relationship Management Affects Economic Value Added (EVA)
–
–
–
+
+
+
=
-
%
Targeted marketingReduce services provided to less profitable customersImprove trade spendingEliminate or reduce services provided to low-profit customersOptimize physical network/facilitiesLeverage new and/or alternative distribution channelsReduce customer service & order management costsReduce general overhead/management/administrative costsReduce order processing costsReduce human resources costs/improve effectiveness
Retain and strengthen relationships with profitable customersSell higher margin productsImprove “share of customer”Improve mix (align services and cost to serve)
Improve plant productivity
Improve demand planningReduce safety stockMake to order, mass customization of inventories
Reduce accounts receivable through faster paymentImprove asset utilization and rationalizationImprove product development and asset investmentImprove Investment planning and deployment
EconomicValueAdded
Net Profit
Cost ofCapital
TotalAssets
Capital Charge
FixedAssets
CurrentAssets
Inventory
OtherCurrentAssets
Profitfrom
Operations
Taxes
GrossMargin
TotalExpenses
Sales
Cost ofGoods Sold
Customer Relationship Management’s Impact
Together, the CRM andSRM processes capturethe total value, adjustedfor the cost of money,created by the supplier-customer relationship.
When the customerP&Ls are aggregated forall customers andcorporate joint costsdeducted, the resultsrepresent overall firmperformance.
Volume 12, Number 1 2001 Page 11
supplier profitability analysis for amanufacturer selling to a wholesaler orretailer. In the case of the supplier(manufacturer), variable manufacturing costsare deducted from net sales to calculate amanufacturing contribution. Next, variablemarketing and logistics costs are deducted tocalculate a contribution margin. Assignablenonvariable costs, such as slotting allowancesand inventory carrying costs, are subtracted toobtain a segment controllable margin. Thenet margin is obtained after deducting acharge for dedicated assets. In the case of thecustomer (wholesaler or retailer), productcosts are deducted from sales to obtain agross margin to which discounts andallowances are added to obtain the netmargin. The remaining steps are similar tothose taken by the supplier to obtain the netsegment margin. These statements containopportunity costs for investments inreceivables and inventory and a charge fordedicated assets. Consequently, they aremuch closer to cash flow statements than atraditional P&L. They contain revenues minusthe costs (avoidable costs) that disappear if therevenue disappears. If the supplier is selling
an undifferentiated commodity to a customerthat is another manufacturer, then thecustomer’s report on the supplier is a totalcost analysis unless revenue can be attributedto a source of supply (e.g., better quality orfewer returns). The customer compares thetotal cost for the current period to similarperiods in the past or to comparable suppliersto determine the change in performance.
Realign Supply Chain Processes
The P&Ls provide the best measure ofsupply chain performance and can be used toalign performance across processes andbetween firms. In our SMI example, thesupply chain has the objective of increasingavailability while simultaneously reducingcosts. SMI implementation may cause thesupplier to incur additional costs in someareas while obtaining cost reductions inothers. The supplier’s P&L reflects theresulting total cost as well as changes in assets (because of charges for assetsemployed), revenue, and profitability.Similarly, the customer’s P&L reflects anychanges due to SMI implementation. Acombined profitability analysis captures the
Figure 7How Supplier Relationship Management Affects Economic Value Added (EVA)
chain performanceand can be used toalign performance
across processes andbetween firms.
Increase productivityDecrease staffing
Reduce, freight and indirect labor/warehousing costsOptimize physical network/facilities
Leverage new and/or alternative distribution channelsReduce customer service & order management costs
Reduce general overhead/management/administrative costsReduce information system costs
Reduce human resources costs/improve effectiveness
Reduce purchase goods inventoriesReduce work in process inventoriesReduce finished goods inventories
Improve asset utilization and rationalization (warehousing & plant)
Improve investment planning and deployment
Page 12 The International Journal of Logistics Management
total effort and enables management to betterunderstand how aligning their actions withsupply chain objectives drives profitability intheir firms. They can use this information as abasis for negotiating how to equitably splitany benefits or burdens resulting from supplychain process improvements. In order toevaluate proposed programs, proforma P&Lscan be developed. This approach provides amuch more accurate measure of supply chainperformance than existing measures.
Functional or logistics measures, such asinventory turns, cannot capture the full extentof management cost trade-offs and can beeasily “gamed.” As previously described,inventory carrying cost is a better measure,but it does not capture the costs incurred toachieve the reduction in inventory. Increasesin production setup costs, transportationcosts, ordering costs and lost sales costs maymore than offset any gains made in inventorycarrying costs. Typically, inventory reductionshave a greater impact on total supply chainperformance if they occur at the retail level.Generally speaking, making to order, pushinginventory backwards or pushing inventoryownership backwards in the supply chainimproves overall performance. A combinedcustomer-supplier profitability analysis willcapture how the repositioning of inventory
improves total supply chain performance,whereas inventory turns does not reflect anyof the cost trade-offs within a firm or in thesupplier-customer link.
Align Non-financial Measures with P&Ls
P&Ls and EVA measures alone are notsufficient to effect improvements in supplychain performance or to align behavior.Supply chain and corporate metrics must becascaded down to develop performancemeasures at the lowest level in theorganization. For example, managers beginwith the objectives identified in Figure 9 fordeveloping performance measures for theorder fulfillment process. A warehousemanor order fulfillment specialist supporting thisprocess may not be able to relate how moreefficient order picking and picking accuracyimpact profitability or shareholder value, butthey can focus on reducing order pick timeand errors. Reducing order pick time whileincreasing productivity reduces the cost perorder. Reducing order pick errors results infaster payment of customer invoices andreduces the cost of returned goods. Byoutperforming the competition, a faster ordercycle time may lead to increased sales.Individual performance measures must betied to the specific objectives required to
Charge for Dedicated Assets Used Charge for Dedicated Assets UsedNet Segment Margin Net Segment Margin
A combined customer-supplier profitabilityanalysis will capturehow the repositioning ofinventory improves totalsupply chainperformance whereasinventory turns does notreflect any of the costtrade-offs within a firmor in the supplier-customer link.
Volume 12, Number 1 2001 Page 13
improve profitability and shareholder value ateach link in the supply chain. Therelationship between improved non-financialperformance and shareholder value can beaccomplished by converting activities intocosts through such means as activity-basedcosting, identifying any revenue or assetimplications, and inserting this informationinto an EVA or profit analyses.
Compare Across Firms and Replicate
The final steps in the frameworkcompare the resulting shareholder value and market capitalization across firms (seeFigure 10) and replicate these steps at everylink in the supply chain. Overall performanceis determined by the increase in marketcapitalization for each firm in the supplychain. The wholesaler/distributor’s P&L for Cas a supplier and the manufacturer’s costsaving for D as a supplier are not included inthe market capitalization metric to avoiddouble counting as an increase in profit orexpense reduction from a supplier is capturedin the customer P&Ls. In the case of theretailer/end user, it would be unusual to havecustomer P&Ls so overall profitability is
determined by summing supplier P&Ls anddeducting corporate joint costs. Whilemanagement’s goal is to increase shareholdervalue, economic conditions or other eventscan lead to depressed price-earningsmultiples in the short run. In these situations,it may be better to simply sum the changes innet profits. In Figure 10, all firms show anincrease in profits because management usesthe financial data to negotiate an equitablesharing of the costs and benefits.
Managers should assess whether theprocess changes and metrics employed haveproduced the targeted levels of profitabilityand shareholder value. They may need torefine the processes or make additional trade-offs to achieve the targets. In many instances,managers need to look further upstream ordownstream in the supply chain to achievetheir objectives. They may find second orthird tier customers and suppliers provideadditional opportunities to reduce cost,increase quality, and accelerate productdevelopment. The supply chain mayeliminate some intermediaries that do not addvalue or may insert others that can increasethe profitability of certain segments; forexample, a distributor may be used to service
Figure 9How Order Fulfillment Affects Economic Value Added (EVA)
–
–
–
+
+
=
-
% +
Increase orders shipped completeReduce damage and tracingReduce services provided to less profitable customersReduce handling costs
Reduce general overhead/management/administrative costsReduce outbound freightOptimize physical network/facilitiesLeverage new and/or alternative distribution channels
Reduce errors, claims and customers returns
Reduce order cycle timeReduce human resources costs/improve effectiveness
Reduce finished goods inventory
Reduce obsolete inventory
Reduce accounts receivable through faster payment
Improve asset utilization and rationalization
Obtain repeat business
Increase share of market and/or customer
Retain and strengthen relationships with profitable customers
EconomicValueAdded
Net Profit
Cost ofCapital
Capital Charge
TotalAssets
FixedAssets
CurrentAssets
Inventory
OtherCurrentAssets
Profitfrom
Operations
Taxes
GrossMargin
TotalExpenses
Sales
Order Fulfillment’s Impact
Cost ofGoods Sold
Overall performanceis determined by the
increase in marketcapitalization foreach firm in the
supply chain.
Page 14 The International Journal of Logistics Management
a large number of small accounts or toachieve distribution in a remote geographicregion.
The customer-supplier profitabilityanalysis should be applied at each link in thesupply chain. By analyzing the processes ateach link and understanding the value thelink creates, managers can align the supplychain processes in order to provide the bestvalue for consumers/end users and the highestprofitability and shareholder value for eachcompany. This framework increasesmanagement’s understanding of how theirfirm contributes to the overallcompetitiveness and value created by thesupply chain and provides the opportunity fora dynamic realignment of the supply chain.Management maximizes performance at eachlinkage and over time, the firms obtain thebest performance. Eventually the processesbecome more efficient and effective and thesupply chain naturally migrates to the pointthat maximizes profitability for each party andthe whole. The process is on-going andrequires continual adjustment. Managers cantake proactive action within their firm as wellas negotiate with other firms to further
increase overall supply chain performance.Management must understand how value iscreated by each process at each link in thesupply chain, take collaborative action toincrease value, and replicate these stepsacross the entire supply chain. Ultimately, itis the value provided to retail customers orindustrial end users (product and servicequality relative to price) that determines thecompetitiveness of the supply chain and theprofitability of its members.
Future ResearchFuture research is required to test the
proposed framework in an actual businesssetting. Barriers to implementation and howthey can be overcome need to be identified.Nonfinancial metrics must be developed forparticipating firms and tied to their financialperformance. The goal should not be toidentify specific metrics, but to provide theframework that allows managment to developthe best metrics for their situation. To theextent that similar metrics are identified indifferent supply chain settings, it may bepossible to conclude that standard metrics
Figure 10Profit and Market Capitalization Increases Measured Across Four Tiers of the Supply Chain
ManufacturerC
SupplierD
P&L forB as customer
P&L forC as customer
∆ Revenue-∆ Cost∆ Profit
x Price Earn RatioMkt Cap for C
∆ Revenue-∆ Cost∆ Profit
x Price Earn RatioMkt Cap for D
∆ Cost = ∆ Profit ∆ Revenue-∆ Cost∆ Profit
x Price Earn RatioMkt Cap for B
∆ Revenue-∆ Cost∆ Profit
x Price Earn RatioMkt Cap for A
∆ Revenue-∆ Cost∆ Profit
P&L forC as supplier
Total Cost Report forD as supplier
P&L forA as customer
P&L forB as supplier
SRM SRM SRM
CRM CRM CRM
Wholesaler/Distributor
B
Retailer/End User
A
Supply Chain Performance = Increase in Market Cap for A, B, C, and D
By analyzing theprocesses at each linkand understanding thevalue the link creates,managers can align thesupply chain processesin order to provide thebest value forconsumers/end usersand the highestprofitability andshareholder value foreach company.
Volume 12, Number 1 2001 Page 15
can be developed. Once the P&L statementsdescribed in this article are developed,management will still require a framework fornegotiating an equitable distribution of costsand benefits. This promises to be another areawith significant research potential. Finally,progress should be tracked over time toidentify the costs associated withimplementing the proposed framework andthe long-term benefits that can derived fromimplementation.
ConclusionsMost of the performance measures
called supply chain metrics are nothing morethan logistics measures that have an internalfocus and do not capture how the firm drivesvalue or profitability in the supply chain.These measures may actually prove to bedysfunctional by attempting to optimize thefirm’s performance at the expense of the otherfirms in the supply chain, an approach thateventually decreases the value of the entiresupply chain. The use of customer andsupplier contribution reports avoids thissituation. The customer-supplier P&Lscapture cost trade-offs as well as revenueimplications, and any action taken by onefirm is reflected in both firms’ P&Ls. Thecombined P&Ls provide the necessaryfoundation for improving performance in thesupply chain. Although one firm may incuradditional costs, the combined analysisreflects whether the costs associated with aprocess improvement increased profitabilitythrough a larger share of the customer’sbusiness or increased supply chaincompetitiveness. By maximizing profitabilityat each link, supply chain performancemigrates toward management’s objectivesand maximizes performance for the whole.
References[1] Gilmour, Peter, “A Strategic Audit
Framework to Improve Supply ChainPerformance,” Journal of Business andIndustrial Marketing, Vol. 14, No. 5/6 (1999),pp. 355-363.
[2] Beamon, Benita M., “MeasuringSupply Chain Performance,” InternationalJournal of Operations and ProductionManagement, Vol. 19, No. 3 (1989), pp. 275-292, and James S. Keebler, Karl B. Manrodt,
David A. Durtsche, and D. Michael Ledyard,Keeping Score, Oak Brook, IL: Council ofLogistics Management, 1999.
[3] Lapide, Larry, “What AboutMeasuring Supply Chain Performance?”Achieving Supply Chain Excellence ThroughTechnology, David L. Anderson editor, SanFrancisco, CA: Montgomery Research, 1999,pp. 287-297; Energizing the Supply Chain:Trends and Issues in Supply ChainManagement, New York, NY: DeloitteConsulting, 1999, p. 15; Supply ChainOperations Reference Model Overview ofSCOR Version 3.1, Pittsburgh, PA: SupplyChain Council, 2000, p. 9; “HighPerformance Value Chains: A Report of the2000 Value Chain Survey,” New York, NY:Cap Gemini Ernst & Young and IndustryWeek, 2000, page 7; Debra SeamanLangdon, “Measure the Whole,” iSourceBusiness, March 2001, pp. 33-36; David L.Anderson, Franke E. Britt, and Donavon J.Favre, “The Seven Principles of Supply ChainManagement,” Supply Chain ManagementReview, Vol. 1, No. 1 (1997), pp. 31-41; JohnH. Dobbs, “Competition’s New Battleground:The Integrated Value Chain,” Cambridge, MA:Cambridge Technology Partners, p. 19; and,“Driving Inventory Control with Best-In-ClassPlanning Practices,” Signals of Performance,Vol. 2, No. 4 (2001), p. 2.
[4] Chapter 5 in James R. Stock andDouglas M. Lambert, Strategic LogisticsManagement, 4th Ed., Burr Ridge, IL:McGraw-Hill Irwin, 2001, pp. 187-221.
[5] Coyle, John J., Edward J. Bardi and Robert A. Novack, Transportation, 5th Ed., Cincinnati: South-Western CollegePublishing, 2000; William C. Copacino,Supply Chain Management The Basics andBeyond, Boca Raton, FL: St. Lucie Press, p. 7;Robert B. Handfield and Ernest L. Nichols, Jr.,Introduction to Supply Chain Management,Upper Saddle, NJ: Prentice Hall Inc., 1999, p.7; and, David Simchi-Levi, Philip Kaminsky,and Edith Simchi-Levi, Designing andManaging the Supply Chain, Boston, MA:Irwin McGraw-Hill, 2000, p. 1.
[6] What’s It All About? Oak Brook, IL:Council of Logistics Management, 1986.
[7] Lambert, Douglas M. and Martha C.Cooper, “Issues in Supply Chain Management,”Industrial Marketing Management, Vol. 29, No.1 (2000), pp. 65-83.
By maximizingprofitability at each
link, supply chainperformance
migrates towardmanagement’sobjectives and
maximizesperformance for
the whole.
Page 16 The International Journal of Logistics Management
[8] Lee, Hau L. and Corey Billington,“Managing Supply Chain Inventory: Pitfallsand Opportunities,” Sloan ManagementReview, Vol. 33, No. 3 (Spring 1992), pp. 65-73; Larry Lapide, “What About MeasuringSupply Chain Performance?” AchievingSupply Chain Excellence Through Technology,San Francisco, CA: Montgomery Research,1999, pp. 287-297; Benita M. Beamon,“Measuring Supply Chain Performance,”International Journal of Operations andProduction Management, Vol. 19, No. 3(1989), pp. 275-292; Peter Gilmour, “AStrategic Audit Framework to Improve SupplyChain Performance,” Journal of Business andIndustrial Marketing, Vol. 14, No. 5/6 (1999),pp. 355-363; and, James S. Keebler, Karl B.Manrodt, David A. Durtsche and D. MichaelLedyard, Keeping Score, Oak Brook, IL:Council of Logistics Management, 1999.
[9] Cooper, Martha C., Douglas M.Lambert and Janus D. Pagh, “Supply ChainManagement: More Than a New Name forLogistics,” The International Journal ofLogistics Management, Vol. 8, No. 1 (1997),pp. 1-14.
[10] Beamon, Benita M., “MeasuringSupply Chain Performance,” InternationalJournal of Operations and ProductionManagement, Vol. 19, No. 3 (1989), pp. 275-292.
[11] Holmberg, Stefan, “A SystemsPerspective on Supply Chain Measurements,”International Journal of Physical Distributionand Logistics Management, Vol. 30, No. 10(2000), pp. 847-868.
[12] van Hoek, Remko I., “Measuring theUnmeasureable—Measuring and ImprovingPerformance in the Supply Chain,” SupplyChain Management, Vol. 3, No. 4 (1998), pp.187-192.
[13] Lee, Hau L. and Corey Billington,“Managing Supply Chain Inventory: Pitfallsand Opportunities,” Sloan ManagementReview, Vol. 33, No. 3 (Spring 1992), pp. 65-73; “Supply Chain Solutions: Linking theChains,” Kevin Francella and KatherineDoherty editors, Supplement to FoodLogistics, March 1998; and, Supply ChainManagement, edited by John T. Mentzer,Thousand Oaks, CA: Sage Publishing, 2001,p. 435.
[14] Caplice, Chris and Yossi Sheffi, “AReview and Evaluation of Logistics
Performance Measurement Systems,” TheInternational Journal of Logistics Management,Vol. 6, No. 1 (1995), pp. 61-74.
[15] Lapide, Larry, “What AboutMeasuring Supply Chain Performance?”Achieving Supply Chain Excellence ThroughTechnology, David L. Anderson editor, SanFrancisco, CA: Montgomery Research, 1999,pp. 287-297.
[16] Lee, Hau L. and Corey Billington,“Managing Supply Chain Inventory: Pitfallsand Opportunities,” Sloan ManagementReview, Vol. 33, No. 3 (Spring 1992), pp. 65-73.
[17] “Supply Chain Solutions: Linkingthe Chains,” Kevin Francella and KatherineDoherty editors, Supplement to FoodLogistics, March 1998.
[18] van Hoek, Remko I., “Measuring theUnmeasureable—Measuring and ImprovingPerformance in the Supply Chain,” SupplyChain Management, Vol. 3, No. 4 (1998), pp.187-192.
[19] Kallio, Jukka, Timo Saarinen,Markku Tinnila and Ari P. J. Vepsalainen,“Measuring Delivery Process Performance,”The International Journal of LogisticsManagement, Vol. 11, No. 1 (2000), pp. 75-87.
[20] Keebler, James S., Karl B. Manrodt,David A. Durtsche and D. Michael Ledyard,Keeping Score, Oak Brook, IL: Council ofLogistics Management, 1999.
[21] Lee, Hau L. “Creating Value ThroughSupply Chain Integration,” Supply ChainManagement Review,Vol. 4, No. 4 (2000), pp.30-40.
[22] “Supply Chain Solutions: Linkingthe Chains,” Kevin Francella and KatherineDoherty editors, Supplement to FoodLogistics, March 1998.
[23] Performance Measurement: Apply-ing Value Chain Analysis to the GroceryIndustry, Joint Industry Project on EfficientConsumer Response, 1994.
[24] van Hoek, Remko I., “Measuring theUnmeasureable—Measuring and ImprovingPerformance in the Supply Chain,” SupplyChain Management, Vol. 3, No. 4 (1998), pp.187-192.
[25] “Supply Chain Solutions: Linkingthe Chains,” Kevin Francella and KatherineDoherty editors, Supplement to FoodLogistics, March 1998.
Volume 12, Number 1 2001 Page 17
[26] Walker, William T., “Use GlobalPerformance Measures to Align the EnterpriseTrading Partners,” Achieving Supply ChainExcellence Through Technology, Vol. 1,www.ascet.com; and, “Supply ChainSolutions: Linking the Chains,” KevinFrancella and Katherine Doherty editors,Supplement to Food Logistics, March 1998.
[27] Keebler, James S., Karl B. Manrodt,David A. Durtsche and D. Michael Ledyard,Keeping Score, Oak Brook, IL: Council ofLogistics Management, 1999.
[28] Walker, William T., “Use GlobalPerformance Measures to Align the EnterpriseTrading Partners,” Achieving Supply ChainExcellence Through Technology, David L.Anderson, editor, San Francisco, CA:Montgomery Research, 1999.
[30] van Hoek, Remko I., “Measuring theUnmeasureable—Measuring and ImprovingPerformance in the Supply Chain,” SupplyChain Management, Vol. 3, No. 4 (1998), pp.187-192.
[31] van Hoek, Remko I., “Measuring theUnmeasureable—Measuring and ImprovingPerformance in the Supply Chain,” SupplyChain Management, Vol. 3, No. 4 (1998), pp.187-192.
[32] Sherman, Richard J., Supply ChainManagement for the Millennium, Oak Brook,IL: Warehousing Education and ResearchCouncil, 1998.
[33] Lee, Hau L. and Corey Billington,“Managing Supply Chain Inventory: Pitfallsand Opportunities,” Sloan ManagementReview, Vol. 33, No. 3 (Spring 1992), pp. 65-73.
[34] Lee, Hau L. and Corey Billington,“Managing Supply Chain Inventory: Pitfallsand Opportunities,” Sloan ManagementReview, Vol. 33, No. 3 (Spring 1992), pp. 65-73.
[35] Lapide, Larry, “What AboutMeasuring Supply Chain Performance?”Achieving Supply Chain Excellence ThroughTechnology, David L. Anderson, editor, SanFrancisco, CA: Montgomery Research, 1999,pp. 287-297; Rhonda R. Lummus, and RobertJ. Vokurka, “Managing the Demand ChainThrough Managing the Information Flow:Capturing ‘Moments of Information,’”
Production and Inventory ManagementJournal, First Quarter (1999), pp. 16-20; and,Andrew K. Reese, “Metrics Mentality,” iSourceBusiness, June 2001, pp. 67-70.
[36] van Hoek, Remko I., “Measuring theUnmeasureable—Measuring and ImprovingPerformance in the Supply Chain,” SupplyChain Management, Vol. 3, No. 4 (1998), pp.187-192; Lapide, Larry, “What AboutMeasuring Supply Chain Performance?”Achieving Supply Chain Excellence ThroughTechnology, David L. Anderson editor, SanFrancisco, CA: Montgomery Research, 1999,pp. 287-297; and, Richard J. Sherman, SupplyChain Management for the Millennium, OakBrook, IL: Warehousing Education andResearch Council, 1998.
[37] Reese, Andrew K., “MetricsMentality,” iSource Business, June 2001, pp.67-70.
[38] Lummus, Rhonda R. and Robert J.Vokurka, “Managing the Demand ChainThrough Managing the Information Flow:Capturing ‘Moments of Information,’”Production and Inventory ManagementJournal, Vol. 40, No. 1 (1999), pp. 16-20.
[39] van Hoek, Remko I., “Measuring theUnmeasureable—Measuring and ImprovingPerformance in the Supply Chain,” SupplyChain Management, Vol. 3, No. 4 (1998), pp.187-192; and, Christopher D. Norek, “MassMerchant Discounters: Drivers of LogisticsChange,” Journal of Business Logistics, Vol.18, No. 1 (1997), pp. 1-17.
[40] La Londe, Bernard J. and Terrance L.Pohlen, “Issues in Supply Chain Costing,” TheInternational Journal of Logistics Management,Vol. 7, No. 1 (1994), pp. 1-12.
[41] Keebler, James S., Karl B. Manrodt,David A. Durtsche and D. Michael Ledyard,Keeping Score, Oak Brook, IL: Council ofLogistics Management, 1999; Glenn A.Mercer, “Don’t Just Optimize—Unbundle,”The McKinsey Quarterly, No. 3, (1994), pp.103-116; and, Mary Collins Holcomb andKarl B. Manrodt, “The Shippers’ Perspective:Transportation and Logistics Trends andIssues,” Transportation Journal, Vol. 40, No. 1(Fall 2000), pp. 15-25.
[42] van Hoek, Remko I., “Measuring theUnmeasureable—Measuring and ImprovingPerformance in the Supply Chain,” SupplyChain Management, Vol. 3, No. 4 (1998), pp.187-192.
Page 18 The International Journal of Logistics Management
[43] Lee, Hau L. and Corey Billington,“Managing Supply Chain Inventory: Pitfallsand Opportunities,” Sloan ManagementReview, Vol. 33, No. 3 (Spring 1992), pp. 65-73; and Andy Neely, Mike Gregory and KenPlatts, “Performance Measurement SystemDesign,” International Journal of Operationsand Production Management, Vol. 15, No. 4(1995), pp. 80-116.
[44] Lapide, Larry, “What AboutMeasuring Supply Chain Performance?”Achieving Supply Chain Excellence ThroughTechnology, David L. Anderson editor, SanFrancisco, CA: Montgomery Research, 1999,pp. 287-297.
[45] Neely, Andy, Mike Gregory and KenPlatts, “Performance Measurement SystemDesign,” International Journal of Operationsand Production Management, Vol. 15, No. 4(1995), pp. 80-116.
[46] Holmberg, Stefan, “A SystemsPerspective on Supply Chain Measurements,”International Journal of Physical Distributionand Logistics Management, Vol. 30, No. 10(2000), pp. 847-868; Hau L.Lee and CoreyBillington, “Managing Supply ChainInventory: Pitfalls and Opportunities,” SloanManagement Review, Vol. 33, No. 3 (Spring1992), pp. 65-73; Richard J. Sherman, SupplyChain Management for the Millennium, OakBrook, IL: Warehousing Education andResearch Council, 1998; and Larry Lapide,“What About Measuring Supply ChainPerformance?” Achieving Supply ChainExcellence Through Technology, David L.Anderson editor, San Francisco, CA:Montgomery Research, (1999), pp. 287-297.
[47] Supply Chain Management, editedby John T. Mentzer, Thousand Oaks, CA: SagePublishing, 2001; Benita M. Beamon,“Measuring Supply Chain Performance,”International Journal of Operations andProduction Management, Vol. 19, No. 3(1989), pp. 275-292; Andy Neely, MikeGregory and Ken Platts, “PerformanceMeasurement System Design,” InternationalJournal of Operations and ProductionManagement, Vol. 15, No. 4 (1995), pp. 80-116; Stefan Holmberg, “A Systems Perspectiveon Supply Chain Measurements,“International Journal of Physical Distributionand Logistics Management, Vol. 30, No. 10
(2000), pp. 847-868; Keah-Choon Tan, VijayR. Kannan, Roberts B. Handfield and SoumenrGhosh, “Supply Chain Management: AnEmpirical Study of Its Impact on Performance,”International Journal of Operations andProduction Management, Vol. 19, No. 10(1999), pp. 1034-1052; Anthony A. Atkinson,John H. Waterhouse, and Robert B. Wells, “A Stakeholder Approach to StrategicPerformance Measurement,” SloanManangement Review, Vol. 38, No. 2 (Spring1997), pp. 25-37; and, M. E. Kuwaiti and JohnM. Kay, “The Role of PerformanceMeasurement in Business ProcessReengineering,” International Journal ofOperations, and Production Management,Vol. 20. No. 12 (2000), pp. 1411-1426.
[48] Lee, Hau L. and Corey Billington,“Managing Supply Chain Inventory: Pitfallsand Opportunities,” Sloan ManagementReview, Vol. 33, No. 3 (Spring 1992), pp. 65-73; and, Andy Keely, Mike Gregory and KenPlatts, “Performance Measurement SystemDesign,” International Journal of Operationsand Production Management, Vol. 15, No. 4(1995), pp. 80-116.
[49] “Supply Chain Solutions: Linkingthe Chains,” Kevin Francella and KatherineDoherty editors, Supplement to FoodLogistics, March 1998; and, Joint IndustryProject on Efficient Consumer Response,Performance Measurement: Applying ValueChain Analysis to the Grocery Industry, 1994.
[50] Rice James B. Jr. and Richard M.Hoppe, “Supply Chain vs. Supply Chain: TheHype & The Reality,” Supply ChainManagement Review,Vol. 5, No. 5 (2001), pp.46-54.
[51] Lambert, Douglas M. and Martha C.Cooper, “Issues in Supply Chain Manage-ment,” Industrial Marketing Management, Vol.29, No. 1 (2000), pp. 65-83; Martha C.Cooper, Douglas M. Lambert and Janus D.Pagh, “Supply Chain Management: More Thana New Name for Logistics,” The InternationalJournal of Logistics Management, Vol. 8 No. 1(1997), pp. 1-14; and, Douglas M. Lambert,Martha C. Cooper and Janus D. Pagh, “SupplyChain Management: Implementation Issuesand Research Opportunities,” TheInternational Journal of Logistics Management,Vol. 9, No. 2 (1998), pp. 1-19.
Volume 12, Number 1 2001 Page 19
AcknowledgementThe authors would like to thank the members of The Global Supply Chain Forum: 3M,
Cemex Mexico, Coca-Cola USA, Colgate-Palmolive Company, Fletcher Challenge, Ford MotorCompany, Hewlett-Packard, International Paper, Limited Logistics Services, LucentTechnologies, Maersk Sealand, Taylor Made-adidas Golf Company, Wendy’s International Inc.,and Whirlpool Corporation. Their contributions included making their firms available forstudy and dedicating time in Forum meetings to review and evaluate the research. We wouldalso like to thank our colleague, Thomas J. Goldsby, The Ohio State University, and SebastiánGarcía-Dastugue, a doctoral candidate at The Ohio State University for their suggestions onearlier drafts of this paper.
Terrance L. Pohlen, Ph.D., is an Assistant Professor of Business Logistics,University of North Florida. He has over 20 years of logistics experience in theUnited States Air Force and has served on the faculties of the Graduate School ofAcquisition and Logistics Management, Air Force Institute of Technology, and TheOhio State University. Dr. Pohlen has developed and participated in severalgovernment and commercial activity-based costing (ABC) implementations. Hisresearch interests include supply chain metrics and the effect of more accurate costinformation on supply chain structures and logistics decision-making. He receiveda BS in Marketing from Moorhead State University, a MS in Logistics from the AirForce Institute of Technology and an MA and Ph.D. from The Ohio State University.Dr. Pohlen has participated in executive education programs at the University ofNorth Florida, Northwestern University, University of North Texas and theMassachusetts Institute of Technology. His articles have appeared in the Journalof Business Logistics, International Journal of Physical Distribution and LogisticsManagement, The International Journal of Logistics Management, Distribution,Transport Topics, Operations & Fulfillment, Air Force Journal of Logistics and TheLogistics Handbook. He can be reached at: Phone: 904/620-2780. Fax: 904/620-2586. Email: [email protected]
Douglas M. Lambert is the Raymond E. Mason Chair in Transportation andLogistics and Director, The Global Supply Chain Forum, Fisher College ofBusiness, The Ohio State University and the Prime F. Osborn III Eminent ScholarChair in Transportation and Logistics, Professor of Marketing and Logistics andDirector, The International Center for Competitive Excellence at the University ofNorth Florida. Dr. Lambert has served as a faculty member for over 500 executivedevelopment programs in North and South America, Europe, Asia and Australia.He is the author of The Development of an Inventory Costing Methodology, TheDistribution Channels Decision, The Product Abandonment Decision and co-authorof Management in Marketing Channels, Fundamentals of Logistics Management,and Strategic Logistics Management. His publications include more than 100articles. Dr. Lambert received the CLM Distinguished Service Award for hiscontributions to logistics management as well as the CLM Founders Award andDoctoral Research Award. He holds an honors BA and MBA from the University ofWestern Ontario and a Ph.D. from The Ohio State University. Dr. Lambert is Co-editor of The International Journal of Logistics Management. He can be reachedat: Phone: 904/620-2588. FAX: 904/620-2586. Email: [email protected]