16
How can big businesses save billions? SUPPLY CHAIN TRANSFORMATION AND RESOURCE EFFICIENCY

How can big businesses save billions?
Supply Chain TranSformaTion and reSourCe effiCienCy

1Supply Chain Transformation and Resource Efficiency
Despite the recent commodity price boom and bust, the business case for supply chain
resource efficiency remains strong. Our analysis shows that energy and climate change-
related impacts on the supply chain can add up to billions of pounds of value-at-stake
for companies. This includes avoiding the negative impacts of input cost volatility as well
as benefits from supply chain efficiency and transformation opportunities.
This white paper examines the key drivers of supply chain risk and opportunity
for companies through the perspective of energy and climate change. We propose a
comprehensive approach to addressing this challenge by looking at supplier-focused
actions, as well as re-thinking products and business models.
authors
Aleyn Smith-Gillespie, Associate Director
Hanah Chang, Associate

2Supply Chain Transformation and Resource Efficiency
The commodity price boom that took place in the decade prior to 2014 escalated supply chain resource costs up the corporate agenda. Over that time, the price of commodities doubled on average, with metals and fuel posting even higher rises (Figure 1a). Concerns over resource constraints also came to the fore, illustrated by the European Commission singling out the supply of 20 critical raw materials as being at risk1. An international survey by the Carbon Trust of over 450 senior executives found at that time that 60% believed resource constraints would lead to increases in costs of goods sold; and over 30% saw this impacting their quality2.
The recent fall in commodity prices has been a welcome reprieve for buyers of raw materials, manufacturers, and fossil fuel-dependent sectors such as transportation. However, for many industries costs are still expensive relative to a decade earlier. For example in the UK, electricity costs for non-domestic users have continued to rise, and are more than double what they were in 2005 (Figure 1b)3. Commodity prices are already forecast to begin rising in 2017, albeit gradually.
1 European Commission, On the review of the list of critical raw materials for the EU and the implementation of the Raw Materials Initiative, 2014. 2 Carbon Trust, Are businesses sleepwalking into a resource crunch?, 2012. http://bit.ly/1Qg8KIR3 DECC, Prices of fuels purchased by non-domestic consumers in the UK, 2015.4 Index based on nominal prices. Global commodity price indices based on IMF monthly data. UK electricity and gas price indices include taxes (CCL) and are based on quarterly DECC data.
The business case for supply chain resource efficiency remains strong
Figure 1 Price index for global commodities and UK energy, 2005-20154
-
50
100
150
200
250
300
electricity (uK)
Gas (uK)
2005 2006 2007 2008 2009 2010 2011 2012 2013 2014 2015
a) Global commodity price indices (2005=100)
Source: IMF; Carbon Trust analysis Source: DECC survey of energy suppliers; Carbon Trust analysis
-
50
100
150
200
250
300
food and Beverage
agricultural raw materials
metals
fuel
2005 2006 2007 2008 2009 2010 2011 2012 2013 2014 2015
Growth trendline
(all commodities)
b) uK electricity and gas price indicates, non-domestic (2005=100)

3Supply Chain Transformation and Resource Efficiency
5 World Bank, Carbon Pricing Watch, 2015.
Figure 2 Global carbon price projections
Source: UK Department of Energy and Climate Change; Carbon Trust analysis
0
100
200
300
400
500
600
700
2014 2015 2020 2025 2030 2050
Carb
on p
rice
per
tonn
e Co
2e
Global carbon price projections to 2050
low mid (2 degree scenario) high
Of greater concern are macro trends of a growing global population that is becoming wealthier and more urbanised, set alongside the challenge of climate change. This is likely to result in increasing levels of consumption, leading to greater resource demand and price increases. At the same time government policies and regulations will impact carbon emissions. Fossil fuel subsidies are also likely to be phased out and there is a growing trend for carbon pricing, which will directly associate additional costs to energy, industrial processes and agricultural production.
Carbon emission trading is gaining traction internationally with expansion in China, Brazil, and Turkey among other countries, and a growing number of US states and Canadian provinces putting in place subnational schemes5. In order to meet the Paris COP21 climate change commitments of maintaining warming to no more than 2°C, the price of carbon emissions will need to converge to as high as $200 per tonne by 2030 (Figure 2). This compares with a price of under $10 per tonne for the EU Emissions Trading Scheme today.

4Supply Chain Transformation and Resource Efficiency
Supply chain resource risks and opportunities can drive billions of pounds in value-at-stake
The impact of energy costs powerfully illustrates the broader imperative for companies to address resource risks and opportunities within their supply chains. In addition to their own energy bills, companies indirectly buy the energy used to extract, process, manufacture, and transport material inputs, embedded within the cost structure of their supply chain. For manufacturers, this embedded energy can be ten times higher than their own operational consumption (Figure 3). As such, supply chains are multipliers of energy cost and carbon risks, as well as commodity and resource risks generally. Looking at a sample of FTSE 100 corporates6, a 10% rise in energy and fuel bills within the supply chain can equate to over 10% of a company’s annual operating profit. Across the sample, this represents an additional £40 million to £400 million7 in annual supply chain costs which would need to either be absorbed by suppliers, or passed through as higher costs to end customers. On the other hand, cost savings could be achieved if suppliers improved their energy efficiency and worked to deliver transformational change. Tier 1 suppliers with whom companies hold a direct buying relationship (and hence can most readily engage with) typically account for 30-40% of energy consumption in a manufacturing supply chain.
6 Estimation based on sample of FTSE 100 companies from the following sectors: pharmaceuticals, electronics, defence, construction, beverage, and retail.7 These figures are the additional costs directly attributable to a company based on its estimated procurement bill. The range is driven by both the size and nature of a company’s procurement, and the corresponding energy/carbon intensity of its supply chain.
Figure 3 Supply chain energy consumption for an example set manufacturing sectors
Source: Open IO; Carbon Trust analysis
0% 20% 40% 60% 80% 100%
pharmaceuticals
electronics and iCT
machinery
food & drink
Construction
home appliances
aerospace
automotive
Tier 2+ Suppliers
Tier 1 Suppliers
upstream Transportation &distributionown operations

5Supply Chain Transformation and Resource Efficiency
Based on Carbon Trust experience of driving efficiency, 20-40% energy cost savings are typically feasible across sectors (Figure 4). Applying the lower end of this range to direct (Tier 1) suppliers of the same corporate sample illustrated above, this would represent an estimated £30 million to £300 million in annual savings8. These efficiencies could be shared through lower procurement bills, or be used to mitigate the impact of future energy cost rises. Considering both the downside risk and upside cost saving opportunity of energy in the supply chain, this can represent billions of pounds in value gained or lost within the space of a few years9.
Figure 4 Identified efficiencies and paybacks in selected sectors
8 Savings value is a portion of total savings potentially achievable by suppliers, allocated to the company based on its estimated procurement bill.9 Using the sample set of FTSE corporates used as an illustration, the cumulative value of quantified energy risk and opportunity reaches between £150 million to over £1 billion within two years.
Looking beyond the economic benefits to consider climate change, it is important to note that business action on addressing carbon and energy in the supply chain can be both a mitigation as well as an adaptation strategy. Reducing supply chain carbon emissions at scale contributes to the private sector’s role in achieving global greenhouse gas emission reduction goals mitigating the most serious impacts of dangerous climate change. At the same time, the effort can enable companies’ supply chains and business models to become more resilient to the impacts of climate change (adaptation) and other systemic shocks.
Source: Carbon Trust
Sector% saving on annual
energy spendpayback on capex
(years)
Manufacturing 41% 1.6
Electronics 23% 3.5
Engineering 37% 3.7
Transport 48% 2
Waste 21% 1.4
Average 34% 2.6
6Supply Chain Transformation and Resource Efficiency
10 Carbon Trust, Climate change – a business revolution? 2008. http://bit.ly/203iuNK
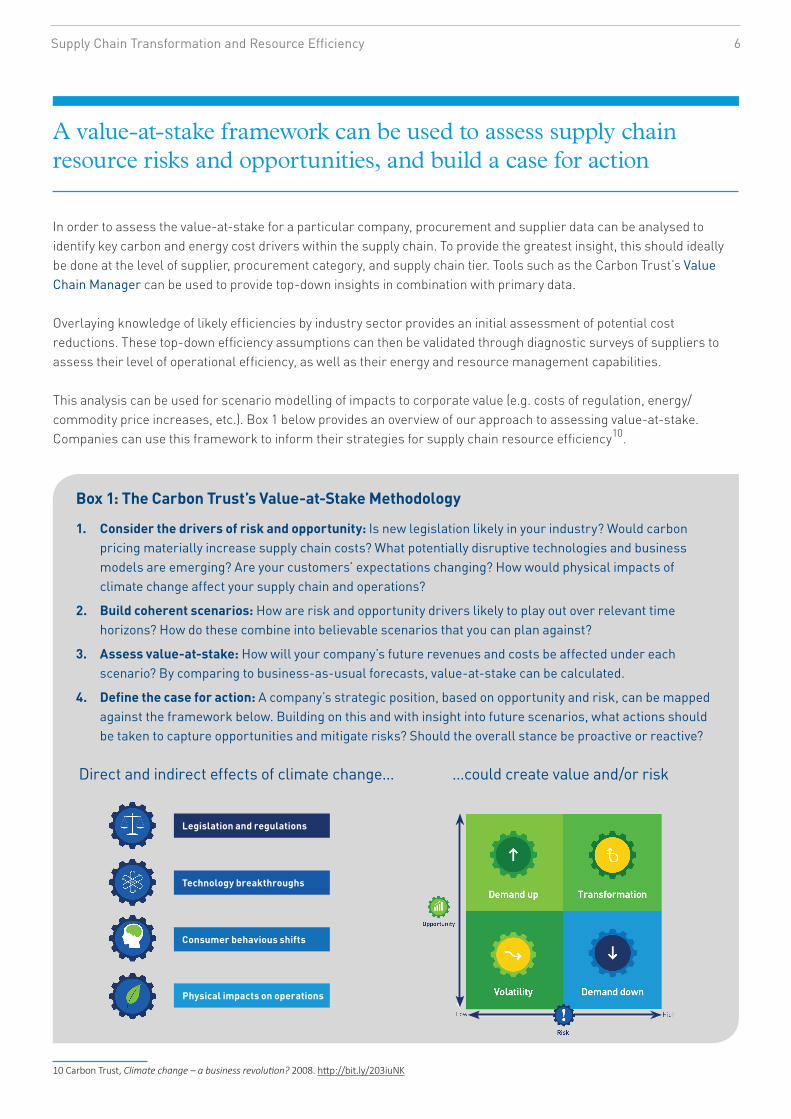
1. Consider the drivers of risk and opportunity: Is new legislation likely in your industry? Would carbon pricing materially increase supply chain costs? What potentially disruptive technologies and business models are emerging? Are your customers’ expectations changing? How would physical impacts of climate change affect your supply chain and operations?
2. Build coherent scenarios: How are risk and opportunity drivers likely to play out over relevant time horizons? How do these combine into believable scenarios that you can plan against?
3. assess value-at-stake: How will your company’s future revenues and costs be affected under each scenario? By comparing to business-as-usual forecasts, value-at-stake can be calculated.
4. define the case for action: A company’s strategic position, based on opportunity and risk, can be mapped against the framework below. Building on this and with insight into future scenarios, what actions should be taken to capture opportunities and mitigate risks? Should the overall stance be proactive or reactive?
Box 1: The Carbon Trust’s Value-at-Stake methodology
...could create value and/or riskDirect and indirect effects of climate change...
legislation and regulations
Technology breakthroughs
Consumer behavious shifts
physical impacts on operations
A value-at-stake framework can be used to assess supply chain resource risks and opportunities, and build a case for action
In order to assess the value-at-stake for a particular company, procurement and supplier data can be analysed to identify key carbon and energy cost drivers within the supply chain. To provide the greatest insight, this should ideally be done at the level of supplier, procurement category, and supply chain tier. Tools such as the Carbon Trust’s Value Chain Manager can be used to provide top-down insights in combination with primary data. Overlaying knowledge of likely efficiencies by industry sector provides an initial assessment of potential cost reductions. These top-down efficiency assumptions can then be validated through diagnostic surveys of suppliers to assess their level of operational efficiency, as well as their energy and resource management capabilities. This analysis can be used for scenario modelling of impacts to corporate value (e.g. costs of regulation, energy/commodity price increases, etc.). Box 1 below provides an overview of our approach to assessing value-at-stake. Companies can use this framework to inform their strategies for supply chain resource efficiency10.
7Supply Chain Transformation and Resource Efficiency
Resource efficiency can be addressed through both supply chain engagement and product offering redesign
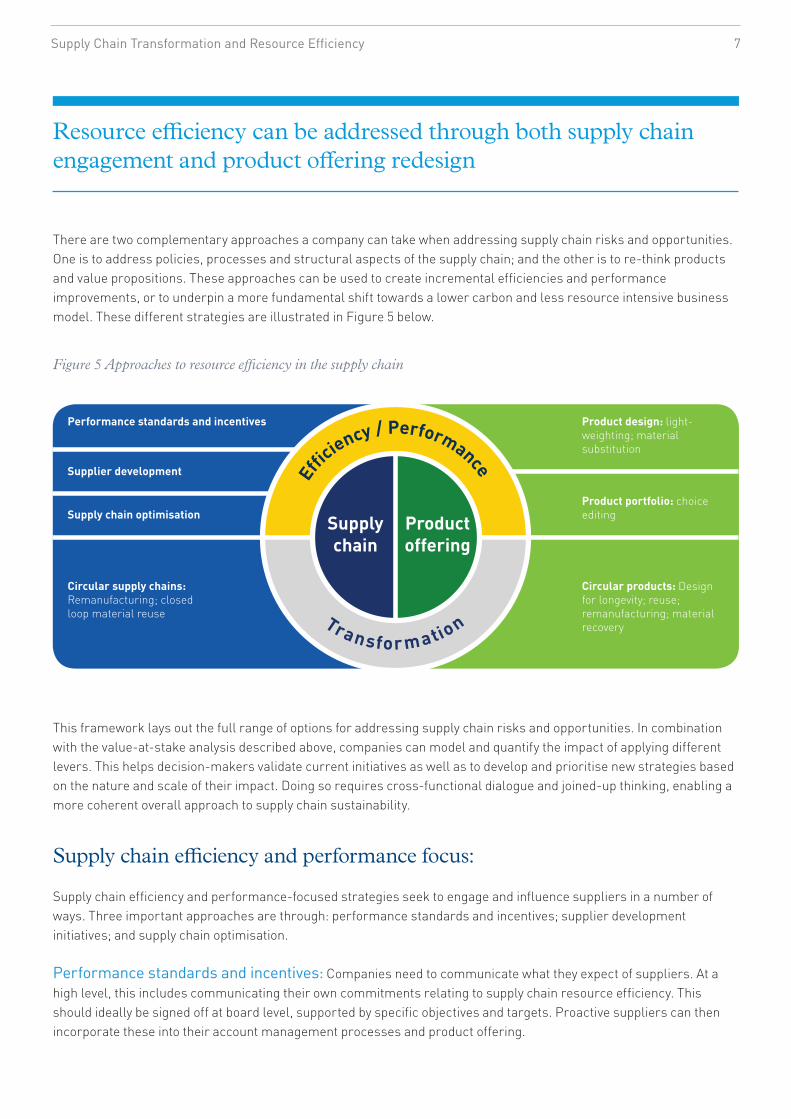
There are two complementary approaches a company can take when addressing supply chain risks and opportunities. One is to address policies, processes and structural aspects of the supply chain; and the other is to re-think products and value propositions. These approaches can be used to create incremental efficiencies and performance improvements, or to underpin a more fundamental shift towards a lower carbon and less resource intensive business model. These different strategies are illustrated in Figure 5 below.
Figure 5 Approaches to resource efficiency in the supply chain
This framework lays out the full range of options for addressing supply chain risks and opportunities. In combination with the value-at-stake analysis described above, companies can model and quantify the impact of applying different levers. This helps decision-makers validate current initiatives as well as to develop and prioritise new strategies based on the nature and scale of their impact. Doing so requires cross-functional dialogue and joined-up thinking, enabling a more coherent overall approach to supply chain sustainability.
Supply chain efficiency and performance focus: Supply chain efficiency and performance-focused strategies seek to engage and influence suppliers in a number of ways. Three important approaches are through: performance standards and incentives; supplier development initiatives; and supply chain optimisation. Performance standards and incentives: Companies need to communicate what they expect of suppliers. At a high level, this includes communicating their own commitments relating to supply chain resource efficiency. This should ideally be signed off at board level, supported by specific objectives and targets. Proactive suppliers can then incorporate these into their account management processes and product offering.
productoffering
Supplychain
efficiency / performance
Transfor m ation
performance standards and incentives product design: light-weighting; material substitution
product portfolio: choice editing
Circular products: Design for longevity; reuse; remanufacturing; material recovery
Supplier development
Supply chain optimisation
Circular supply chains: Remanufacturing; closed loop material reuse

8Supply Chain Transformation and Resource Efficiency
To drive action, specific criteria and requirements should be defined and communicated. At a minimum, this should include requiring suppliers to demonstrate that they measure and take steps to manage energy consumption and carbon emissions, as well as other relevant areas such as water and waste. Commitments, targets, and achieving actual reductions provide a complete set of supplier performance requirements, as illustrated by M&S’ Plan A supplier assessment framework (Box 2).
M&S has developed a bespoke supplier scorecard and approach to evaluation which is aligned with its Plan A strategy and objectives. Based on their performance against defined criteria, suppliers are rated as Gold, Silver, or Bronze. M&S has used this framework to incentivise energy and environmental improvement in suppliers. For example, the company set itself the target to source a quarter of its food products from suppliers that have achieved at least 20% improvement in energy efficiency. This approach has been embedded within M&S procurement processes as part of supplier quality benchmarking.
Box 2: m&S plan a supplier assessment
Evaluation of supplier performance against these criteria can be done through a scorecard and can be incorporated into existing procurement processes. A number of information sources can feed into this scorecard. For example, the Carbon Trust Standard for carbon, water and waste provides independent verification and certification that suppliers adopt the full measure-manage-reduce approach, and actually achieve performance improvement. Supplier reporting of resource consumption and footprint data can be done via a number of existing platforms (for example cr360, Ecodesk, EcoVadis, Sedex) which provide analytical functionality. The CDP supply chain programme is also used by several companies to request comprehensive supplier information on sustainability performance.
In addition to performance standards, suppliers need to feel sufficiently incentivised to take action and that achieving these sustainability expectations are important for the long-term business relationship. For example, buyers can include this as a differentiator or tie-breaker between competing suppliers or as a hard qualification requirement. At a minimum, discussion of resource efficiency performance should be included within formal supplier performance reviews. Supplier development: In addition to incentivising improvement through procurement processes, companies can actively engage and collaborate with suppliers to help them address the 20-40% energy cost savings we have seen are often achievable. A targeted engagement approach can help suppliers address some of the key barriers to action including: lack of knowledge, resources, and financing. To address knowledge gaps, companies can facilitate sharing of best practice among suppliers through managed online or face-to-face forums. An example is global pharmaceuticals company GSK’s Supplier Exchange (see Box 3).
GSK spends over £2bn annually on materials, which drives over 40% of its value chain carbon footprint. GSK’s long term goal is to be carbon neutral across its value chain by 2050.
In looking at energy and carbon within its supply chain, GSK established that 65% of suppliers did not have an active programme in place to reduce energy costs. The supply base was also very fragmented, with no single supplier having more than a 1% impact on the company’s supply chain carbon footprint.
In order to drive engagement at scale, GSK set up an online exchange for suppliers to share best practice on energy efficiency and reducing environmental impacts. More than 500 suppliers have joined the network, which is expected to enable value chain emissions to be cut by 25% by 2020.
In addition to the exchange, GSK has also run energy reduction workshops at supplier sites, identifying opportunities to save 20-30% of energy costs.
Box 3: GSK Supplier exchange

9Supply Chain Transformation and Resource Efficiency
Product offering focus
A complementary strategy to supply chain-oriented approaches is to design out aspects of the value proposition that drive supply chain risks and cost. This can be done by changing product design or use of materials; or adjusting the product portfolio. Product design: The value-at-stake analysis described above can identify specific input materials that contribute to supply chain energy and carbon intensity across a company’s procurement bill. Options can then be explored to mitigate or eliminate these risks and impacts. These include: reducing material usage through leaner product design or ingredient formulation; substituting for sustainable alternative materials; or using recycled materials and finding pathways towards closed loop material re-use. Learning from these insights, companies can take a proactive approach by incorporating carbon and environmental lifecycle analysis within the new product design process (see Box 4 illustrating how Coca-Cola approached this). Product portfolio: Where design cannot effectively mitigate impact, companies may consider changing their portfolio or product range. This is feasible if there is a strong commercial rationale or positive brand impact associated with doing so. At corporate strategy level, supply chain risk as well as market demand may factor into decisions to acquire or divest business units.
Conducting site energy audits is an important way of identifying energy efficiency opportunities within suppliers. The cost of a high-quality site audit with tangible recommendations is typically less than £5k for a manufacturing site, which is within reach of most suppliers. If funding for audits is an issue, companies can support suppliers by connecting them with sources of funding, such as government grant schemes. In some cases, companies have paid for supplier audits as part of a benefit sharing arrangement. To facilitate this process, an expert diagnostic can be used to identify whether there is a case for a more in-depth site visit, and relevant case studies can illustrate benefits. Where financing capex investment and implementation is a barrier for suppliers, a number of solutions are available. In the first instance, a commercial agreement between buyer and supplier can be reached to make investment and payback attractive. For example, bundling efficiency commitments into a longer-term sourcing contract. If external financing is required, this can be done through equipment vendor financing or third party financing. The Carbon Trust’s Green Business Directory includes suppliers that can offer equipment financing, and energy efficiency financing options can also provide low-cost solutions. Supply chain optimisation: A sustainability-focused approach to lean manufacturing and supply chain management looks at optimising the entire value chain to reduce resource waste and carbon emissions. This requires mapping and allocating resource consumption and waste across the value chain. The combined impact of decisions and improvements can then be assessed (including sales forecasting; inventory policies; logistics; etc.) to make value chain planning more resource efficient. A sustainability lens can be applied to a company’s value chain strategy in order to incorporate strategic resource considerations into financial modelling. For example, decisions on supply chain configuration and sourcing need to take into consideration transport energy costs as well as resource and environment-related risks.

10Supply Chain Transformation and Resource Efficiency
Transformative approaches to supply chain resource efficiency
Step changes in supply chain resource efficiency can be achieved by addressing elements of a company’s business model. In this case, both the supply chain and product-focused approaches tend to work hand-in-hand. Circular supply chain models: Most manufacturing value chains are linear, starting with upstream materials extraction and ending with use and disposal of products. On the other hand, circular models seek to preserve and maximise the value of products or materials at end-of-life, and re-introduce them back into the value chain. This can enable significant savings in cost, carbon and resources. For example remanufacturing – taking an end-of-life part or product and returning it to like-new or better performance, with warranty to match – can be a commercially viable option for companies that manufacture relatively high-value items. This is illustrated in Figure 6.
Coca-Cola Enterprises worked with the Carbon Trust to measure the carbon footprint of its most popular drinks. This included looking at every aspect of a drink’s lifecycle, from transporting raw ingredients to disposing of empty bottles and cans.
The work had a considerable impact in helping Coca-Cola Enterprises take action to make its business more sustainable. In particular, the work helped to identify carbon reduction opportunities across the full product lifecycle – including the manufacturing of packaging, distribution and chilling of products, as well as the consumer use and disposal of the package.
The work highlighted that:
• Packaging is responsible for between 30-70% of a soft drink’s carbon footprint.
• The carbon footprint of soft drinks can be reduced by using more recycled content in primary packaging and by reducing the weight of primary packaging.
• Recycling a bottle or can will reduce the carbon footprint of the individual product by up to 40% and make a major difference to the environmental footprint of the product.
Box 4: Coca-Cola, a recipe for low carbon products

11Supply Chain Transformation and Resource Efficiency
Figure 6 Moving from linear to circular resource use
linear supply chain (take-make-waste)
remanufacturing
Closed loop
Materials extraction & production
Component manufacture
Final product manufacture
Use & consumption Disposal
1
2

12Supply Chain Transformation and Resource Efficiency
Figure 7 Value of remanufacturing
Source: Carbon Trust
margin Additional margin potential
return depositmaterials + non-labour inputs
new product
remanufacturing price flexibility
pri
ce /
cos
t
remanufactured product
labour + overhead
Circular products: Product and service design are key to supporting circular business models. Taking the remanufacturing example above, the cost structure of remanufactured products is underpinned by making products easy to remanufacture. This includes servicing and maintenance during the product’s lifetime, so that it reaches end of life in sufficiently good condition to make it economically and technically viable to remanufacture (as opposed scrapping to recover the materials). This minimises the material and non-labour inputs used for remanufacturing, as illustrated in the cost structure above. The labour costs of remanufacturing can also be reduced by designing products to be easily disassembled and reconditioned during the remanufacturing process. Thinking circular at the product design stage can also open up new opportunities for resource efficiency within a business model. For example incorporating materials that have readily available recycled sources in the market, rather than having to continuously rely only on virgin material. This provides companies with greater flexibility when commodity prices rise.
The cost of remanufacturing a product is generally 40% to 65% less than making a new product (illustrated in Figure 7). This in turn allows for a market re-sell price that is typically between 30% and 40% lower than that of a new product10 11. The environmental benefits are equally compelling: remanufacturing typically uses 85% less energy than manufacturing, with corresponding carbon emission savings. The remanufacturing model can enable companies to either reap higher margins when remanufactured products are sold at the same price point as a new product; or to profitably sell into more price sensitive market segments.
10 Carbon Trust et al., Supporting Excellence in UK remanufacturing, 2014. http://bit.ly/1lPE760 11 Remanufacturing business models need to incentivise the return of products or components (referred to as ‘core’) at end-of-life. These take-back systems typically include a deposit which is paid out on return of core, or rolled into the price of a new product (thereby encouraging an ongoing customer relationship). Even when including deposits, the remanufacturing cost structure can still be advantageous.
13Supply Chain Transformation and Resource Efficiency
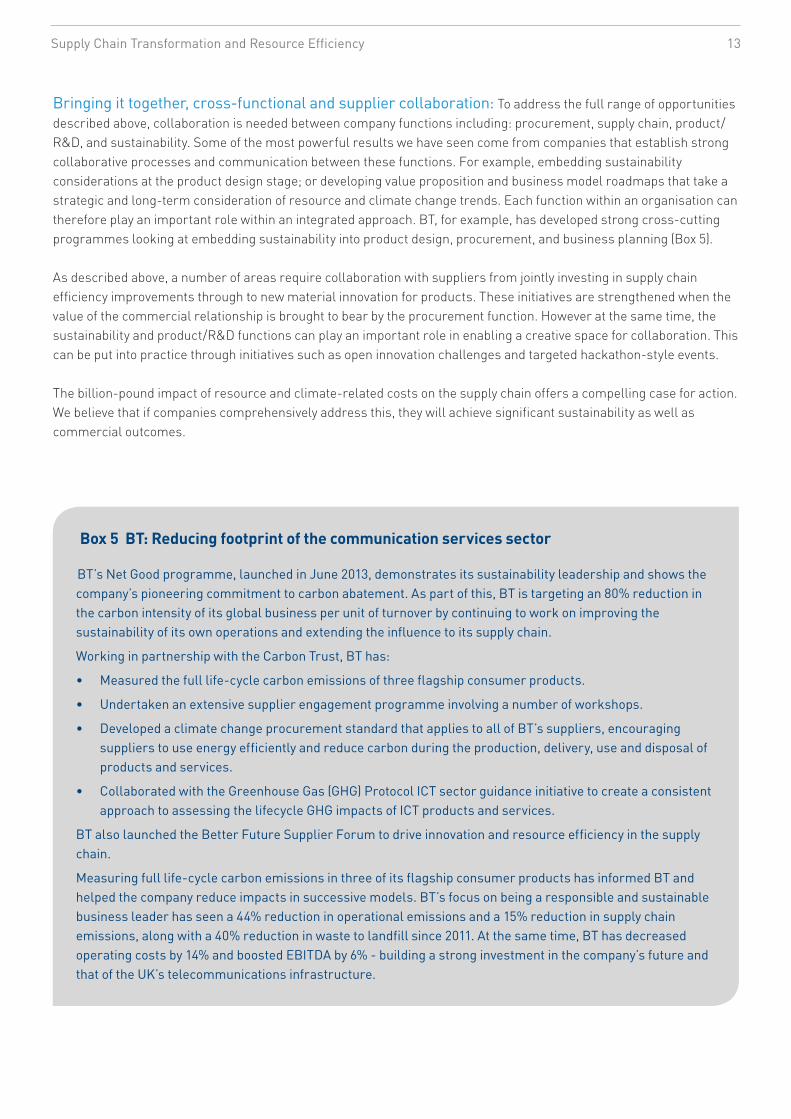
Bringing it together, cross-functional and supplier collaboration: To address the full range of opportunities described above, collaboration is needed between company functions including: procurement, supply chain, product/R&D, and sustainability. Some of the most powerful results we have seen come from companies that establish strong collaborative processes and communication between these functions. For example, embedding sustainability considerations at the product design stage; or developing value proposition and business model roadmaps that take a strategic and long-term consideration of resource and climate change trends. Each function within an organisation can therefore play an important role within an integrated approach. BT, for example, has developed strong cross-cutting programmes looking at embedding sustainability into product design, procurement, and business planning (Box 5). As described above, a number of areas require collaboration with suppliers from jointly investing in supply chain efficiency improvements through to new material innovation for products. These initiatives are strengthened when the value of the commercial relationship is brought to bear by the procurement function. However at the same time, the sustainability and product/R&D functions can play an important role in enabling a creative space for collaboration. This can be put into practice through initiatives such as open innovation challenges and targeted hackathon-style events. The billion-pound impact of resource and climate-related costs on the supply chain offers a compelling case for action. We believe that if companies comprehensively address this, they will achieve significant sustainability as well as commercial outcomes.
BT’s Net Good programme, launched in June 2013, demonstrates its sustainability leadership and shows the company’s pioneering commitment to carbon abatement. As part of this, BT is targeting an 80% reduction in the carbon intensity of its global business per unit of turnover by continuing to work on improving the sustainability of its own operations and extending the influence to its supply chain.
Working in partnership with the Carbon Trust, BT has:
• Measured the full life-cycle carbon emissions of three flagship consumer products.
• Undertaken an extensive supplier engagement programme involving a number of workshops.
• Developed a climate change procurement standard that applies to all of BT’s suppliers, encouraging suppliers to use energy efficiently and reduce carbon during the production, delivery, use and disposal of products and services.
• Collaborated with the Greenhouse Gas (GHG) Protocol ICT sector guidance initiative to create a consistent approach to assessing the lifecycle GHG impacts of ICT products and services.
BT also launched the Better Future Supplier Forum to drive innovation and resource efficiency in the supply chain.
Measuring full life-cycle carbon emissions in three of its flagship consumer products has informed BT and helped the company reduce impacts in successive models. BT’s focus on being a responsible and sustainable business leader has seen a 44% reduction in operational emissions and a 15% reduction in supply chain emissions, along with a 40% reduction in waste to landfill since 2011. At the same time, BT has decreased operating costs by 14% and boosted EBITDA by 6% - building a strong investment in the company’s future and that of the UK’s telecommunications infrastructure.
Box 5 BT: reducing footprint of the communication services sector

14Supply Chain Transformation and Resource Efficiency
Carbon Trust services
advisory
Supply chain
Business model innovation
Corporate sustainability strategy
Supply chain carbon footprinting
Value Chain Manager
energy efficiency implementation and financing
Green business directory
Energy efficiency financing
Certification
Carbon Trust Standard (Carbon, Water, Waste)
Carbon Trust Standard for Supply Chain
Carbon Trust publications
Titans or Titanics? Understanding the business response to climate change and resource scarcity
Climate change – a business revolution?
Supporting Excellence in UK Remanufacturing

Whilst reasonable steps have been taken to ensure that the information contained within this publication is correct, the authors, the Carbon Trust, its agents, contractors and sub-contractors give no warranty and make no representation as to its accuracy and accept no liability for any errors or omissions. Any trademarks, service marks or logos used in this publication, and copyright in it, are the property of the Carbon Trust. Nothing in this publication shall be construed as granting any licence or right to use or reproduce any of the trademarks, service marks, logos, copyright or any proprietary information in any way without the Carbon Trust’s prior written permission. The Carbon Trust enforces infringements of its intellectual property rights to the full extent permitted by law.
The Carbon Trust is a company limited by guarantee and registered in England and Wales under company number 4190230 with its registered office at 4th Floor, Dorset House, Stamford Street, London SE1 9NT.
Published in the UK: April 2016
© The Carbon Trust 2016. All rights reserved. CTC861
The Carbon Trust is an independent company with a mission to accelerate the move to a sustainable, low carbon economy.
The Carbon Trust:
• Advises businesses, governments and the public sector on opportunities in a sustainable, low carbon world.
• Measures and certifies the environmental footprint of organisations, products and services.
• Helps develop and deploy low carbon technologies and solutions, from energy efficiency to renewable power.
www.carbontrust.com +44 (0)20 7170 7000
Contact
Aleyn Smith-Gillespie, Associate [email protected]
Hugh Jones, Managing Director - [email protected]
General enquiries +44 (0)20 7170 7000


